STATISTICS IN FOCUS. Transport infrastructure and road safety: stark contrasts between Member States of the European Union
|
|
|
- Paulina Austin
- 6 years ago
- Views:
Transcription
. The figures include only those NUTS 2 regions of the Community for which data are available.")
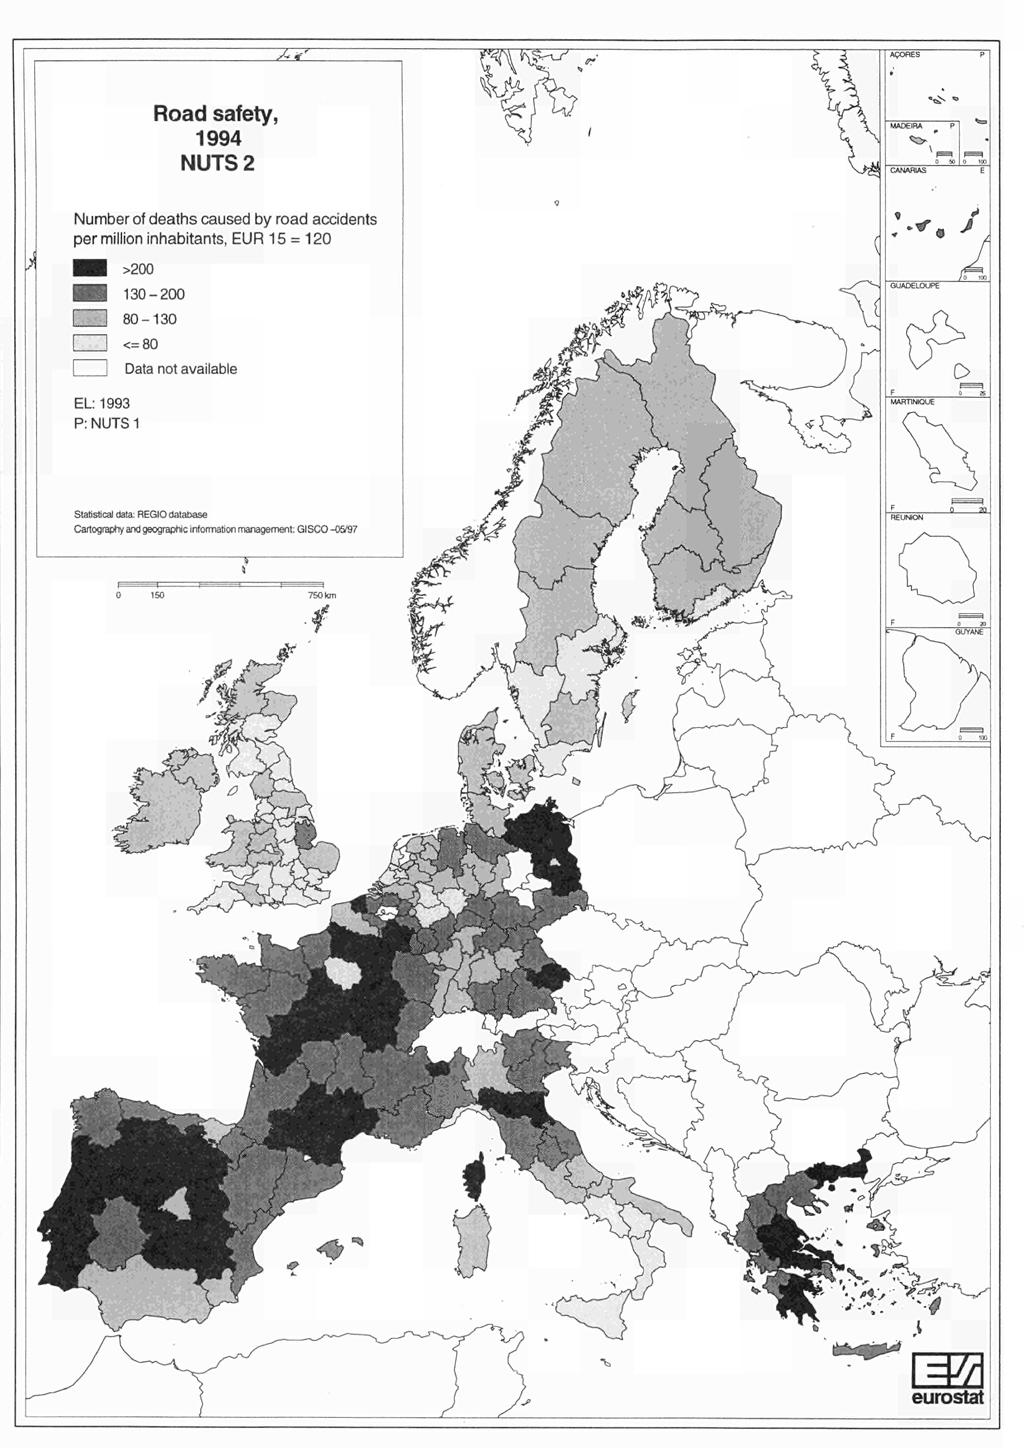
1 * + * Ξi/L eurostat 1997 D 2 STATISTICS IN FOCUS Regions ISSN Transport infrastructure and safety: stark contrasts between Member States of the European Union The observations below refer to 1994 (unless otherwise stated in the tables). The figures include only those NUTS 2 regions of the Community for which data are available. Since changes from one year to the next are minimal, the total figures for EUR 15 are based on the results for the latest year available for each Member State. The territorial distributions of both and rail infrastructure reveal wide disparities between regions of the European Union. Road safety statistics also show appreciable differences. Road infrastructure: France has the longest network; Belgium has the densest Road networks are of vital importance, since they represent the main mode of both passenger and freight transport within the European Union. France has the biggest network in terms of kilometres. It is followed by Germany, which also has the most extensive motorway network. In terms of density (length divided by area), Belgium's network is top of the list with 4.67 km of per square kilometre (Figure 1). Apart from urban regions such as Brussels, Greater London and Vienna, the densest networks are to be found in the West Midlands county (7.66 km/km 2 ) and Merseyside (6.54), followed by Brabant Wallon (Β) and Vlaams Brabant (Β) at 6.51 et 5.59 respectively. At the opposite extreme are regions in the far north of Sweden and Finland, followed by Anatoliki Makedonia, Thraki (EL), Aragon (ES) and Extremadura (ES). Rhône Alpes (FR) has the longest motorway network (1 76 km), followed by Piemonte (I, 749 km) and Provence Alpes Côtes d'azur (F, 74 km). At Member State level, the densest infrastructure (Belgium) is 19 time greater than the least dense (Sweden). Leaving aside regions in the far north, where climatic conditions are extreme and populations sparse, the contrast between regions is even greater, with the greatest density 38 times greater than the lowest density (Anatoliki Makedonia, Thraki EL at,2, West Midlands county UK at 7.66). Figure 1 Road network density (km/km 2 ) L 'm NL AT PT SF SE UK Manuscript completed on = For further information please contact: N.Mavraganis Eurostat, L 292 Luxembourg, tel Fax: Price (excl. VAT) in Luxembourg: Subscription 'Statistics in focus' of all themes: ECU 31 Single copy: ECU 6 Catalogue number: CA NI 97 2 EN C
2 Rail network: Saarland and Saxony in the lead The European Union hasa rail network with a total length of almost 159 km - an average of.5 km of rail track per square kilometre. The highest network density (cf. Figure 2) is in Germany (.12 km per km 2 ), followed by Belgium and Luxembourg (both at.11). The lowest densities are in Greece, Spain and Finland (all three at.2). At regional level, apart from urban regions, Saarland, Saxony and Nordrhein-Westfalen have the densest rail networks (at.22,.17 and.16 km of rail per km 2 respectively). The worst-served region (except for those in the extreme north) is Ditiki Makedonia (EL) at.1 km per km 2. Eight of the 15 NUTS 2 regions in Spain with a rail network are amongst those with the lowest densities, at.2. With notable exceptions such as the Italian islands of Sardinia and Sicily, most island regions have no rail network at all. Road safety: users are safest in the United Kingdom The number of deaths due to accidents is an indicator which reveals much about the quality of a network. Comparisons between Member States and regions have to be based on numbers of deaths per head of population - usually per million inhabitants. At European Union level, almost 45 deaths, or 12 per million inhabitants, were caused by accidents in The United Kingdom has the lowest rate of deaths (66), followed by Sweden (67), the Netherlands (85), Finland (95) and Denmark (15) (Figure 3). The most dangerous networks are to be found in Portugal and the Grand-Duchy of Luxembourg, with 199 and 19 deaths per million inhabitants each year. Where regions are concerned, the safest are urban regions such as Stockholm, Hamburg and Brussels, with 3,32 and 4 deaths respectively per million inhabitants. The Belgian province of Luxembourg saw the greatest carnage in 1994 (37 deaths per million), followed by Brandenburg (D, 316), Namur (B, 299), Mecklenburg- Vorpommern (D, 29) and Corsica (F, 244) - all figures well above the Community average. Figure 2 Rail network density (km/km 2 ) Figure 3 Number of deaths caused by accidents per million inhabitants L NL AT PT SF SE UK
3 Table 1 Transport infrastructure and safety l=m eurostat Road total: (ï) motorway (2) INFRASTRUCTURE Network length, im km (1994) Rail: total of which : double track or more electrified lines NETWORK DENSITY km/km^ km/km 2 ROAD SAFETY, 1994 number of deaths caused by accidents'" / mio nhab EUR BELGIQUE BELGIE BRABANT (94) REG. BRUXELLES CAP./BRUS VLAAMS GEWEST Antwerpen Limburg (Β) Oost-Vlaanderen Vlaams Brabant West-Vlaanderen REGION WALLONNE Brabant Wallon Haìnaut Liege Luxembourg (Β) Namur ? DANMARK DEUTSCHLAND BADEN WÜRTTEMBERG Stuttgart Karlsruhe Freiburg Tübingen BAYERN Oberbayem Niederbayern Oberpfalz Oberfranken Mittelfranken Unterfranken Schwaben BERLIN BRANDENBURG BREMEN HAMBURG HESSEN Darmstadt Gießen Kassel MECKLENBURG VORPOMMERN NIEDERSACHSEN Braunschweig Hannover Lüneburg Weser-Ems NORDRHEIN WESTFALEN Düsseldorf Köln Münster Detmold Arnsberg RHEINLAND PFALZ Koblenz Trier Rheinhessen-Pfalz SAARLAND SACHSEN SACHSEN ANHALT Dessau Halle Magdeburg SCHLESWIG HOLSTEIN THÜRINGEN á 19S 44E E 95C E S.1: Rfi
4 Table 1 Transport infrastructure and safety = r eurostat RoarJ total: 11) motorway (2) INFRASTRUCTURE NetworK ie Rail: total double track or more electrified lines NETWORK DENSITY km/km 2 km/km! ROAD SAFETY, 1994 number of deaths caused by accidents''" / mio nhab. ELLADA VOREIA ELLADA Anatoliki Makedonia, Thraki Kentriki Makedonia Dytiki Makedonia Thessaiia KENTRIKI ELLADA Ipeiros Ionia Nisiä Dytiki E/lada Sterea Ellada Peloponnisos ATTIKI NISIÄ AIGAIOU, KRITI Voreio Aigaio Notio Aigaio Kriti E c S C C.3E : : ESPANA NOROESTE Galicia Asturias Cantabria NORESTE Pais Vasco Navarra Rioja Aragon MADRID CENTRO (E) Castilla - Leon Castilla - La Mancha Extremadura ESTE Cataluña Comunidad Valenciana Baleares SUR Andalucía Murcia Ceuta y Melitta CANARIAS E C E 6C E FRANCE ILEDE FRANCE BASSIN PARISIEN Champagne-Ardenne Picardie Haute-Normandie Centre Basse-Normandie Bourgogne NORD - PAS-DE-CALAIS EST Lorraine Alsace Franche-Comté OUEST Pays de la Loire Bretagne Poitou-Cha ren te s SUD-OUEST Aquitaine Midi-Pyrénées Limousin CENTRE-EST Rhône-Alpes Auverg ooo
5 Table 1 Transport infrastructure and safety INFRASTRUCTURE NETWORK DENSITY ROAD SAFETY, 1994 \4/Λ eurostat Road total: (D motorway (2) Rail: total double track or more electrified lines km/km' km/km' number of deaths caused by accldents IJ) /mio inhab. MEDITERRANEE Languedoc-Roussillon Provence-Alpes-Côte d'azur Corse DÉPARTEMENTS D'OUTRE MER Guadeloupe Martinique Guyane Réunion ITALIA NORD OVEST Piemonte Valle d'aosta Liguria LOMBARDIA NORD EST Trentino-Alto Adige Veneto Friuli-Venezia Giulia EMILIA ROMAGNA CENTRO (I) Toscana Umbria Marche LAZIO ABRUZZO MOLISE Abruzzo Molise CAMPANIA SUD Puglia Basilicata Calabria SICILIA SARDEGNA «3 51, 18 LUXEMBOURG (GRAND DUCHE) NEDERLAND NOORD NEDERLAND Groningen Friesland Drenthe OOST NEDERLAND Overijssel Gelderland Flevoland WEST NEDERLAND Utrecht Noord-Holland Zuid-Holland Zeeland ZUID NEDERLAND Noord-Brabant Limburg (NL) ιοi ÖSTERREICH OSTÖSTERREICH Burgenland Niederösterreich Wien SÜDÖSTERREICH Kärnten Steiermark
6 Table 1 Transport infrastructure and safety Id/H I / I eurostat Road total: <D motorway (2) INFRASTRUCTURE Network length, im km (1994) Rail: total of which double track or more electrified lines NETWORK DENSITY km/km! km/km 2 ROAD SAFETY, 1994 number of deaths caused by accidents' 3 ' / mio inhab. WESTÖSTERREICH Oberösterreich Salzburg Tirol Vorarlberg PORTUGAL CONTINENTE Norte Centro (Ρ) Lisboa e Vale do Tejo Alentejo Algarve ACORES MADEIRA SUOMI/FINLAND MANNER SUOMI Uusimaa Etelä-Suomi Itã-Suomi Väli-Suomi Pohjois-Suomi AHVENANMAA/ALAND SVERIGE Stockholm Oestra Mellansverige Smaaland Med Oearna Sydsverige Vaestsverige Norra Mellansverige Mellersta Norrland Oevre Norrland A UNITED KINGDOM NORTH Cleveland. Durham Cumbria Northumberland, Tyne and Wear YORKSHIRE AND HUMBERSIDE Humberside North Yorkshire South Yorkshire West Yorkshire EAST MIDLANDS Derbyshire, Nottinghamshire Leles., Northamptonshire Lincolnshire EAST ANGLIA SOUTH EAST (UK) Bedfordshire, Hertfordshire Berks., Bucks.. Oxfordshire Surrey, East-West Sussex Essex Greater London Hampshire, Isle of Wight Kent SOUTH WEST (UK) Avon, Gloucs., Wiltshire Cornwall, Devon Dorset, Somerset WEST MIDLANDS Hereford-Worcs., Warwicks. Shropshire. Staffordshire West midlands (County) C C 72.E 26.C 16.C 1.E Í C 22.E Í 243.E / 1 58." ' 125.Í 166.: 295.; 24.; 1 37.! 53.' Í ) : ) E E : 51 : : 78 : 45 : 91 : 72 : 95 : 13 : 45
7 Table 1 Transport infrastructure and safety l=l/h eurostat Road total: motorway INFRASTRUCTURE Network length, m km (1994) Rail: total double track electrified NETWORK DENSITY km/km! km/km 2 ROAD SAFETY, 1994 number of deaths caused (1) (2) or more nes by accidents 131 / mio inhab. NORTH WEST (UK) Cheshire Greater Manchester Lancashire Merseyside WALES Clwyd, Dyfed, Gwynedd, Powys Gwent, Mid-S-W Glamorgan SCOTLAND Bord. -Centr. -Fife-Loth. - Tay. Dumfr. - Galloway, Strathclyde Highlands, Islands Grampian NORTHERN IRELAND 'B, P, SF:93 1 B: 93, E: 92 1 EL: 93
8

9 Density of the railway network, 1994 NUTS 2 MADEIRA Ρ 5 1 Á km of railway per km 2 EUR 15 =.5 >.2 D: NUTS <=.3 Data not available >^ * GUADELOUPE O Statistical data: REGIO database Cartography and geographic information management: GISCO 4/97 Ι ι h <
10
11
12 Methodological notes and sources Motorway: a specifically designed and constructed for motor traffic. It does not serve residential properties. All motorways have dual (separate) carriageways in the two directions of traffic flow (except in the event of works using contraflow systems). A motorway has no level Intersections with s, railways or other thoroughfares. It is always identified as a motorway by signs and is restricted to certain categories of motorised vehicle. Rail: railway track in current use by normal public rail traffic. Deaths caused by accidents: these cover all categories of victim (pedestrians, cyclists, motorcyclists, car drivers and passengers etc.) NUTS: Nomenclature of Territorial Statistical Units. The nomenclature in current use subdivides the territory of the EU into 77 regions at NUTS Level 1, 26 at NUTS Level 2 and 131 at NUTS Level 3, each NUTS level being a grouping of regions at the level below. " : "= data not available. Publications : - Regions: statistical yearbook; - Transport: annual statistics Source: REGIO REGIO : apart from the indicators presented here, the REGIO databank contains other series of regional indicators on regional transport (passenger and goods flows by mode of transport etc.), plus other statistical domains (demography, agriculture, employment, unemployment, economic accounts, energy, research and development, etc.). Further information is available from: Nicolas Mavraganis Eurostat, Directorate E, Unit E4 - Regional accounts and indicators, population and geographical information system J MO C3/74 Tel.: 352/ Fax: 352/ Nicolas.Mavraganis@eurostat.cec.be
RAPID REPORTS. Per capita GDP in the regions of the European Union
 û eurostat RAPID REPORTS Regions 19 D 1 ISSN 1013-0535 Per capita in the regions of the European Union The regional for was calculated including the new German Länder, which were part of the Community
EQI /202 GDP per head (PPS)
") Baden-Württemberg DE1 72.8 38/202 EU-28=100 142.9 21/202 QUALITY PILLAR 83.2 17/202 IMPARTIALITY PILLAR 72.9 55/202 CORRUPTIO PILLAR 71.0 44/202 Peer Regions: Helsinki-Uusimaa, Groningen, Hessen, Bayern,
Baden-Württemberg DE1 72.8 38/202 EU-28=100 142.9 21/202 QUALITY PILLAR 83.2 17/202 IMPARTIALITY PILLAR 72.9 55/202 CORRUPTIO PILLAR 71.0 44/202 Peer Regions: Helsinki-Uusimaa, Groningen, Hessen, Bayern,
ABPorts: Research on EU control of ports
 ABPorts: Research on EU control of ports METHODOLOGY NOTE ComRes interviewed 4,506 adults online in Britain, France, Poland, Germany, Spain and Italy between 19 th and 26 th February 2016. Data were weighted
in focus Statistics Regional tourism in the European Union Contents Main features INDUSTRY, TRADE AND SERVICES
 Regional tourism in the European Union Statistics in focus INDUSTRY, TRADE AND SERVICES POPULATION AND SOCIAL CONDITIONS 27/2006 Author Ulrich SPÖREL Contents Main features... 1 Coastal regions account
11 Tourism. Introduction. Main statistical findings. Tourism in the EU-27: trends and facts. Number of overnight stays
 Tourism 11 Tourism Introduction This chapter presents the regional pattern of tourism in the European Union in 2009. It mainly tracks tourism occupancy in tourist accommodation establishments. The tourism
6.2. INVENTAIRE DES SUPERFICIES VITICOLES (Ha)
") 6.2. INVENTAIRE DES SUPERFICIES VITICOLES (Ha) July 20xx 2001 2002 2003 2004 2005 2006 2007 2008 2009 2010 2011 2012 2013 2014 2015 2016 2017 BG:BULGARIA 135 760 104 335 97 935 75 591 68 847 60 328 60
6.2. INVENTAIRE DES SUPERFICIES VITICOLES (Ha) July 20xx 2001 2002 2003 2004 2005 2006 2007 2008 2009 2010 2011 2012 2013 2014 2015 2016 2017 BG:BULGARIA 135 760 104 335 97 935 75 591 68 847 60 328 60
ENGLISH. Lombardia in Europe REGIONAL STATISTICAL YEARBOOK
 WWW.ASR-LOMBARDIA.IT ENGLISH Lombardia in Europe REGIONAL STATISTICAL YEARBOOK 2O11 Director-General Antonio Vincenzo Lentini Technical and Scientific Committee Rosalia Coniglio, Antonio Vincenzo Lentini,
ANNEX II ADRIATIC-IONIAN. Anatoliki Makedonia, Thraki Kentriki Makedonia Dytiki Makedonia. Ionia Nisia Dytiki Ellada Sterea Ellada Peloponnisos
 ANNEX II List of areas and of NUTS level II regions eligible for funding from the European Regional Development Fund under the transnational component of the European territorial cooperation goal for the
Eurostat regional yearbook 2011 Regional diversity of the EU illustrated through maps and figures
 STAT/11/182 9 December 2011 Eurostat regional yearbook 2011 Regional diversity of the EU illustrated through maps and figures Which EU regions are the most built up and which are the least? Which region
The number of passengers using public transport increases by 5.7% in January, as compared with the same month of the previous year
 12 March 2018 Passenger Transport Statistics (PT) January 2018. Provisional data The number of passengers using public transport increases by 5.7% in January, as compared with the same month of the previous
NEWS RELEASE. GB Drink Drive Trends Revealed. From Release Reference Date
 NEWS RELEASE From Release Reference Date Richard Owen Under embargo until 0000 Wednesday 16 th December GB Drink Drive Trends 2015 Tuesday, 15 th December 2015 GB Drink Drive Trends Revealed New study
April Société Générale SCF. Focus on the cover pool
 April 2010 Société Générale SCF Focus on the cover pool 2 Disclaimer The following presentation contains a number of forward-looking statements relating to Société Générale s targets and strategy. These
POLICE GRANT REPORT ENGLAND AND WALES 2018/19 TABLES. Table 1: Provisional change in total direct resource funding compared to 2017/18
 POLICE GRANT REPORT ENGLAND AND WALES 2018/19 TABLES Table 1: Provisional change in total direct resource funding compared to 2017/18 2017/18* 2018/19* Cash increase 2017 reserves as percentage of funding**
FINAL POLICE GRANT REPORT ENGLAND AND WALES 2019/20 TABLES
 FINAL POLICE GRANT REPORT ENGLAND AND WALES TABLES Table 1: Provisional change in total resource funding for England and Wales, compared to 2018/19 Total resource funding including pensions grant in *
Global Map of Irrigation Areas FRANCE
 FRANCE Area actually irrigated total with groundwater with surface water Alsace 73 328 57 721 15 607 57 403 Aquitaine 365 766 151 060 214 706 272 310 Auvergne 48 613 8 926 39 687 30 680 Basse-Normandie
The number of passengers using public transport increases by 12.6% in March, as compared with the same month of the previous year
 11 May 2017 Passenger Transport Statistics (PT) March 2017. Provisional data The number of passengers using public transport increases by 12.6% in March, as compared with the same month of the previous
The number of passengers using public transport 1 decreases by 5.7% in March, as compared with the same month of the previous year
 10 May 2018 Passenger Transport Statistics (PT) March 2018. Provisional data The number of passengers using public transport 1 decreases by 5.7% in March, as compared with the same month of the previous
Passenger Transport Statistics (PT) August Provisional data
 August Provisional data") 11 October 2016 Passenger Transport Statistics (PT) August 2016. Provisional data The number of passengers using public transport increases by 6.0% in August, as compared with the same month of the previous
11 October 2016 Passenger Transport Statistics (PT) August 2016. Provisional data The number of passengers using public transport increases by 6.0% in August, as compared with the same month of the previous
The number of passengers using public transport increases by 1.3% in February, as compared with the same month of the previous year
 11 April 2018 Passenger Transport Statistics (PT) February 2018. Provisional data The number of passengers using public transport increases by 1.3% in February, as compared with the same month of the previous
Overnight stays in hotel establishment increase 1.3% in January with respect to the same month in 2017
 22 February 218 Hotel Tourism Short-Term Trends (HOS/HPI/IPHS) January 218. Provisional data Overnight stays in hotel establishment increase 1.3% in January with respect to the same month in 217 Hotels
The number of passengers using public transport increases by 1.8% in May, as compared with the same month of the previous year
 12 July 2018 Passenger Transport Statistics (PT) May 2018. Provisional data The number of passengers using public transport increases by 1.8% in May, as compared with the same month of the previous year
City transport increases by 2.5% in the annual rate and inter-city transport by 1.5%
 15 January 2018 Passenger Transport Statistics (PT) November 2017. Provisional data The number of passengers using public transport increases by 2.0% in November, as compared with the same month of the
The number of passengers using public transport decreases by 1.0% in February, as compared with the same month of the previous year
 13 April 2015 Passenger Transport Statistics (PT) February 2015. Provisional data The number of passengers using public transport decreases by 1.0% in February, as compared with the same month of the previous
Regional Volunteer registration form
 Regional Volunteer registration form Please clearly complete all sections of this form, sign the agreement and return it along with a passport-sized photograph to: War Memorials Trust, 1 st Floor, 14 Buckingham
Passenger Transport Statistics (PT) February Provisional data
 February Provisional data") 12 April 2012 Passenger Transport Statistics (PT) February 2012. Provisional data Main results - The number of passengers using city transport increases 0.5% in February 2012, as compared with the same
12 April 2012 Passenger Transport Statistics (PT) February 2012. Provisional data Main results - The number of passengers using city transport increases 0.5% in February 2012, as compared with the same
Tourist arrivals in the Canary Islands (ISTAC)
") CANARY ISLANDS 2017 398,711 283,081 37,161 32,843 52,642 36,653 41,631 23,096 42,081 45,598 64,613 109,790 262,082 91,344 1,259,243 107,605 1,366,848 2018 396,979 278,120 33,298 38,326 45,924 40,580 41,781
CANARY ISLANDS 2017 398,711 283,081 37,161 32,843 52,642 36,653 41,631 23,096 42,081 45,598 64,613 109,790 262,082 91,344 1,259,243 107,605 1,366,848 2018 396,979 278,120 33,298 38,326 45,924 40,580 41,781
Tourist arrivals in the Canary Islands (ISTAC)
") February de 2018 CANARY ISLANDS 2017 383,528 238,774 30,145 56,675 51,387 33,200 37,464 21,964 54,480 43,396 60,126 87,611 245,613 85,435 1,184,184 103,397 1,287,581 2018 376,026 253,423 32,692 46,633
February de 2018 CANARY ISLANDS 2017 383,528 238,774 30,145 56,675 51,387 33,200 37,464 21,964 54,480 43,396 60,126 87,611 245,613 85,435 1,184,184 103,397 1,287,581 2018 376,026 253,423 32,692 46,633
Tourist arrivals in the Canary Islands (ISTAC)
") CANARY ISLANDS 2017 504,137 230,881 36,274 67,207 70,541 47,852 59,919 23,199 10,438 532 14,636 16,167 41,773 107,218 1,189,005 230,500 1,419,505 2018 444,772 234,541 35,022 68,384 65,887 51,632 49,742
CANARY ISLANDS 2017 504,137 230,881 36,274 67,207 70,541 47,852 59,919 23,199 10,438 532 14,636 16,167 41,773 107,218 1,189,005 230,500 1,419,505 2018 444,772 234,541 35,022 68,384 65,887 51,632 49,742
Tourist arrivals in the Canary Islands (ISTAC)
") CANARY ISLANDS 2016 467,924 229,641 38,827 65,678 68,691 41,969 57,364 21,991 9,636 537 9,923 12,272 32,368 95,959 1,120,417 219,892 1,340,309 2017 504,137 230,881 36,274 67,207 70,541 47,852 59,919 23,199
CANARY ISLANDS 2016 467,924 229,641 38,827 65,678 68,691 41,969 57,364 21,991 9,636 537 9,923 12,272 32,368 95,959 1,120,417 219,892 1,340,309 2017 504,137 230,881 36,274 67,207 70,541 47,852 59,919 23,199
Total nights spent by residents. spent by nonresidents
 INDIC_TO Total nights spent by residents Total nights spent by nonresidents Nights spent, total GEO/TIME 2015 2015 2015 EU28 - European Union (28 countri 1.519.662.616 1.264.513.073 2.784.175.689 ES -
Project description Environmental issues Beneficiaries Administrative data Read more
 TOURLINK - Demonstrating how an integrated ecolabeling and tour operating supply chain management strategy can foster sustainability in tourism LIFE04 ENV/NL/000661 Project description Environmental issues
Application and Agreement Form
 Application and Agreement Form Company Registered Details Company name: Contact name: Address: City: Postcode: Telephone number: Fax number: Email: Website address: Company number: VAT number: Participation
In November 7,721 mercantile companies are created, 2.1% less than in the same month of 2016 and 1,808 are dissolved, 5.9% less
 12 January 2018 Mercantile Companies Statistics (MC) November 2017. Provisional data In November 7,721 mercantile companies are created, 2.1% less than in the same month of 2016 and 1,808 are dissolved,
SCOTTISH VINTAGE BUS MUSEUM - ARCHIVES FLEETBOOKS - page 1 (see also Fleet Lists)
") SCOTTISH VINTAGE BUS MUSEUM - ARCHIVES FLEETBOOKS - page 1 (see also Fleet Lists) BBP = British Bus Publishing / ARP = Autobus Review Publication / CT = Capital Transport Stagecoach Jenkinson 1992(x2),
SCOTTISH VINTAGE BUS MUSEUM - ARCHIVES FLEETBOOKS - page 1 (see also Fleet Lists) BBP = British Bus Publishing / ARP = Autobus Review Publication / CT = Capital Transport Stagecoach Jenkinson 1992(x2),
Overnight stays in hotel establishments 1 register an increase of 17.6% in March, as compared to the same month of 2015
 22 April 216 Hotel Tourism Short-Term Trends (HOS/HPI/IPHS) March 216. Provisional data Overnight stays in hotel establishments 1 register an increase of 17.6% in March, as compared to the same month of
System Improvements & Future Needs
 June 2005 System Improvements & Future Needs Ian Coles - Data & Systems Coordinator JMP Consulting 2005 JMP Consulting on behalf of the TRICS Consortium TRICS System Improvements & Future Needs New features
Overnight stays in hotel establishments 1 increase 19.4% in April as compared with the same month of 2016
 23 May 217 Hotel Tourism Short-Term Trends (HOS/HPI/IPHS) April 217. Provisional data Overnight stays in hotel establishments 1 increase 19.4% in April as compared with the same month of 216 Hotels invoice
Research Note 3 Speeding fines
 www.driversalliance.org.uk www.taxpayersalliance.com Research Note 3 Speeding fines This is the first report to collate the total amount of money generated from fixed penalties caught on speed cameras
Air Support Study. HMI Matt Parr CB. CCs Council 18 October 2017
 Air Support Study HMI Matt Parr CB CCs Council 18 October 2017 Fleet size and utilisation Number of bases Hours flown 35 35,000 31 30 30,000 25 25,000 20 20,000 15 15 15,000 10 10,000 5 5,000 0 2008/09
Projects and EUSALP. European Regional Development Fund
 Projects and EUSALP European Regional Development Fund INTERREG ALPINE SPACE PROGRAMME PRIORITIES Alpine Space Alpine Space Alpine Space Alpine Space EUSALP ACTION GROUPS To develop an effective research
Overnight stays in hotel establishments increase 1.6% in July as compared with the same month of 2016
 23 August 217 Hotel Tourism Short-Term Trends (HOS/HPI/IPHS) July 217 Provisional data Overnight stays in hotel establishments increase 1.6% in July as compared with the same month of 216 Hotels invoice
Overnight stays in hotel establishments registered a decrease of 0.2% in July, as compared to the same month of 2013
 22 August 214 Hotel Tourism Short-Term Trends (HOS/HPI/IPHS) July 214. Provisional data Overnight stays in hotel establishments registered a decrease of.2% in July, as compared to the same month of 213
Thank you for your request for information regarding Officers deployed to the London Olympics which has now been considered.
 c/o PO BOX 481 Fareham Hampshire PO14 9FS Tel: 02380 674255 Email: acpo.request@foi.pnn.police.uk FREEDOM OF INFORMATION REQUEST REFERENCE NUMBER: 000105/12 Thank you for your request for information regarding
Overnight stays in non-hotel tourist accommodation increase 1.0% in December as compared to the same month of 2013
 Non-Hotel Tourist Accommodation Occupancy Survey December 2014 and year 2014. Provisional data 30 January 2015 Overnight stays in non-hotel tourist accommodation increase 1.0% in December as compared to
Overnight stays in hotel establishments 1 register an increase of 1.3% in April, as compared to the same month of 2015
 23 May 216 Hotel Tourism Short-Term Trends (HOS/HPI/IPHS) April 216. Provisional data Overnight stays in hotel establishments 1 register an increase of 1.3% in April, as compared to the same month of 215
United States, California. United States, Colorado. United States, Connecticut. United States, District of Columbia. United States, Florida
 United States, California Duarte, California, United States, 91010 La Jolla, California, United States, 92037 La Jolla, California, United States, 92093-0987 Long Beach, California, United States, 90813
2011 BUILDINGS CENSUS
 ANATOLIKI MAKEDONIA, THRAKI KENTRIKI MAKEDONIA DYTIKI MAKEDONIA IPEIROS THESSALIA STEREA ELLADA IONIA NISSIA DYTIKI ELLADA PELOPONNISOS ATTIKI VOREIO AIGAIO NOTIO AGAIO KRITI HELLENIC REPUBLIC Piraeus,
Property Investment Guide: West London
 Property Investment Guide: West London Essential investment information WEST LONDON sourcedwestlondon.com Introduction West London DIVERSE AND CHARMING 2 Hi My name is Kathy Bianchi and I am the Director
Property Investment Guide: Reading
 Property Investment Guide: Essential investment information READING sourcedreading.com Introduction 900 MILLION INVESTED IN THE STATION, CROSSRAIL AND BUOYANT ECONOMY Hi My name is Adam Vickers and I am
The Health Care System in Italy and Lombardy. Alberto Daprà Vice Chairman Lombardia Informatica
 The Health Care System in Italy and Lombardy Alberto Daprà Vice Chairman Lombardia Informatica Lodz 20 September 2011 Lombardy Region Is one of the twenty Italian Regions About 16% of Italy s citizens
SCoPAFF 8 June Direzione generale della sanità animale e dei farmaci veterinari
 Direzione generale della sanità animale e dei farmaci veterinari Italy information on the results of the implementation of the bovine brucellosis and ovine and caprine brucellosis eradication programmes
Overnight stays in hotel establishments 1 increase 7.1% in March with respect to the same month in 2017
 24 April 218 Hotel Tourism Short-Term Trends (HOS/HPI/IPHS) March 218. Provisional data Overnight stays in hotel establishments 1 increase 7.1% in March with respect to the same month in 217 Hotels invoice
Media Facts. BerlinOnline Stadtportal GmbH & Co. KG
 Media Facts BerlinOnline Stadtportal GmbH & Co. KG July 2017 2 / 11 A powerful site combo total coverage 53.27 M Page impressions total * 5.44 M Unique user total ** 19.05 M Visits total * 3 / 11 Comparison:
CONTENTS. Executive Summary : Section One: Our Remit : Section Two: Views of Park Mark Award Holders...05
 Safer Parking Report 2017 CONTENTS Executive Summary...02 1: Section One: Our Remit...04 2: Section Two: Views of Park Mark Award Holders...05 3: Section Three: Views of Car Park Users...18 4. Section
The number of passengers using public transport increases by 2.4% in November, as compared with the same month of 2017
 14 January 2019 Passenger Transport Statistics (PT) November 2018. Provisional data The number of passengers using public transport increases by 2.4% in November, as compared with the same month of 2017
House prices fall in most regions during the third quarter
 www.nationwide.co.uk/hpi Q3 2010 Embargoed until 0700 Thurs 30 Sep 2010 House prices fall in most regions during the third quarter House prices fell in nine out of thirteen UK regions in the third quarter
Road Casualties in Great Britain Main Results: 2004
 Road Casualties in Great Britain Main Results: 2004 SB (05) 26 A National Statistics publication produced by Transport Statistics: DfT National Statistics are produced to high professional standards set
Road Casualties in Great Britain Main Results: 2005
 Road Casualties in Great Britain Main Results: 2005 SB (06) 26 A National Statistics publication produced by Transport Statistics: DfT National Statistics are produced to high professional standards set
Q Embargoed until March 2010
 www.nationwide.co.uk/hpi Embargoed until 0700 30 March 2010 London mini-boom leads UK price growth UK house prices increased by 1.6% quarter-on-quarter in Q1 London saw the strongest growth in the quarter
Bringing the benefits of space uses to regions and their citizens
 MISSION ACTIVITIES MEMBER REGIONS ASSOCIATE MEMBERS GOOD REASONS TO JOIN Bringing the benefits of space uses to regions and their citizens MISSION Spreading the uses and understanding of space technologies
Workless households for areas across the UK in 2010
 Workless households for areas across the UK in 2010 Coverage: UK Date: 08 September 2011 Geographical Area: Local Authority County Theme: Labour Market Animated YouTube Video A short video podcast explaining
UNCLASSIFIED. PC24/2007 PROLIFIC AND OTHER PRIORITY OFFENDER ISSUES; DRUG TESTING OF PPOs ON LICENCE; DRUG TESTING IN APPROVED PREMISES
 Probation Circular PC24/2007 PROLIFIC AND OTHER PRIORITY OFFENDER ISSUES; DRUG TESTING OF PPOs ON LICENCE; DRUG TESTING IN APPROVED PREMISES IMPLEMENTATION DATE: 16 July 2007 EXPIRY DATE: July 2012 TO:
Most regions saw price falls during 2012
 www.nationwide.co.uk/hpi Embargoed until 0700 Thurs 3 Jan 2013 Most regions saw price falls during 2012 11 out of 13 UK regions saw annual price falls during 2012 London best performing region in 2012
House prices in London continue to climb
 www.nationwide.co.uk/hpi Q2 2014 Embargoed until 0700 Wed 2 Jul 2014 House prices in London continue to climb All UK regions saw annual price rises in Q2 2014 London continues to lead, with annual price
Property Investment Guide: Leicester
 Property Investment Guide: Essential investment information sourcedleicester.com Introduction RANKED THE 5TH BEST PLACE TO INVEST Hi My name is Sam Ballard and I am the Director of Sourced, an investment
STAMP IDENTIFICATION NUMBERS
 STAMP IDENTIFICATION NUMBERS DEPARTMENT OF TRADE AND INDUSTRY WEIGHTS AND MEASURES (PRESCRIBED STAMP) REGULATIONS 1968 LIST OF IDENTIFICATION NUMBERS National Weights and Measures Laboratory Stanton Avenue
Embargoed until 30/03/2012
 The Halifax Rural Areas Quality of Life Survey tracks where living standards are highest in Great Britain by ranking local performance across key indicators covering the labour market, the housing market,
October 2013 compared with September 2013 Industrial production down by 1.1% in euro area Down by 0.7% in EU28
 10-2004 01-2005 04-2005 07-2005 10-2005 01-2006 04-2006 07-2006 10-2006 01-2007 04-2007 07-2007 10-2007 01-2008 04-2008 07-2008 10-2008 01-2009 04-2009 07-2009 10-2009 01-2010 04-2010 07-2010 10-2010 01-2011
Overnight stays in non-hotel tourist accommodation increase 4.3% in October compared to the same month of 2016
 30 November 2017 Non-hotel Tourist Accommodation Occupancy Survey October 2017. Overnight stays in non-hotel tourist accommodation increase 4.3% in October compared to the same month of 2016 Overnight
December Société Générale SCF. A Leading Player in the Covered Bond Market
 December 2010 Société Générale SCF A Leading Player in the Covered Bond Market 2 Disclaimer The following presentation contains a number of forward-looking statements relating to Société Générale s targets
Greying Italy across Time, Space and Gender
 Greying Italy across Time, Space and Gender by Luciana Quattrociocchi Daria Squillante Mauro Tibaldi INTERNATIONAL SEMINAR BRUSSELS 16-17 April 2015 Building an evidence base for active ageing policies:
The local elections of 1 May 1997
 The local elections of 1 May 1997 Research Paper 97/82 27 June 1997 The local elections that took place in many parts of England on 1 May were overshadowed by the general election and the results of them
Partners Accelerating urban transformation the "smart" way Utrecht The Netherlands
 Partners 2018 26/06/2018 Regional partnerships Accelerating urban transformation the "smart" way Utrecht The Netherlands Gothenburg Metropole Nice Côte d'azur France Vaasa Finland Investing in people for
Overnight stays in non-hotel tourist accommodation increase 7.2% in September, as compared with the same month of 2016
 31 October 2017 Non-hotel Tourist Accommodation Occupancy Survey September 2017. Overnight stays in non-hotel tourist accommodation increase 7.2% in September, as compared with the same month of 2016 Overnight
CAA Passenger Survey Report 2017
 Business Intelligence (CAA Strategy & Policy Department) CAA Passenger Survey Report 2017 A survey of passengers at Birmingham, East Midlands, Gatwick, Heathrow, Leeds Bradford, Liverpool, London City,
Overnight stays in non-hotel tourist accommodation decrease 0.3% in May, as compared to the same month of 2017
 29 June 2018 Non-hotel Tourist Accommodation Occupancy Survey May 2018. Overnight stays in non-hotel tourist accommodation decrease 0.3% in May, as compared to the same month of 2017 Overnight stays in
Overnight stays in non-hotel tourist accommodation 1 increase 17.0% in March, as compared with the same month of 2017
 3 May 2018 Non-hotel Tourist Accommodation Occupancy Survey March 2018. Overnight stays in non-hotel tourist accommodation 1 increase 17.0% in March, as compared with the same month of 2017 Overnight stays
Overnight stays in non-hotel tourist accommodation 1 decrease 18.5% in April, as compared to the same month of 2017
 31 May 2018 Non-hotel Tourist Accommodation Occupancy Survey April 2018. Overnight stays in non-hotel tourist accommodation 1 decrease 18.5% in April, as compared to the same month of 2017 Overnight stays
EMPLOYMENT AND REGIONAL DEVELOPMENT IN FRANCE GUISAN, M. Carmen AGUAYO, Eva
 Applied Econometrics and International Development. AEEADE. Vol. 1-1 (2001) EMPLOYMENT AND REGIONAL DEVELOPMENT IN FRANCE GUISAN, M. Carmen (eccgs@usc.es) AGUAYO, Eva (economet@usc.es) Abstract We present
United States, District of Columbia Washington, D.C., District of Columbia, United States,
 United States, California Los Angeles, California, United States, 90048 Los Angeles, California, United States, 90095 Orange, California, United States, 92868-3201 United States, Colorado Aurora, Colorado,
TOURBENCH - European Monitor and Benchmarking Initiative for Environmental Impacts and Costs in Tourist Accommodation LIFE03 ENV/NL/000473
 TOURBENCH - European Monitor and Benchmarking Initiative for Environmental Impacts and Costs in Tourist Accommodation LIFE03 ENV/NL/000473 Project description Environmental issues Beneficiaries Administrative
Passenger Transport Statistics January Provisional data
 9 March 2010 Updated at 2:30 p.m. Passenger Transport Statistics January 2010. Provisional data Main results The number of passengers using city transport decreases 3.4% in January 2010, as compared with
Epidémiologie de la tuberculose à la Réunion,
 Epidémiologie de la tuberculose à la Réunion, 2000-2007 N. Baroux 1, Dr E. D Ortenzio 1 1/ CIRE Réunion-Mayotte Nombres estimés de nouveaux cas, 2006 Estimated number of new TB cases (all forms) No estimate
The number of passengers using city transport increases 2.2% in December as compared with the same month of the previous year
 9 February 2009 Passenger Transport Statistics December 2008. Provisional data The number of passengers using city transport increases 2.2% in December as compared with the same month of the previous year
ARTIGIANO IN FIERA Key Points
 ARTIGIANO IN FIERA 2016 Key Points THE FAIR Analysis and figures THE LARGEST TRADE FAIR (B2C) IN THE WORLD Key Points AF 2016 The fair 3 9 HALLS: THE INTERNATIONAL CRAFTS SELLING EXHIBITION Key Points
Strukturindikatorer i Europaperspektiv
 Strukturindikatorer i Europaperspektiv Alf Fyhrlund mailto:alf.fyhrlund@scb.se Statistiska centralbyrån Databaser, Information och publicering 23:e Nordiska Statistikermötet Kunskap för framtiden 18-21
EU Report. Europe JANUARY 2019
 H EU Report Europe JANUARY 2019 ANALYSIS OF HOTEL RESULTS JANUARY 2019 A cloud on the horizon for European hoteliers The year is off to a slow start for European hoteliers who post less encouraging results
Governing Board of Enlarged Partial Agreement on Cultural Routes Luxembourg Strengthening the EPA on Cultural Routes: Possible future synergies
 Governing Board of Enlarged Partial Agreement on Cultural Routes Luxembourg Strengthening the EPA on Cultural Routes: Possible future synergies Mr. Patrick Torrent, NECSTouR President ptorrent@gencat.cat
in focus Statistics How Eur opeans go on Contents Main features INDUSTRY, TRADE AND SERVICES POPULATION AND SOCIAL CONDITIONS
 Statistics in focus INDUSTRY, TRADE AND SERVICES POPULATION AND SOCIAL CONDITIONS 18/2006 How Eur opeans go on holiday Main features In 2004, European tourists made on average at least two holiday trips
Firearms licensing contacts (England and Wales) Tuesday, 21 October 2014
 Tuesday, 21 October 2014") Firearms licensing contacts (England and Wales) Tuesday, 21 October 2014 Avon & Somerset Licensing Bureau (F) The Bridewell PO Box 3115 Bristol BS1 9GF Phone: 01179 455175 Fax: 01179 455532 E: firearms.licensing@avonandsomerset.pnn.police.uk
Firearms licensing contacts (England and Wales) Tuesday, 21 October 2014 Avon & Somerset Licensing Bureau (F) The Bridewell PO Box 3115 Bristol BS1 9GF Phone: 01179 455175 Fax: 01179 455532 E: firearms.licensing@avonandsomerset.pnn.police.uk
DEVOLUTION OF RAIL FRANCHISING. A new strategy for rail in the North of England
 DEVOLUTION OF RAIL FRANCHISING A new strategy for rail in the North of England A BETTER RAILWAY IN THE NORTH We want the economy and prosperity of the North to grow and rail will play a pivotal role in
Not for broadcast or publication before 00:01 Hrs on Monday 18th April 2011
 Press Release Embargoed until: 00:01 18.04.11 Not for broadcast or publication before 00:01 Hrs on Monday 18th April 2011 The Halifax Rural Areas Quality of Life Survey tracks where living standards are
Chris Schmidt - istockphoto. Germany s Major Investment Partners USA
 Chris Schmidt - istockphoto Germany s Major Investment Partners USA I. The Big Picture II. Individual Analysis of Selected Countries North America (USA) III. Contacts www.gtai.com 2 I. The Big Picture
Appendix A. Table A1. Export activity in the Spanish regions.
 Appendix A Table A1. Export activity in the Spanish regions. Share of exporting firms (%) Share of volume of exports (%) Exports over GDP (%) 2005 2010 2015 2005 2010 2015 2005 2010 2014 Andalusia 10 11
Overnight stays in non-hotel tourist accommodation decrease by 2.4% in October, as compared to the same month of 2017
 30 November 2018 Non-hotel Tourist Accommodation Occupancy Survey October 2018. Overnight stays in non-hotel tourist accommodation decrease by 2.4% in October, as compared to the same month of 2017 Overnight
Overnight stays in hotel establishments increase 1.6% 1 in May, as compared with the same month in 2010
 24 June 2011 Hotel Tourism Short-Term Trends (HOS/HPI/ADR/REVPAR) May 2011. Overnight stays in hotel establishments increase 1.6% 1 in May, as compared with the same month in 2010 Hotels earn 34.6 euros
4th GRADE MINIMUM CONTENTS-SOCIAL SCIENCE UNIT 8: WHERE WE LIVE: ADMINISTRATIVE DIVISION
 4th GRADE MINIMUM CONTENTSSOCIAL SCIENCE UNIT 8: WHERE WE LIVE: ADMINISTRATIVE DIVISION WHERE IS SPAIN? Spain is a country in southwest Europe. Spanish territory is the land that belongs to Spain. It consists
Uttlesford takes the crown as Britain s best rural area to live
 Uttlesford takes the crown as Britain s best rural area to live The Halifax Rural Areas Quality of Life Survey tracks where living standards are highest in Great Britain by ranking local performance across
Research Note th June Council liabilities
 Research Note 136 26th June 2014 Council liabilities Public sector debt is forecast by the Office for Budgetary Responsibility to exceed 1.3 trillion in 2014-15. 1 However, as explained by previous TaxPayers
Economic Development and Regional Disparities in France
 Serge Dormard Economic Development and Regional Disparities in France Contents 1. The Special Features of Regional Development in France 1.1 The Geographical Distribution of Economic Activity and Employment