RAPID REPORTS. Per capita GDP in the regions of the European Union
|
|
|
- Darrell Craig
- 6 years ago
- Views:
Transcription

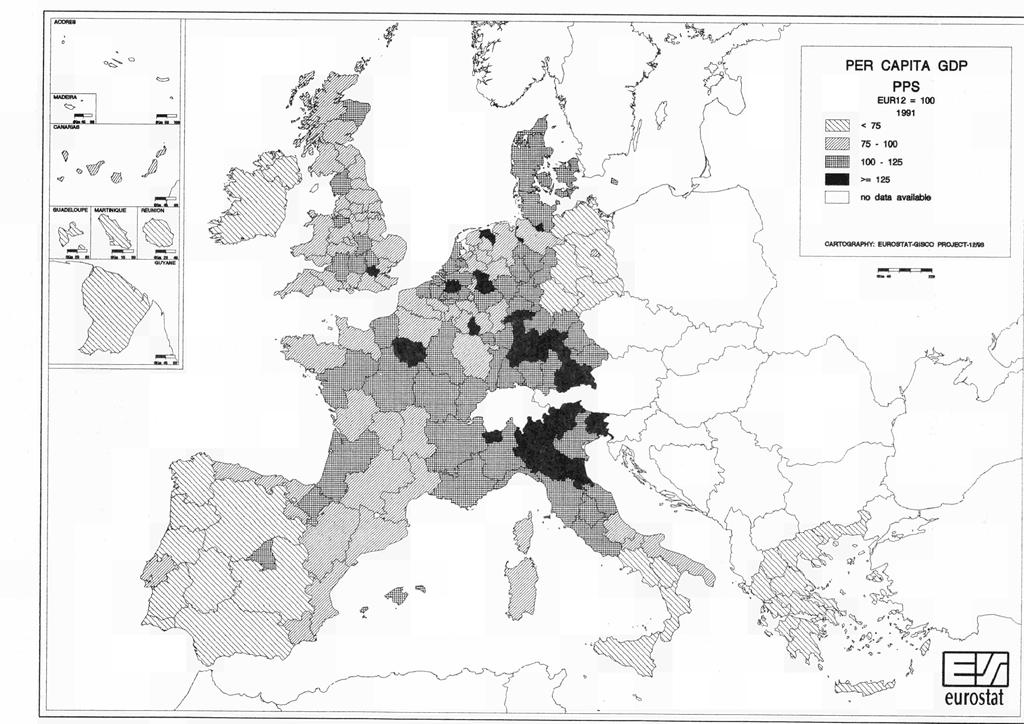
1 û eurostat RAPID REPORTS Regions 19 D 1 ISSN Per capita in the regions of the European Union The regional for was calculated including the new German Länder, which were part of the Community territory by then. These regions' low percapita produced a 3% fall in the Community average compared with that of the former territory. Expressed as purchasing power standards, the percapita figures for reveal marked differences between the Member States. Greece, at % of the Community average, had the lowest, after Portugal (60%). In Ireland (72%), Spain (%) and the United Kingdom (%), percapita was below the Community average. At the other end of the scale, Luxembourg recorded 131%, France %, Denmark %, Belgium %, Italy and Germany %, and the Netherlands %. The regions show even more marked extremes than in previous years. On the one hand, the group of European regions whose percapita falls shortest of the Community average has grown with the incorporation of the new German Länder. On the other, the more prosperous regions have climbed further above the Community average since the new Länder have counted towards the Community percapita, as attested by the fact that over 10% of the regions recorded figures in excess of 125% of the Community average, with especially high indices in Hamburg (209%), Darmstadt (173%), Bremen (159%) and Oberbayern (155%) in Germany, Ile de France (172%) in France, and Greater London (1%) in the United Kingdom. More than 20% of the regions of the Union recorded indices below 75% of the Community average, the lowest being, the new Länder ( 30 to 35%) in Germany, Alentejo (36%) in Portugal and all the Greek regions except Sterea Ellada and Attiki. The French overseas departements were in the same position (their indices relate to 19). Spain, Italy and the United Kingdom, the countries with the most pronounced interregional variations, have now been joined by Germany, where the discrepancies are even more dramatic: 18% of the population live in regions with of 35% or less of the Community average, while a similar number live in regions with percapita 40% above the average. In the period from 10 to, some regions' percapita made substantial advances against the Community average. Some, such as Baleares, Madrid, Ceuta y Melilla, Cataluna, Aragon, Murcia and Navarre (Spain), Ireland, Lisboa E Vale do Tejo and Norte (Portugal), came close to the average. Others, like Darmstadt, Hamburg, Oberbayern, Niederbayer and Mittelfranken (Germany), Ile de France (France), Friuli- Venezia Giulia and Lazio (Italy) and the Grand Duche of Luxembourg, increased their lead on the Community average. In the same period, a few regions' percapita indices plummeted. This was the case of Picardie and Lorraine in France and Drenthe and Groningen in the Netherlands, although gas production plays a decisive role in this last region. The slumps of more than 12 points in Sterea Ellada and Alentejo (Portugal) were all the more dramatic because they increased the drift behind the Community percapita. The following regional traits deserve mention: For the first time, four Spanish regions - Baleares (%), Madrid (%), Navarra (%) and Cataluna (%) - which together represent approximately 30% of the population recorded percapita indices around the Community average. Spain as a whole came close to % of the average. The fall of the United Kingdom index (%) below the Community average had repercussions in its regions. Some 30% of the population live in regions with less than % of the average. The striking contrasts between the regions of the north and the south of Italy have become more accentuated. While Valle d'aosta (133%), Lombardia (139%) and Emilia- Romagna (132%) are among the most prosperous regions of the Union, Basilicata, in the south, slid below 60% of the Community average. Manuscript completed on = For further information please contact: M. A. BAIGORRI Eurostat, L-20 Luxembourg, tel Fax: Price (excl. VAT) in Luxembourg: Subscription ECU 227 Catalogue number: CA-NI--001-EN-C
2 EUR 12 BELGIQUE-BELGIE VLAAMS GEWEST REGION WALLONNE BRUXELLES-BRUSSEL Antwerpen Brabant Hainaut Liege Limburg (Β) Luxembourg (Β) Namur Oost-Vlaanderen West- Vlaanderen DANMARK BR DEUTSCHLAND BADEN-WÜRTTEMBERG Stuttgart Karlsruhe Freiburg Tübingen BAYERN Oberbayern Niederbayem Oberpfalz Oberfranken Mittelfranken Unterfranken Schwaben BERLIN BRANDENBURG BREMEN HAMBURG HESSEN Darmstadt Gießen Kassel MECKLENBURG-VORPOMMERN NIEDERSACHSEN Braunschweig Hannover Lüneburg Weser-Ems NORDRHEIN-WESTFALEN Düsseldorf Köln Münster Detmold Arnsberg RHEINLAND-PFALZ Koblenz Trier Rheinhessen -Pfalz SAARLAND SACHSEN SACHSEN-ANHALT SCHLESWIG-HOLSTEIN THÜRINGEN Population (0) (million ECU) (million PPS) per capita (ECU) per capita per capita per capita
3 ELLADA VOREIA ELLADA Anatoliki Makedonia, Thraki Kentriki Makedonia Dytiki Makedonia Thessalia KENTRIKI ELLADA Ipeiros Ionia Nisia Dytiki Ellada Sterea Ellada Peloponnisos ATTIKI NISIA AIGAIOU, KRITI Voreio Aigaio Notio Aigaio Kriti ESPANA NOROESTE Galicia Asturias Cantabria NORESTE Pais Vasco Navarra Rioja Aragon MADRID CENTRO (E) Castilla - Leon Castilla La Mancha Extremadura ESTE Cataluña Comunidad Valenciana Baleares SUR Andalucía Murcia Ceuta y Melilla CANARIAS FRANCE ILE DE FRANCE BASSIN PARISIEN Champagne-Ardenne Picardie Haute-Normandie Centre Basse-Normandie Bourgogne NORD - PAS-DE-CALAIS EST Lorraine Alsace Franche-Comté OUEST Pays de la Loire Bretagne Poitou-Charentes Population (0) (million ECU) (million PPS) (ECU) 10 EUR12=
4 SUD-OUEST Aquitaine Midi-Pyrénées Limousin CENTRE-EST Rhône-Alpes Auvergne MEDITERRANEE Languedoc-Roussillon Provence-Alpes-Côte d'azur Corse DEPARTEMENTS D'OUTRE-MER 1 ) Guadeloupe Martinique Guyane Réunion IRELAND ITALIA NORD OVEST Piemonte Valle daosta Liguria LOMBARDIA NORD EST Trentino-Alto Adige Veneto Friuli-Venezia Giulia EMILIA-ROMAGNA CENTRO (I) Toscana Umbria Marche LAZIO CAMPANIA ABRUZZI-MOLISE Abruzzi Molise SUD Puglia Basilicata Calabria SICILIA SARDEGNA LUXEMBOURG (GRAND-DUCHE) NEDERLAND NOORD-NEDERLAND Groningen Friesland Drenthe OOST-NEDERLAND Overijssel Gelderland Flevoland WEST-NEDERLAND Utrecht Noord-Holland Zuid-Holland Zeeland Zuid-Nederland Noord-Brabant Limburg (NL) Population (0) (million ECU) (million PPS) (ECU) S ) Données 19
5 Population (0) (million ECU) (million PPS) (ECU) 10 PORTUGAL CONTINENTE Norte Centro (Ρ) Lisboa e Vale do Tejo Alentejo Algarve ACORES MADEIRA * : : ; : ; UNITED KINGDOM NORTH Cleveland, Durham Cumbria Northumberland, Tyne and Wear YORKSHIRE AND HUMBERSIDE Humberside North Yorkshire South Yorkshire West Yorkshire EAST MIDLANDS Derbyshire, Nottinghamshire Leios., Northamptonshire Lincolnshire EAST ANGLIA SOUTH EAST (UK) Bedfordshire, Hertfordshire Berks., Bucks., Oxfordshire Surrey, East-West Sussex Essex Greater London Hampshire, Isle of Wight Kent SOUTH WEST (UK) Avon, Gloucs., Wiltshire Cornwall, Devon Dorset, Somerset WEST MIDLANDS Hereford-Worcs., Warwicks. Shropshire, Staffordshire West Midlands (County) NORTH WEST (UK) Cheshire Greater Manchester Lancashire Merseyside WALES Clwyd, Dyfed, Gwynedd, Powys Gwent, Mid-S-W Glamorgan SCOTLAND Bord. -Centr. -Fife-Loth. - Tay. Dumfr. - Galloway, Strathclyde Highland, Islands Grampian NORTHERN IRELAND , ; : 7 I

6 PAR HABITANT ECU EUR12 = < >= 125 non disponible CARTOGRAPHIE: EUROOTAT-PROJET QI9CO-12/83 ^-> ν L eurostat
7
8 Method used to estimate regional shows the end-result of a region's productive activity. Per capita provides a measure of the level of economic development, but it cannot be interpreted as an indicator of the income of resident households. 1. Starting point: estimates of national National is calculated at market prices in ECU and PPS. The estimates are made on a harmonized basis in accordance with the rules of the ESA, so that comparisons between the Member States are possible. The European Currency Unit (ECU) is based on exchange rates, whereas the purchasing power standard is a unit of measurement which expresses an identical volume of goods and services for each country, taking account of differences in price levels. 2. Regional estimates The national estimates of population (ESA) are regionalized on the basis of the latest available data on the regional structure of the annual average population. 3. Comparisons at regional level In order to compare the in regions of different size, the per capita is calculated. To obtain a more straightforward comparison, these per capita figures are also expressed as a percentage of the Community average. The regional estimates of must be treated with a certain amount of caution on account of the specific situations that can arise in some regions. The most significant examples are as follows: Hamburg: per capita is very high due to the large number of non-residents working in the region; Flevoland and Lueneburg : the other extreme, with a large number of residents working outside the region; Groningen: per capita is given a substantial boost by the value of the production of gas, which is extracted in this region due to lack of information. The national in ECU and PPS is regionalized for each country on the basis of the latest available data on the regional structure of gross value added (GVA) at factor cost (at market prices in the case of Portugal). The estimates of regional in for the various countries are based on the regional structure of GVA in the following years: - D, GR, E, NL, UK; 19 - F, I, P; 18 - B. 4. Territory The overseas "départements" (DOM) in France and Azores and Madeira in Portugal could not yet be taken into account neither at national nor at Community level. For further information: Eurostat publications National Accounts ESA Aggregates REGIONS Statistical Year-book REGIO data base: Apart from the data in this publication, REGIO contains estimates of regional at NUTS III level and other national accounts aggregates classified by branch of activity at NUTS II level. ion may be obtained from the unit "Regional accounts and indicators" tel , J
STATISTICS IN FOCUS. Transport infrastructure and road safety: stark contrasts between Member States of the European Union
 * + * Ξi/L eurostat 1997 D 2 STATISTICS IN FOCUS Regions ISSN 124 6886 Transport infrastructure and safety: stark contrasts between Member States of the European Union The observations below refer to 1994
EQI /202 GDP per head (PPS)
") Baden-Württemberg DE1 72.8 38/202 EU-28=100 142.9 21/202 QUALITY PILLAR 83.2 17/202 IMPARTIALITY PILLAR 72.9 55/202 CORRUPTIO PILLAR 71.0 44/202 Peer Regions: Helsinki-Uusimaa, Groningen, Hessen, Bayern,
Baden-Württemberg DE1 72.8 38/202 EU-28=100 142.9 21/202 QUALITY PILLAR 83.2 17/202 IMPARTIALITY PILLAR 72.9 55/202 CORRUPTIO PILLAR 71.0 44/202 Peer Regions: Helsinki-Uusimaa, Groningen, Hessen, Bayern,
ABPorts: Research on EU control of ports
 ABPorts: Research on EU control of ports METHODOLOGY NOTE ComRes interviewed 4,506 adults online in Britain, France, Poland, Germany, Spain and Italy between 19 th and 26 th February 2016. Data were weighted
6.2. INVENTAIRE DES SUPERFICIES VITICOLES (Ha)
") 6.2. INVENTAIRE DES SUPERFICIES VITICOLES (Ha) July 20xx 2001 2002 2003 2004 2005 2006 2007 2008 2009 2010 2011 2012 2013 2014 2015 2016 2017 BG:BULGARIA 135 760 104 335 97 935 75 591 68 847 60 328 60
6.2. INVENTAIRE DES SUPERFICIES VITICOLES (Ha) July 20xx 2001 2002 2003 2004 2005 2006 2007 2008 2009 2010 2011 2012 2013 2014 2015 2016 2017 BG:BULGARIA 135 760 104 335 97 935 75 591 68 847 60 328 60
in focus Statistics Regional tourism in the European Union Contents Main features INDUSTRY, TRADE AND SERVICES
 Regional tourism in the European Union Statistics in focus INDUSTRY, TRADE AND SERVICES POPULATION AND SOCIAL CONDITIONS 27/2006 Author Ulrich SPÖREL Contents Main features... 1 Coastal regions account
11 Tourism. Introduction. Main statistical findings. Tourism in the EU-27: trends and facts. Number of overnight stays
 Tourism 11 Tourism Introduction This chapter presents the regional pattern of tourism in the European Union in 2009. It mainly tracks tourism occupancy in tourist accommodation establishments. The tourism
ENGLISH. Lombardia in Europe REGIONAL STATISTICAL YEARBOOK
 WWW.ASR-LOMBARDIA.IT ENGLISH Lombardia in Europe REGIONAL STATISTICAL YEARBOOK 2O11 Director-General Antonio Vincenzo Lentini Technical and Scientific Committee Rosalia Coniglio, Antonio Vincenzo Lentini,
Global Map of Irrigation Areas FRANCE
 FRANCE Area actually irrigated total with groundwater with surface water Alsace 73 328 57 721 15 607 57 403 Aquitaine 365 766 151 060 214 706 272 310 Auvergne 48 613 8 926 39 687 30 680 Basse-Normandie
FINAL POLICE GRANT REPORT ENGLAND AND WALES 2019/20 TABLES
 FINAL POLICE GRANT REPORT ENGLAND AND WALES TABLES Table 1: Provisional change in total resource funding for England and Wales, compared to 2018/19 Total resource funding including pensions grant in *
April Société Générale SCF. Focus on the cover pool
 April 2010 Société Générale SCF Focus on the cover pool 2 Disclaimer The following presentation contains a number of forward-looking statements relating to Société Générale s targets and strategy. These
Overnight stays in hotel establishment increase 1.3% in January with respect to the same month in 2017
 22 February 218 Hotel Tourism Short-Term Trends (HOS/HPI/IPHS) January 218. Provisional data Overnight stays in hotel establishment increase 1.3% in January with respect to the same month in 217 Hotels
POLICE GRANT REPORT ENGLAND AND WALES 2018/19 TABLES. Table 1: Provisional change in total direct resource funding compared to 2017/18
 POLICE GRANT REPORT ENGLAND AND WALES 2018/19 TABLES Table 1: Provisional change in total direct resource funding compared to 2017/18 2017/18* 2018/19* Cash increase 2017 reserves as percentage of funding**
ANNEX II ADRIATIC-IONIAN. Anatoliki Makedonia, Thraki Kentriki Makedonia Dytiki Makedonia. Ionia Nisia Dytiki Ellada Sterea Ellada Peloponnisos
 ANNEX II List of areas and of NUTS level II regions eligible for funding from the European Regional Development Fund under the transnational component of the European territorial cooperation goal for the
NEWS RELEASE. GB Drink Drive Trends Revealed. From Release Reference Date
 NEWS RELEASE From Release Reference Date Richard Owen Under embargo until 0000 Wednesday 16 th December GB Drink Drive Trends 2015 Tuesday, 15 th December 2015 GB Drink Drive Trends Revealed New study
Tourist arrivals in the Canary Islands (ISTAC)
") CANARY ISLANDS 2016 467,924 229,641 38,827 65,678 68,691 41,969 57,364 21,991 9,636 537 9,923 12,272 32,368 95,959 1,120,417 219,892 1,340,309 2017 504,137 230,881 36,274 67,207 70,541 47,852 59,919 23,199
CANARY ISLANDS 2016 467,924 229,641 38,827 65,678 68,691 41,969 57,364 21,991 9,636 537 9,923 12,272 32,368 95,959 1,120,417 219,892 1,340,309 2017 504,137 230,881 36,274 67,207 70,541 47,852 59,919 23,199
The number of passengers using public transport increases by 5.7% in January, as compared with the same month of the previous year
 12 March 2018 Passenger Transport Statistics (PT) January 2018. Provisional data The number of passengers using public transport increases by 5.7% in January, as compared with the same month of the previous
The number of passengers using public transport increases by 12.6% in March, as compared with the same month of the previous year
 11 May 2017 Passenger Transport Statistics (PT) March 2017. Provisional data The number of passengers using public transport increases by 12.6% in March, as compared with the same month of the previous
The number of passengers using public transport 1 decreases by 5.7% in March, as compared with the same month of the previous year
 10 May 2018 Passenger Transport Statistics (PT) March 2018. Provisional data The number of passengers using public transport 1 decreases by 5.7% in March, as compared with the same month of the previous
Passenger Transport Statistics (PT) August Provisional data
 August Provisional data") 11 October 2016 Passenger Transport Statistics (PT) August 2016. Provisional data The number of passengers using public transport increases by 6.0% in August, as compared with the same month of the previous
11 October 2016 Passenger Transport Statistics (PT) August 2016. Provisional data The number of passengers using public transport increases by 6.0% in August, as compared with the same month of the previous
In November 7,721 mercantile companies are created, 2.1% less than in the same month of 2016 and 1,808 are dissolved, 5.9% less
 12 January 2018 Mercantile Companies Statistics (MC) November 2017. Provisional data In November 7,721 mercantile companies are created, 2.1% less than in the same month of 2016 and 1,808 are dissolved,
Tourist arrivals in the Canary Islands (ISTAC)
") CANARY ISLANDS 2017 398,711 283,081 37,161 32,843 52,642 36,653 41,631 23,096 42,081 45,598 64,613 109,790 262,082 91,344 1,259,243 107,605 1,366,848 2018 396,979 278,120 33,298 38,326 45,924 40,580 41,781
CANARY ISLANDS 2017 398,711 283,081 37,161 32,843 52,642 36,653 41,631 23,096 42,081 45,598 64,613 109,790 262,082 91,344 1,259,243 107,605 1,366,848 2018 396,979 278,120 33,298 38,326 45,924 40,580 41,781
Tourist arrivals in the Canary Islands (ISTAC)
") February de 2018 CANARY ISLANDS 2017 383,528 238,774 30,145 56,675 51,387 33,200 37,464 21,964 54,480 43,396 60,126 87,611 245,613 85,435 1,184,184 103,397 1,287,581 2018 376,026 253,423 32,692 46,633
February de 2018 CANARY ISLANDS 2017 383,528 238,774 30,145 56,675 51,387 33,200 37,464 21,964 54,480 43,396 60,126 87,611 245,613 85,435 1,184,184 103,397 1,287,581 2018 376,026 253,423 32,692 46,633
Tourist arrivals in the Canary Islands (ISTAC)
") CANARY ISLANDS 2017 504,137 230,881 36,274 67,207 70,541 47,852 59,919 23,199 10,438 532 14,636 16,167 41,773 107,218 1,189,005 230,500 1,419,505 2018 444,772 234,541 35,022 68,384 65,887 51,632 49,742
CANARY ISLANDS 2017 504,137 230,881 36,274 67,207 70,541 47,852 59,919 23,199 10,438 532 14,636 16,167 41,773 107,218 1,189,005 230,500 1,419,505 2018 444,772 234,541 35,022 68,384 65,887 51,632 49,742
The number of passengers using public transport increases by 1.3% in February, as compared with the same month of the previous year
 11 April 2018 Passenger Transport Statistics (PT) February 2018. Provisional data The number of passengers using public transport increases by 1.3% in February, as compared with the same month of the previous
The number of passengers using public transport decreases by 1.0% in February, as compared with the same month of the previous year
 13 April 2015 Passenger Transport Statistics (PT) February 2015. Provisional data The number of passengers using public transport decreases by 1.0% in February, as compared with the same month of the previous
The number of passengers using public transport increases by 1.8% in May, as compared with the same month of the previous year
 12 July 2018 Passenger Transport Statistics (PT) May 2018. Provisional data The number of passengers using public transport increases by 1.8% in May, as compared with the same month of the previous year
Passenger Transport Statistics (PT) February Provisional data
 February Provisional data") 12 April 2012 Passenger Transport Statistics (PT) February 2012. Provisional data Main results - The number of passengers using city transport increases 0.5% in February 2012, as compared with the same
12 April 2012 Passenger Transport Statistics (PT) February 2012. Provisional data Main results - The number of passengers using city transport increases 0.5% in February 2012, as compared with the same
City transport increases by 2.5% in the annual rate and inter-city transport by 1.5%
 15 January 2018 Passenger Transport Statistics (PT) November 2017. Provisional data The number of passengers using public transport increases by 2.0% in November, as compared with the same month of the
Overnight stays in hotel establishments 1 increase 19.4% in April as compared with the same month of 2016
 23 May 217 Hotel Tourism Short-Term Trends (HOS/HPI/IPHS) April 217. Provisional data Overnight stays in hotel establishments 1 increase 19.4% in April as compared with the same month of 216 Hotels invoice
Overnight stays in hotel establishments 1 register an increase of 17.6% in March, as compared to the same month of 2015
 22 April 216 Hotel Tourism Short-Term Trends (HOS/HPI/IPHS) March 216. Provisional data Overnight stays in hotel establishments 1 register an increase of 17.6% in March, as compared to the same month of
Overnight stays in hotel establishments 1 register an increase of 1.3% in April, as compared to the same month of 2015
 23 May 216 Hotel Tourism Short-Term Trends (HOS/HPI/IPHS) April 216. Provisional data Overnight stays in hotel establishments 1 register an increase of 1.3% in April, as compared to the same month of 215
Air Support Study. HMI Matt Parr CB. CCs Council 18 October 2017
 Air Support Study HMI Matt Parr CB CCs Council 18 October 2017 Fleet size and utilisation Number of bases Hours flown 35 35,000 31 30 30,000 25 25,000 20 20,000 15 15 15,000 10 10,000 5 5,000 0 2008/09
Overnight stays in hotel establishments increase 1.6% in July as compared with the same month of 2016
 23 August 217 Hotel Tourism Short-Term Trends (HOS/HPI/IPHS) July 217 Provisional data Overnight stays in hotel establishments increase 1.6% in July as compared with the same month of 216 Hotels invoice
Overnight stays in hotel establishments registered a decrease of 0.2% in July, as compared to the same month of 2013
 22 August 214 Hotel Tourism Short-Term Trends (HOS/HPI/IPHS) July 214. Provisional data Overnight stays in hotel establishments registered a decrease of.2% in July, as compared to the same month of 213
Regional Volunteer registration form
 Regional Volunteer registration form Please clearly complete all sections of this form, sign the agreement and return it along with a passport-sized photograph to: War Memorials Trust, 1 st Floor, 14 Buckingham
2011 BUILDINGS CENSUS
 ANATOLIKI MAKEDONIA, THRAKI KENTRIKI MAKEDONIA DYTIKI MAKEDONIA IPEIROS THESSALIA STEREA ELLADA IONIA NISSIA DYTIKI ELLADA PELOPONNISOS ATTIKI VOREIO AIGAIO NOTIO AGAIO KRITI HELLENIC REPUBLIC Piraeus,
Overnight stays in non-hotel tourist accommodation increase 1.0% in December as compared to the same month of 2013
 Non-Hotel Tourist Accommodation Occupancy Survey December 2014 and year 2014. Provisional data 30 January 2015 Overnight stays in non-hotel tourist accommodation increase 1.0% in December as compared to
SCOTTISH VINTAGE BUS MUSEUM - ARCHIVES FLEETBOOKS - page 1 (see also Fleet Lists)
") SCOTTISH VINTAGE BUS MUSEUM - ARCHIVES FLEETBOOKS - page 1 (see also Fleet Lists) BBP = British Bus Publishing / ARP = Autobus Review Publication / CT = Capital Transport Stagecoach Jenkinson 1992(x2),
SCOTTISH VINTAGE BUS MUSEUM - ARCHIVES FLEETBOOKS - page 1 (see also Fleet Lists) BBP = British Bus Publishing / ARP = Autobus Review Publication / CT = Capital Transport Stagecoach Jenkinson 1992(x2),
Application and Agreement Form
 Application and Agreement Form Company Registered Details Company name: Contact name: Address: City: Postcode: Telephone number: Fax number: Email: Website address: Company number: VAT number: Participation
Research Note 3 Speeding fines
 www.driversalliance.org.uk www.taxpayersalliance.com Research Note 3 Speeding fines This is the first report to collate the total amount of money generated from fixed penalties caught on speed cameras
System Improvements & Future Needs
 June 2005 System Improvements & Future Needs Ian Coles - Data & Systems Coordinator JMP Consulting 2005 JMP Consulting on behalf of the TRICS Consortium TRICS System Improvements & Future Needs New features
Thank you for your request for information regarding Officers deployed to the London Olympics which has now been considered.
 c/o PO BOX 481 Fareham Hampshire PO14 9FS Tel: 02380 674255 Email: acpo.request@foi.pnn.police.uk FREEDOM OF INFORMATION REQUEST REFERENCE NUMBER: 000105/12 Thank you for your request for information regarding
Eurostat regional yearbook 2011 Regional diversity of the EU illustrated through maps and figures
 STAT/11/182 9 December 2011 Eurostat regional yearbook 2011 Regional diversity of the EU illustrated through maps and figures Which EU regions are the most built up and which are the least? Which region
Overnight stays in hotel establishments 1 increase 7.1% in March with respect to the same month in 2017
 24 April 218 Hotel Tourism Short-Term Trends (HOS/HPI/IPHS) March 218. Provisional data Overnight stays in hotel establishments 1 increase 7.1% in March with respect to the same month in 217 Hotels invoice
The local elections of 1 May 1997
 The local elections of 1 May 1997 Research Paper 97/82 27 June 1997 The local elections that took place in many parts of England on 1 May were overshadowed by the general election and the results of them
Bringing the benefits of space uses to regions and their citizens
 MISSION ACTIVITIES MEMBER REGIONS ASSOCIATE MEMBERS GOOD REASONS TO JOIN Bringing the benefits of space uses to regions and their citizens MISSION Spreading the uses and understanding of space technologies
Overnight stays in hotel establishments increase 1.6% 1 in May, as compared with the same month in 2010
 24 June 2011 Hotel Tourism Short-Term Trends (HOS/HPI/ADR/REVPAR) May 2011. Overnight stays in hotel establishments increase 1.6% 1 in May, as compared with the same month in 2010 Hotels earn 34.6 euros
The number of passengers using city transport increases 2.2% in December as compared with the same month of the previous year
 9 February 2009 Passenger Transport Statistics December 2008. Provisional data The number of passengers using city transport increases 2.2% in December as compared with the same month of the previous year
Media Facts. BerlinOnline Stadtportal GmbH & Co. KG
 Media Facts BerlinOnline Stadtportal GmbH & Co. KG July 2017 2 / 11 A powerful site combo total coverage 53.27 M Page impressions total * 5.44 M Unique user total ** 19.05 M Visits total * 3 / 11 Comparison:
Workless households for areas across the UK in 2010
 Workless households for areas across the UK in 2010 Coverage: UK Date: 08 September 2011 Geographical Area: Local Authority County Theme: Labour Market Animated YouTube Video A short video podcast explaining
STAMP IDENTIFICATION NUMBERS
 STAMP IDENTIFICATION NUMBERS DEPARTMENT OF TRADE AND INDUSTRY WEIGHTS AND MEASURES (PRESCRIBED STAMP) REGULATIONS 1968 LIST OF IDENTIFICATION NUMBERS National Weights and Measures Laboratory Stanton Avenue
Epidémiologie de la tuberculose à la Réunion,
 Epidémiologie de la tuberculose à la Réunion, 2000-2007 N. Baroux 1, Dr E. D Ortenzio 1 1/ CIRE Réunion-Mayotte Nombres estimés de nouveaux cas, 2006 Estimated number of new TB cases (all forms) No estimate
Property Investment Guide: West London
 Property Investment Guide: West London Essential investment information WEST LONDON sourcedwestlondon.com Introduction West London DIVERSE AND CHARMING 2 Hi My name is Kathy Bianchi and I am the Director
December Société Générale SCF. A Leading Player in the Covered Bond Market
 December 2010 Société Générale SCF A Leading Player in the Covered Bond Market 2 Disclaimer The following presentation contains a number of forward-looking statements relating to Société Générale s targets
Overnight stays in non-hotel tourist accommodation 1 decrease 18.5% in April, as compared to the same month of 2017
 31 May 2018 Non-hotel Tourist Accommodation Occupancy Survey April 2018. Overnight stays in non-hotel tourist accommodation 1 decrease 18.5% in April, as compared to the same month of 2017 Overnight stays
CONTENTS. Executive Summary : Section One: Our Remit : Section Two: Views of Park Mark Award Holders...05
 Safer Parking Report 2017 CONTENTS Executive Summary...02 1: Section One: Our Remit...04 2: Section Two: Views of Park Mark Award Holders...05 3: Section Three: Views of Car Park Users...18 4. Section
Most regions saw price falls during 2012
 www.nationwide.co.uk/hpi Embargoed until 0700 Thurs 3 Jan 2013 Most regions saw price falls during 2012 11 out of 13 UK regions saw annual price falls during 2012 London best performing region in 2012
Overnight stays in non-hotel tourist accommodation increase 4.3% in October compared to the same month of 2016
 30 November 2017 Non-hotel Tourist Accommodation Occupancy Survey October 2017. Overnight stays in non-hotel tourist accommodation increase 4.3% in October compared to the same month of 2016 Overnight
Greying Italy across Time, Space and Gender
 Greying Italy across Time, Space and Gender by Luciana Quattrociocchi Daria Squillante Mauro Tibaldi INTERNATIONAL SEMINAR BRUSSELS 16-17 April 2015 Building an evidence base for active ageing policies:
Overnight stays in non-hotel tourist accommodation increase 7.2% in September, as compared with the same month of 2016
 31 October 2017 Non-hotel Tourist Accommodation Occupancy Survey September 2017. Overnight stays in non-hotel tourist accommodation increase 7.2% in September, as compared with the same month of 2016 Overnight
Non residents boost hotel activity
 14 November 2017 Tourism Activity September 2017 Non residents boost hotel activity Hotel establishments recorded 2.2 million guests and 6.3 million overnight stays in September 2017, figures that relate
Overnight stays in non-hotel tourist accommodation decrease 0.3% in May, as compared to the same month of 2017
 29 June 2018 Non-hotel Tourist Accommodation Occupancy Survey May 2018. Overnight stays in non-hotel tourist accommodation decrease 0.3% in May, as compared to the same month of 2017 Overnight stays in
The number of passengers using public transport increases by 2.4% in November, as compared with the same month of 2017
 14 January 2019 Passenger Transport Statistics (PT) November 2018. Provisional data The number of passengers using public transport increases by 2.4% in November, as compared with the same month of 2017
Overnight stays in non-hotel tourist accommodation 1 increase 17.0% in March, as compared with the same month of 2017
 3 May 2018 Non-hotel Tourist Accommodation Occupancy Survey March 2018. Overnight stays in non-hotel tourist accommodation 1 increase 17.0% in March, as compared with the same month of 2017 Overnight stays
EMPLOYMENT AND REGIONAL DEVELOPMENT IN FRANCE GUISAN, M. Carmen AGUAYO, Eva
 Applied Econometrics and International Development. AEEADE. Vol. 1-1 (2001) EMPLOYMENT AND REGIONAL DEVELOPMENT IN FRANCE GUISAN, M. Carmen (eccgs@usc.es) AGUAYO, Eva (economet@usc.es) Abstract We present
House prices in London continue to climb
 www.nationwide.co.uk/hpi Q2 2014 Embargoed until 0700 Wed 2 Jul 2014 House prices in London continue to climb All UK regions saw annual price rises in Q2 2014 London continues to lead, with annual price
United States, California. United States, Colorado. United States, Connecticut. United States, District of Columbia. United States, Florida
 United States, California Duarte, California, United States, 91010 La Jolla, California, United States, 92037 La Jolla, California, United States, 92093-0987 Long Beach, California, United States, 90813
UNCLASSIFIED. PC24/2007 PROLIFIC AND OTHER PRIORITY OFFENDER ISSUES; DRUG TESTING OF PPOs ON LICENCE; DRUG TESTING IN APPROVED PREMISES
 Probation Circular PC24/2007 PROLIFIC AND OTHER PRIORITY OFFENDER ISSUES; DRUG TESTING OF PPOs ON LICENCE; DRUG TESTING IN APPROVED PREMISES IMPLEMENTATION DATE: 16 July 2007 EXPIRY DATE: July 2012 TO:
House prices fall in most regions during the third quarter
 www.nationwide.co.uk/hpi Q3 2010 Embargoed until 0700 Thurs 30 Sep 2010 House prices fall in most regions during the third quarter House prices fell in nine out of thirteen UK regions in the third quarter
Q Embargoed until March 2010
 www.nationwide.co.uk/hpi Embargoed until 0700 30 March 2010 London mini-boom leads UK price growth UK house prices increased by 1.6% quarter-on-quarter in Q1 London saw the strongest growth in the quarter
Economic Development and Regional Disparities in France
 Serge Dormard Economic Development and Regional Disparities in France Contents 1. The Special Features of Regional Development in France 1.1 The Geographical Distribution of Economic Activity and Employment
CAA Passenger Survey Report 2017
 Business Intelligence (CAA Strategy & Policy Department) CAA Passenger Survey Report 2017 A survey of passengers at Birmingham, East Midlands, Gatwick, Heathrow, Leeds Bradford, Liverpool, London City,
Overnights of residents and non residents increased by 9%, accelerating when compared with the previous month
 15 January 2018 Tourism Activity November 2017 Overnights of residents and non residents increased by 9%, accelerating when compared with the previous month Hotel establishments recorded 1.2 million guests
Growth in hotel activity supported by the external market
 14 August 2017 Tourism Activity June 2017 Growth in hotel activity supported by the external market Hotel establishments recorded 2.1 million guests and 5.9 million overnight stays in June 2017, figures
Property Investment Guide: Reading
 Property Investment Guide: Essential investment information READING sourcedreading.com Introduction 900 MILLION INVESTED IN THE STATION, CROSSRAIL AND BUOYANT ECONOMY Hi My name is Adam Vickers and I am
Residents ensure increase on overnight stays in hotels and similar establishments
 13 July 2018 Tourism Activity May 2018 Residents ensure increase on overnight stays in hotels and similar establishments Hotels and similar establishments registered 2.0 million guests and 5.4 million
00: Not for broadcast or publication before 00:01 Hrs Monday 20th June 2011
 Press Release Embargoed until: 00:01 20.06.11 Not for broadcast or publication before 00:01 Hrs Monday 20th June 2011 This is the Halifax review of economic and price performance at a local level. The
Total nights spent by residents. spent by nonresidents
 INDIC_TO Total nights spent by residents Total nights spent by nonresidents Nights spent, total GEO/TIME 2015 2015 2015 EU28 - European Union (28 countri 1.519.662.616 1.264.513.073 2.784.175.689 ES -
SCoPAFF 8 June Direzione generale della sanità animale e dei farmaci veterinari
 Direzione generale della sanità animale e dei farmaci veterinari Italy information on the results of the implementation of the bovine brucellosis and ovine and caprine brucellosis eradication programmes
Overnight stays in non-hotel tourist accommodation decrease by 2.4% in October, as compared to the same month of 2017
 30 November 2018 Non-hotel Tourist Accommodation Occupancy Survey October 2018. Overnight stays in non-hotel tourist accommodation decrease by 2.4% in October, as compared to the same month of 2017 Overnight
Easter boosts results in tourism accommodation
 14 June 2017 Tourism Activity April 2017 Easter boosts results in tourism accommodation Hotel establishments recorded 1.9 million guests and 5.1 million overnight stays in April 2017, figures that relate
The Health Care System in Italy and Lombardy. Alberto Daprà Vice Chairman Lombardia Informatica
 The Health Care System in Italy and Lombardy Alberto Daprà Vice Chairman Lombardia Informatica Lodz 20 September 2011 Lombardy Region Is one of the twenty Italian Regions About 16% of Italy s citizens
Preliminary results for 2017 point to increases of 8.9% in guests and 7.4% in overnight stays
 14 February 2018 Tourism Activity December 2017 Preliminary results for 2017 point to increases of 8.9% in guests and 7.4% in overnight stays Hotel establishments recorded 1.2 million guests and 2.7 million
Project description Environmental issues Beneficiaries Administrative data Read more
 TOURLINK - Demonstrating how an integrated ecolabeling and tour operating supply chain management strategy can foster sustainability in tourism LIFE04 ENV/NL/000661 Project description Environmental issues
The RSPB National Swift Inventory Annual Report 2014
 The RSPB National Swift Inventory Annual Report 2014 Welcome to our first annual report outlining the data collated from the public and birding groups around the UK on common swifts Apus apus. We hope
Projects and EUSALP. European Regional Development Fund
 Projects and EUSALP European Regional Development Fund INTERREG ALPINE SPACE PROGRAMME PRIORITIES Alpine Space Alpine Space Alpine Space Alpine Space EUSALP ACTION GROUPS To develop an effective research
Governing Board of Enlarged Partial Agreement on Cultural Routes Luxembourg Strengthening the EPA on Cultural Routes: Possible future synergies
 Governing Board of Enlarged Partial Agreement on Cultural Routes Luxembourg Strengthening the EPA on Cultural Routes: Possible future synergies Mr. Patrick Torrent, NECSTouR President ptorrent@gencat.cat
Overnight stays in non-hotel tourist accommodation increase 19.9% (1) in March, as compared with the same month of 2012
 in March, as compared with the same month of 2012") Non-Hotel Tourist Accommodation Occupancy Survey March 2013. 30 April 2013 Overnight stays in non-hotel tourist accommodation increase 19.9% (1) in March, as compared with the same month of 2012 Overnight
Non-Hotel Tourist Accommodation Occupancy Survey March 2013. 30 April 2013 Overnight stays in non-hotel tourist accommodation increase 19.9% (1) in March, as compared with the same month of 2012 Overnight
4th GRADE MINIMUM CONTENTS-SOCIAL SCIENCE UNIT 8: WHERE WE LIVE: ADMINISTRATIVE DIVISION
 4th GRADE MINIMUM CONTENTSSOCIAL SCIENCE UNIT 8: WHERE WE LIVE: ADMINISTRATIVE DIVISION WHERE IS SPAIN? Spain is a country in southwest Europe. Spanish territory is the land that belongs to Spain. It consists
Spain received 7.6 million international tourists in October, 5.0% more than in the same month of 2017
 03 December 2018 Statistics on Tourist Movement on Borders (FRONTUR) October 2018. Provisional data Spain received 7.6 million international tourists in October, 5.0% more than in the same month of 2017
Tabular statement. Yearly Meeting of the Religious Society of Friends (Quakers) in Britain
 in Britain") Yearly Meeting of the Religious Society of Friends (Quakers) in Britain Tabular statement Compiled for Yearly Meeting, Friends House, London, 27 30 May 2016 Membership patterns in Britain Yearly Meeting
Yearly Meeting of the Religious Society of Friends (Quakers) in Britain Tabular statement Compiled for Yearly Meeting, Friends House, London, 27 30 May 2016 Membership patterns in Britain Yearly Meeting
Property Investment Guide: Leicester
 Property Investment Guide: Essential investment information sourcedleicester.com Introduction RANKED THE 5TH BEST PLACE TO INVEST Hi My name is Sam Ballard and I am the Director of Sourced, an investment
Spain received 4.4 million international tourists in February, 3.8% more than in the same month of 2018
 2 April 2019 Tourist Movement on Borders Survey (FRONTUR) February 2019. Provisional data Spain received 4.4 million international tourists in February, 3.8% more than in the same month of 2018 Spain received
Road Casualties in Great Britain Main Results: 2004
 Road Casualties in Great Britain Main Results: 2004 SB (05) 26 A National Statistics publication produced by Transport Statistics: DfT National Statistics are produced to high professional standards set
Passenger Transport Statistics January Provisional data
 9 March 2010 Updated at 2:30 p.m. Passenger Transport Statistics January 2010. Provisional data Main results The number of passengers using city transport decreases 3.4% in January 2010, as compared with
Marketing opportunities. UCAS 2019 higher education exhibitions
 Marketing opportunities UCAS 2019 higher education exhibitions Increase your impact at our exhibitions Choose from a series of marketing packages, focusing on making an initial, engaging connection. Then,
Overnight stays in hotel establishments register an increase of 0.8% in October, as compared to the same month of 2017
 23 November 2018 Hotel Tourism Short-Term Trends (HOS/HPI/IPHS) October 2018. Provisional data Overnight stays in hotel establishments register an increase of 0.8% in October, as compared to the same month
Road Casualties in Great Britain Main Results: 2005
 Road Casualties in Great Britain Main Results: 2005 SB (06) 26 A National Statistics publication produced by Transport Statistics: DfT National Statistics are produced to high professional standards set
Firearms licensing contacts (England and Wales) Tuesday, 21 October 2014
 Tuesday, 21 October 2014") Firearms licensing contacts (England and Wales) Tuesday, 21 October 2014 Avon & Somerset Licensing Bureau (F) The Bridewell PO Box 3115 Bristol BS1 9GF Phone: 01179 455175 Fax: 01179 455532 E: firearms.licensing@avonandsomerset.pnn.police.uk
Firearms licensing contacts (England and Wales) Tuesday, 21 October 2014 Avon & Somerset Licensing Bureau (F) The Bridewell PO Box 3115 Bristol BS1 9GF Phone: 01179 455175 Fax: 01179 455532 E: firearms.licensing@avonandsomerset.pnn.police.uk
ARTIGIANO IN FIERA Key Points
 ARTIGIANO IN FIERA 2016 Key Points THE FAIR Analysis and figures THE LARGEST TRADE FAIR (B2C) IN THE WORLD Key Points AF 2016 The fair 3 9 HALLS: THE INTERNATIONAL CRAFTS SELLING EXHIBITION Key Points