DP Contributed 62% of Core Profit
|
|
|
- Prosper Weaver
- 5 years ago
- Views:
Transcription

1 DP Contributed 62% of Core Profit The Wharf (Holdings) Limited 2018 Interim Results 9 August 2018 Stock Code: 0004
2 Financial Highlights Unadjusted Comparison HKD Million 1H18 1H17 # 1H18 Group 1H17 (Ex. WREIC) % Chg Wharf REIC (WREIC) was Demerged in Nov 17. Accordingly, 2017 Comparatives have been Adjusted to Make Comparison Meaningful Group Revenue 7,823 17,063 7,823 7,517 +4% Operating Profit 2,768 8,553 2,768 1, % Core Profit* 2,527 7,438 2,527 2,792-9% Profit Attributable to Shareholders 2,860 8,441 2,860 3,541-19% Earnings Per Share (HKD) - Attributable to Shareholders - Core* % -10% Dividend Per Share (HKD) N/A N/A Core Profit -9%: DP -24% (62% of Total) Partly due to Timing Differences Logistics -21% (9% of Total) All Other Segments Improved IP Revaluation Surplus $369M Listed Investments^(Mkt Value $29.0B; Unrealized Surplus $1.0B) *Core Profit - Excl. IP Revaluation Surplus & Exceptional Items ^ Excl. the 25% interest in Greentown China Holdings Limited # Reflects Actual 1H17 Results Without Restatement NAV $142.5B ($46.77/Share) 1
3 Property-focused 72% of 82% of 83% of Focused Strategy Revenue Operating Profit Core Profit Selective & Disciplined Approach Total Revenue Operating Profit Core Profit China DP 50% Properties 72% HK Properties 1% China DP 48% Properties 82% HK Properties 2% China DP 35% Properties 83% HK Properties 28% $7,823 M China IP $2,768 M China IP $2,527 M +4%* 21% +84%* 32% -9%* China IP 20% Others 28% Others 18% Others 17% *Excl. WREIC in 1H17 2
4 Core Profit (Adjusted for Impact of Demerger) Unadjusted Comparison HKD Million 1H18 1H17 # 1H18 1H17 (Ex. WREIC) Group % Chg % of 1H Total HK Properties 716 5, % 28% China DP 892 1, ,194-25% 35% China IP % 20% Others % 17% Total 2,527 7,438 2,527 2,792-9% 100% Core Profit - Excl. IP Revaluation Surplus & Exceptional Items # Reflects Actual 1H17 Results Without Restatement 3
5 Segment Assets Total Business Assets Properties 90% of Total Properties 90% HK Properties 21% Total Business Assets $184.2 B as of End-Jun 18 Total China DP 34% Business Assets $184.2 B China IP 35% Others 10% 4
6 Agenda Hong Kong Properties China DP China IP Others Financial Management
7 Agenda Hong Kong Properties China DP China IP Others Financial Management
 Accumulated Sales* 13 Houses 32 Apartments $94,300 psf (Average) $87,200 psf (Average) Accumulated Total Proceeds $22.7B (Gross Basis) Accumulated Attributable Profit Booked $4.")
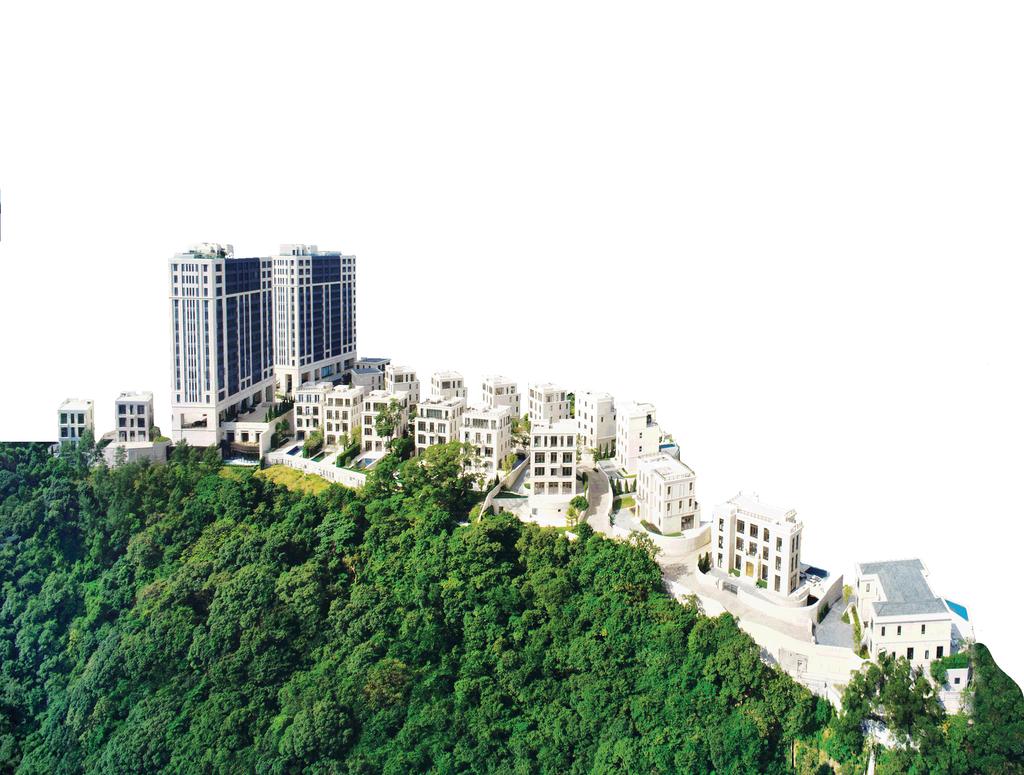
8 Mount Nicholson Extreme- Unique Most Valuable Mount Nicholson luxury Project in Asia Launch Date 1Q 2016 Product Type 19 Houses (6,000-10,000 s.f) 48 Apartments (4,200-4,500 s.f) Accumulated Sales* 13 Houses 32 Apartments $94,300 psf (Average) $87,200 psf (Average) Accumulated Total Proceeds $22.7B (Gross Basis) Accumulated Attributable Profit Booked $4.7B* *Up to Jun 30,
 1H18 Sales* 2 Houses 2 Apartments $126,700 psf (Average)")
 * Accumulated Sales up to Jun 30, 2018 # 1 House Sold")
9 Mount Nicholson Remarkable Luxury Residential Sales House 2 Sold for $1.4B ($151,800 psf) 1H18 Sales* 2 Houses 2 Apartments $126,700 psf (Average) $128,400 psf (Average) Total Proceeds $3.3B # (Gross Basis) * Accumulated Sales up to Jun 30, 2018 # 1 House Sold in 1H18 will be Recognized in 2H18 8
10 Landbank Exclusive Portfolio Growth Potential Total Attributable GFA Peak Portfolio Kowloon East Waterfront Mount Nicholson 1 & 11 Plantation Road Portfolio ( KEWP ) Kowloon Godown Peak Portfolio 10% Kowloon Tong Portfolio 15% 77 Peak Road Yau Tong Bay (15% JV) Chelsea Court Peninsula East Strawberry Hill Kowloon Tong Portfolio 3.0M s.f Others 18% Residential Land Site on Lung Cheung Road KEWP* 57% * Kowloon Godown: GFA of Existing Building as of Jun 30,

11 Agenda Hong Kong Properties China DP China IP Others Financial Management 10
12 Administrative Measures are Distorting the Market Policy- Sellable Sales Target 1H18 Contracted Sales* Driven Market 1.0M s.m* RMB22B * Sales RMB7.2B -36% GFA 0.3M s.m -40% ASP is Controlled through Presale Consent ASP RMB23,500 psm +5% Underlying Demand Remains Robust Eastern China 1H18 Accumulated Sell-through Rate 96% 59% Contracted Choice between (a) Selling at Sub-market ASP or Sales* Western China 31% (b) Waiting for Consent to Sell at Market ASP RMB7.2B * Incl. JVs & Associates on an Attributable Basis; 2017 Comparatives Excl. Contribution from HCDL Southern & Others10% 11
13 Improved Margin Operating Margin Group Core Profit Lower 1H18 Operating Matrix* ppts 35% Completion Revenue $5,792M -15% Operating Profit $1,838M +45% Operating Margin 31.7% ppts Consecutive Improvement in Margin Net Order Book RMB21.3B or 0.9M s.m Completed GFA 96,600 s.m -66% Recognized GFA 182,300 s.m -58% 2018 Target Completion 0.8M s.m * Incl. JVs & Associates on an Attributable Basis; 2017 Comparatives Excl. Contribution from HCDL 12
14 Landbank Sound Financial Six Landbank 1H18 Land Acquisition* Position Focus Cities 3.8M s.m High Barrier in Tier-1 Cities Progress in Hangzhou & Suzhou in 1H18 Suzhou 49% 677,300 s.m Hangzhou 31% Tight Credit Environment may Change the Landscape in 2H18 Guangzhou 4% Foshan 17% *Detailed China DP Land Acquisition Breakdown See Appendix 13
15 Agenda Hong Kong Properties China DP China IP Others Financial Management 14
16 China IP Commercial Properties Completion Schedule ( 000 s.m) 3.5x 3,146 Changsha IFS , Wuxi IFS Chongqing IFS* Chengdu IFS Other China Commercial Prop. Total Development Area, Incl. Basement Area & Carpark *Gross Basis & Net of Recognized Sales 15
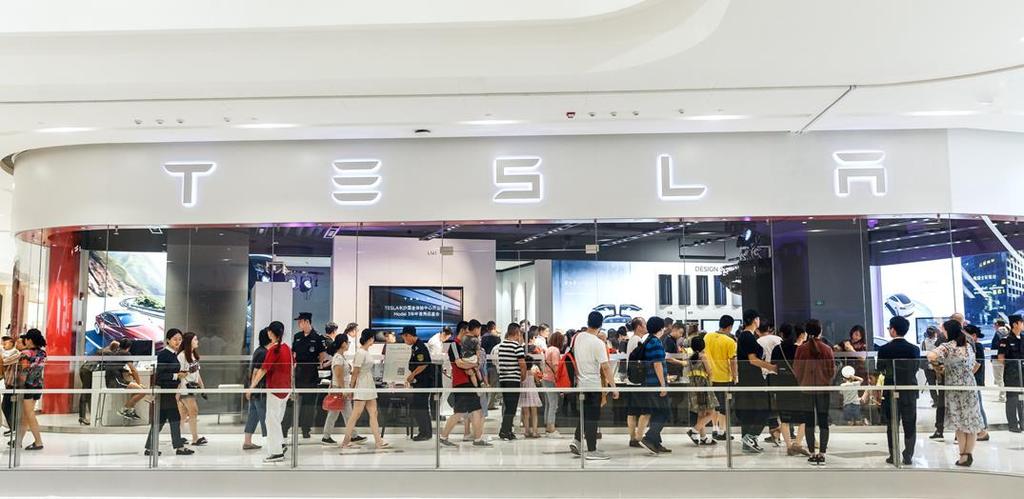
17 Momentum Domestic IFS Growth China IP Revenue (HKD billion) Consumption Series Potential $1.6B (+29%) 1H 2H China GDP +6.8% in 1H18 (78% Consumption) Strong Retail Sales Driving Mall Performance 1.2 New Strategic Focus - IFS Series Broaden Future Recurring Income Base

18 Growth Driver CSIFS Opened Leased Retailtainment Changsha IFS Mall May % Experience GFA (s.m.) 246,100 Retail Area Leased 97% Retail Retail Shops (70+ Hunan Debuts, 30+ Duplex Flagships) Retail Opening Rate 84% First Day Foot Traffic 150,000+ Average Monthly Sales* RMB 200M+(>2x of CDIFS at full operation) Office - Most Coveted Address for Leading Corporates Hotel (Niccolo Changsha) - Opening in 4Q18 *Average Monthly Sales in Jun & Jul 2018 (First 2 Full Months after Opening) 17

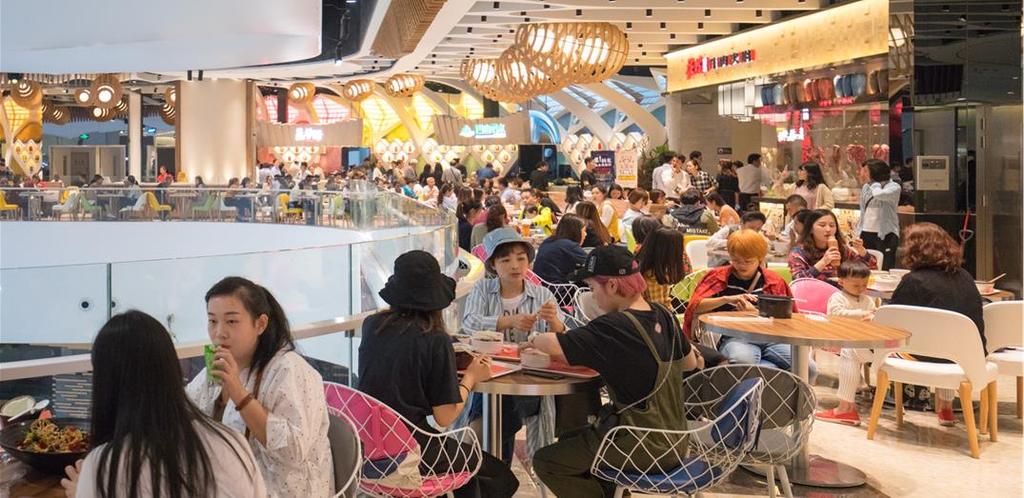
19 CSIFS Mall 18
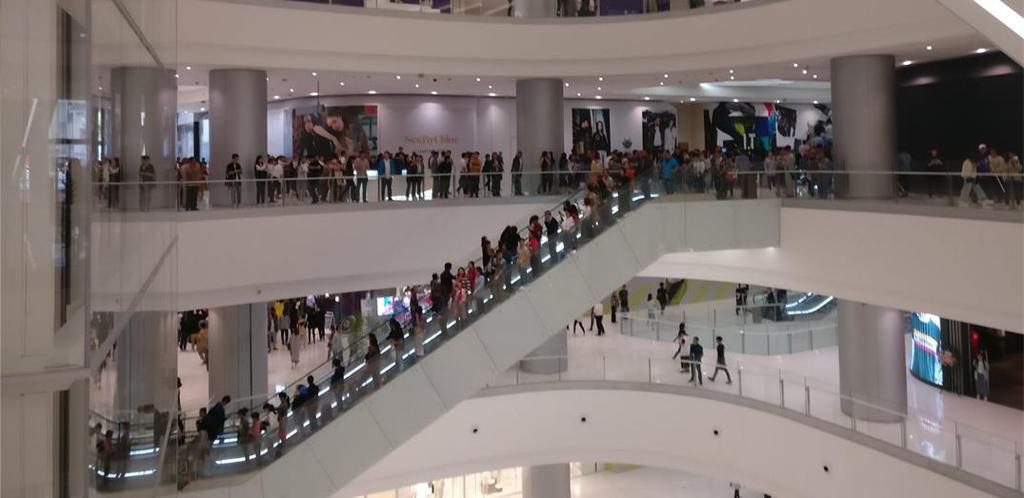
20 Ground Zero CDIFS Outperform Sales Growth Double-digit Chengdu IFS Mall Market +23% Rental Reversion Net Revenue (Net of Tax) RMB431M (+17%) Foot Traffic Growth +19% Turnover Rent Portion 28% Retail - Growth Momentum Continued Office - 73% Committed; Rental Rates among the City s Highest Hotel (Niccolo Chengdu) - Market Leader in Yield Occupancy Cost* 13% Retail Sales (RMB billion) RMB2.9B (+23%) 1H 2H 2.6 per Available Room *Occupancy Cost = Retail Rental/ Retail Sales

 - Iconic")
21 New CBD CQIFS New Ramping Luxury Chongqing IFS Mall Landmark Up Cluster GFA (s.m.) 109,300 # Retail Area Leased 96% Retail Opening Rate 91% Retail - Sales RMB355M Office - 40+% Committed Hotel (Niccolo Chongqing) - Iconic Sky Hotel # CQIFS is 50%-owned, 109,300 s.m is Total Retail Area 20
22 Agenda Hong Kong Properties China DP China IP Others Financial Management 21
23 Hotel Management Niccolo Hong Kong Mainland Philippines A) The Murray, Hong Kong B) Chengdu* C) Chongqing* D) Changsha (4Q18)* E) Suzhou (2019) I Marco Polo F) Hong Kong I) Beijing (Parkside) P) Manila (Ortigas) G) Gateway J) Changzhou, Jiangsu Q) Cebu B C D K J E H) Prince K) Wuhan* R) Davao L) Jinjiang, Fujian N A O F M L M) Xiamen G H P N) Foshan (LingnanTiandi) O) Shenzhen Q R * Owned by The Wharf (Holdings) Limited 22
24 Logistics Rebuild Competitiveness External Uncertainties Enhance Efficiency Trade Tension Modern Terminals Revenue $1,251M (-8%) Operating Profit $242M (-31%) Throughput (million TEUs) HK 2.6-2% DCB (65%-owned) 0.6* +7% SCT (20%-owned) 2.8* +4% Improve Margin Rebuilding Competitiveness Total % *Total Throughput (Instead of Attributable) Market Throughput: Kwai Tsing: -4%; Shenzhen: +4% Hong Kong Air Cargo Terminals Ltd (HACTL) Total Throughput 0.8M Tonnes (-10%) 23
25 CME2 Opportunity Strategy Long-term New Economy Re-Invest Capital Released from CME1* in a Small Market CME2 (Larger Markets with Greater Potential) Strategic Initiative & Infrastructure Play Building Long-term Business for New Economy *CME1 was Hong Kong-based Business with Market Size Limit 24
26 Agenda Hong Kong Properties China IP China DP Others Financial Management 25
27 Prudent Financial Management 20.1% $29.3B 70% Gearing Group Net Debt Floating Rate Debt Jul18-Jun19 Jul19-Jun20 Jul20-Jun21 Jul21-Jun22 Jul22-Jun23 Jul23 & After Debt Maturity (HKD billion) 26
 Niccolo Suzhou")
28 Coming Attractions Mount Nicholson Niccolo Changsha (4Q18) Niccolo Suzhou (2019) 27


29 CSR OUR SUSTAINABILITY


30 CSR Report Wharf Holdings 4 th standalone Sustainability/CSR Report 2017 published in accordance with the core option of GRI Standards, and in alignment with HKEX ESG Reporting Guide Hang Seng Corporate Sustainability Index Series Member Recognitions Hong Kong Quality Assurance Agency s CSR Index Plus 5 Years Plus Caring Company Logo Project WeCan Partner Signature multi-faceted project, currently linking 53 schools and over 50,000 students with 45 corporate and community partners, will be expanded to cover 76 schools by September GRI Standards stand for Global Reporting Initiative Sustainability Reporting Standards


31 2017 Sustainability Performance Highlights Hang Seng Corporate Sustainability Index Series Member Recycled 2,460+ tonnes waste 8,800 talent* 75,208 training hours* 223+ events and activities supported* Donations totalling HK$30 million The Wharf Holdings Sustainability Report 2017 is prepared in accordance with the core option of Global Reporting Initiative Sustainability Reporting Standards. *Reporting scope covers HK and China operations as identified in the report.
32 Appendix 31
33 Summary of HK Properties Portfolio Usage Status Locations Attributable GFA (s.f.) 1. Peak Portfolio Residential Sales Mount Nicholson (50%-JV) 52,100 Lease Chelsea Court 43,100 Strawberry Hill 13,300 Redevelopment 1 Plantation Road 90, Plantation Road 46, Peak Road 42,200 Sub-total 287, Kowloon East Waterfront Portfolio Commercial Sales Peninsula East 42,600 Industrial Redevelopment Kowloon Godown # 1,032,200 Residential Development Yau Tong Bay (15%-JV) 608,200 Sub-total 1,683, Non-Core Commercial Lease Cable TV Tower Units 566, Kowloon Tong Portfolio Residential Development Kowloon Tong 436,400 Total 2,973,400 As of Jun 30, 2018 ; # GFA of Existing Building 32
34 China Contracted Sales Breakdown by City Region City Contracted Sales (%) GFA Sold (%) Eastern China Shanghai 0% 0% Suzhou 1% 1% Wuxi 28% 37% Ningbo 0% 0% Hangzhou 37% 21% Eastern China Sub-Total: 66% 59% Western China Chengdu 1% 1% Chongqing 23% 30% Western China Sub-Total: 24% 31% Southern China Foshan & Guangzhou 3% 5% Others Beijing 2% 1% Tianjin, Dalian & Wuhan 5% 4% Southern & Others Sub-Total: 10% 10% 33
35 China Key Projects on Sales in 1H18 Projects City Attributable Proceeds (RMB M) Attributable GFA sold (s.m) Average Price (RMB psm) Ownership The Throne Chongqing 1,492 77,300 19,100 50% Wuxi Glory of Time Wuxi 1,013 50,600 19, % Exquisite Palace Hangzhou ,400 39, % River Pitti (Bi Xi) Wuxi ,300 18, % Willow Breeze Hangzhou 577 7,100 77,500 50% Wuxi Times City Wuxi ,100 17, % Dalian Taoyuan Lane Dalian ,700 24,000 60% Longfor Mansion Hangzhou 327 9,200 31,500 23% 34
36 China DP 1H18 New Land Acquisitions City Date Attributable GFA (s.m) Attributable Consideration (RMB) Ownership Foshan Jan , B 50% Guangzhou Jan-18 7, B 10% Jan-18 21, B 18% Jan-18 98, B 50% Hangzhou Jan-18 51, B 75% Jan-18 31, B 75% Feb-18 29, B 26% Feb-18 99, B 80% Suzhou Feb , B 100% Feb-18 56, B 49% Total 677, B 35
37 China DP Land Bank Breakdown by City in 1H18 Region City GFA million (s.m) % Total Eastern China Shanghai 0.1 3% Suzhou % Wuxi % Ningbo 0.0 1% Hangzhou % Eastern China Sub-Total: % Western China Chengdu % Chongqing % Western China Sub-Total: % Southern China Foshan & Guangzhou % Others Beijing 0.2 5% Tianjin, Dalian & Wuhan 0.1 3% Southern & Others Sub-Total: % Total: % 36
38 China Key Properties Completion Projects Attributable GFA (s.m) Key Completion in 1H18 Foshan Unique Garden 34,300 Beijing The Pearl on the Crown 28,200 Chengdu ICC 26,000 Projected Key Completion in 2H18 Wuxi Times Glory 123,400 Suzhou Bellagio, G09 ( 碧堤半島 ) 82,500 Wuxi Times City 79,700 Suzhou Bellagio, G08 ( 碧堤雅苑 ) 75,800 Wuxi River Pitti (Bi Xi) 64,400 37
39 China New Projects for Sales in 2H18 Projects City Ownership Beijing Xijucun Land Site Beijing 100% Beijing Liangma K Land Site Beijing 40% Suzhou Huangqiao 25 Land Site Suzhou 60% Jingan Garden Shanghai 55% 38
40 Overview of Application of Funds Major Capital & Development Expenditure HKD 1H18 (Actual) FY18 (Projected) Hong Kong Properties 12.6B 13.5B China IP 2.2B 2.6B China DP 20.3B 31.1B Others 0.1B 0.5B Total 35.2B 47.7B * China DP Self-financed by Sales; China IP Mainly IFS Under Construction 39
41 DP Contributed 62% of Core Profit Thank You 40
42 End of Presentation The Wharf (Holdings) Limited [HKEx Stock Code: 0004.HK] Disclaimer 1) All information and data are provided for information purposes only. All opinions included herein constitute Wharf s judgment as of the date hereof and are subject to change without notice. The Group, its subsidiaries and affiliates hereby disclaim (i) all express, implied, and statutory warranties of any kind to user and/or any third party including warranties as to accuracy, timeliness, completeness, or fitness for any particular purpose; and (ii) any liability whatsoever for any loss howsoever arising from or in reliance upon the whole or any part of the information and data contained herein. 2) The full-year statutory financial information of preceding financial years quoted in this presentation are derived from statutory annual financial statements for that relevant financial years, each of which had been delivered to Registrar of Companies in accordance with the prevailing Companies Ordinance and were reported on by the auditors with relevant auditors reports without qualification or modification. 41
Property Sales Drive the Continuing Business. The Wharf (Holdings) Limited 2017 Final Results 8 March 2018
 Limited 2017 Final Results 8 March 2018") Property Sales Drive the Continuing Business The Wharf (Holdings) Limited 2017 Final Results 8 March 2018 1 Financial Highlights HKD Million 2017 2016 Group Revenue 43,273 46,627 Operating Profit 20,622
Property Sales Drive the Continuing Business The Wharf (Holdings) Limited 2017 Final Results 8 March 2018 1 Financial Highlights HKD Million 2017 2016 Group Revenue 43,273 46,627 Operating Profit 20,622
Properties Growth Continues. The Wharf (Holdings) Limited 2016 Final Results 9 March 2017
 Limited 2016 Final Results 9 March 2017") Properties Growth Continues The Wharf (Holdings) Limited 2016 Final Results 9 March 2017 1 Overview Backdrop Group Core Profit +25% to $13.8B Properties Share 92% (2015: 88%) due to 31% Growth IP 6% Growth
Properties Growth Continues The Wharf (Holdings) Limited 2016 Final Results 9 March 2017 1 Overview Backdrop Group Core Profit +25% to $13.8B Properties Share 92% (2015: 88%) due to 31% Growth IP 6% Growth
IP Earnings Anchored 14% Growth in Group Core Profit
 IP Earnings Anchored 14% Growth in Group Core Profit The Wharf (Holdings) Limited 2016 Interim Results 10 Aug 2016 1 Backdrop Leading Landlord with a Valuable & Resilient IP Profile Superior Assets & Proven
The Wharf (Holdings) Limited
 Limited") IP Momentum Continues as The Wharf (Holdings) Limited Macro Environment Causes Concern 2015 Interim Results 18 August 2015 1 IP Book Value (HKD billion) 350 300 Quality Landlord 250 200 New High $307B
IP Momentum Continues as The Wharf (Holdings) Limited Macro Environment Causes Concern 2015 Interim Results 18 August 2015 1 IP Book Value (HKD billion) 350 300 Quality Landlord 250 200 New High $307B
Record Retail Sales Drove Robust Performance. Wharf Real Estate Investment Company Limited 2018 Interim Results 7 Aug 2018
 Record Retail Sales Drove Robust Performance Wharf Real Estate Investment Company Limited 2018 Interim Results 7 Aug 2018 Highlights 999-year Land Leases Offer a Differentiation* HKIP & Hotel 6 Core Assets
IP Demerger in Progress. The Wharf (Holdings) Limited 2017 Interim Results 9 Aug 2017
 Limited 2017 Interim Results 9 Aug 2017") IP Demerger in Progress The Wharf (Holdings) Limited 2017 Interim Results 9 ug 2017 1 1. Interim Results 2. Strategic Review 2 Backdrop Overview Underlying Profit Increased by 22% to $7,271M Stable IP
IP Demerger in Progress The Wharf (Holdings) Limited 2017 Interim Results 9 ug 2017 1 1. Interim Results 2. Strategic Review 2 Backdrop Overview Underlying Profit Increased by 22% to $7,271M Stable IP
Group Profit $35.9B, +22% The Wharf (Holdings) Limited 2014 Final Results 16 March 2015
 Limited 2014 Final Results 16 March 2015") Group Profit $35.9B, +22% The Wharf (Holdings) Limited 2014 Final Results 16 March 2015 1 IP Book Value 10-yr CAGR +16% 350 Wharf IP Book Value (HKD billion) 10-year CAGR ~16% 300 250 Quality Retail Property
Group Profit $35.9B, +22% The Wharf (Holdings) Limited 2014 Final Results 16 March 2015 1 IP Book Value 10-yr CAGR +16% 350 Wharf IP Book Value (HKD billion) 10-year CAGR ~16% 300 250 Quality Retail Property
Record year from Building for Tomorrow
 Record year from Building for Tomorrow The Wharf (Holdings) Limited 2012 Annual Results 26 March 2013 Highlights Core profit exceeded HK$11B, 37% over 2011. A record for Wharf. Attributable profit HK$47B,
The Wharf (Holdings) Limited. Interim Results. 15 August 2007
 Limited. Interim Results. 15 August 2007") The Wharf (Holdings) Limited Interim Results 15 August 2007 Key Recaps for Interim 2007 Properties continued to be the growth driver: turnover: HK$5,031M, +74; profit: HK$3,191M, +68 Core properties Harbour
The Wharf (Holdings) Limited Interim Results 15 August 2007 Key Recaps for Interim 2007 Properties continued to be the growth driver: turnover: HK$5,031M, +74; profit: HK$3,191M, +68 Core properties Harbour
The Wharf (Holdings) Limited
 Limited") The Wharf (Holdings) Limited Established 1886 Wheelock Square Shanghai December The Wharf 2011 (Holdings) Limited 1 Wharf Corporate Profile Established in 1886 with a distinguished history of Building
The Wharf (Holdings) Limited Established 1886 Wheelock Square Shanghai December The Wharf 2011 (Holdings) Limited 1 Wharf Corporate Profile Established in 1886 with a distinguished history of Building
WHEELOCK. FY2008 Results Highlights WHEELOCK AND COMPANY LIMITED
 2008 Annual Results WHEELOCK FY2008 Results Highlights WHEELOCK AND COMPANY LIMITED 2 Results Highlights Consolidation Wheelock & Co changed its financial year-end date from 31st Mar to 31st Dec at the
Wheelock and Company Limited The Wharf (Holdings) Limited Interim Results 27 August 2008
 Limited Interim Results 27 August 2008") Wheelock and Company Limited The Wharf (Holdings) Limited 27 August 2008 Consolidation In 2007, Wheelock changed its financial year end date from 31st Mar to 31st Dec to coincide with that of Wharf Accordingly,
Wheelock and Company Limited The Wharf (Holdings) Limited 27 August 2008 Consolidation In 2007, Wheelock changed its financial year end date from 31st Mar to 31st Dec to coincide with that of Wharf Accordingly,
Wheelock and Company Limited The Wharf (Holdings) Limited. 28 November 2007 Analyst Briefing
 Limited. 28 November 2007 Analyst Briefing") Wheelock and Company Limited The Wharf (Holdings) Limited 28 November 2007 Analyst Briefing Wheelock s Results (for 6-month period ended 30.9.07) Consolidation Wharf s financial statements were fully consolidated
Wheelock and Company Limited The Wharf (Holdings) Limited 28 November 2007 Analyst Briefing Wheelock s Results (for 6-month period ended 30.9.07) Consolidation Wharf s financial statements were fully consolidated
Post-Demerger The Wharf (Holdings) Limited (Stock Code: 0004.HK) Investor Presentation 10 Nov 2017
 Limited (Stock Code: 0004.HK) Investor Presentation 10 Nov 2017") Post-Demerger The Wharf (Holdings) Limited (Stock Code: 0004.HK) Investor Presentation 10 Nov 2017 1 Wharf to Demerge into Two Listed Sister Companies 0020.HK 0020.HK 62% 62% 62% Future Wharf REIC 0004.HK
Post-Demerger The Wharf (Holdings) Limited (Stock Code: 0004.HK) Investor Presentation 10 Nov 2017 1 Wharf to Demerge into Two Listed Sister Companies 0020.HK 0020.HK 62% 62% 62% Future Wharf REIC 0004.HK
BUSINESS REVIEW HONG KONG PROPERTIES
 BUSINESS REVIEW HONG KONG PROPERTIES Contracted residential sales reached a new record of HK$23.4 billion, representing 131% growth compared to the same period in 2017 and surpassed the 2017 full year
2016 Half-Yearly Results
 Presentation 29th July 2016 2016 Half-Yearly Review Underlying profit down 6% Commercial portfolio benefited from higher occupancy Steady contribution from mainland China residential business Profit attributable
Positive rental reversions in Hong Kong portfolio. Rising contribution from Singapore office portfolio. Strong performance from Residential business
 2012 Review The Group performed well in 2012 Positive rental reversions in Hong Kong portfolio Rising contribution from Singapore office portfolio Strong performance from Residential business 2 Highlights
2017 Half-Yearly Results
 2017 Half-Yearly Results Presentation 4th August 2017 Agenda Speakers: Robert Wong, Chief Executive & Simon Dixon, Chief Financial Officer 1. 2017 Half-Yearly Highlights 2. Investment Properties 3. Development
Wheelock and Company Limited The Wharf (Holdings) Limited. 26 March 2008 Analyst Briefing
 Limited. 26 March 2008 Analyst Briefing") Wheelock and Company Limited The Wharf (Holdings) Limited 26 March 2008 Analyst Briefing Wheelock s Results (for 9-month period ended 31.12.07) Consolidation Wheelock has changed its financial year-end
Wheelock and Company Limited The Wharf (Holdings) Limited 26 March 2008 Analyst Briefing Wheelock s Results (for 9-month period ended 31.12.07) Consolidation Wheelock has changed its financial year-end
2017 Results 2018 Half-Yearly Results
 2017 Results 2018 Half-Yearly Results Presentation Presentation 27 July 2018 Agenda Speakers: Robert Wong, Chief Executive & Simon Dixon, Chief Financial Officer 1. 2018 Half-Yearly Highlights 2. Investment
CapitaLand Analysts/Media Trip 2016 CapitaLand China. Mr. Lucas Loh, CLC CEO, Co-ordinating CEO China
 CapitaLand Analysts/Media Trip 2016 CapitaLand China Mr. Lucas Loh, CLC CEO, Co-ordinating CEO China 20 November 2016 Contents 1 2 3 4 5 6 CLC Portfolio Overview Key Business Highlight Residential Key
CapitaLand Analysts/Media Trip 2017
 CapitaLand Analysts/Media Trip 2017 Mr. Lucas Loh CEO, CapitaLand China; Co-ordinating CEO China 2 July 2017 Contents 1 2 3 Key Highlights Business Overview Concluding Remarks 2 3 1 Key Highlights Successful
Presentation Results. 4th March 2016
 Presentation 4th March 2016 2015 Review Sound result in 2015 Continued strong performance from commercial portfolio Entry into Shanghai with prime mixed-use site Stable asset values 1 Highlights 2014 2015
Retail Drives IP Cashflow. Wharf Real Estate Investment Company Limited 2017 Final Results 5 March 2018
 Retail Drives IP Cashflow Wharf Real Estate Investment Company Limited 2017 Final Results 5 March 2018 1 Overview 6 Unique Properties at Prime Locations 97% 2017 Group Business Assets Diamond Hill Harbour
Interim Results Presentation. 27 March 2008
 Interim Results Presentation 27 March 2008 Contents Page Group structure Results snapshot Review of operations Hong Kong China Market outlook Looking ahead Investor contact 3 4-7 8-10 11-14 15 16 18-2
Air China Limited Annual Results. March Under IFRS
 Air China Limited 21 Annual Results Under IFRS March 211 Agenda Part 1 Highlights Part 2 Business Overview Part 3 Financial Overview Part 4 Outlook 2 Part 1 Highlights Steady Economic Growth; Asia Pacific
Executive Directors Review
 Financial Summary Turnover for the year ended 31 December 2011 amounted to HK$571.4 million ( 47.6 million) (2010: HK$706.8 million ( 58.7 million)). The turnover was principally attributable to the recognition
CapitaLand Limited Acquisition: 3 rd Raffles City Integrated Development in Shanghai. 13 November 2018
 CapitaLand Limited Acquisition: 3 rd Raffles City Integrated Development in Shanghai 1 13 November 2018 Disclaimer This presentation may contain forward-looking statements that involve risks and uncertainties.
Air China Limited Announces 2009 Annual Results
 Air China Limited Announces 2009 Annual Results Record Operating Profit in Complex Market Environment Strengthened Position to Capture Growth Opportunities Hong Kong April 22, 2010 Air China Limited (
Turnover (excluding hotels) increased by 13% to HK$2,655 million and operating profit by 13% to HK$2,313 million.
 increased by 13% to HK$2,655 million and operating profit by 13% to HK$2,313 million.") BUSINESS REVIEW HONG KONG PROPERTY INVESTMENT Harbour City and Times Square, representing 47% of the Group s business assets and 64% of operating profit, continued to perform strongly. Retail sales conducted
BUSINESS REVIEW HONG KONG PROPERTY INVESTMENT Harbour City and Times Square, representing 47% of the Group s business assets and 64% of operating profit, continued to perform strongly. Retail sales conducted
2017 Results. Presentation. 9 March 2018
 2017 Results Presentation 9 March 2018 Agenda Speakers: Robert Wong, Chief Executive & Simon Dixon, Chief Financial Officer 1. 2017 Results Highlights 2. Investment Properties 3. Development Properties
Investor Newsletter. Building a Future Sharing a Dream. Issue RMB6.1 Billion Contracted Sales Achieved for 2009
 March 2010 Building a Future Sharing a Dream Investor Newsletter Shui On Land (272.HK) Issue 1 2010 1 RMB6.1 Billion Contracted Sales Achieved for 2009 Shui On Land Limited ( SOL ) is pleased to announce
WHEELOCK AND COMPANY LIMITED Interim Report 2001/02. Unaudited Group profit of HK$460.8 million, an increase of 0.1% over last year.
 Unaudited Group profit of HK$460.8 million, an increase of 0.1% over last year. With a well-diversified business portfolio, the Group demonstrated the resilient nature of its operations. Wharf s core office
FY ANNUAL RESULTS
 FY 2 0 1 7 ANNUAL RESULTS I N V E S T O R P R E S E N T A T I O N 16 MARCH 2018 2 RESULTS HIGHLIGHTS DEVELOPMENT PROPERTIES INVESTMENT PROPERTIES FINANCIAL POSITION APPENDIX 1 2 3 4 5 3 RESULTS HIGHLIGHTS
NWDS-CAD-r442/2012. (HK Stock Code: 825)
") NWDS-CAD-r442/2012 (HK Stock Code: 825) Safe Harbour Statement The information contained in our presentation is intended solely for your personal reference. In addition, such information contains projections
NWDS-CAD-r442/2012 (HK Stock Code: 825) Safe Harbour Statement The information contained in our presentation is intended solely for your personal reference. In addition, such information contains projections
2016 HALF YEAR RESULTS. Mandarin Oriental Hotel Group
 2016 HALF YEAR RESULTS Mandarin Oriental Hotel Group 2016 Half Year Results Highlights US $ m June 2016 June 2015 Combined Total Revenue * 644 641 Underlying EBITDA 71 82 * Includes revenue from the Group
GALAXY ENTERTAINMENT GROUP
 GALAXY ENTERTAINMENT GROUP RECORD HALF YEAR GROUP ADJUSTED EBITDA OF $5.8 BILLION, UP 23% YEAR-ON-YEAR NET PROFIT ATTRIBUTABLE TO SHAREHOLDERS GREW 35% TO $4.6 BILLION FURTHER STRENGTHENED LIQUID BALANCE
Press Release [For Immediate Release]
![Press Release [For Immediate Release]](/thumbs/95/126297927.jpg "Press Release [For Immediate Release]") Press Release [For Immediate Release] KWIH Announces 2017 Annual Results Profit Attributable to Shareholders Grew 23% to HK$3.9 billion * * * * * Attributable Contracted Sales Exceeded HK$10 billion for
Press Release [For Immediate Release] KWIH Announces 2017 Annual Results Profit Attributable to Shareholders Grew 23% to HK$3.9 billion * * * * * Attributable Contracted Sales Exceeded HK$10 billion for
CHINA RESOURCES LAND LIMITED
 CHINA RESOURCES LAND LIMITED 2012 Annual Results Review 15 March 2013 Agenda Highlights Financial Review Land Bank Completion Schedule Appendix Highlights Net profit in FY12 rose 30.1% YoY to HK$10,569
WHEELOCK AND COMPANY LIMITED. Annual Report 2000 / Cable TV Tower, Hong Kong
 Cable TV Tower, Hong Kong 26 STEERING AHEAD Driven by strong recurrent earnings and value creation opportunities originating from its investment flagship property at Kowloon Point, Wharf Holdings, Wheelock
Air China Limited Interim Results. August Under IFRS
 Air China Limited 21 Interim Results Under IFRS August 21 1 Agenda 21 Interim Results Overview Business Overview Financial Overview Outlook 2 2 2 21 Interim Results 3 21 Interim Results Overview 4 4 4
OVERSEAS REGULATORY ANNOUNCEMENT
 Hong Kong Exchanges and Clearing and The Stock Exchange of Hong Kong take no responsibility for the contents of this announcement, make no representation as to its accuracy or completeness and expressly
NWS Holdings Announces FY2014 Interim Results
 For immediate release HIGHLIGHTS NWS Holdings Announces FY2014 Interim Results For the six months ended 31 December 2013 2012 Change HK$ million HK$ million +/(-)% Revenue 10,097.8 7,971.0 27 Attributable
Wharf Estates China Limited
 32 The Wharf (Holdings) Limited Annual Report 2004 BUSINESS REVIEW CHINA WHARF CHINA LIMITED Wharf Estates China Limited Balance Sheet (Extract) as at December 31, 2004 HK$M Investment properties 4,605
1Q13 R sults esentation
 1Q13 Results Presentation 14 May 2013 Disclaimer The presentation is dated the day it is given. The delivery of this presentation shall not, under any circumstances, create any implication that there has
PAN PACIFIC HOTELS GROUP LIMITED 2010 FULL YEAR RESULTS BRIEFING 22 FEB 2011
 PAN PACIFIC HOTELS GROUP LIMITED 2010 FULL YEAR RESULTS BRIEFING 22 FEB 2011 2010 RESULTS OVERVIEW STRATEGIC & OPERATIONS HIGHLIGHTS NEO SOON HUP CHIEF FINANCIAL OFFICER 2 CONTENTS Focus and Highlights
HOPEWELL HOLDINGS LIMITED ANNOUNCES FY 2018/19 INTERIM RESULTS
 Press Release HOPEWELL HOLDINGS LIMITED ANNOUNCES FY 2018/19 INTERIM RESULTS Highlights 1H FY19 (1 April to 30 September 2018) First financial year after the change of financial year end date from 30 June
! 1. Press Release [For Immediate Release]
![! 1. Press Release [For Immediate Release]](/thumbs/95/122563776.jpg "! 1. Press Release [For Immediate Release]") Press Release [For Immediate Release] KWIH Announces 2018 Interim Results Record Attributable Contracted Sales To Be Recognised of HK $18.5 Billion Providing Solid Base for Future Profitability * * * *
Press Release [For Immediate Release] KWIH Announces 2018 Interim Results Record Attributable Contracted Sales To Be Recognised of HK $18.5 Billion Providing Solid Base for Future Profitability * * * *
Corporate Presentation
 Corporate Presentation March 2010 NWDS-CAD-r112_Final (HK Stock Code: 825) 1 Safe Harbour Statement The information contained in our presentation is intended solely for your personal reference. In addition,
Investor Meeting Presentation. 4 June 2014
 Investor Meeting Presentation 4 June 2014 COMPANY OVERVIEW 1Q2014 RESULTS OVERVIEW OPERATION HIGHLIGHTS Q&A 2 Founded in 1963, listed on the Singapore Exchange in 1964 Three core businesses: - Property
Megawide Construction Corporation FY 2016 Analysts Briefing 06 April 2017
 Megawide Construction Corporation FY 2016 Analysts Briefing 06 April 2017 FY 2016 CONSOLIDATED HIGHLIGHTS +14% P17.7B Revenue +19% P3.6B EBITDA +30% P1.9B Net Income 1 1 CONSOLIDATED INCOME STATEMENT 2
Retail Drives IP Cashflow. Wharf Real Estate Investment Company Limited 2017 Final Results 5 March 2018
 Retail Drives IP Cashflow Wharf Real Estate Investment Company Limited 2017 Final Results 5 March 2018 1 Overview 6 Unique Properties at Prime Locations 97% 2017 Group Business Assets Diamond Hill Harbour
JOINTLY ANNOUNCES 2017/18 INTERIM RESULTS * * * RENTAL INCOME SURGES 25% STRENGTHS RECURRING INCOME STREAMS FOR SUSTAINABLE GROWTH
 [For Immediate Release] JOINTLY ANNOUNCES 2017/18 INTERIM RESULTS * * * RENTAL INCOME SURGES 25% STRENGTHS RECURRING INCOME STREAMS FOR SUSTAINABLE GROWTH (Hong Kong, 23 November, 2017) Emperor International
Cathay Pacific Airways 2010 Annual Results 9 March 2011
 Cathay Pacific Airways 2010 Annual Results 9 March 2011 1 Annual Result 2010 2009 Change Group Profit/(Loss) HK$14,048m HK$4,694m +199.3% Group Turnover HK$89,524m HK$66,978m +33.7% Profit Margin 15.7%
2008 INTERIM ANNOUNCEMENT
 (Stock Code: 78) 2008 INTERIM ANNOUNCEMENT FINANCIAL HIGHLIGHTS Six months ended 30th June, 2008 (Unaudited) Six months ended 30th June, 2007 (Unaudited) HK$ M HK$ M Revenue 750.8 622.0 Operating profit
Cebu Air, Inc. 4 th Quarter and Full Year 2017 Results of Operations. cebupacificair.com
 Cebu Air, Inc. 4 th Quarter and Full Year 2017 Results of Operations cebupacificair.com Disclaimer The information provided in this presentation is provided only for your reference. Such information has
274% 150% of the Company (HK$ million) Basic earnings per share (HK cent) % Interim dividend per share (HK cent) 5 5
 Basic earnings per share (HK cent) % Interim dividend per share (HK cent) 5 5") Press Release For Immediate Release KWIH 2015 Interim Profit Increased 150% to HK$534 Million Attributable Contracted Sales Surged 5 Times to Approximately HK$8,700 Million in the First Half of the Year
Press Release For Immediate Release KWIH 2015 Interim Profit Increased 150% to HK$534 Million Attributable Contracted Sales Surged 5 Times to Approximately HK$8,700 Million in the First Half of the Year
2006 INTERIM ANNOUNCEMENT
 (Stock Code: 78) 2006 INTERIM ANNOUNCEMENT FINANCIAL HIGHLIGHTS Six months ended 30th June, 2006 (Unaudited) Six months ended 30th June, 2005 % Change (Unaudited) HK$ M HK$ M Revenue 608.3 542.4 +12.1%
1Q2018 Results. Strong organic growth reaffirms our growth strategies
 1Q2018 Results Strong organic growth reaffirms our growth strategies 26 April 2018 1Q2018 Highlights - strong organic growth 2 Total throughput + 37.7% yoy to 27.2 million TEU Equity throughput + 32.5%
Cathay Pacific Airways
 Cathay Pacific Airways Annual Results for the year ended 31 st December 2011 14 March 2012 1 Annual Result 2011 2010 Change Group attributable profit HK$5,501m HK$14,048m -60.8% Group Turnover HK$98,406m
China Railway Construction Corporate Limited 2014 Annual Results
 China Railway Construction Corporate Limited 2014 Annual Results 1 I. Overview Rising Industry Position with Increasing Recognition Moved up to Top 80 of the Fortune Global 500 Ranked Top 2 in ENR Top
Financial Results for the year ended December January Results Overview Capital Management Portfolio Performance AEIs Strategy
 Financial Results for the year ended December 2018 28 January 2019 Results Overview Capital Management Portfolio Performance AEIs Strategy FY2018 Key Highlights Financial Performance Portfolio Performance
Melco International Development Limited (Incorporated in Hong Kong with limited liability) Website : (Stock Code : 200)
 Website : (Stock Code : 200)") Hong Kong Exchanges and Clearing Limited and The Stock Exchange of Hong Kong Limited take no responsibility for the contents of this announcement, make no representation as to its accuracy or completeness
Hong Kong Exchanges and Clearing Limited and The Stock Exchange of Hong Kong Limited take no responsibility for the contents of this announcement, make no representation as to its accuracy or completeness
Scope. Financial highlights. Divisional highlights. Moving forward CHIEF EXECUTIVE OFFICER, FRASERS CENTREPOINT GROUP 15 NOVEMBER 2011
 Mr Lim Ee Seng CHIEF EXECUTIVE OFFICER, FRASERS CENTREPOINT GROUP 15 NOVEMBER 2011 Boathouse Residences Scope Financial highlights Divisional highlights Moving forward Boathouse Residences Financial highlights
F a n t a s i a H o l d i n g s G r o u p C o., L i m i t e d S t o c k C o d e : 1777 N e w s l e t t e r f o r N o v e m b e r, 2017
 Company Operation Information Fantasia: Monthly contracted sales hit a monthly new high Colour Life consolidates Wanxiangmei Property Management Co., Ltd. (5 December, 2017 Hong Kong) Fantasia Holdings
JOINTLY ANNOUNCES 2018/19 INTERIM RESULTS * * * EMPEROR INTERNATIONAL S RENTAL INCOME GROWS 10% TO HK$600M NET PROFIT SURGES 57% TO HK$2.
 ` [For Immediate Release] JOINTLY ANNOUNCES 2018/19 INTERIM RESULTS * * * EMPEROR INTERNATIONAL S RENTAL INCOME GROWS 10% TO HK$600M NET PROFIT SURGES 57% TO HK$2.5B (Hong Kong, 29 November 2018) Emperor
Air China Limited Announces 2010 Interim Results
 Air China Limited Announces 2010 Interim Results Record High First Half Results Leveraging New Opportunities to Drive Growth Hong Kong August 25, 2010 Air China Limited ( Air China or the Company, together
Cebu Air, Inc. 2Q2014 Results of Operation
 Cebu Air, Inc. 2Q2014 Results of Operation 1 Disclaimer This information provided in this presentation is provided only for your reference. Such information has not been independently verified and, as
Emperor Entertainment Hotel Limited (Stock code: 296) 2007/08 Annual Results Announcement July 17, 2008
 2007/08 Annual Results Announcement July 17, 2008") (Stock code: 296) 2007/08 Annual Results Announcement July 17, 2008 0 Core Businesses Macau Casino Hotel Grand Emperor Hotel Shanghai Retail & Hotel Complex Emperor Star City Opened since Jan 2006 To complete
(Stock code: 296) 2007/08 Annual Results Announcement July 17, 2008 0 Core Businesses Macau Casino Hotel Grand Emperor Hotel Shanghai Retail & Hotel Complex Emperor Star City Opened since Jan 2006 To complete
BUSINESS REVIEW AND PROSPECTS
 BUSINESS REVIEW AND PROSPECTS Driven by stable recurrent earnings and value creation opportunities originating from its flagship investment property at Kowloon Point, the Group has successfully built up
15th August Interim Results Analyst Briefing
 15th August 2013 2013 Interim Results Analyst Briefing Brickell CityCentre, Miami, U.S.A. Financial Summary Results Highlights Gross Rental Income Underlying Profit Equity Attri. to Shareholders HK$ M
Air China Limited Announces 2010 Annual Results
 Air China Limited Announces 2010 Annual Results Profit reaches record high on strong economic growth Hong Kong March 29, 2011 Air China Limited ( Air China or the Company, together with its subsidiaries,
THE HONGKONG AND SHANGHAI HOTELS, LIMITED
 To: All Financial/Business/Travel Editors FOR IMMEDIATE RELEASE 24 AUGUST, 2011 THE HONGKONG AND SHANGHAI HOTELS, LIMITED INTERIM RESULTS FOR THE SIX MONTHS ENDED 30 JUNE 2011 HIGHLIGHTS Positive momentum
WHEELOCK PROPERTIES LIMITED (A 74%-OWNED LISTED SUBSIDIARY)
") PROPERTY Bellagio (effectively 74%-owned) Bellagio, in Sham Tseng on the western shore of the New Territories overlooking the Tsing Ma Bridge, is a joint-venture development equally owned by Wheelock,
PROPERTY Bellagio (effectively 74%-owned) Bellagio, in Sham Tseng on the western shore of the New Territories overlooking the Tsing Ma Bridge, is a joint-venture development equally owned by Wheelock,
Corporate Presentation 2012/13 Interim Results
 Corporate Presentation 2012/13 Interim Results 26 February 2013 0 Disclaimer The information contained in this presentation is intended solely for your personal reference. Such information is subject to
THE WHARF (HOLDINGS) LIMITED (Incorporated in Hong Kong with limited liability) Stock Code: 4
 LIMITED (Incorporated in Hong Kong with limited liability) Stock Code: 4") Hong Kong Exchanges and Clearing Limited and The Stock Exchange of Hong Kong Limited take no responsibility for the contents of this announcement, make no representation as to its accuracy or completeness
Hong Kong Exchanges and Clearing Limited and The Stock Exchange of Hong Kong Limited take no responsibility for the contents of this announcement, make no representation as to its accuracy or completeness
CapitaMalls Asia Limited
 CapitaMalls Asia Limited Asia s Leading Mall Developer, Owner and Manager Singapore China Malaysia Japan India Annual General Meeting 21 April 2011 Disclaimer This presentation may contain forward-looking
CHINA HOTEL MARKET OUTLOOK
 CHINA HOTEL MARKET OUTLOOK Topics To Cover Key Market Assessment China Hotel Market Sentiment Survey The Big Picture For China In 2010 Key Market Outlook KEY MARKET ASSESSMENT Key Market Occupancy Trends
FULL YEAR FINANCIAL REPORT
 FULL YEAR FINANCIAL REPORT 1 Jan 31 Dec 2013 27 February 2014 ANALYST / MEDIA BRIEFING Artist s Impression of Lush Acres FINANCIAL HIGHLIGHTS Artist s Impression of D Nest KEY FINANCIAL HIGHLIGHTS Delivered
S$ million 2Q2012 2Q2011 Change 1H2012 1H2011 Change Revenue % % Gross Profit % % Gross Profit Margin
 Roxy-Pacific Holdings Limited NEWS RELEASE ROXY-PACIFIC ACHIEVES 8% INCREASE IN NET PROFIT TO S$17.7 MILLION IN 2Q2012 - Revenue rises 13% to S$52.7 million - 18% surge in revenue from Property Development
OPERATIONS REVIEW. Hutchison Whampoa Limited Annual Report 2005
 OPERATIONS REVIEW 24 5 6 3 2 1 4 1 Japan 2 3 Mainland China 4 Singapore 5 United Kingdom 6 Bahamas Property and Hotels The Group s property activities comprise an investment portfolio of approximately
Oxley Delivers Stellar Growth of 58% in PATMI to. S$130.9 million for HY2017
 For immediate release Oxley Delivers Stellar Growth of 58% in PATMI to S$130.9 million for HY2017 - Half-year revenue increased by 19% year-on-year to S$732.2 million - Gross profit margin increased from
Air China Limited 2014 Annual Results Under IFRS
 Air China Limited 2014 Annual Results Under IFRS March 2015 Agenda Part 1 Results Highlights Part 2 Business Overview Part 3 Financial Overview Part 4 Outlook Part 1 Results Highlights Gradual Global Economic
Press Release For Immediate Release
 Press Release For Immediate Release FRANSHION PROPERTIES (CHINA) LIMITED Announces 2008 Interim Results Revenue Surged by 797% to HK$870.3 million Profit Attributable to Equity Holders Grew by a Substantial
BAA (SP) Limited Results for six months ended 30 June July 2011
 Limited Results for six months ended 30 June July 2011") BAA (SP) Limited Results for six months ended 30 June 2011 July 2011 Record Q2 Heathrow traffic Good overall service standards Strong financial results Successful dollar and sterling financings H1 2011
BAA (SP) Limited Results for six months ended 30 June 2011 July 2011 Record Q2 Heathrow traffic Good overall service standards Strong financial results Successful dollar and sterling financings H1 2011
China Lodging Group (HTHT.US) Q4 and full year 2017 Earnings Call March 13, 2018
 Q4 and full year 2017 Earnings Call March 13, 2018") China Lodging Group (HTHT.US) Q4 and full year 2017 Earnings Call March 13, 2018 Agenda Strategy Review Operational and Financial Review Q & A Appendix 1 Strong RevPAR Growth Driven by ADR + Occupancy
China Lodging Group (HTHT.US) Q4 and full year 2017 Earnings Call March 13, 2018 Agenda Strategy Review Operational and Financial Review Q & A Appendix 1 Strong RevPAR Growth Driven by ADR + Occupancy
CapitaLand Limited. Positioning for the Future
 CapitaLand Limited Positioning for the Future 9 May 2015 Disclaimer This presentation may contain forward-looking statements that involve risks and uncertainties. Actual future performance, outcomes and
CapitaMalls Asia Limited Asia s Leading Mall Developer, Owner and Manager Singapore China Malaysia Japan India
 CapitaMalls Asia Limited Asia s Leading Mall Developer, Owner and Manager Singapore China Malaysia Japan India Joint Venture with Changi Airport Group to Develop an Iconic Mixed-Use Development at Changi
Air China Limited 2015 First Quarter Results
 Air China Limited 2015 First Quarter Results April 2015 Under PRC GAAP, unaudited Agenda Part 1 Part 2 Part 3 Results Highlights Business Performance Financial Review Part 1 Results Highlights Results
CapitaMalls Asia Limited Annual General Meeting Extraordinary General Meeting
 CapitaMalls Asia Limited Annual General Meeting Extraordinary General Meeting 17 April 2014 1 Disclaimer No representation or warranty expressed or implied is made as to, and no reliance should be placed
Cairo, May 21, TMG Holding reports EGP BN consolidated revenue, EGP 161 MN consolidated net profit
 First Quarter ending Earning Release Cairo, May 21, - reports EGP 1.139 BN consolidated revenue, EGP 161 MN consolidated net profit after minority and EGP 2.2 BN of new sales value for the first quarter
Analyst and Investor Conference Call Q Ulrik Svensson, CFO and Member of the Executive Board
 Analyst and Investor Conference Call Q2 2017 Ulrik Svensson, CFO and Member of the Executive Board Frankfurt, 2 August 2017 Disclaimer The information herein is based on publicly available information.
Part 1 Performance Highlights. Part 2 Business Overview. Part 3 Financial Review
 August 216 1 Part 1 Performance Highlights Part 2 Business Overview Part 3 Financial Review Part 4 Outlook 2 Under IFRS 3 Part 1 Performance Highlights Performance Highlights - Key Operational Metrics
The Qantas Group A Strong, Sustainable Future Alan Joyce, CEO Qantas Airways. Macquarie Australia Conference 4 May 2012
 The Qantas Group A Strong, Sustainable Future Alan Joyce, CEO Qantas Airways Macquarie Australia Conference 4 May 2012 Overview Fleet renewal now substantially complete FY13 capital expenditure reduced
2016 ANNUAL RESULTS. Mandarin Oriental Hotel Group
 2016 ANNUAL RESULTS Mandarin Oriental Hotel Group 2016 Annual Results Highlights US $ m 2016 2015 Combined Total Revenue * 1,324 1,335 Group s Total Revenue # 597 607 Underlying EBITDA 158 188 * Includes
Cathay Pacific Airways Annual Results 10 March Cathay Pacific Airways Interim Results 6 August 2008
 Cathay Pacific Airways 2009 Annual Results 10 March 2010 Cathay Pacific Airways 2008 Interim Results 6 August 2008 Annual Result 2009 2008 (restated) Group Profit/(Loss) HK$4,694m (HK$8,696m) Group Turnover
Chiwayland announces 2Q2016 results, with sights set on international markets and other growth engines
 Chiwayland announces 2Q2016 results, with sights set on international markets and other growth engines On track for the delivery of two major property developments by 4Q2016 Barring unforeseen circumstances,
Melco International Development Limited (Incorporated in Hong Kong with limited liability) Website : (Stock Code : 200)
 Website : (Stock Code : 200)") Hong Kong Exchanges and Clearing Limited and The Stock Exchange of Hong Kong Limited take no responsibility for the contents of this announcement, make no representation as to its accuracy or completeness
Hong Kong Exchanges and Clearing Limited and The Stock Exchange of Hong Kong Limited take no responsibility for the contents of this announcement, make no representation as to its accuracy or completeness