Property Sales Drive the Continuing Business. The Wharf (Holdings) Limited 2017 Final Results 8 March 2018
|
|
|
- Chester Richards
- 6 years ago
- Views:
Transcription
1 Property Sales Drive the Continuing Business The Wharf (Holdings) Limited 2017 Final Results 8 March
2 Financial Highlights HKD Million Group Revenue 43,273 46,627 Operating Profit 20,622 17,065 Core Profit* 15,718 13,754 Profit Before IP Revaluation Surplus 20,143 20,534 Net IP Revaluation Surplus 1, Profit After IP Revaluation Surplus 21,876 21,440 Earnings Per Share (HK$) - Attributable to Shareholders - Core* Dividend Per Share (HK$) $1.59** 2.15 *Exclude IP Revaluation Surplus and Exceptional Items **If Incl. WREIC s DPS of $0.95, Combined DPS of Wharf & WREIC: $2.54 2
3 Core Profit (Adjusted for Impact of Demerger) Group (Excl. Wharf REIC) HKD Million % Chg % of 2017 Total Combined Wharf & Wharf REIC* % Chg IP % 10% 9,418 8,839 +7% DP 6,239 3, % 88% 6,922 3, % - Hong Kong 2,399 1, % 34% 2,399 1, % - Mainland 3,840 1, % 54% 4,523 1, % Others % 2% 282 1,093-74% Total 7,122 5, % 100% 16,622 13, % Core Profit - Exclude IP Revaluation Surplus and Exceptional Items *As if There Were No Demerger 3
4 Backdrop Total Net Profit of HK$11B Realized from Sale of Property Interests in 2017, Incl. $4.5B from 8 Bay East Transaction & Revaluation Surplus of $1.3B (Recorded in Prior Years) As at 31 Dec 2017, as a Result of the Demerger & Re-investment Consolidated Assets Excl. Cash Totaled $177.0B Total Equity: $145.5B Total Distribution for 2017 (Combined with Wharf REIC): $7.7B in Cash (~46% of Combined Core Profit), Excl. Non-cash In-specie Distribution of Wharf REIC & i-cable Shares 4
5 Re-investment Listed Equities 36% Re-investment Breakdown Total Re-investment Since 2H17 $70.5B China Properties 46% HK Properties 18% Consolidated Assets Excl. Cash Totaled $210B* 75% in Properties 15% in Liquid Listed Equities Equity Capital Designated for China Properties <50% of Total Remaining Equity for HK Properties, Hotels, Logistics & CME2 HK & China Properties Still Group's Backbone in Foreseeable Future * As of 28 Feb 2018 (Unaudited) 5

6 Agenda HK Properties Logistics China IP China DP Hotel Management Financial Management Mount Nicholson House 1 6
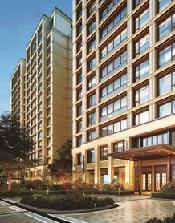
7 HK Properties HK Properties Breakdown by GFA Non-Core 19% Total Attributable GFA 3.0M s.f Kowloon Tong Portfolio 15% Peak Portfolio 10% Immensely Valuable Peak Portfolio KEWP Presents Growth Potential New Land Site in Lung Cheung Road, Kowloon Tong (GFA 436,400 s.f; Total Consideration $12.5B) Adds Kowloon East Waterfront Portfolio (KEWP)* 56% Momentum * Kowloon Godown: GFA of Existing Building As of 28 Feb
 48 Apartments (4,200-4,500 s.")
8 Mount Nicholson Raise the Bar for Luxury Living 50%-Owned Mount Nicholson Launch Date 1Q 2016 Product Type 19 Houses (6,000-10,000 s.f) 48 Apartments (4,200-4,500 s.f) Features Exclusive & Ultra-luxury Residences Enchanting Uninterrupted View over Victoria Harbour 50:50 JV Development with Nan Fung Group 8
 $87,200 psf (Average) Sold for $9.4B (Gross Basis) Total Proceeds $20.")
9 Mount Nicholson Unique Appeal Driving Asia s New Records Record Luxury Residences in Asia (House 3: 126,800 psf; Apartment 12C,D: $132,000 psf) Exclusivity & Scarcity Accumulated Sales* 11 Houses 32 Apartments 2017: 5 Houses & 14 Apartments $88,300 psf (Average) $87,200 psf (Average) Sold for $9.4B (Gross Basis) Total Proceeds $20.5B (Gross Basis) *Accumulated Sales up to 28 Feb 2018 Apartment 11C, D were Sold in Jan 2018 for a Total of $1,138M (Gross Basis) 9
 Recognized in 2017 8 Bay East Transaction Details Total GFA 596,000 s.f Total Consideration $9B Disposal Gain $4.")
10 8 Bay East Largest En-bloc Office Transaction in Kowloon Wholly-owned Subsidiary that Owns the 8 Bay East Project was Disposed in 2017 $4.5B Disposal Gain & $1.3B Revaluation Surplus (Recorded in Prior Years) Recognized in Bay East Transaction Details Total GFA 596,000 s.f Total Consideration $9B Disposal Gain $4.5B Completion Date 29 Dec
11 Re-investment HK Properties Peak Portfolio Led by Successful Mount Nicholson Project Lung Cheung Road Site Bought in Early 2018 Redevelopment Projects in Kowloon East HK Property Interests Also Incl. a Portfolio of Listed Blue Chip HK Property Stocks as Interim Proxy to Land Bank (at an Attractive Discount to Underlying Land Value & Paying a Healthy Dividend Yield) 11

12 Agenda HK Properties Logistics China IP China DP Hotel Management Financial Management Modern Terminals Hong Kong 12
 5.3* +4% Total 11.")
13 Modern Terminals Riding on a Gradual Global Trade Recovery 2017 Total Throughput (Million TEUs) HK % DCB (65%-owned) 1.3* Flat SCT (20%-owned) 5.3* +4% Total % Market Throughput South China +6% Kwai Tsing +7% *Total Throughput (Instead of Attributable) 13
14 Modern Terminals Steady Cashflow Consolidated Revenue & Operating Profit 3,206 2,739 2,635 2, Consolidated Revenue $2,703M (+3%) Consolidated Operating Profit $649M (-9%) 1, Revenue (HKD M) Operating Profit (HKD M) Note: Consolidated Revenue & OP Excl. 20%-owned SCT & 8%-owned CCT 14
 HACTL is a 20.")
15 Hong Kong Air Cargo Terminals Ltd (HACTL) 2017 Total Throughput 1.8M Tonnes (+9%) HACTL is a 20.8% Associate of the Group 15


16 Agenda HK Properties Logistics China IP China DP Hotel Management Financial Management Chengdu IFS Chongqing IFS 16
17 China IP New IPs Poised for Growth China IP Revenue (HKD billion) $2.6B (+12%) 1H 2H Solid Retail Sales Driving Mall Performance IP Rental Performance on Track 0.8 Newly-opened CQIFS & Upcoming CSIFS to Add New Momentum
18 CDIFS Mall Unrivalled Market Position Retail Sales (RMB billion) RMB5.0B (+30%) Sales Leads the Pack, Driven by Location, Critical Mass & Management Double-digit Rental Reversion CDIFS Mall Net Revenue (Net of Tax) RMB761M (+20%) Foot Traffic Growth +18% CDIFS Mall was Opened in Jan 2014 Turnover Rent Portion 24% Occupancy Cost* 13% * Occupancy Cost = Retail Rent/Retail Sales 18
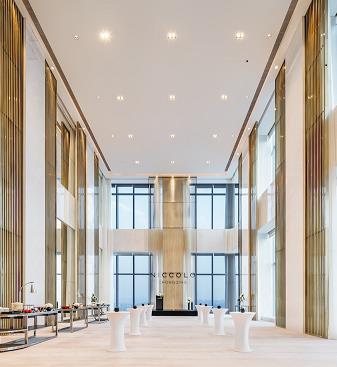
19 CDIFS Office & Hotel Office - Leasing Progress on Track First Class Workplace with Top-notch Management 60% Committed in 4 Years Encouraging Rental Rates Achieved among the Highest in CD Hotel - Market Leader in Room Yield in CD Niccolo Chengdu was Named One of China s Best Business Hotels by Condé Nast Traveler in Jun
20 CQIFS New Lifestyle Landmark in Chongqing Retail 109,300 s.m 30% 50%-Owned CQIFS Total 361,600 s.m* (100% Level) Hotel 36,800 s.m 10% Office* 215,500 s.m 60% Total Development Area, Excl. Carpark (Total 1,186 Carparks) * Net of Recognized Sales CQIFS Mall GFA (s.m) 109,300 # One-of-a-kind Cluster Setting Quality Standard for the Entire Area Iconic 300m Tower & 4 Other Towers Atop Retail Podium 88% of Office Tower Two, Three & Five Sold Opening 15 Sep 2017 % of Area Leased/ Under Offer 95% # CQIFS is 50%-owned, 109,300 s.m is Total Retail Area 20
21 CQIFS Mall Unprecedented Experiences (Debuted on 15 Sep 2017) Mid to High-end 21% Entertainment & Lifestyle 8% Offering an Exceptional One-stop Lifestyle Experience in China West F&B 24% 109,300 s.m (100% Level) Top-end Luxury 25% The Largest Cluster of First-tier Brands in Chongqing Under One-Roof Entertainment Offerings: The Rink, Affordable Luxury 22% Palace Cinema 21


22 Contemporary Urban Chic CQ Niccolo (Opened on 8 Sep 2017) Set a New Standard for Hotels The City s Highest Sky Hotel (252 Luxurious Guestrooms) Enjoy CQ s Spectacular Landscape & Skyline & the Confluence of the Yangtze & Jialing Rivers 22


23 CSIFS - New Unique Icon for Changsha Boasts the Most Coveted Location in the Prime City Centre 23
24 CSIFS Retailtainment Retail 246,100 s.m 35% CSIFS Total 700,000 s.m Apartments 69,900 s.m 10% Hotel 79,800 s.m 12% Office 304,200 s.m 43% Total Development Area, Excl. Carpark (Total Over 2,700 Carparks) CSIFS Mall Most Sought-after Retailtainment Destination in Hunan Province 94% of Area Leased/ Under Offer Underscores Retailers Trust & Confidence To Commence Operation in May 2018 GFA (s.m) 246,100 Opening May 2018 % of Area Leased/ Under Offer 94% 24
25 Re-investment CME2 A Strategic Initiative & An Infrastructure Play in the New Economy Re-investment of Former CME Capital in a Progressive CME Arena that Covers Much Larger Markets with Greater Growth Potential 25

26 Agenda HK Properties Logistics China IP China DP Hotel Management Financial Management Huangpujiang Project, Pudong, Shanghai 26
27 Contracted Sales Beat Expectation 2017 Contracted Sales* Contracted Sales RMB25.3B -19% Contracted GFA 0.9M s.m -42% Contracted ASP RMB26,100/s.m +31% *Not Included Sales from HCDL Post-demerger (from 23 Nov Dec 2017) 60 Projects in 14 Cities on Sale in Sales Target RMB22B^ 2018 Sellable Resources 1.0M s.m ^Not Incl. HCDL 27
28 Improving Operating Margin Lower Completion & Recognition 2017 Operating Matrix* Revenue $33,959M +11% Operating Profit $10,207M +99% Operating Margin 30.1% ppts Completed GFA 1M s.m -39% Recognized GFA 1.2M s.m -27% * Incl. JVs & Associates on an Attributable Basis; Not Included Contribution from HCDL from 23 Nov 2017 to 31 Dec 2017 Operating Margin ppts Net Order Book^ RMB19B or 0.8M s.m 2018 Target Completion^ 0.8M s.m Investment in Greentown (25% Stake) ^ Not Incl. HCDL 28
29 Selective Land Purchase Suzhou 55% Selective Land Purchase to Enhance 2017 New Acquisition 701,300 s.m Beijing 15% the Quality of Landbank & Return Key Target Cities: Beijing, Shanghai, Suzhou, Hangzhou, Guangzhou & Shenzhen Hangzhou 4% Foshan 26% China DP Landbank 3.9M s.m 29
30 Re-investment China Properties China DP Sharpening of our Focus to Half a Dozen Key Cities (from 16 Cities Previously) Benefitted the Business Unit across the Board Investment in Listed Greentown China Appreciated in Value to $6.4B (Original Cost $2.9B) Prime China IP Opportunities are Scarce & Cannot be Budgeted for 30

31 Agenda HK Properties Logistics China IP China DP Hotel Management Financial Management Niccolo - Chongqing 31
32 Hotel Management Marco Polo Hong Kong Mainland Philippines Niccolo A) Chengdu* B) Chongqing* (50%-owned) I F) Hong Kong I) Beijing (Parkside) G) Gateway J) Changzhou, Jiangsu P) Manila (Ortigas) Q) Cebu C) The Murray D) Changsha (2018)* E) Suzhou (2019) A B D K J L E H) Prince K) Wuhan* R) Davao L) Jinjiang, Fujian N O M M) Xiamen C G F H N) Foshan (LingnanTiandi) P Q O) Shenzhen * Owned by The Wharf (Holdings) Limited R 32


33 Agenda HK Properties Logistics China IP China DP Hotel Management Financial Management 33
34 Prudent Financial Management Debt Maturity (HKD billion) Gearing: Net Cash of $9.3B Average Interest Cost: 3.5% Jan18-Dec18 Jan19-Dec19 Jan20-Dec20 Jan21-Dec21 Jan22-Dec22 Jan23 & After Floating Rate Debt: 61.3% 34
35 Coming Attractions 35
36 Coming Attractions Mount Nicholson CSIFS Mall & Niccolo Hotel 36

37 CORPORATE SOCIAL RESPONSIBILITY 37


38 CSR Key Achievements Published the 3 rd CSR Report in Accordance with GRI G4 Sustainability Reporting Guidelines, and in Alignment with HKEx Environmental, Social and Governance Reporting Guide Hang Seng Corporate Sustainability Index Constituent Stock Hong Kong Quality Assurance Agency s CSR Index Plus 5 Years Plus Caring Company Logo 38


39 Business-in-Community Project WeCan Launched in 2011 by Wharf, Project WeCan is a Business-in-Community initiative providing students who are disadvantaged in learning with opportunities and care. Using an adopt a school model, it is now an open platform encompassing: 34 Companies: 11 Wharf Business Units + 23 External Companies 5 Universities 3 Consulates 3 Organisations Beneficiaries ,000 66,000 (est.) 39

40 Business-in-Community Young Innovators Bazaar Held at Plaza Hollywood Over 1,000 Students from 46 Project WeCan Schools Participated in 2017 Provided Students with an Opportunity to Experience the Full Cycle of Operating a Retail Business 40
41 Appendix 41
42 Summary of HK Properties Portfolio Usage Status Locations Attributable GFA (s.f.) 1. Peak Portfolio Residential Sales Mount Nicholson (50%-JV) 62,300 Lease Chelsea Court 43,100 Strawberry Hill 13,300 Redevelopment 1 Plantation Road 90, Plantation Road 46, Peak Road 42,200 Sub-total 297, Kowloon East Waterfront Portfolio Commercial Sales Peninsula East 42,600 Industrial Redevelopment Kowloon Godown # 1,032,200 Residential Development Yau Tong Bay (15%-JV) 600,600 Sub-total 1,675, Non-Core Commercial Lease Cable TV Tower Units 566, Kowloon Tong Portfolio Residential Development Kowloon Tong 436,400 Total 2,976,000 As of 28 Feb 2018 ; # GFA of Existing Building 42


 2 nd Ring Road 3 rd Ring Road")
43 CDIFS The City s Busiest Pedestrian Shopping Area Chunxi Pedestrian Street The Prime Location in City Centre At the Intersection of Hongxing Road, Dacisi Road and Beishamao Metro Station Street Directly Connected to 1 st Ring Road Metro Station (Lines 2 CDIFS & 3 Intersect) 2 nd Ring Road 3 rd Ring Road 43


44 CDIFS Award-winning Mixed-use Icon in Western China 9-Level Retail/ Lifestyle Podium Premium Offices Attracted a Large Concentration of Movers & Shakers Among the Top in Retail Sales & Footfall in Western China Luxurious IFS Residences Niccolo Chengdu Among the Most Exclusive Serviced Residences in CD Preferred Residence with Superb Service Market Leader in Chengdu in Room Yield in <2 Years 44


45 CDIFS Mall Redefining Lifestyle Experiences Wide Selection of Brands Under One Roof (Over 100 Debuts in Chengdu) Unique Showcase in China West for World s Coveted Brands A Strong Model for CQIFS & CSIFS Malls F&B 17% Entertainment & Lifestyle 19% 204,000 s.m Top-end Luxury 25% Mid to High-end 28% Affordable Luxury 11% 45
 Succeeded 2016 VIVA Best-of-the- Ms Christina Hau, General Manager (Operations)")
 Best Design & Development Awards *International Council of Shopping Centers")
46 CDIFS Mall Key Awards 2017 ICSC* Asia-Pacific Shopping Center Gold Award (Marketing Positioning & Brand Awareness) Succeeded 2016 VIVA Best-of-the- Ms Christina Hau, General Manager (Operations) of Wharf China Estates Limited (3rd left); Ms Winnie Wong, Deputy General Manager of Branding and Marketing (2nd left) Best Design & Development Awards *International Council of Shopping Centers 46


47 CQIFS Mall Diversified Tenant Mix Diversified Tenant Mix (Selected Brands) >150 Brands Incl. 80 Int l Brands & 20 CQ Debuts 47
 Panoramic River View (Jialing River & Yangtze")

48 CQIFS Prominent Location in Chongqing s New CBD Strategically Located in Jiangbeizui District (New CBD) Directly Connected to Light Railway Station (Lines 6 & 9) Panoramic River View (Jialing River & Yangtze River) CQIFS Clusters of Renowned Chinese Financial Institutions Nearby Adjacent to CQ City Grand Theatre, CQ Science Museum & the Central Park CQ City Grand Theatre, CQ Science Museum & the Central Park 48
49 Chongqing City Profile China s Western Development Strategy Chongqing 2017 Tertiary Industry +9.9% 49% of CQ GDP Strong Presence of International Brands Population 2017 GDP 30.5 million +9.3% (National Avg.: +6.9%) Tertiary 49% 7% Primary The World s Largest Municipality by Population & 2017 Retail Sales +11.0% Area 2017 Disposable Income per Capita RMB32, % 44% Secondary Transportation Hub Biggest Inland River Port 49
50 Changsha City Profile Hub City in Central China Changsha 2017 Tertiary Industry +10.9% 49% of CS GDP Beneficiary of China s Rise of Central China Campaign Population 2017 GDP 7.6 million +9.0% (National Avg.: +6.9%) Tertiary 49% 4% Primary Important Entertainment Center 2017 Retail Sales +10.5% in China Presence of Hunan Satellite TV 2017 Disposable Income per Capita RMB46, % 47% Secondary 50
51 China Commercial Properties Pipeline Commercial Properties Completion Schedule ( 000 s.m) 3,146 Changsha Outlets 873 1,001 Wuxi IFS Chongqing IFS* Chengdu IFS Other China Commercial Prop. Total Development Area, Incl. Basement Area & Carpark *Gross Basis & Net of Recognized Sales 51
52 China Contracted Sales Breakdown by City Region City No. of Projects on Sale Contracted Sales (%)* GFA Sold (%)* Eastern China Shanghai 4 10% 3% Suzhou 5 8% 9% Wuxi 4 12% 19% Changzhou 3 1% 1% Ningbo 3 4% 4% Hangzhou 13 33% 29% Eastern China Sub-Total: 32 68% 65% Western China Chengdu 7 2% 3% Chongqing 4 9% 15% Western China Sub-Total: 11 11% 18% Southern China Foshan & Guangzhou 8 5% 8% Others Beijing 3 11% 3% Tianjin, Dalian & Wuhan 6 5% 6% Southern & Others Sub-Total: 17 21% 17% *Not Included Sales from HCDL Post-demerger (from 23 Nov Dec 2017) 52
53 3 Projects Launched in 2017 Projects City New Launch Attributable Proceeds (RMB M) Attributable GFA Sold (s.m) Average Price (RMB psm) The Osmanthus Grace (Site 18) Hangzhou May ,800 33,900 Longfor Mansion (Site 16) Hangzhou Jun ,300 32,600 Hangzhou Site 12 ( 臻璽 ) Hangzhou Sep 1,736 39,900 43,500 53
54 China Key Projects on Sales in 2017 Projects City Attributable Proceeds (RMB M) Attributable GFA sold (s.m) Average Price (RMB psm) Ownership Hangzhou Site 12 ( 臻璽 ) Hangzhou 1,736 39,900 43, % Shanghai Pudong Huangpujiang Shanghai 1,706 13, , % The Pearl on the Crown Beijing 1,463 16,800 87,000 25% Crown Land Beijing 1,236 13,000 95,200 25% Wuxi Glory of Time Wuxi 1,055 61,600 16, % Greentown Zhijiang No.1 Hangzhou 1,028 44,500 20,900 50% The Throne Chongqing ,200 18,200 50% Royal Seal Hangzhou ,300 56, % The Willow Shores Hangzhou ,000 47,400 50% River Pitti (Bi Xi) Wuxi ,500 16, % Park Mansion Hangzhou ,000 31,100 50% Wuxi Times City Wuxi ,900 15, % 54
55 China DP 2017 New Land Acquisitions City Date Attributable GFA (s.m) Attributable Consideration (RMB) Ownership Beijing Sep17 102, B 100% Foshan May17 65, B 40% Foshan Sep17 116, B 50% Hangzhou Sep17 30, B 100% Hangzhou Sep17 3, B 7% Suzhou Jul17 90, B 33% Suzhou Sep17 29, B 100% Suzhou Sep17 203, B 100% Suzhou Sep17 59, B 60% Total 701, B 55
56 China DP Jan & Feb 2018 New Land Acquisitions City Date Attributable GFA (s.m) Attributable Consideration (RMB) Ownership Foshan Jan18 112, B 50% Guangzhou Jan18 7, B 10% Guangzhou Jan18 21, B 18% Hangzhou Jan18 98, B 50% Hangzhou Jan18 34, B 50% Hangzhou Jan18 20, B 50% Hangzhou Feb18 37, B 33% Suzhou Feb18 123, B 100% Suzhou Feb18 84, B 50% Suzhou Feb18 57, B 50% Total 599, B 56
57 China Land Bank Breakdown by City in 2017 Region City GFA million (s.m) % Total Eastern China Shanghai 0.3 5% Suzhou % Wuxi % Ningbo 0.0 0% Hangzhou 0.5 8% Eastern China Sub-Total: % Western China Chengdu % Chongqing % Western China Sub-Total: % Southern China Foshan, Shenzhen & Guangzhou 0.4 7% Others Tianjin 0.0 0% Changsha % Beijing, Dalian & Wuhan 0.4 7% Southern & Others Sub-Total: % Total: % 57
58 China Key Properties Completion Projects Attributable GFA (s.m) Key Completion in 2017 Shanghai Pudong Huangpujiang 136,000 Wuxi River Pitti (Bi Xi) 87,700 Chongqing IFS 86,300 Wuxi Times City 62,600 Chengdu Times City 56,600 Hangzhou Longxi (Site 13) 55,700 Projected Key Completion in 2018 Wuxi Times Glory 123,400 Suzhou Bellagio, G09 ( 碧堤半島 ) 82,500 Wuxi Times City 79,700 Suzhou Bellagio, G08 ( 碧堤雅苑 ) 75,800 Wuxi River Pitti (Bi Xi) 64,400 58
59 China New Projects for Sales in 2018 Projects City Ownership Beijing Xijucun Land Site Beijing 100% Hangzhou Santang Land Site Hangzhou 100% Jingan Garden Shanghai 55% Suzhou Yangchenghu 27 Land Site Suzhou 100% Beijing Liangma K Land Site Beijing 40% Suzhou Yuanhelu Land Site Suzhou 33% Suzhou Huangqiao 25 Land Site Suzhou 60% 59
60 Overview of Application of Funds Major Capital & Development Expenditure HKD 2017 (Actual) 2018 (Projected) HKIP (Before WREIC Demerger) 1.7B 0B HKDP 0.2B 12.9B China IP 2.5B 6.5B China DP 26.0B 24.7B Others 1.5B 0.5B Total 31.9B 44.6B * China DP Self-financed by Sales; China IP Mainly IFSs Under Construction 60
61 Property Sales Drive the Continuing Business Thank You 61
62 End of Presentation The Wharf (Holdings) Limited [HKEx Stock Code: 0004.HK] Disclaimer 1) All information and data are provided for information purposes only. All opinions included herein constitute Wharf s judgment as of the date hereof and are subject to change without notice. The Group, its subsidiaries and affiliates hereby disclaim (i) all express, implied, and statutory warranties of any kind to user and/or any third party including warranties as to accuracy, timeliness, completeness, or fitness for any particular purpose; and (ii) any liability whatsoever for any loss howsoever arising from or in reliance upon the whole or any part of the information and data contained herein. 2) The full-year statutory financial information of preceding financial years quoted in this presentation are derived from statutory annual financial statements for that relevant financial years, each of which had been delivered to Registrar of Companies in accordance with the prevailing Companies Ordinance and were reported on by the auditors with relevant auditors reports without qualification or modification. 62
Property Sales Drive the Continuing Business. The Wharf (Holdings) Limited 2017 Final Results 8 March 2018
 Limited 2017 Final Results 8 March 2018") Property Sales Drive the Continuing Business The Wharf (Holdings) Limited 2017 Final Results 8 March 2018 1 Financial Highlights HKD Million 2017 2016 Group Revenue 43,273 46,627 Operating Profit 20,622
Property Sales Drive the Continuing Business The Wharf (Holdings) Limited 2017 Final Results 8 March 2018 1 Financial Highlights HKD Million 2017 2016 Group Revenue 43,273 46,627 Operating Profit 20,622
DP Contributed 62% of Core Profit
 DP Contributed 62% of Core Profit The Wharf (Holdings) Limited 2018 Interim Results 9 August 2018 Stock Code: 0004 Financial Highlights Unadjusted Comparison HKD Million 1H18 1H17 # 1H18 Group 1H17 (Ex.
IP Earnings Anchored 14% Growth in Group Core Profit
 IP Earnings Anchored 14% Growth in Group Core Profit The Wharf (Holdings) Limited 2016 Interim Results 10 Aug 2016 1 Backdrop Leading Landlord with a Valuable & Resilient IP Profile Superior Assets & Proven
Properties Growth Continues. The Wharf (Holdings) Limited 2016 Final Results 9 March 2017
 Limited 2016 Final Results 9 March 2017") Properties Growth Continues The Wharf (Holdings) Limited 2016 Final Results 9 March 2017 1 Overview Backdrop Group Core Profit +25% to $13.8B Properties Share 92% (2015: 88%) due to 31% Growth IP 6% Growth
Properties Growth Continues The Wharf (Holdings) Limited 2016 Final Results 9 March 2017 1 Overview Backdrop Group Core Profit +25% to $13.8B Properties Share 92% (2015: 88%) due to 31% Growth IP 6% Growth
The Wharf (Holdings) Limited
 Limited") IP Momentum Continues as The Wharf (Holdings) Limited Macro Environment Causes Concern 2015 Interim Results 18 August 2015 1 IP Book Value (HKD billion) 350 300 Quality Landlord 250 200 New High $307B
IP Momentum Continues as The Wharf (Holdings) Limited Macro Environment Causes Concern 2015 Interim Results 18 August 2015 1 IP Book Value (HKD billion) 350 300 Quality Landlord 250 200 New High $307B
IP Demerger in Progress. The Wharf (Holdings) Limited 2017 Interim Results 9 Aug 2017
 Limited 2017 Interim Results 9 Aug 2017") IP Demerger in Progress The Wharf (Holdings) Limited 2017 Interim Results 9 ug 2017 1 1. Interim Results 2. Strategic Review 2 Backdrop Overview Underlying Profit Increased by 22% to $7,271M Stable IP
IP Demerger in Progress The Wharf (Holdings) Limited 2017 Interim Results 9 ug 2017 1 1. Interim Results 2. Strategic Review 2 Backdrop Overview Underlying Profit Increased by 22% to $7,271M Stable IP
Record Retail Sales Drove Robust Performance. Wharf Real Estate Investment Company Limited 2018 Interim Results 7 Aug 2018
 Record Retail Sales Drove Robust Performance Wharf Real Estate Investment Company Limited 2018 Interim Results 7 Aug 2018 Highlights 999-year Land Leases Offer a Differentiation* HKIP & Hotel 6 Core Assets
Group Profit $35.9B, +22% The Wharf (Holdings) Limited 2014 Final Results 16 March 2015
 Limited 2014 Final Results 16 March 2015") Group Profit $35.9B, +22% The Wharf (Holdings) Limited 2014 Final Results 16 March 2015 1 IP Book Value 10-yr CAGR +16% 350 Wharf IP Book Value (HKD billion) 10-year CAGR ~16% 300 250 Quality Retail Property
Group Profit $35.9B, +22% The Wharf (Holdings) Limited 2014 Final Results 16 March 2015 1 IP Book Value 10-yr CAGR +16% 350 Wharf IP Book Value (HKD billion) 10-year CAGR ~16% 300 250 Quality Retail Property
Record Retail Sales Drove Robust Performance. Wharf Real Estate Investment Company Limited 2018 Interim Results 7 Aug 2018
 Record Retail Sales Drove Robust Performance Wharf Real Estate Investment Company Limited 2018 Interim Results 7 Aug 2018 Highlights 999-year Land Leases Offer a Differentiation* HKIP & Hotel 6 Core Assets
The Wharf (Holdings) Limited. Interim Results. 15 August 2007
 Limited. Interim Results. 15 August 2007") The Wharf (Holdings) Limited Interim Results 15 August 2007 Key Recaps for Interim 2007 Properties continued to be the growth driver: turnover: HK$5,031M, +74; profit: HK$3,191M, +68 Core properties Harbour
The Wharf (Holdings) Limited Interim Results 15 August 2007 Key Recaps for Interim 2007 Properties continued to be the growth driver: turnover: HK$5,031M, +74; profit: HK$3,191M, +68 Core properties Harbour
Record year from Building for Tomorrow
 Record year from Building for Tomorrow The Wharf (Holdings) Limited 2012 Annual Results 26 March 2013 Highlights Core profit exceeded HK$11B, 37% over 2011. A record for Wharf. Attributable profit HK$47B,
The Wharf (Holdings) Limited
 Limited") The Wharf (Holdings) Limited Established 1886 Wheelock Square Shanghai December The Wharf 2011 (Holdings) Limited 1 Wharf Corporate Profile Established in 1886 with a distinguished history of Building
The Wharf (Holdings) Limited Established 1886 Wheelock Square Shanghai December The Wharf 2011 (Holdings) Limited 1 Wharf Corporate Profile Established in 1886 with a distinguished history of Building
Post-Demerger The Wharf (Holdings) Limited (Stock Code: 0004.HK) Investor Presentation 10 Nov 2017
 Limited (Stock Code: 0004.HK) Investor Presentation 10 Nov 2017") Post-Demerger The Wharf (Holdings) Limited (Stock Code: 0004.HK) Investor Presentation 10 Nov 2017 1 Wharf to Demerge into Two Listed Sister Companies 0020.HK 0020.HK 62% 62% 62% Future Wharf REIC 0004.HK
Post-Demerger The Wharf (Holdings) Limited (Stock Code: 0004.HK) Investor Presentation 10 Nov 2017 1 Wharf to Demerge into Two Listed Sister Companies 0020.HK 0020.HK 62% 62% 62% Future Wharf REIC 0004.HK
Wheelock and Company Limited The Wharf (Holdings) Limited Interim Results 27 August 2008
 Limited Interim Results 27 August 2008") Wheelock and Company Limited The Wharf (Holdings) Limited 27 August 2008 Consolidation In 2007, Wheelock changed its financial year end date from 31st Mar to 31st Dec to coincide with that of Wharf Accordingly,
Wheelock and Company Limited The Wharf (Holdings) Limited 27 August 2008 Consolidation In 2007, Wheelock changed its financial year end date from 31st Mar to 31st Dec to coincide with that of Wharf Accordingly,
Wheelock and Company Limited The Wharf (Holdings) Limited. 28 November 2007 Analyst Briefing
 Limited. 28 November 2007 Analyst Briefing") Wheelock and Company Limited The Wharf (Holdings) Limited 28 November 2007 Analyst Briefing Wheelock s Results (for 6-month period ended 30.9.07) Consolidation Wharf s financial statements were fully consolidated
Wheelock and Company Limited The Wharf (Holdings) Limited 28 November 2007 Analyst Briefing Wheelock s Results (for 6-month period ended 30.9.07) Consolidation Wharf s financial statements were fully consolidated
BUSINESS REVIEW HONG KONG PROPERTIES
 BUSINESS REVIEW HONG KONG PROPERTIES Contracted residential sales reached a new record of HK$23.4 billion, representing 131% growth compared to the same period in 2017 and surpassed the 2017 full year
WHEELOCK. FY2008 Results Highlights WHEELOCK AND COMPANY LIMITED
 2008 Annual Results WHEELOCK FY2008 Results Highlights WHEELOCK AND COMPANY LIMITED 2 Results Highlights Consolidation Wheelock & Co changed its financial year-end date from 31st Mar to 31st Dec at the
Positive rental reversions in Hong Kong portfolio. Rising contribution from Singapore office portfolio. Strong performance from Residential business
 2012 Review The Group performed well in 2012 Positive rental reversions in Hong Kong portfolio Rising contribution from Singapore office portfolio Strong performance from Residential business 2 Highlights
2016 Half-Yearly Results
 Presentation 29th July 2016 2016 Half-Yearly Review Underlying profit down 6% Commercial portfolio benefited from higher occupancy Steady contribution from mainland China residential business Profit attributable
Presentation Results. 4th March 2016
 Presentation 4th March 2016 2015 Review Sound result in 2015 Continued strong performance from commercial portfolio Entry into Shanghai with prime mixed-use site Stable asset values 1 Highlights 2014 2015
2017 Half-Yearly Results
 2017 Half-Yearly Results Presentation 4th August 2017 Agenda Speakers: Robert Wong, Chief Executive & Simon Dixon, Chief Financial Officer 1. 2017 Half-Yearly Highlights 2. Investment Properties 3. Development
Retail Drives IP Cashflow. Wharf Real Estate Investment Company Limited 2017 Final Results 5 March 2018
 Retail Drives IP Cashflow Wharf Real Estate Investment Company Limited 2017 Final Results 5 March 2018 1 Overview 6 Unique Properties at Prime Locations 97% 2017 Group Business Assets Diamond Hill Harbour
Wheelock and Company Limited The Wharf (Holdings) Limited. 26 March 2008 Analyst Briefing
 Limited. 26 March 2008 Analyst Briefing") Wheelock and Company Limited The Wharf (Holdings) Limited 26 March 2008 Analyst Briefing Wheelock s Results (for 9-month period ended 31.12.07) Consolidation Wheelock has changed its financial year-end
Wheelock and Company Limited The Wharf (Holdings) Limited 26 March 2008 Analyst Briefing Wheelock s Results (for 9-month period ended 31.12.07) Consolidation Wheelock has changed its financial year-end
CapitaLand Analysts/Media Trip 2017
 CapitaLand Analysts/Media Trip 2017 Mr. Lucas Loh CEO, CapitaLand China; Co-ordinating CEO China 2 July 2017 Contents 1 2 3 Key Highlights Business Overview Concluding Remarks 2 3 1 Key Highlights Successful
CapitaLand Analysts/Media Trip 2016 CapitaLand China. Mr. Lucas Loh, CLC CEO, Co-ordinating CEO China
 CapitaLand Analysts/Media Trip 2016 CapitaLand China Mr. Lucas Loh, CLC CEO, Co-ordinating CEO China 20 November 2016 Contents 1 2 3 4 5 6 CLC Portfolio Overview Key Business Highlight Residential Key
Interim Results Presentation. 27 March 2008
 Interim Results Presentation 27 March 2008 Contents Page Group structure Results snapshot Review of operations Hong Kong China Market outlook Looking ahead Investor contact 3 4-7 8-10 11-14 15 16 18-2
CHINA INVESTMENT PROPERTIES
 CHINA INVESTMENT PROPERTIES BUSINESS REVIEW With the adverse impact of currency movements, revenue increased by 2% to HK$2,350 million and operating profit by 1% to HK$1,253 million on translation to Hong
2017 Results 2018 Half-Yearly Results
 2017 Results 2018 Half-Yearly Results Presentation Presentation 27 July 2018 Agenda Speakers: Robert Wong, Chief Executive & Simon Dixon, Chief Financial Officer 1. 2018 Half-Yearly Highlights 2. Investment
CapitaLand Limited Acquisition: 3 rd Raffles City Integrated Development in Shanghai. 13 November 2018
 CapitaLand Limited Acquisition: 3 rd Raffles City Integrated Development in Shanghai 1 13 November 2018 Disclaimer This presentation may contain forward-looking statements that involve risks and uncertainties.
Air China Limited Annual Results. March Under IFRS
 Air China Limited 21 Annual Results Under IFRS March 211 Agenda Part 1 Highlights Part 2 Business Overview Part 3 Financial Overview Part 4 Outlook 2 Part 1 Highlights Steady Economic Growth; Asia Pacific
Wharf Estates China Limited
 32 The Wharf (Holdings) Limited Annual Report 2004 BUSINESS REVIEW CHINA WHARF CHINA LIMITED Wharf Estates China Limited Balance Sheet (Extract) as at December 31, 2004 HK$M Investment properties 4,605
Executive Directors Review
 Financial Summary Turnover for the year ended 31 December 2011 amounted to HK$571.4 million ( 47.6 million) (2010: HK$706.8 million ( 58.7 million)). The turnover was principally attributable to the recognition
JOINTLY ANNOUNCES 2018/19 INTERIM RESULTS * * * EMPEROR INTERNATIONAL S RENTAL INCOME GROWS 10% TO HK$600M NET PROFIT SURGES 57% TO HK$2.
 ` [For Immediate Release] JOINTLY ANNOUNCES 2018/19 INTERIM RESULTS * * * EMPEROR INTERNATIONAL S RENTAL INCOME GROWS 10% TO HK$600M NET PROFIT SURGES 57% TO HK$2.5B (Hong Kong, 29 November 2018) Emperor
HOPEWELL HOLDINGS LIMITED ANNOUNCES FY 2018/19 INTERIM RESULTS
 Press Release HOPEWELL HOLDINGS LIMITED ANNOUNCES FY 2018/19 INTERIM RESULTS Highlights 1H FY19 (1 April to 30 September 2018) First financial year after the change of financial year end date from 30 June
2017 Results. Presentation. 9 March 2018
 2017 Results Presentation 9 March 2018 Agenda Speakers: Robert Wong, Chief Executive & Simon Dixon, Chief Financial Officer 1. 2017 Results Highlights 2. Investment Properties 3. Development Properties
Corporate Presentation
 Corporate Presentation March 2010 NWDS-CAD-r112_Final (HK Stock Code: 825) 1 Safe Harbour Statement The information contained in our presentation is intended solely for your personal reference. In addition,
NWDS-CAD-r442/2012. (HK Stock Code: 825)
") NWDS-CAD-r442/2012 (HK Stock Code: 825) Safe Harbour Statement The information contained in our presentation is intended solely for your personal reference. In addition, such information contains projections
NWDS-CAD-r442/2012 (HK Stock Code: 825) Safe Harbour Statement The information contained in our presentation is intended solely for your personal reference. In addition, such information contains projections
2006 INTERIM ANNOUNCEMENT
 (Stock Code: 78) 2006 INTERIM ANNOUNCEMENT FINANCIAL HIGHLIGHTS Six months ended 30th June, 2006 (Unaudited) Six months ended 30th June, 2005 % Change (Unaudited) HK$ M HK$ M Revenue 608.3 542.4 +12.1%
Turnover (excluding hotels) increased by 13% to HK$2,655 million and operating profit by 13% to HK$2,313 million.
 increased by 13% to HK$2,655 million and operating profit by 13% to HK$2,313 million.") BUSINESS REVIEW HONG KONG PROPERTY INVESTMENT Harbour City and Times Square, representing 47% of the Group s business assets and 64% of operating profit, continued to perform strongly. Retail sales conducted
BUSINESS REVIEW HONG KONG PROPERTY INVESTMENT Harbour City and Times Square, representing 47% of the Group s business assets and 64% of operating profit, continued to perform strongly. Retail sales conducted
2016 HALF YEAR RESULTS. Mandarin Oriental Hotel Group
 2016 HALF YEAR RESULTS Mandarin Oriental Hotel Group 2016 Half Year Results Highlights US $ m June 2016 June 2015 Combined Total Revenue * 644 641 Underlying EBITDA 71 82 * Includes revenue from the Group
JOINTLY ANNOUNCES 2017/18 INTERIM RESULTS * * * RENTAL INCOME SURGES 25% STRENGTHS RECURRING INCOME STREAMS FOR SUSTAINABLE GROWTH
 [For Immediate Release] JOINTLY ANNOUNCES 2017/18 INTERIM RESULTS * * * RENTAL INCOME SURGES 25% STRENGTHS RECURRING INCOME STREAMS FOR SUSTAINABLE GROWTH (Hong Kong, 23 November, 2017) Emperor International
Press Release [For Immediate Release]
![Press Release [For Immediate Release]](/thumbs/95/126297927.jpg "Press Release [For Immediate Release]") Press Release [For Immediate Release] KWIH Announces 2017 Annual Results Profit Attributable to Shareholders Grew 23% to HK$3.9 billion * * * * * Attributable Contracted Sales Exceeded HK$10 billion for
Press Release [For Immediate Release] KWIH Announces 2017 Annual Results Profit Attributable to Shareholders Grew 23% to HK$3.9 billion * * * * * Attributable Contracted Sales Exceeded HK$10 billion for
2008 INTERIM ANNOUNCEMENT
 (Stock Code: 78) 2008 INTERIM ANNOUNCEMENT FINANCIAL HIGHLIGHTS Six months ended 30th June, 2008 (Unaudited) Six months ended 30th June, 2007 (Unaudited) HK$ M HK$ M Revenue 750.8 622.0 Operating profit
274% 150% of the Company (HK$ million) Basic earnings per share (HK cent) % Interim dividend per share (HK cent) 5 5
 Basic earnings per share (HK cent) % Interim dividend per share (HK cent) 5 5") Press Release For Immediate Release KWIH 2015 Interim Profit Increased 150% to HK$534 Million Attributable Contracted Sales Surged 5 Times to Approximately HK$8,700 Million in the First Half of the Year
Press Release For Immediate Release KWIH 2015 Interim Profit Increased 150% to HK$534 Million Attributable Contracted Sales Surged 5 Times to Approximately HK$8,700 Million in the First Half of the Year
Press Release For Immediate Release
 Press Release For Immediate Release FRANSHION PROPERTIES (CHINA) LIMITED Announces 2008 Interim Results Revenue Surged by 797% to HK$870.3 million Profit Attributable to Equity Holders Grew by a Substantial
CHINA INVESTMENT PROPERTIES
 Leadership in retail management has driven the successful performance of the Group s malls in the Mainland, in particular the award-winning Chengdu IFS. The newly-opened Chongqing IFS and the upcoming
Air China Limited Announces 2009 Annual Results
 Air China Limited Announces 2009 Annual Results Record Operating Profit in Complex Market Environment Strengthened Position to Capture Growth Opportunities Hong Kong April 22, 2010 Air China Limited (
WHEELOCK PROPERTIES LIMITED (A 74%-OWNED LISTED SUBSIDIARY)
") PROPERTY Bellagio (effectively 74%-owned) Bellagio, in Sham Tseng on the western shore of the New Territories overlooking the Tsing Ma Bridge, is a joint-venture development equally owned by Wheelock,
PROPERTY Bellagio (effectively 74%-owned) Bellagio, in Sham Tseng on the western shore of the New Territories overlooking the Tsing Ma Bridge, is a joint-venture development equally owned by Wheelock,
FY ANNUAL RESULTS
 FY 2 0 1 7 ANNUAL RESULTS I N V E S T O R P R E S E N T A T I O N 16 MARCH 2018 2 RESULTS HIGHLIGHTS DEVELOPMENT PROPERTIES INVESTMENT PROPERTIES FINANCIAL POSITION APPENDIX 1 2 3 4 5 3 RESULTS HIGHLIGHTS
! 1. Press Release [For Immediate Release]
![! 1. Press Release [For Immediate Release]](/thumbs/95/122563776.jpg "! 1. Press Release [For Immediate Release]") Press Release [For Immediate Release] KWIH Announces 2018 Interim Results Record Attributable Contracted Sales To Be Recognised of HK $18.5 Billion Providing Solid Base for Future Profitability * * * *
Press Release [For Immediate Release] KWIH Announces 2018 Interim Results Record Attributable Contracted Sales To Be Recognised of HK $18.5 Billion Providing Solid Base for Future Profitability * * * *
Retail Drives IP Cashflow. Wharf Real Estate Investment Company Limited 2017 Final Results 5 March 2018
 Retail Drives IP Cashflow Wharf Real Estate Investment Company Limited 2017 Final Results 5 March 2018 1 Overview 6 Unique Properties at Prime Locations 97% 2017 Group Business Assets Diamond Hill Harbour
Air China Limited Interim Results. August Under IFRS
 Air China Limited 21 Interim Results Under IFRS August 21 1 Agenda 21 Interim Results Overview Business Overview Financial Overview Outlook 2 2 2 21 Interim Results 3 21 Interim Results Overview 4 4 4
GALAXY ENTERTAINMENT GROUP
 GALAXY ENTERTAINMENT GROUP RECORD HALF YEAR GROUP ADJUSTED EBITDA OF $5.8 BILLION, UP 23% YEAR-ON-YEAR NET PROFIT ATTRIBUTABLE TO SHAREHOLDERS GREW 35% TO $4.6 BILLION FURTHER STRENGTHENED LIQUID BALANCE
PAN PACIFIC HOTELS GROUP LIMITED 2010 FULL YEAR RESULTS BRIEFING 22 FEB 2011
 PAN PACIFIC HOTELS GROUP LIMITED 2010 FULL YEAR RESULTS BRIEFING 22 FEB 2011 2010 RESULTS OVERVIEW STRATEGIC & OPERATIONS HIGHLIGHTS NEO SOON HUP CHIEF FINANCIAL OFFICER 2 CONTENTS Focus and Highlights
Investor Meeting Presentation. 4 June 2014
 Investor Meeting Presentation 4 June 2014 COMPANY OVERVIEW 1Q2014 RESULTS OVERVIEW OPERATION HIGHLIGHTS Q&A 2 Founded in 1963, listed on the Singapore Exchange in 1964 Three core businesses: - Property
Emperor Entertainment Hotel Limited (Stock code: 296) 2007/08 Annual Results Announcement July 17, 2008
 2007/08 Annual Results Announcement July 17, 2008") (Stock code: 296) 2007/08 Annual Results Announcement July 17, 2008 0 Core Businesses Macau Casino Hotel Grand Emperor Hotel Shanghai Retail & Hotel Complex Emperor Star City Opened since Jan 2006 To complete
(Stock code: 296) 2007/08 Annual Results Announcement July 17, 2008 0 Core Businesses Macau Casino Hotel Grand Emperor Hotel Shanghai Retail & Hotel Complex Emperor Star City Opened since Jan 2006 To complete
OPERATIONS REVIEW. Hutchison Whampoa Limited Annual Report 2005
 OPERATIONS REVIEW 24 5 6 3 2 1 4 1 Japan 2 3 Mainland China 4 Singapore 5 United Kingdom 6 Bahamas Property and Hotels The Group s property activities comprise an investment portfolio of approximately
Cairo, May 21, TMG Holding reports EGP BN consolidated revenue, EGP 161 MN consolidated net profit
 First Quarter ending Earning Release Cairo, May 21, - reports EGP 1.139 BN consolidated revenue, EGP 161 MN consolidated net profit after minority and EGP 2.2 BN of new sales value for the first quarter
Melco International Development Limited (Incorporated in Hong Kong with limited liability) Website : (Stock Code : 200)
 Website : (Stock Code : 200)") Hong Kong Exchanges and Clearing Limited and The Stock Exchange of Hong Kong Limited take no responsibility for the contents of this announcement, make no representation as to its accuracy or completeness
Hong Kong Exchanges and Clearing Limited and The Stock Exchange of Hong Kong Limited take no responsibility for the contents of this announcement, make no representation as to its accuracy or completeness
WHEELOCK AND COMPANY LIMITED Interim Report 2001/02. Unaudited Group profit of HK$460.8 million, an increase of 0.1% over last year.
 Unaudited Group profit of HK$460.8 million, an increase of 0.1% over last year. With a well-diversified business portfolio, the Group demonstrated the resilient nature of its operations. Wharf s core office
Air China Limited Announces 2010 Interim Results
 Air China Limited Announces 2010 Interim Results Record High First Half Results Leveraging New Opportunities to Drive Growth Hong Kong August 25, 2010 Air China Limited ( Air China or the Company, together
S$ million 2Q2012 2Q2011 Change 1H2012 1H2011 Change Revenue % % Gross Profit % % Gross Profit Margin
 Roxy-Pacific Holdings Limited NEWS RELEASE ROXY-PACIFIC ACHIEVES 8% INCREASE IN NET PROFIT TO S$17.7 MILLION IN 2Q2012 - Revenue rises 13% to S$52.7 million - 18% surge in revenue from Property Development
Investor Newsletter. Building a Future Sharing a Dream. Issue RMB6.1 Billion Contracted Sales Achieved for 2009
 March 2010 Building a Future Sharing a Dream Investor Newsletter Shui On Land (272.HK) Issue 1 2010 1 RMB6.1 Billion Contracted Sales Achieved for 2009 Shui On Land Limited ( SOL ) is pleased to announce
NWS Holdings Announces FY2014 Interim Results
 For immediate release HIGHLIGHTS NWS Holdings Announces FY2014 Interim Results For the six months ended 31 December 2013 2012 Change HK$ million HK$ million +/(-)% Revenue 10,097.8 7,971.0 27 Attributable
Oxley Delivers Stellar Growth of 58% in PATMI to. S$130.9 million for HY2017
 For immediate release Oxley Delivers Stellar Growth of 58% in PATMI to S$130.9 million for HY2017 - Half-year revenue increased by 19% year-on-year to S$732.2 million - Gross profit margin increased from
THE WHARF (HOLDINGS) LIMITED (Incorporated in Hong Kong with limited liability) Stock Code: 4
 LIMITED (Incorporated in Hong Kong with limited liability) Stock Code: 4") Hong Kong Exchanges and Clearing Limited and The Stock Exchange of Hong Kong Limited take no responsibility for the contents of this announcement, make no representation as to its accuracy or completeness
Hong Kong Exchanges and Clearing Limited and The Stock Exchange of Hong Kong Limited take no responsibility for the contents of this announcement, make no representation as to its accuracy or completeness
SPG Land (Holdings) Limited 盛高置地 ( 控股 ) 有限公司
 Limited 盛高置地 ( 控股 ) 有限公司") Stock Information Share Price (31/05/11) HK$3.12 52 week range HK$3.00 $4.72 Market Capitalization HK$3.28 Billion No. of Issued Shares: 1,051 million shares Listed Date: 10 October, 2006 Financial Highlights
Stock Information Share Price (31/05/11) HK$3.12 52 week range HK$3.00 $4.72 Market Capitalization HK$3.28 Billion No. of Issued Shares: 1,051 million shares Listed Date: 10 October, 2006 Financial Highlights
CapitaMalls Asia Limited Annual General Meeting Extraordinary General Meeting
 CapitaMalls Asia Limited Annual General Meeting Extraordinary General Meeting 17 April 2014 1 Disclaimer No representation or warranty expressed or implied is made as to, and no reliance should be placed
15th August Interim Results Analyst Briefing
 15th August 2013 2013 Interim Results Analyst Briefing Brickell CityCentre, Miami, U.S.A. Financial Summary Results Highlights Gross Rental Income Underlying Profit Equity Attri. to Shareholders HK$ M
Shun Tak Announces Interim Results for Year 2017
 For Immediate Release SHUN TAK HOLDINGS LIMITED (Incorporated in Hong Kong with limited liability) (Stock code: 242) website: http://www.shuntakgroup.com Shun Tak Announces Interim Results for Year 2017
Melco Announces 2013 Annual Results
 [For Immediate Release] Melco Announces 2013 Annual Results Approved a New Dividend Policy to Drive Long-Term Shareholder Value Highlights Melco International Development Limited ( Melco ) achieved an
China Railway Construction Corporate Limited 2014 Annual Results
 China Railway Construction Corporate Limited 2014 Annual Results 1 I. Overview Rising Industry Position with Increasing Recognition Moved up to Top 80 of the Fortune Global 500 Ranked Top 2 in ENR Top
GALAXY ENTERTAINMENT GROUP SELECTED UNAUDITED Q FINANCIAL DATA
 GALAXY ENTERTAINMENT GROUP SELECTED UNAUDITED Q1 2014 FINANCIAL DATA RECORD QUARTERLY GROUP ADJUSTED EBITDA OF $3.8 BILLION, UP 38% YEAR-ON-YEAR GALAXY MACAU TM PHASE 2 WELL ADVANCED, ON BUDGET AND ON
Mainland China Property Development
 Management Discussion and Analysis Mainland China Property Development With our advanced project management capabilities and a high level of collaboration among teams, every future Hang Lung project will
CapitaMalls Asia Limited Asia s Leading Mall Developer, Owner and Manager Singapore China Malaysia Japan India
 CapitaMalls Asia Limited Asia s Leading Mall Developer, Owner and Manager Singapore China Malaysia Japan India Joint Venture with Changi Airport Group to Develop an Iconic Mixed-Use Development at Changi
FULL YEAR FINANCIAL REPORT
 FULL YEAR FINANCIAL REPORT 1 Jan 31 Dec 2013 27 February 2014 ANALYST / MEDIA BRIEFING Artist s Impression of Lush Acres FINANCIAL HIGHLIGHTS Artist s Impression of D Nest KEY FINANCIAL HIGHLIGHTS Delivered
F a n t a s i a H o l d i n g s G r o u p C o., L i m i t e d S t o c k C o d e : 1777 N e w s l e t t e r f o r N o v e m b e r, 2017
 Company Operation Information Fantasia: Monthly contracted sales hit a monthly new high Colour Life consolidates Wanxiangmei Property Management Co., Ltd. (5 December, 2017 Hong Kong) Fantasia Holdings
CHINA RESOURCES LAND LIMITED
 CHINA RESOURCES LAND LIMITED 2012 Annual Results Review 15 March 2013 Agenda Highlights Financial Review Land Bank Completion Schedule Appendix Highlights Net profit in FY12 rose 30.1% YoY to HK$10,569
Cathay Pacific Airways
 Cathay Pacific Airways Annual Results for the year ended 31 st December 2011 14 March 2012 1 Annual Result 2011 2010 Change Group attributable profit HK$5,501m HK$14,048m -60.8% Group Turnover HK$98,406m
Cathay Pacific Airways 2012 Analyst Briefing 28 June 2012
 Cathay Pacific Airways 2012 Analyst Briefing 28 June 2012 1 Airline Strategy Grow our international network, expand frequencies and further develop Hong Kong as one of the world s leading aviation hubs
Melco International Development Limited (Incorporated in Hong Kong with limited liability) Website : (Stock Code : 200)
 Website : (Stock Code : 200)") Hong Kong Exchanges and Clearing Limited and The Stock Exchange of Hong Kong Limited take no responsibility for the contents of this announcement, make no representation as to its accuracy or completeness
Hong Kong Exchanges and Clearing Limited and The Stock Exchange of Hong Kong Limited take no responsibility for the contents of this announcement, make no representation as to its accuracy or completeness
Megawide Construction Corporation FY 2016 Analysts Briefing 06 April 2017
 Megawide Construction Corporation FY 2016 Analysts Briefing 06 April 2017 FY 2016 CONSOLIDATED HIGHLIGHTS +14% P17.7B Revenue +19% P3.6B EBITDA +30% P1.9B Net Income 1 1 CONSOLIDATED INCOME STATEMENT 2
CapitaMalls Asia Limited
 CapitaMalls Asia Limited Asia s Leading Mall Developer, Owner and Manager Singapore China Malaysia Japan India Annual General Meeting 21 April 2011 Disclaimer This presentation may contain forward-looking
Air China Limited 2014 Annual Results Under IFRS
 Air China Limited 2014 Annual Results Under IFRS March 2015 Agenda Part 1 Results Highlights Part 2 Business Overview Part 3 Financial Overview Part 4 Outlook Part 1 Results Highlights Gradual Global Economic
Air China Limited 2015 First Quarter Results
 Air China Limited 2015 First Quarter Results April 2015 Under PRC GAAP, unaudited Agenda Part 1 Part 2 Part 3 Results Highlights Business Performance Financial Review Part 1 Results Highlights Results
WHEELOCK AND COMPANY LIMITED. Annual Report 2000 / Cable TV Tower, Hong Kong
 Cable TV Tower, Hong Kong 26 STEERING AHEAD Driven by strong recurrent earnings and value creation opportunities originating from its investment flagship property at Kowloon Point, Wharf Holdings, Wheelock
Air China Limited Announces 2010 Annual Results
 Air China Limited Announces 2010 Annual Results Profit reaches record high on strong economic growth Hong Kong March 29, 2011 Air China Limited ( Air China or the Company, together with its subsidiaries,
OVERSEAS REGULATORY ANNOUNCEMENT
 Hong Kong Exchanges and Clearing and The Stock Exchange of Hong Kong take no responsibility for the contents of this announcement, make no representation as to its accuracy or completeness and expressly
Cathay Pacific Airways 2011 Analyst Briefing 23 June 2011
 Cathay Pacific Airways 2011 Analyst Briefing 23 June 2011 1 Airline Strategy Grow our international network, expand frequencies and further develop Hong Kong as one of the world s leading aviation hubs
Talaat Moustafa Group Holding 1Q08 Results Earnings Release
 Talaat Moustafa Group Holding Results Earnings Release Cairo, April 13 th 08 Talaat Moustafa Group Holding ( TMG Holding ) the leading Egyptian community real estate developer with over years of experience,
Corporate Presentation 2012/13 Interim Results
 Corporate Presentation 2012/13 Interim Results 26 February 2013 0 Disclaimer The information contained in this presentation is intended solely for your personal reference. Such information is subject to
2016 ANNUAL RESULTS. Mandarin Oriental Hotel Group
 2016 ANNUAL RESULTS Mandarin Oriental Hotel Group 2016 Annual Results Highlights US $ m 2016 2015 Combined Total Revenue * 1,324 1,335 Group s Total Revenue # 597 607 Underlying EBITDA 158 188 * Includes
Innovative Property Developer in China
 Innovative Property Developer in China Established in 2004 and listed on The Stock Exchange of Hong Kong (Stock Code: 272) in October 2006, Shui On Land Limited is the Shui On Group's flagship property
Cebu Air, Inc. 2Q2014 Results of Operation
 Cebu Air, Inc. 2Q2014 Results of Operation 1 Disclaimer This information provided in this presentation is provided only for your reference. Such information has not been independently verified and, as
Convenience Retail Asia maintains growth momentum in turnover and profit for first half
 For Immediate Release Convenience Retail Asia maintains growth momentum in turnover and profit for first half Saint Honore integration well underway and synergies being achieved Hong Kong, 2 August 2007
Overall revenue (excluding hotels) increased by 4% to HK$4,656 million and operating profit by 5% to HK$4,162 million.
 increased by 4% to HK$4,656 million and operating profit by 5% to HK$4,162 million.") BUSINESS REVIEW Core profit from properties advanced by 28% to HK$7.1 billion, representing 98% (2016: 92%) of Group total. Hong Kong properties reported an increase of 17% to HK$5.2 billion and Mainland
BUSINESS REVIEW Core profit from properties advanced by 28% to HK$7.1 billion, representing 98% (2016: 92%) of Group total. Hong Kong properties reported an increase of 17% to HK$5.2 billion and Mainland
Cairo, November 15, 2016 TMG holding reports EGP 3.9 BN consolidated revenues, EGP 616 MN consolidated net profit
 Nine Months and Third Quarter ending September 30, Earning Release Cairo, November 15, TMG holding reports EGP 3.9 BN consolidated revenues, EGP 616 MN consolidated net profit after minority and EGP 5.5
RESULTS RELEASE 20 August GENTING HONG KONG GROUP ANNOUNCES FIRST HALF RESULTS FOR 2015 Highlights
 RESULTS RELEASE 20 August 2015 FOR IMMEDIATE RELEASE INTERNATIONAL GENTING HONG KONG GROUP ANNOUNCES FIRST HALF RESULTS FOR 2015 Highlights The commentary below is prepared based on a comparison of the
NEWSLETTER. Issue 2, Investor Relations Contact
 NEWSLETTER Issue 2, 2018 Poly Property Group Co., Limited Sarah Xie, Investor Relations Manager Room 2503, Admiralty Centre, Tower 1, 18 Harcourt Road, Hong Kong Tel: (852) 2810 6216 Fax: (852) 2804 1211
Cathay Pacific Airways 2010 Annual Results 9 March 2011
 Cathay Pacific Airways 2010 Annual Results 9 March 2011 1 Annual Result 2010 2009 Change Group Profit/(Loss) HK$14,048m HK$4,694m +199.3% Group Turnover HK$89,524m HK$66,978m +33.7% Profit Margin 15.7%