STATE HIGHWAY ACTIVITY MANAGEMENT PLAN
|
|
|
- Sibyl Mosley
- 5 years ago
- Views:
Transcription


 is the")


1 STATE HIGHWAY ACTIVITY MANAGEMENT PLAN DRAFT PROGRAMME FOR SUBMISSION TO REGIONAL TRANSPORT COMMITTEES The State Highway Activity Management Plan (SHAMP) is the basis for the state highway bid for future maintenance, renewals, operations and improvements funding from the National Land Transport Fund. This draft SHAMP has been prepared for regional transport committees to form the state highway component of regional land transport plans (RLTPs).
2 CREATING TRANSPORT SOLUTIONS FOR A THRIVING NEW ZEALAND More information NZ Transport Agency Published August 2014 ISBN (online) ISBN (print) If you have further queries, call our contact centre on or write to us: NZ Transport Agency Private Bag 6995 Wellington 6141 This document is available on the NZ Transport Agency s website at
3 Draft State Highway Activity Management Plan NZ Transport Agency 1 FOREWORD 2 1. INTRODUCTION 3 2. PROGRESS SINCE SHAMP THE CHALLENGES AHEAD STRATEGIC DIRECTION MEASURING PERFORMANCE OVERALL PROGRAMME DEVELOPMENT MAINTENANCE AND RENEWAL OF THE NETWORK OPERATING THE NETWORK IMPROVING THE STATE HIGHWAY IMPLEMENTING THE SHAMP AUDIT AND REVIEW 79 APPENDIX A 81 REGIONAL SUMMARIES APPENDIX B 112 DETAILED NATIONAL PROGRAMME APPENDIX C 127 IMPROVEMENTS PROGRAMME DEVELOPMENT APPENDIX D 133 ASSET LIFECYCLE PLANNING & VALUATION

4 2 NZ Transport Agency Draft State Highway Activity Management Plan FOREWORD Efficient, safe and resilient state highway infrastructure and transport services are essential enablers to deliver greater prosperity and opportunities for all New Zealanders. The draft State Highway Activity Management Plan (SHAMP ) presents a complete picture of how the Transport Agency intends to plan, operate, maintain and improve the state highway network to deliver on the draft Government Policy Statement on Land Transport. In developing this plan, we ve drawn on regional aspirations and aligned them with the national outcomes we are seeking as articulated in the early investment signals. It is a draft for submission to New Zealand s regional transport committees, and subsequent submission into the Transport Agency s National Land Transport Programme This draft SHAMP continues a focus on customer journeys, enabling people and freight to travel safely and efficiently. Safety remains at the forefront, with our commitment to Safer Journeys, New Zealand s road safety strategy , making our state highways increasingly free of death and serious injury, being reconfirmed. Working with our road controlling authority partners in Auckland, Wellington and Christchurch, we aim to provide better services to road users by operating a network that is better integrated into the wider transport system, enabling better use of New Zealand s urban network capacity. We have a significant programme of capital investment commitments including investment in delivering the roads of national significance and Auckland s acceleration programme. We continue to invest in opening up more of the network to support more efficient freight journeys and we have broadened our focus to other proposed investments that seek to make our highways more resilient. As always, value for money on our investment is fundamental to ensure activities are delivered in the right way at the right time at the best cost. The One Network Road Classification and the new Network Outcomes Contracts for maintenance are important examples these changes enable an increasing corridor and network approach that will collectively yield greater overall outcomes. Tommy Parker Group Manager of Highways and Network Operations for the NZ Transport Agency

5 Draft State Highway Activity Management Plan NZ Transport Agency 3 1. INTRODUCTION Photo: Jacque Bell Principal Environmental Specialist, Auckland
6 4 NZ Transport Agency Draft State Highway Activity Management Plan ROLE OF THE STATE HIGHWAY NETWORK The state highway network is a key facilitator of journeys. It enables people and freight to make national and regional road journeys effectively, efficiently and safely which, in turn, helps support a thriving New Zealand. At the national level, state highways support New Zealand s global competitiveness, connecting cities, producers and markets, and air and sea ports. At a regional level, they connect businesses, communities, families and friends with customers, services, work, play and each other. While the state highway network accounts for only 12 percent of the total road network in New Zealand, around 50 percent of all vehicle kilometres travelled and 70 percent of freight kilometres travelled are on state highways. The network contributes significantly to the country s economy and wellbeing by being a key player in moving people and freight. The NZ Transport Agency is currently investing around $500 million per annum in maintaining and operating the state highway network, and $1.5 billion per annum in improving state highway assets. The network s assets are currently valued at approximately $26 billion. We are responsible for operating, maintaining, renewing and improving the state highway network. In doing so, we work closely with local government, KiwiRail, New Zealand Police and other partners to ensure New Zealand s state highways are operated and developed as an integral part of the overall land transport system.

7 Draft State Highway Activity Management Plan NZ Transport Agency 5 NORTH ISLAND NEW ZEALAND S STATE HIGHWAYS 1N N N Whangarei 15A 1N 1N Auckland Hamilton 2 Tauranga N Gisborne New Plymouth N 3 Napier 3 4 Wanganui Palmerston North 3 1N 1N Wellington LEGEND State highway
8 6 NZ Transport Agency Draft State Highway Activity Management Plan SOUTH ISLAND NEW ZEALAND S STATE HIGHWAYS N A Blenheim 6 Greymouth 7 7 1S Christchurch S Timaru 84 8A Queenstown 6A S S Dunedin Invercargill 1S LEGEND State highway
9 Draft State Highway Activity Management Plan NZ Transport Agency PURPOSE OF THIS PLAN This draft State Highway Activity Management Plan sets out the rationale for our investment in and activities on the state highway network over the next 10 years. It is a proposal for how the investment programme will be planned and implemented, and provides an assessment of the expected outcomes and investment requirements and risks. In developing this draft SHAMP, we have drawn on regional aspirations and aligned them with the national outcomes we are seeking. This document should be read in conjunction with the Infrastructure Asset Management Plan 1 which provides comprehensive guidance on how the network will be maintained and renewed. This draft will be used as an input to the development of regional land transport plans (RLTPs), for submission to the National Land Transport Programme (NLTP) Following approval of the NLTP, a final version of the SHAMP will then be released to ensure consistency with the NLTP The relationship between SHAMP and other transport planning documents is shown below: RELATIONSHIP BETWEEN THE SHAMP AND OTHER TRANSPORT PLANNING DOCUMENTS Government long-term outcomes and direction Transport sector outcomes Government Policy Statement on Land Transport and Safer Journeys NZ Transport Agency SOI goals and objectives Transport Agency Investment Policy AO priorities & service targets Priorities Draft SHAMP Priorities & service targets Service targets Draft programme Regional Land Transport Plan Priorities Final SHAMP Priorities & service targets Service targets Final programme National Land Transport Programme 1

10 8 NZ Transport Agency Draft State Highway Activity Management Plan PROGRESS SINCE SHAMP Photo: Rachael Thackwray Personal Assistant, Auckland
11 Draft State Highway Activity Management Plan NZ Transport Agency OVERVIEW Substantial progress has been made since publication of the SHAMP Some of the key achievements are summarised below more details can be found in the Transport Agency s annual reports MAINTENANCE AND RENEWAL We have changed the way New Zealand s state highways are maintained and operated. The Transport Agency has taken a stronger strategic approach to asset management (nationally and in the regions). We have sought to increase our ownership and expert management of the network through moving from 37 to 23 contract areas coupled with increased collaboration with our suppliers to account for the quality of work done on our highways. The Transport Agency has undergone an organisational redesign to give best effect to the new maintenance and operations approach, and we have strengthened our focus on strategic asset management through development of a performance framework and moving towards consistency in levels of service across the network. We have increased our focus in working with territorial local authorities to operate the roading network as One Network an example being the joint venture between the Transport Agency and Gisborne District Council, Tairāwhiti Roads. The Transport Agency has only just begun to see the benefits of the above changes. So far we have seen four percent annual cost savings over the last three years, amounting to savings of approximately $120 million as shown in the figure below. This has been achieved despite input cost price increases and increases in the scale and complexity of the network. MAINTENANCE INDEX AND COSTS 2003/ /13 Maintenance Index and Cost FY04 - Q3 FY14 80% 70% 60% 57% 50% 40% 38% 30% 20% 27% 10% 0% Jun 2004 Dec 2004 Jun 2005 Dec 2005 Jun 2006 Dec 2006 Jun 2007 Dec 2007 Jun 2008 Dec 2008 Jun 2009 Dec 2009 Jun 2010 Dec 2010 Jun 2011 Dec 2011 Jun 2012 Dec 2012 Jun 2013 Dec 2013 Maintenance Index Increase CPI Increase Maintenance Cost Increase
12 10 NZ Transport Agency Draft State Highway Activity Management Plan ROADS OF NATIONAL SIGNIFICANCE (RoNS) 4 The Victoria Park Tunnel project has been completed since 2012, resulting in a measured reduction in peak period congestion in Auckland. Also completed was the Christchurch Southern Motorway Stage 1 which has improved freight reliability. Two sections of the Waikato Expressway are now open (Te Rapa and Ngaruawahia) and are already providing customers with reduced travel times. Of the projects forming the Western Ring Route, all but one have progressed to construction with the most significant, the Waterview Connection on target to be complete by early During the period of the SHAMP , the Transport Agency has progressed Transmission Gully s public private partnership (PPP). This is New Zealand s first roading project PPP, which aims to be complete and operational by 2020/ SAFE SYSTEM APPROACH We have made good progress with embedding the Safe System 5 approach in our state highway activities by building capability and removing barriers to the adoption of safe system treatments. The state highway elements of the Safer Journeys 6 action plans are progressing. These include targeting efforts to high-risk rural roads, high-risk intersections and a motorcycle demonstration routes project. Funding for these has primarily been through the minor works programme and a range of small capital safety projects. This investment has seen realignments of curves on several high-risk corridors, the installation of over 200km of roadside protection barriers, over 300km of new audio tactile road markings (rumble strips), improvements at a number of intersections including nine electronic speed management trial systems and improvements at 12 rural schools adjacent to state highways. 2.5 JOURNEY MANAGEMENT Our journey management approach is making good gains towards our strategic priorities of putting customers at the heart of our business and making the most of urban network capacity. The National Journey Management Guidance Framework provides guidance on how operational services can be integrated into investment programs, enabling collaboration with our local and regional partners as well as our customers, and highlights the ongoing capability and capacity requirements. We have expanded our capability and capacity in integrated real-time operational services through the establishment of the Transport Operating Centres (TOCs) in Auckland, Wellington and Christchurch. The TOCs are jointly managed with our local partners and manage, monitor, inform and optimise the transport networks in their respective cities and, in some cases the wider state highway network. In addition to this, TOCs provide operational support to our regional partners, particularly in managing the effects of incidents and events on the transport network. In collaboration with our local government partners, we have developed a Network Operating Framework, and collaboratively produced network operating plans for Auckland, Wellington, Christchurch and Hamilton. For the first time, we have the tools available to prioritise competing demands for the available road space based on the preferred modes of travel and the needs of access and mobility by time-of-day. These network operating plans provide us with the opportunity to make best use of the existing urban networks
13 Draft State Highway Activity Management Plan NZ Transport Agency 11 Our focus on enabling people to make smart travel choices has seen an expanded range of channels available to customers to access travel information. We now use Twitter, Facebook, text (SMS) and web-based applications to notify our customers and third-party providers of our highway conditions and upcoming events. 2.6 FREIGHT MOVEMENT EFFICIENCY Our focus on an efficient freight system is reducing the cost of doing business in New Zealand. High productivity motor vehicles (HPMVs and 50MAX) provide productivity benefits 7 that will help improve the competitiveness of New Zealand s exports, reduce the costs of the goods we buy, and grow our economy. Bridge upgrades to ensure our roads are capable of handling heavier trucks has been underway and continues over In addition to targeting the national HPMV network, a 50MAX permit was introduced in The 50MAX permitting process is a joint Transport Agency/local government initiative and allows HPMVs to travel on most of the road network. Over 1000 permits have been issued for 50MAX for an area including the entire state highway and 45 local authority road networks. 2.7 ONE NETWORK APPROACH Putting the customer at the heart of our business has informed the adoption of a one network approach to the way the Transport Agency works with its partners to plan, maintain, operate and develop the transport system. The one network approach recognises that customers desire efficient journeys across the transport system, irrespective of which agency is responsible for that aspect of the journey. 2.8 ONE NETWORK ROAD CLASSIFICATION The Road Efficiency Group 8 developed the One Network Road Classification 9 (ONRC), comprising categorising roads into six functional categories based on the role they perform as part of an integrated national network, contributing to national, regional and local economies and social wellbeing. The classification helps the Transport Agency and local government to plan, invest in, maintain and operate the road network in a more strategic, consistent and affordable way throughout the country. The ONRC is assisting with: delivering efficient, safe and responsible highway solutions for customers by helping to set consistent and differentiated customer levels of service for the highway network maximising effective, efficient and strategic returns for New Zealand by helping align investment with agreed outcomes to drive value for money integrating one effective and resilient network for customers by supporting one network approaches across the sector with a common framework and language, and supporting clustering and collaboration for efficient delivery shaping smart, efficient, safe and responsible transport choices by assisting with implementing the national speed management programme across the network. 7 Potential freight productivity gains are in the order of a 20 percent decrease in truck trips using over-mass permits and a 14 percent decrease in trips for over-dimensioned permits. This means HPMVs will undertake percent less travel to move the same amount of freight as standard trucks
14 12 NZ Transport Agency Draft State Highway Activity Management Plan ONE NETWORK ROAD CLASSIFICATION N Whangarei Auckland Hamilton Tauranga Gisborne New Plymouth Napier Wanganui Palmerston North Wellington Blenheim Greymouth Christchurch LEGEND High volume Timaru High volume (new) National Queenstown Regional Arterial Dunedin Primary collector Secondary collector Invercargill Old SH1 SH to be declared

15 Draft State Highway Activity Management Plan NZ Transport Agency THE CHALLENGES AHEAD Photo: Julian Chisnall Traffic and Safety Engineer, Wellington
16 14 NZ Transport Agency Draft State Highway Activity Management Plan OVERVIEW This section highlights a series of existing and future gaps in the performance of the state highway network. Guided by our strategic direction, as discussed in Section 4, the primary issue faced by our state highway network, and those using it, can be summarised as: the reliability and safety with which people and goods can make journeys on the network, against a background of rising and regionally uneven demand. This in turn is leading to increasing costs of doing business, and increasing environmental and community impacts. 3.2 TRAVEL DEMAND PRESSURES The Transport Agency expects demand for travel on the state highway network to grow faster over the next 10 years than it has done over the past decade. This trend is likely to be particularly evident for heavy vehicle travel, as a result of the expected economic growth being higher than in the recent past. The pattern of demand for travel at a national level will not necessarily be replicated at the regional level. While all regions are likely to experience some increases over the next 10 years, those regions with large and growing populations, significant productive capacity, key ports of entry/exit into or from New Zealand, and/or have limited transport alternatives, are likely to experience the largest increases in travel demand on their respective state highway networks Recent national trends in state highway vehicle kilometres travelled Over the 1997 to 2005 period, national state highway vehicle kilometres travelled (VKT) grew at an average rate of approximately 4.0 percent per year. However, in the 2006 to 2013 period, national state highway VKT grew at an average rate of 0.4 percent per year as a result of a halving of the internal population growth rate compared to the 2001 to 2006 period, low inbound migration and a downturn in economic performance. In more recent times, there has been an upswing in kilometres travelled as New Zealand s economic performance has strengthened, with increased production and consumption, including growth in employment and income. Increasing inbound migration into New Zealand has also supported kilometres travelled in New Zealand. The national picture masks significant historic and forecast regional variations. This regional variation is generated by variations in regional population growth, household size, differential economic growth and structure. Historic regional growth in key regions is shown below along with a map of current state highway vehicle kilometres travelled by local authority area. REGIONAL VARIATIONS IN STATE HIGHWAY VEHICLE KILOMETRES TRAVELLED (VKT) 4,000 VKT (million vehkm) 3,000 2,000 Auckland Waikato Canterbury Wellington Bay of Plenty 1, Year
17 Draft State Highway Activity Management Plan NZ Transport Agency 15 Historically all regions have experienced lower growth over the 2006 to 2010 period largely due to low population growth and low inbound migration. The sluggish economy also had an impact between 2007 and 2009 particularly in the Auckland and Waikato regions. Subsequently a strengthening economy, supported by growing migration into New Zealand from overseas, has seen a solid upturn in travel in the Auckland, Waikato and Canterbury regions in the last two years. The Canterbury region in particular has seen a strong upturn in demand which is fuelled by a strong economic performance in Canterbury and surrounds and in part the rebuild following the Canterbury earthquakes. The demand for travel in the Wellington region has seen a more complex oscillatory behaviour with a modest underlying growth up to Over the 2007 to 2010 period the Wellington regional economy performed strongly relative to other regions but structural change including the capping of the public sector, has contributed to volatility in travel demand. However, in the last two years the strengthening economic position has seen an upswing in underlying demand for travel albeit at a more modest rate than some of the other regions. Road freight is primarily generated by the supply of agricultural, forestry, and fishery, as well as the products of manufacturing. Nationally, heavy commercial vehicle (HCV) travel grew at an average growth rate of 1.2% percent per year over the 2005 to 2013 period, with an exception for the 2008 to 2010 period. The 2008 to 2010 period was at the height of the economic downturn and consequently there was a pronounced dip in state highway HCV travel at that time. REGIONAL VARIATIONS IN HEAVY COMMERCIAL VEHICLE (HCV) KILOMETRES TRAVELLED VKT (million vehkm) Waikato Auckland Canterbury Bay of Plenty Wellington Year
18 16 NZ Transport Agency Draft State Highway Activity Management Plan TOTAL VEHICLE KILOMETRES TRAVELLED ON STATE HIGHWAYS IN 2013 BY TERRITORIAL LOCAL AUTHORITY N Whangarei Auckland Hamilton Tauranga Gisborne New Plymouth Napier Wanganui Palmerston North Wellington Blenheim Greymouth Christchurch Timaru LEGEND Queenstown Vehicle kilometres travelled (million kms) 1,000 4,200 Dunedin 500 1, Invercargill
19 Draft State Highway Activity Management Plan NZ Transport Agency 17 KILOMETRES TRAVELLED BY HEAVY COMMERCIAL VEHICLES ON STATE HIGHWAYS IN 2013 BY TERRITORIAL LOCAL AUTHORITY N Whangarei Auckland Hamilton Tauranga Gisborne New Plymouth Napier Wanganui Palmerston North Wellington Blenheim Greymouth Christchurch Timaru LEGEND Queenstown Vehicle kilometres travelled (million kms) Dunedin Invercargill 1 31
20 18 NZ Transport Agency Draft State Highway Activity Management Plan Future demand Forecasting undertaken for the draft GPS 2015 and the recently released National Freight Demand Study suggests that the demand for transport will recover as the economy strengthens 10. The draft GPS 2015 tells us that this recovery in demand will be led by freight traffic as economic activity increases. While personal travel is expected to increase in line with demographic trends, the best available information to date suggests that growth in personal vehicle travel will remain more muted than in previous economic cycles. Overall demand is forecast to grow over the period of the draft GPS 2015 and in the medium term, albeit at a slower rate than the early 2000s. The Transport Agency uses a number of different scenarios to predict what future travel demand might look like. Based on these, our expectation is that growth in vehicle kilometres travelled on the state highway network will average somewhere between 0.4 percent to 1.5 percent per year over the 10 years of the SHAMP. The draft GPS 2015 reports that New Zealand s freight task is forecast to grow by 58 percent by 2042 (from 236 million tonnes in 2012 to over 373 million tonnes). This rate of growth is slower than forecast in 2008, but still represents about 2 percent growth per annum. Road is expected to continue to remain the main mode for freight, accounting for about 70 percent of tonne kilometres, up to 26.3 billion kilometres. The Transport Agency anticipates that forecast growth in heavy vehicle kilometres travelled on the state highway network will be around 0.3 percent to 2.7 percent per year over the 10 years of the SHAMP. National forecasts of travel demand mask significant regional variations and the table below shows the range of our expectation of where travel demand might lie. ACTUAL AND EXPECTED VEHICLE KILOMETRES TRAVELLED ON REGIONAL STATE HIGHWAYS Region 2012/13 all vehicle kilometres travelled (billion) 2024/25 all vehicle kilometres travelled (billion) 2012/13 heavy vehicle kilometres travelled (billion) 2024/25 heavy vehicle kilometres travelled (billion) New Zealand Total Northland Auckland Waikato Bay of Plenty Gisborne Hawkes Bay Taranaki Manawatu/Wanganui Wellington Nelson/Marlborough Canterbury West Coast Otago Southland National Freight Demand Study 2014, Ministry of Transport 5 Demand Forecast, NZIER, December 2013
21 Draft State Highway Activity Management Plan NZ Transport Agency UNDERSTANDING OUR CUSTOMERS NEEDS An engagement programme, Customers First, has helped to identify the key outcomes our customers want: More efficient journey, as a result of better co-ordinated maintenance activities. Safer journeys, including reduced impacts from bad decisions made by other drivers. More reliable journeys and reduced journey times through more effective use of existing capacity on the network and providing more efficient freight movements and services. The ability to make smart travel choices using accurate traveller information before and during their journeys. 3.4 SAFETY CHALLENGES Despite substantial progress over the last 30 years, New Zealand still lags behind many other countries in road safety. Every year, around 300 people are killed, 2700 hospitalised, and a further 10,000 injured on New Zealand s roads at a social cost of around $3.5 billion. Slightly over half of all fatalities and around 37 percent of serious injuries occur on the state highway network, at an approximate cost of $1 billion each year. Approximately 85 percent of state highway deaths and serious injuries occur on the high speed rural network, with 87 percent of these resulting from three main crash types: run-off road (37 percent); head-on (25 percent); and intersection (25 percent). The vast majority are occupants of light vehicles (72 percent) with motorcyclists making up 14 percent; truck occupants, four percent; and pedestrian and cyclists making up 5 percent and 4 percent of deaths and serious injuries respectively. Over the last five years, the state highway safety resources have been targeted towards high-risk sites identified through KiwiRAP 11 and other resources such as the High-risk intersections guide 12. This has seen a reduction in the collective risk (total deaths and serious injuries) on the state highway network. We need to continue this focus on creating a Safe System, making corridors and intersections more forgiving of human error. DEATHS AND SERIOUS INJURIES ON STATE HIGHWAYS ,200 1,000 Serious Death 800 Frequency Year
22 20 NZ Transport Agency Draft State Highway Activity Management Plan Using KiwiRAP risk data, the state highway network has been divided into four primary categories for treatment, depending on the scale of the collective risk and personal risk of the highway in question: safe system transformation, requiring significant reconstructions such as the Roads of National Significance safer corridors, requiring medium level works such as curve realignments, widening and side barriers safety management, requiring lower cost delineation, skid resistance and speed management improvements safety maintenance. About 2000 km of state highway network, primarily higher volume national and regional strategic corridors, fall into the first two categories, requiring reasonably substantial infrastructure improvements (refer figure below). In addition, we need to continue making high-risk intersections on the state highway network safer. Of the 100 worst intersections in New Zealand, over 40 are on the state highway network. SAFETY RISK TREATMENT PHILOSOPHY Personal risk (crash rate Dsi/vkt) SAFETY MANAGEMENT Dsi s: 300pa (39%) Vkt: (41%) Length: 4500 (48%) Dsi/km:0.07 SAFETY MAINTENANCE Dsi s: 130pa (18%) Vkt: (19%) Length: 2900 (31%) Dsi/km:0.04 SAFE SYSTEM TRANSFORMATION Dsi s: 75pa (9%) Vkt: (8%) Length: (3%) Dsi/km:0.21 SAFER CORRIDORS Dsi s: 250pa (35%) Vkt: (32%) Length: 1700 (18%) Dsi/km:0.15 Collective risk (crash density Dsi/km)

23 Draft State Highway Activity Management Plan NZ Transport Agency NETWORK RESILIENCE Journey reliability is important for our customers, particularly businesses that need to have confidence in the network so that their choice of transport maximises their productivity. The reliability of some highways, real or perceived, can impact on business confidence and undermine economic growth within a region. Inconsistent network reliability (as a result of unexpected or unplanned events) reduces the choices for locating a business, reducing inter-regional competitiveness. A resilient transport network is one that meets current and future needs of customers and has the ability to recover from events impacting network availability and reliability of travel. As traffic volumes have continued to grow, the freedom to travel at a desired speed has become increasingly impeded by other vehicles in the traffic stream on increasing lengths of some state highway corridors. This has led to a reduction in the reliability of journey times and a resulting increase in the cost of doing business. The risks and hazards that can cause disruption to the land transport system, therefore impacting on the resilience of the network, range from events such as vehicle breakdowns, congestion or crashes on key routes. The climate and terrain in New Zealand also give rise to reduced reliability of journey times. Snow and ice, surface flooding and landslides occur regularly, especially in winter months, and often result in road closures or considerable reductions in operating speeds. To get the most gains in meeting the needs of New Zealand s aspirations for economic growth and social vitality, the land transport system needs to respond efficiently and effectively to such events. There are a number of high-risk corridors in terms of their lack of resilience as shown below. These maps highlight the areas, routes or locations where disruptive events would affect large numbers of network users and economic productivity.
24 22 NZ Transport Agency Draft State Highway Activity Management Plan NORTH ISLAND REGIONAL RESILIENCE RISK RATINGS 13 N Whangarei Auckland Hamilton Tauranga Gisborne New Plymouth Napier Wanganui LEGEND Risk of significant impact event Palmerston North High Medium Low State highway Wellington Ferry route Resiliency risk is calculated using measures of likelihood of a disruptive event and the degree of impact on the network. A copy of the resilience analysis is available from the NZ Transport Agency website. 13
25 Draft State Highway Activity Management Plan NZ Transport Agency 23 SOUTH ISLAND REGIONAL RESILIENCE RISK RATINGS 14 N Blenheim Greymouth Christchurch Timaru Queenstown Dunedin LEGEND Risk of significant impact event High Invercargill Medium Low State highway Ferry route 14 Resiliency risk is calculated using measures of likelihood of a disruptive event and the degree of impact on the network. A copy of the resilience analysis is available from the NZ Transport Agency website.
26 24 NZ Transport Agency Draft State Highway Activity Management Plan INCREASING URBAN CONGESTION Issues of congestion and reliability of travel are most pronounced in the major urban areas of Auckland, Wellington and Christchurch. The impact of congestion is constraining the ability of the land transport system in moving people and goods efficiently. Some parts of the Auckland and Wellington state highway networks continue to be subject to severe congestion for periods longer than the typical commuter peaks, and congestion in Christchurch is heavily influenced by the inability to respond quickly enough to the dynamic change in population and employment centres following the Canterbury earthquakes. In relative terms, Auckland and Wellington have similar levels of congestion, with Christchurch slightly less. However the cost of congestion is greater and resultant recovery times are much longer in Auckland due to the number of people affected by congestion.
 12% variability Tauranga 2,884 hours delay (AM peak) 9% variability Gisborne New Plymouth Napier Wanganui Palmerston North Blenheim Wellington 11,836 hours delay")
27 Draft State Highway Activity Management Plan NZ Transport Agency 25 URBAN CONGESTION IN AUCKLAND, WELLINGTON AND CHRISTCHURCH N Whangarei Auckland 59,137 hours delay (AM peak) 23% variability Hamilton 2,851 hours delay (AM peak) 12% variability Tauranga 2,884 hours delay (AM peak) 9% variability Gisborne New Plymouth Napier Wanganui Palmerston North Blenheim Wellington 11,836 hours delay (AM peak) 22% variability Greymouth LEGEND Urban congestion Christchurch 1,765 hours delay (AM peak) 19% variability High Medium Timaru Low Queenstown Moving goods HPMV investment routes State highway Invercargill Dunedin Urban congestion based on Journey Time Survey data for minutes delay per kilometre during the AM peak. The data is dated Sept However no reliable data was available for Christchurch in 2011 and 2012 as the survey results have been influenced by post-earthquake rebuilding activities.
28 26 NZ Transport Agency Draft State Highway Activity Management Plan FREIGHT PRODUCTIVITY Road is the dominant mode in terms of both tonnes and tonne-kilometres, accounting for 91 percent of tonnes moved and 70 percent of tonne-kilometres, of which 72 percent are on state highways. The National Freight Demand Study has forecast road freight tonne kilometres to grow by around 50 percent by The regions with the largest anticipated change are Wellington and Auckland, with large populations and limited primary production compared to other regions. Therefore, they are more greatly affected by changes in domestic economic activity, as shown below. CHANGES IN FREIGHT FLOWS BY ORIGIN REGIONS 2012 AND 2042 (MILLION TONNES) Million Tonnes Northland Auckland Waikato Bay of Plenty Gisborne Hawke s Bay Taranaki Manawatu Wellington TNM West Coast Canterbury Otago Southland This highlights the high growth forecast for the Auckland region, reflecting its growing share of population and economic activity and its increasing role as a national distribution centre. The increase forecast for Canterbury reflects its role both as a major agricultural area and as the centre for South Island distribution. Other high flows are forecast for the other regions in the upper North Island. The expectation is that, over time, modal share will remain similar to that in 2012, with rail continuing to carry around six to seven percent of freight volumes and road continuing to carry percent. To move this increase in freight will either require more trucks and truck trips or to move more freight on every truck trip, where this is feasible. There are significant efficiency gains from reducing the number of truck trips on state highways, while still moving the same amount of freight. This can be achieved by allowing higher weight carrying trucks (high productivity motor vehicles HPMVs) to operate on state highways where the road pavement and structures are sufficiently strong to carry them. We are continuing to build our understanding of the nature and location of constraints impacting key freight routes across the whole network. We have already identified and delivered HPMV investment routes, as illustrated by the maps on pages 27 and 28. A number of freight routes rely on efficient travel times to fit the desired number of trips into allowable driving hours. Some of these routes are reaching the limits of this reliability, and work will continue to understand these key routes to better understand constraints and options for providing reliable travel times and tangible improvements in freight efficiency. 15
29 Draft State Highway Activity Management Plan NZ Transport Agency 27 NORTH ISLAND LOCATION OF HPMV CONSTRAINTS N Whangarei Auckland Hamilton Tauranga Gisborne New Plymouth Napier LEGEND Wanganui 50MAX bridge restrictions Palmerston North Bridges requiring strengthening for full HPMV HPMV investment routes State highway Wellington Data for bridges in need of strengthening for full HPMV is as of January MAX bridge restriction data is as of July 2014 Tranche 2 HPMV investment routes are under investigation and will be finalised by July 2015.
30 28 NZ Transport Agency Draft State Highway Activity Management Plan SOUTH ISLAND LOCATION OF HPMV CONSTRAINTS N Blenheim Greymouth Christchurch Timaru Queenstown LEGEND Dunedin 50MAX bridge restrictions Bridges requiring strengthening for full HPMV Invercargill HPMV investment routes State highway Data for bridges in need of strengthening for full HPMV is as of January MAX bridge restriction data is as of July 2014 Tranche 2 HPMV investment routes are under investigation and will be finalised by July 2015.


31 Draft State Highway Activity Management Plan NZ Transport Agency ENVIRONMENTAL AND COMMUNITY IMPACTS Developing, maintaining and operating the state highway network can have both positive and negative impacts on the environment and neighbouring communities in many ways. The Transport Agency s overarching policies and standards apply good practice in environmental, cultural and heritage management activities to ensure we appropriately avoid, mitigate or remedy these environmental and community harms from the state highway. Negative environmental and community impacts, such as pollution from water run-offs and exhaust emissions, and noise, dust and visual impacts, are critical issues in determining the overall performance of the state highway programme. Over 200 kms of state highway is located within ecologically sensitive conservation areas managed by the Department of Conservation, as illustrated by the maps below. In addition, there are more than 300 registered heritage sites within 200m of the Roads of National Significance. State highways can create various social impacts ranging from adverse effects arising from construction and maintenance activities such as noise and dust to severance and accessibility issues. Such issues tend to be more acute in the vicinity of the 2000 plus km of state highway that are located in urban areas. Road traffic noise associated with highly-trafficked state highways in urban areas can create unreasonable noise. Within the period of the NLTP we have a particular issue adjacent to the Auckland motorway network where there are a growing number of properties which, as a consequence of traffic growth and urban intensification, have progressively been exposed to elevated levels of road traffic noise. We continue to work with our partners to avoid or minimise potential adverse human health/public health effects associated with the state highway network.
32 30 NZ Transport Agency Draft State Highway Activity Management Plan NORTH ISLAND ECOLOGICALLY SENSITIVE CONSERVATION AREAS N Whangarei Auckland Hamilton Tauranga Gisborne New Plymouth Napier Wanganui Palmerston North LEGEND Ecologically sensitive area State highway Wellington Ecologically sensitive areas include DOC public conservation areas, QEII Trust convenants, plus wetlands and significant natural landscapes, features, water bodies and ecosystems sourced from local and regional councils.
33 Draft State Highway Activity Management Plan NZ Transport Agency 31 SOUTH ISLAND ECOLOGICALLY SENSITIVE CONSERVATION AREAS N Blenheim Greymouth Christchurch Timaru Queenstown Dunedin LEGEND Invercargill Ecologically sensitive area State highway Ecologically sensitive areas include DOC public conservation areas, QEII Trust convenants, plus wetlands and significant natural landscapes, features, water bodies and ecosystems sourced from local and regional councils.

34 32 NZ Transport Agency Draft State Highway Activity Management Plan STRATEGIC DIRECTION Photo: Chris Collins Senior Project Manager, Christchurch
35 Draft State Highway Activity Management Plan NZ Transport Agency DRAFT GOVERNMENT POLICY STATEMENT 2015 The draft Government Policy Statement on Land Transport (GPS) sets out the government s priorities for expenditure from the National Land Transport Fund (NLTF) over the next 10 years. Economic growth and productivity is the key priority for the government. To achieve this, the government wants to see the land transport system moving people and freight as quickly, efficiently and safely as possible. A key focus of the draft GPS 2015 is investment in the Roads of National Significance (RoNS). These projects will move people and freight between and within New Zealand s five largest population centres more safely and efficiently. They enable economic growth rather than simply responding to it, particularly through the draft GPS 2015, providing high quality connections to major ports and airports from key export production and urban areas. Road safety is another key priority for the government. The draft GPS 2015 confirms the government s commitment to the Safe System approach which is being addressed through our Safer Journeys 17 road safety strategy accompanied by a series of action plans. The philosophy behind the Safe System is that humans make mistakes and the network should help to minimise mistakes and manage energy forces to within survivable limits when crashes do occur. This is done through safer use, safer speeds, safer vehicles and more forgiving roads and roadsides. Improving Auckland s transport system will continue to be an important priority under the draft GPS Auckland is home to a third of New Zealand s population and is predicted to account for 60 percent of the country s population growth over the next 20 years. Getting Auckland s transport working well is crucial to improving the contribution the city can make to national economic growth. To ensure the maximum impact from the NLTF, the draft GPS 2015 strengthens the priority for value for money in the land transport sector. There is an expectation that a strong rationale will be demonstrated for projects and activities, and that a greater emphasis will be given to progressively finding smarter ways of operating and maintaining networks. 4.2 NZ TRANSPORT AGENCY GOALS The Transport Agency s Statement of intent states the Transport Agency s strategy for giving effect to the government s direction for transport. The Transport Agency s overall aim is to support a thriving New Zealand through achieving four long-term goals: Integrate one effective and resilient network for customers. Shape smart, efficient, safe and responsible transport choices. Deliver efficient, safe and responsible highway solutions for customers. Maximise effective, efficient and strategic returns for New Zealand. The state highway network contributes to all of the long-term goals and many of the medium-term objectives. A summary of the Transport Agency s operating intentions is shown in the figure below
36 34 NZ Transport Agency Draft State Highway Activity Management Plan SUMMARY OF OUR OPERATING INTENTIONS The following framework diagram provides an overview of the relationship between the sector outcomes and the contributions we will undertake, as well as the indicators that will measure our progress toward achieving the desired goals and outcomes.
37 Draft State Highway Activity Management Plan NZ Transport Agency 35 Desired outcomes from the New Zealand transport sector. EFFECTIVE Moves people and freight where they need to go in a timely manner OUR PURPOSE Creating transport solutions for a thriving New Zealand EFFICIENT Delivers the right infrastructure and services to the right level at the best cost SAFE & RESPONSIBLE Reduces the harms from transport RESILIENT Meets future needs and endures shocks
38 36 NZ Transport Agency Draft State Highway Activity Management Plan Long-term goals Our strategic direction Medium-term objectives Implemented through the Transport Agency 10-year work programme, with key results specified for Integrate one effective and resilient network for customers Integrate land uses and transport networks to shape demand at national, regional and local levels. Integrate national and local transport networks to support strategic connections and travel choice. SHORT-TERM FOCUS: making the most of urban network capacity PRIORITY 2 Improve freight supply chain efficiency. SHORT-TERM FOCUS: moving more freight on fewer trucks PRIORITY 3 Shape smart efficient, safe & responsible transport choices Implement the Safe System approach to create a forgiving land transport system that accommodates human error and vulnerability. SHORT-TERM FOCUS: safe speeds to reduce deaths and serious injuries PRIORITY 4 Incentivise and shape safe and efficient travel choices using a customerfocused approach. Reduce costs for transport users through better regulation and willing compliance. Deliver efficient, safe & responsible highway solutions for customers Greater resilience of the state highway network. Deliver consistent levels of customer service that meet current expectations and anticipate future demand. SHORT-TERM FOCUS: safe speeds to reduce deaths and serious injuries PRIORITY 4 SHORT-TERM FOCUS: efficient road maintenance investment and delivery PRIORITY 5 Plan for and deliver the roads of national significance. Maximise effective, efficient & strategic returns for New Zealand 10 Align investment to agreed national, regional and local outcomes and improve value for money in all we invest in and deliver. SHORT-TERM FOCUS: efficient road maintenance investment and delivery PRIORITY Ensure effective and efficient co-investment with our partners. Explore innovative revenue, pricing and financing approaches that enhance the value delivered by land transport investments.
39 Draft State Highway Activity Management Plan NZ Transport Agency Shorter-term priorities Our key areas of focus to achieve ambitious targets against the goals Outputs* 1 3-year emphasis of all objectives Putting customers at the heart of our business PLANNING THE LAND TRANSPORT NETWORK output classes 2 3-year emphasis of objective 3 3-year emphasis of objective Making the most of urban network capacity 2 Moving more freight on fewer trucks 3 PROVIDING ACCESS TO AND USE OF LAND TRANSPORT SYSTEM output classes 4 Safe speeds to reduce deaths and serious injuries 3-year emphasis of objectives 4 8 MANAGING THE STATE HIGHWAY NETWORK output classes 5 Efficient road maintenance investment and delivery 3-year emphasis of objectives 8 10 INVESTING IN LAND TRANSPORT output classes * For further information on output classes, refer to the Statement of performance expectations.
40 38 NZ Transport Agency Draft State Highway Activity Management Plan EARLY INVESTMENT SIGNALS The Transport Agency works closely with the sector to ensure the NLTP delivers the best outcomes it can to support a thriving New Zealand. This coming NLTP , is the first to be developed since the 2013 amendments to the Land Transport Management Act, and adoption of different ways of working and new frameworks including the Public Transport Operating Model, One Network Road Classification and business case approach. To achieve a successful NLTP, the Transport Agency has indicated that all contributing transport programmes, including the SHAMP and activities should be: well aligned to the GPS the NLTP must give effect to the GPS and deliver on the Government s expectations. RLTPs must be consistent with the GPS outcome-focused delivers outcomes and benefits for the users of the transport network aligned to investment priorities evidence based underpinned by supporting information and evidence integrated, optimised and tested to deliver value for money. This draft SHAMP has been prepared, taking on board the planning and investment signals and guidance information the Transport Agency has provided to organisations that develop programmes as part of the NLTP. 4.4 INVESTING IN OUTCOMES The Transport Agency is focused on delivering outcomes that are clearly aligned to the direction set by the GPS and through the Transport Agency s strategy. Investments will be targeted to achieve outcomes, rather than outputs. The Transport Agency s priorities for investment that are most relevant to the draft SHAMP are summarised below in relation to the four overarching outcomes: Effective (moves people and freight where they need to go in a timely manner): delivering reliable service levels that safely move people and goods and support economic growth and productivity the shorter-term focus is on making the most of urban network capacity and improving freight supply chain efficiency including moving more freight on fewer trucks. Efficient (delivers the right infrastructure and services to the right level at the best cost): delivering fit for purpose levels of service that are appropriate to the different parts of the network improving value-for-money in relation to how the road network is maintained and operated. Safe and responsible (reduces the harms from transport): targeting efforts to reduce head-on, run-off road, intersection and vulnerable road user deaths and serious injuries on high risk corridors and locations improving roads and roadsides so they are more self-explaining and forgiving, and encourage safer speeds and safe road use. Resilient (meets future needs and endures shocks): identifying high impact events that would impact on large numbers of network users and economic productivity clarifying the lifeline functions of transport corridors and where these can be compromised by disruptive events, including outlying communities.
41 Draft State Highway Activity Management Plan NZ Transport Agency INTERVENTION HIERARCHY AND MANAGING DEMAND Activities forming the draft SHAMP have been developed using the Transport Agency s intervention hierarchy 19 to maximise the value of existing investments. Under this approach, investment in new infrastructure is only considered when other interventions such as integrated land use and transport planning, travel demand management, and network management have first been applied to address performance gaps Managing demand The Transport Agency is actively working to manage growing demand for travel by providing customers with better choices in how to undertake their journeys. A key decision is land use, which affects where our customers chose to live, work and play which, in turn, impacts on the demand for travel. By better integrating transport and land use we can positively influence this demand. We do this by: participating in planning processes getting involved early to influence land use decisions by working in partnership with local government and the private sector to promote national and inter-regional network perspectives place shaping working collaboratively to consider the impact of new development on the state highway network, as well as the opportunities to develop settlement patterns that will improve connectivity, accessibility and safety across all modes of transport managing adverse planning impacts identifying the functions of different parts of the state highway network to inform appropriate responses to development proposals. Another way we are shaping demand is by providing customers more choices on how they travel. By providing more effective travel choices, the Transport Agency can proactively manage the level of traffic growth on the state highway network. We achieve this through a range of travel information and road space management activities, including: providing travel information through various channels allocating road space to buses and high occupancy vehicles providing safe and convenient walking and cycling opportunities enabling park and ride with our partners proactively managing the movement of freight on the network. 19

42 40 NZ Transport Agency Draft State Highway Activity Management Plan MEASURING PERFORMANCE Photo: Kevin Reid National Manager Network Outcomes, Wellington
43 Draft State Highway Activity Management Plan NZ Transport Agency OVERVIEW The Transport Agency has developed key performance indicators (KPIs) and associated measures specifically to assess the cumulative performance of the State Highway Programme against the goals of the draft SHAMP Six KPIs have been developed to be specific to the role that state highways plays through this draft SHAMP in contributing to the goals of the government and the Transport Agency. These KPIs have a direct link back to our overarching strategic direction as outlined in section 4. Our six key performance indicators for the draft SHAMP are: efficiency in maintenance and operations better utilisation of existing capacity improved reliability reduced travel time reduction in deaths and serious injuries reduction in collective risk. 5.2 MEASURING PERFORMANCE In developing measures we have aimed to use metrics available from current data sets that are common to (or readily calculable for) the full state highway portfolio. The measures are complementary to the Transport Agency s statement of performance expectations 20 and other performance management frameworks. We have chosen two sets of metrics for the improvement programme: monetised metrics and outcome metrics. Monetised metrics are based on an aggregation of monetised benefits which are required as part of the Transport Agency s economic evaluation processes: Economic growth summation of Economic evaluation manual journey time savings and vehicle operating cost savings. Safety benefits crash cost savings saved on the state highway. Outcome metrics provide a more tangible measure of how the draft SHAMP will affect our customers. The maintenance and operations programme is measured in a different way. The main driver for the maintenance and operations programme is the achievement of the One Network Road Classification (ONRC) levels of service for the least cost. The Road Efficiency Group is in the process of developing ONRC performance measures and we expect our maintenance and operations portfolio to be measured against that framework. It is anticipated that the ONRC performance measures will complement the suit of other measures used to monitor the condition of the state highway network which have been developed as part of the Network Outcome Contract. 20
44 42 NZ Transport Agency Draft State Highway Activity Management Plan The combination of these two sets of metrics will provide a rounded view of the outcomes achieved from the draft SHAMP It allows for uncertainty around the availability of outcome metrics which are still being collated while using a more robust set of economic proxies based on well-established requirements to produce economic assessments in accordance with the Transport Agency s Economic evaluation manual 21. The measures are shown in more detail in the figure below. SHAMP PERFORMANCE MEASURES SHAMP KPI Performance measure Status of measure Efficiency in maintenance & operations ONRC performance measures $/lane km (by classification) Current/aspirational Current Better utilisation of existing capacity Total HPMV network added (km) Network productivity in Auckland, Wellington & Christchurch Current Aspirational Improved reliability Number of journeys impacted by an unplanned event(s) The variability of state highway travel times on key journeys Aspirational Aspirational Reduced travel time NPV of travel time and VOC savings by classification Current Reduction in deaths and serious injuries No. of serious and fatal crashes on state highway network each year as part of a five year trend NPV of safety savings Current Current Reduction in Collective Risk Annualised state highway serious and fatal crashes per km by classification and risk rating Current 5.3 CRITICAL SUCCESS FACTORS In addition to the key outcomes and goals of the draft SHAMP , there are other critical success factors (examples of which are outlined below) that underpin everything the Transport Agency does in planning, operating, maintaining and improving the state highway network as part of the overall transport system Value for money We constantly consider how to deliver the outcomes sought by the draft SHAMP in the most effective and efficient manner, to obtain the best value for money. As funding for state highway infrastructure comes from road users (individuals and businesses) we have a responsibility to ensure that costs are kept under control, and that all funding delivers the best possible outcomes for New Zealand Environmental and social responsibility Land transport investment can have positive as well as negative impacts on the environment. Investment in new state highways that remove traffic from suburban streets can significantly improve the living environment for many people. However, improvements can also have adverse impacts on those living closest to the improvements. These impacts need to be addressed at reasonable cost in the course of securing approvals if the full benefits of transport investment are to be realised. There are a number of Acts of Parliament which underpin the work the Transport Agency does with the aim of ensuring that transport projects contribute positively to the environments they sit in. 21
45 Draft State Highway Activity Management Plan NZ Transport Agency 43 Land Transport Management Act 2003 The legal foundation of the Transport Agency is the Land Transport Management Act. The Act established the Transport Agency and requires us to undertake our functions in a way that contributes to an effective, efficient, and safe land transport system in the public interest. The Act contains operating principles for the Transport Agency which includes exhibiting a sense of social and environmental responsibility. Resource Management Act 1991 The Resource Management Act (RMA) promotes the sustainable management of natural and physical resources. The state highway network and the various environments it interacts with are resources that fall within the remit of the RMA and need to be sustainably managed. The RMA has a particular focus on ensuring that the adverse environmental effects of activities are avoided, remedied or mitigated. The Transport Agency aims to be socially and environmentally responsible. We promote an accessible and safe transport system that contributes positively to New Zealand s economic, social and environmental welfare, and we are committed to acting in an environmentally and socially responsible manner Health and safety As part of the government s vision to improve New Zealand s health and safety performance by 25 percent by 2020, the Transport Agency will meet and exceed the requirements of the new Workplace Health and Safety legislation which comes into effect in April As a Person Conducting a Business or Undertaking (PCBU), in our roles as principal, employer and designer, we will focus on providing risk-based, proactive solutions to ensure the safety of workers though implementing the Transport Agency s Zero Harm Strategic Plan across the organisation Better understand our customers In delivering activities on the state highway we have to make trade-offs. We have made substantial change whereby we consider both customer and engineering challenges more effectively in making our trade-off decisions. We are doing this by building our capability to design with our customers in mind. In addition, we have also made changes by: improving engagement with the public by making it easier for customers to contact us and share their feedback improving our engagement with other road controlling authorities and additional key stakeholders through establishment of new Journey Manager roles as a key liaison point improving our processes and systems for dealing with customer complaints and enquiries. Continuing to focus on understanding our customers needs and working with other network providers to deliver outcomes as part of One Network will be critical to successfully planning and implementing the draft SHAMP

46 44 NZ Transport Agency Draft State Highway Activity Management Plan OVERALL PROGRAMME DEVELOPMENT Photo: Sarah Cronwright Principal Transport Planner, Auckland
47 Draft State Highway Activity Management Plan NZ Transport Agency OVERVIEW Funding for state highways is planned and allocated within three-yearly cycles through the National Land Transport Programme, allowing medium-term certainty and avoiding costly resource reallocation. The draft GPS 2015 states that we must continue to focus on targeted, value for money spending to ensure that costs are kept under control, and that all funding delivers the best possible outcomes for New Zealand. In particular the government is seeking continued progress in the area of maintenance investment including the ongoing implementation of the findings of the Road Maintenance Taskforce with a desire for further improved investment productivity. Similarly, the government wishes to see a continued drive for the best possible measureable value from state highway improvements. The draft SHAMP has been driven by the requirement to give best effect to the draft GPS While funding is planned through the National Land Transport Programme, it is the draft GPS 2015 that sets the funding ranges available. The table below shows the proposed funding allocations over the ten-year period of the SHAMP GPS 2015 (draft) state highways funding ranges ($million) Bands 2015/ / /25 State highway maintenance Lower Upper 1,350 1,810 1, ,910 2,930 State highway improvements Lower Upper 3,150 4,350 3,450 4,800 5,100 7, OVERALL PROGRAMME DEVELOPMENT Through the SHAMP we aim to maximise the benefit derived from investment in maintaining, operating and improving state highways as part of the transport system, to New Zealand s economy in a safe and sustainable manner. The SHAMP aims to achieve the right outcomes by targeting the right treatment or activity, in the right place, at the right time, and for the right cost. In developing the SHAMP we must also ensure that the expenditure associated with the relative programmes of work fit within our allocated budgets. To do this, we have implemented a rigorous programme development process to extract maximum value for money from our operations, maintenance and improvements programmes. The process has involved: targeting the most important issues for our customers identifying where we can make the greatest difference to improving journeys identifying the best programme of activities we can implement to close the level of service gap. The SHAMP has been developed from maintenance, renewal, operational and infrastructure improvement activities already underway, together with new activities that have been prioritised and programmed using the business case approach 22. We prioritise activities (or groups of activities) for inclusion in the National Land Transport Programme through the application of the intervention hierarchy and the Transport Agency Investment Assessment Framework 23. However, we also consider other factors and the approaches taken to developing the respective programmes is outlined further in sections 7, 8 and

48 46 NZ Transport Agency Draft State Highway Activity Management Plan MAINTENANCE AND RENEWAL OF THE NETWORK
49 Draft State Highway Activity Management Plan NZ Transport Agency OVERVIEW Draft SHAMP seeks to deliver the One Network Road Classification levels of service and make maintenance and renewal cost savings of at least four percent each year to counterbalance the underlying factors that are pushing up asset management costs. The main factors that are driving increased costs are: scope increases: for example, new additions to the network from the capital improvements programme (3.75% of the value of the SH network) such as the Waterview Tunnel, that add assets that need to be operated, maintained and renewed demand changes: for example, the growth in heavy vehicle kilometres and HPMV impacts which add to wear and tear on the network input prices increases: for example rising bitumen and aggregate costs due to market supply pressures and international currency matters. The aim is to counterbalance these trends through: improved effectiveness: constructing and renewing assets so they are fit for purpose having regard to an appropriate level of service for the road in question improved efficiency: optimally maintaining, repairing and renewing assets to minimise whole-of-life costs improved economy: smarter procurement that reduces the costs of delivering the programme while maintaining competitive markets, and risk transfer to the Transport Agency for renewal investment decisions. 7.2 APPROACH TO MAINTENANCE AND RENEWALS The Transport Agency s approach to developing the proposed maintenance and renewals programme for and beyond is to bank the efficiency gains made to date and aggressively pursue new opportunities. It is targeting a 4% saving each year. The One Network Classification levels of service are progressively becoming the target for state highway networks, through the roll-out of our Network Outcomes Contracts across New Zealand. We are continuing to embed changes to our asset management structures, roles and processes that are now beginning to improve the efficiency and effectiveness of the maintenance and renewal programmes. Key areas of focus for the future are outlined below Sound network condition The state highway network is generally in good condition. Current indications are that pavements may have longer service lives than once forecast and that, on average, they are less than halfway through their service lives. This means that we can reduce the amount of pavement rehabilitation in the sort to mid-term period compared to the sustainable level without adverse impact on long term costs. We are improving our measurement of pavement condition and forecasts of service lives in order to improve our confidence in the scope for continued programme reductions below the long term sustainable level Network Outcomes Contracts (NOCs) We will be completing the roll-out of NOCs which will help us to achieve procurement efficiencies, give a greater focus to customer service, and provide improved performance incentives for improved contractor performance. Coupled with enhanced performance management, this is expected to improve the durability of road works and extend service lives beyond those previously achieved.
50 48 NZ Transport Agency Draft State Highway Activity Management Plan Data acquisition, analysis and use We will be using improved network benchmarking metrics to identify and target opportunities for improvement. We aim to enhance our modelling of asset condition and the maintenance and renewal works required to meet service level targets for the least long-term cost to increase our confidence that the current and planned reductions in renewals programmes will be sustainable. This includes improving our dtims modelling and implementing the UK Highways Maintenance Efficiency Programme s stochastic modelling process. This analysis is already supporting our reduced renewals programmes By engaging with sector and infrastructure best practice groups we will be better able to benchmark practices and identify further opportunities for improvement Working the asset By moving to ONRC levels of service and, in some parts of the network, replacing our assets later in their lifecycle, the state highway network will be less frequently renewed. This will result in more patched roads and a less smooth journey for customers on about 10% of our lower classification network. However, road conditions will be monitored, as described in section 7.2.5, to ensure safety is not compromised Condition monitoring We aim to change our approaches to monitoring the condition of pavements and forecasting remaining lives by implementing new condition monitoring techniques and lessons learnt from past condition metrics. The Transport Agency is one of the three Australasian state road agencies that have collaborated with ARRB to import and systematically use the Traffic Speed Deflectometer to measure pavement condition so that life remaining can be reliably forecast at a network level. This will be used to more accurately forecast the remaining service lives of our pavements, and therefore the amount of pavement renewal works that are required to cost effectively maintain access Infrastructure Asset Management Plan We have prepared an Infrastructure Asset Management Plan to provide comprehensive guidance on how state highway assets should be maintained and renewed in order to deliver the maintenance and renewal programme proposed here. The plan documents a clear link between service level, infrastructure condition, lifecycle management needs and costs, and has been seen and reviewed from an investment perspective. The Infrastructure Asset Management Plan contains individual lifecycle asset management plans for the different asset classes (described in appendix D). These will be updated over as we review each service area and whenever any other significant improvement opportunity arises. The plans will provide the benchmark requirements for asset management planning for all networks. This will increase the consistency of approach across networks and the implementation of improved practices as these are developed Cost effectiveness of state highway maintenance and renewals As part of the advanced strategy described above, the Transport Agency can demonstrate cost efficiency per vehicle kilometre travelled (VKT) when compared with local roads as shown in the figure below, and also highlight the need to address apparent cost inefficiencies on particular networks.
51 Draft State Highway Activity Management Plan NZ Transport Agency 49 COMPARISON OF STATE HIGHWAY AND LOCAL ROAD COSTS PER VEHICLE KILOMETRES TRAVELLED (VKT) Network Costs 120, ,000 TA Area, 2012/13 Actual SH NOC 2014/15 Budget, June 13 $ 80,000 $/lane km 60,000 40,000 20, ,000 1,500 2,000 2,500 3,000 3,500 4,000 4,500 5,000 vkt/lane km Network Costs 40,000 35,000 30,000 TA Area, 2012/13 Actual SH NOC 2014/15 Budget, June 13 $ $/lane km 25,000 20,000 15,000 10,000 5, vkt/lane km The figure above shows a comparison of the recent costs of maintaining the state highway network compared to local road networks. The graph shows that both state highway and local road costs are similar for similar networks, with the exception of networks such as the Milford Road and West Coast South where there are continued efforts to reduce the costs imposed by their unique situations.
52 50 NZ Transport Agency Draft State Highway Activity Management Plan TREND OF STATE HIGHWAY AND LOCAL ROAD COSTS PER VEHICLE KILOMETRES TRAVELLED (VKT) 45,000 40,000 35,000 30,000 $/million vkt 25,000 20,000 15,000 10,000 5, / / / / / / / / / / / /13 Local Roads State Highways Both figures above demonstrate that maintenance and renewals of the state highway network have been carried out in an efficient manner. 7.3 PROPOSED PROGRAMME The proposed programme reflects an aggressive and optimistic approach to risks, and future efficiency and effectiveness improvements. The proposed programme was developed through a combination of detailed development at a regional level, followed by nationwide review and moderation. Assumptions and inputs to the financial forecasting are: less than the sustainable level of pavement renewal works can be undertaken in the short to mid term without long term cost impact because pavements are in generally good condition continued success of reductions in renewals programmes compared to the base preservation quantities as set for the 2014/15 programme, without significant change to repair programmes that Network Outcomes Contracts will continue to yield efficiency gains beyond the changes to renewal programme reductions in line with expectations a continued programme of $10 million per year to maintain safe skid resistance in addition to that provided as a consequence of conventional resurfacing works full adoption of Network Outcome Contracts and the aggressive renewal programmes across all networks, thereby reducing resurfacing and rehabilitations by $7 million per year in addition to reductions already realised provision for increased operation, maintenance and renewal of the growing and increasingly complex network increasing from $2.4 million in 2015 to $75 million in Maintenance costs increase by $20million pa over 2015/18 largely due to the $15million pa operating cost of the Waterview tunnel provision for increasing pavement deterioration of 0.7 percent per year as a result of freight increasing at 1.2 percent per year provision for a drop in escalation from past rates of about 3.5 percent per year to about 10 percent greater than the cpi rate forecast by Treasury from 2014/15. The Transportation Agency is adopting a new input price index for inclusion in its Network Operating Contracts which is expected to grow slightly faster than the cpi due to the greater influence of fuel and bitumen on the road maintenance compared to consumer activity
53 Draft State Highway Activity Management Plan NZ Transport Agency 51 no allowance for any impact on input prices as a result of increasing economic activity or the Christchurch rebuild beyond Treasury s cpi forecasts the minor works programmes and preventive maintenance programme included in the improvements activity class reduces the amount of emergency works and extends the service lives of pavements by improving network drainage and reducing the incidence of slips cost savings from additional efficiency strategies of 2 percent per year. These strategies and interventions are further detailed in the Lifecycle Management Plans. Because we have proposed an aggressive approach we believe there is a greater likelihood that costs may increase rather than decrease. These will be closely monitored and should additional savings not be available then either service levels will be reduced or a funding increase sought. The proposed programme is about $30m per year below the top of the funding range for state highway maintenance in the draft GPS AGGRESSIVE PROGRAMME (INCLUDING INFLATION NORMAL CPI 1.1%) Percentage of Current Budget (inflated) GPS Upper Band GPS Lower Band 2014/ / / / / /20 Growth (1.86%) Cost Escalation (0.2%) Input Cost Tight Cost after Savings Year Aggresive Programme (including inflation normal CPI 1.1%) Normal CPI increase (2%) Work Asset harder and smarter (1.5%) NOC efficiency (0.5%) + %5M annual savings 2020/ / / / /25 REAL MAINTENANCE SPEND AND ESCALATION Annual Maintenance Cost ($m) / / / / / /09 Unescalated Maintenance Cost 2009/ / / / / /15 Escalation Component 2015/ / / / / / / / / /25 Total Maintenance Cost The graph above presents costs calculated in 2003 dollars. This demonstrates that real (unescalated) costs have remained relatively constant since 2003 and are projected to do so for the duration of the draft SHAMP through the adoption of an aggressive programme. An alternative approach is to adopt a more conservative and higher cost programme having greater certainty of maximum expenditure.
54 52 NZ Transport Agency Draft State Highway Activity Management Plan CONSERVATIVE PROGRAMME Percentage of Current Budget (inflated) GPS Upper Band GPS Lower Band 2014/ / / / / /20 Growth (2.08%) Cost Escalation (0.2%) Input Cost Regional Submissions Year Cost after Savings Normal CPI increase (2%) Work Asset harder and smarter(1.5%) NOC efficiency (0.5%) 2020/ / / / / IMPACT ON CUSTOMERS The proposed programme aims to deliver the service levels of the One Network Road Classification. We are seeking a good balance between the increased cost of repairs, savings made to the renewals programme and the impact of repair work on our customers. Because we are keeping road surfaces in service longer there is increased risk that, in a few cases, a road will deteriorate faster than expected and require more extensive repair works than are optimal. In these instances, all faults will be repaired to ensure that the road continues to be safe, and the skid resistance of the road s surface will be maintained to the same level as before. However, on the lower classification roads, there will be more patched roads than have previously been the case. We will monitor the frequency of such occurrences and adjust our renewals programme accordingly. OVERALL CUSTOMER SATISFACTION RESULTS FROM A TRANSPORT AGENCY CUSTOMER SURVEY 80 Overall satisfaction % Rated Good or Excellent Apr 2013 Jul 2013 Oct 2013 Jan 2014 The above graph shows a general increase in overall customer satisfaction. Highway maintenance is a large contributor to public perception of the Transport Agency, and despite our reduced programme, public satisfaction with state highways continues to improve. Apr 2014
55 Draft State Highway Activity Management Plan NZ Transport Agency 53 CUSTOMER IMPRESSIONS OF STATE HIGHWAY ROAD SURFACING 60 % Rated Good or Excellent Apr 2012 Jul 2012 Oct 2012 Jan 2013 Apr 2013 Jul 2013 Oct 2013 Jan 2014 Apr 2014 Maintaining a safe road surface is paramount to the way the Transport Agency manages its highway network. The above graph shows that even though significant savings have been made through reduced maintenance work, public perception continues to improve in relation to roadside surfacing. Perceptions have improved steadily since mid This is despite a continued reduction in spending across this period. 7.5 DEMAND AND VOLUME DRIVERS The proposed programme reflects the expected impacts of a growing and increasingly complex network, and the increasing impacts of growing freight vehicle kilometres travelled. The current capital improvement programme is about 3.75 percent of the replacement cost of the state highway network demonstrating that the size and complexity of the State highway network is continuing to grow and that consequentially the operations, maintenance and renewal works programme will grow to maintain service levels over a larger network. The volume and complexity drivers are shown in detail in the Infrastructure Asset Management Plan. The proposed programme reflects the increasing maintenance and renewal needs arising from: projects constructed in the past where the infrastructure has deteriorated and warrants renewal, eg resurfacing on roads completed seven to 10 years ago new operational costs on recently completed projects when the contractors responsibility for maintenance has expired, eg lighting costs or roadmarking costs the reduction in costs when state highways are revoked and transferred to councils when new state highways are completed. The greatest single impact is the operational costs of $15 million per year that will arise when Waterview tunnel is opened (increasing to $17m when maintenance responsibility transfers to the Transport Agency). The forecast increase in freight vehicle kilometres travelled decreases the life of pavements and surface because of the increased deterioration rate. The programme reflects the impact of a one percent growth in vehicle kilometres travelled on pavement maintenance and renewal costs.
56 54 NZ Transport Agency Draft State Highway Activity Management Plan INVESTMENT RISKS AND OPPORTUNITIES The risks inherent in the proposed programme are that: input prices rise faster than 1.1 consumer-price-index as assumed, potentially adding $15 million the assumed reduction in renewals programmes below the base preservation quantity are unsustainable, with a risk estimate of $25 million per year the efficiency savings of the Network Outcomes Contracts fall below the two percent expected, adding $7 10 million per year the predicted growth due to HPMV freight is greater than the 1.2 percent per year, rising to 3 percent as occurred in 2014, adding $5 million per year. INDICATIVE PROGRAMME BASED ON RISK GROWTH AT THREE PERCENT APPLIED TO ALL COSTS, INCLUDING TWO PERCENT ANNUAL SAVINGS 190 including 2% annual savings Percentage of Current Budget (inflated) GPS Upper Band GPS Lower Band 2014/ / / / / /20 Input Cost 3% growth Year Cost after Savings Work Asset harder and smarter(1.5%) NOC efficiency (0.5%) 2020/ / / / /25 There are opportunities to improve levels of service and value for money not reflected in this programme. Not all state highways can be economically converted to HPMV routes in the short term because the forecast numbers of HPMV trips are small and/or the required works are extensive because of poor strength in current pavements. However, where there is sufficient potential demand for HPMV capacity, it could be advantageous to select HPMV-capable treatments whenever pavements are rehabilitated as part of normal periodic renewal processes. This would deliver HPMV capacity over a longer timeframe for less cost than a current retrofit. The estimated cost of this is between $5 10 million per year. On high volume routes, where resurfacing or pavement rehabilitation works have significant impact on customers, there is potentially an economic advantage by using higher strength, more durable treatments that extend service lives and reduce customer impact. However, these cost more and so require greater renewal expenditure over in order to deliver subsequent savings in maintenance and renewal costs. Examples are: the use of Epoxy OGPA, a high strength road surface material on high volume rigid pavements to extend surface lives from about seven to eight years to potentially 50 years the use of bound structural pavements on higher volume routes to extend the service life of pavements and reduce the impact on traffic. We will continue to explore with our sector partners and investors the business case for investment in these level of service improvements with whole-of-life economic benefits.

57 Draft State Highway Activity Management Plan NZ Transport Agency OPERATING THE NETWORK Photo: Gareth Mills Transport Planner, Auckland
58 56 NZ Transport Agency Draft State Highway Activity Management Plan OVERVIEW Aligned to our intervention hierarchy, operational activities form a key element in our service delivery to our customers and help us maximise the value of our existing investments. The draft SHAMP seeks to continue operational activities as part of our journey management approach, which are delivered on an ongoing basis, frequently in real-time, and in collaboration with other organisations. The four main areas of operational activity are: network monitoring collection of network intelligence traveller information communication of network intelligence management of events control and response to events on the network network optimisation maximising the value of the state highways and our services to customers. The Transport Agency is using journey management to actively manage delays and hazards caused by everyday unexpected events like weather, road works, incidents or congestion. These events are temporary in nature and create an imbalance between what the network provides and what customers need. Journey management will become an increasingly important activity as future changes to the economy, demographics, and environment are likely to increase the frequency and impact of events on the transport network. Intelligent transport systems (ITS) are playing an increasingly important role in shaping how we use and pay for transport systems. Recognising this, the Transport Agency released a position statement on ITS which commits to making more effective use of constantly improving technology. ITS is a means to an end, not the end itself and unlocking the potential benefits will require strong leadership and cross-sector collaboration, which will be a major focus for With increasing availability of in-vehicle navigation and safety systems we will need to further explore the wider benefits of such systems which might be realised through further investment in network management tools to deliver on our strategic goals. Because our customers want to undertake seamless journeys, we need to work more closely than ever before with our local government partners. This requires collaboration, and success will be determined by how strong the Transport Agency s relationships become. 8.2 OPTIMISING NETWORKS To optimise our networks the Transport Agency has adopted a network operating framework, which is an integrated process that helps the Transport Agency and other network providers to better manage and plan the use of the transport network, and its relationship with the adjacent land uses. This framework is a key planning and operational process to inform decisions, and to link those decisions to strategic objectives and operational interventions. The process involves transport stakeholders agreeing on a collaborative view of the strategic intent for a geographic area and how this is enabled and delivered by transport. At all stages, stakeholders agree what is expected of the One Network, having regard to insights into customer requirements from traveller information systems and other sources. This includes an agreed position on which customers have priority on different parts of the network at different times of the day, and the anticipated effect of interventions on the network. Towards the end of the process, there is a tool that allows performance deficiencies to be identified and interventions to be tested and compared. This informs decision-making and helps establish agreements, partnerships and understanding of the network-wide effects of interventions. In turn, this provides a sound basis for the network providers to develop optimised network operating plans.
59 Draft State Highway Activity Management Plan NZ Transport Agency APPROACH TO INVESTING IN JOURNEYS Journey management and operations is new in comparison to the safety portfolio and the maintenance and renewals programs. As a result, there are a number of opportunities to improve our performance and capabilities, integration, collaboration and optimisation. Draft SHAMP seeks to bridge the gaps between the current service offering and what is needed to provide the levels of service that our customers expect (and that we offer through the One Network Road Classification). This will provide a sound basis for future investment in expanding our capabilities in readiness for emerging technologies. The operations programme therefore has a strong focus on increasing the effectiveness of our existing services and processes by tailoring levels of service where there are sound business reasons to do so. We are also rationalising systems and investing such that we can improve the productivity of the transport operating centres. 8.4 PROPOSED PROGRAMME Key elements of the proposed programme are summarised below National operating model We have plans to develop a national operating model and delivery plan outlining how we undertake our activities and the resource, systems, infrastructure, capacity and capability requirements needed to deliver consistent, high quality, and relevant customer outcomes across the journey management area of our business National intelligent transport management system We are investing in the development of a national intelligent transport management system, in collaboration with Auckland Transport, to integrate our approach in managing events on the transport network. Developing this system will also provide the opportunity to improve the productivity of the transport operations centres by reducing the number of systems used to manage events Transport operations centre alignment We aim to gain alignment of the transport operations centres to develop a national approach in making the best use of the national traffic management systems and existing network capacity. This work includes development of a business case to identify the necessary scope and efficiency of services required to achieve our desired outcomes Targeted investment in roadside equipment We will target investment in additional Intelligent Transport System (ITS) roadside equipment aimed at providing accurate and timely information where it is part of an integrated programme of network improvements that demonstrate value for money and strong alignment to our key strategic goals Network improvement plan implementation Continued investment in route optimisation programs and network operating plans will begin to address severe congestion at high priority sites and corridors already identified in the Auckland, Wellington and Christchurch regions.
60 58 NZ Transport Agency Draft State Highway Activity Management Plan Minor improvements network optimisation The nature of network optimisation means that often significant benefits can be gained from relatively small investments. Therefore we are proposing to invest in network optimisation programmes in Auckland, Wellington and Christchurch under the minor improvements work category. The types of activities that will be considered under this work category include intersection upgrades, optimisation of ITS including ramp signals and traffic signals, laining and signing changes, provision of additional ITS infrastructure to enhance monitoring and inform capability including variable messaging signs, and systems enhancements and additional tools where these are identified as a priority. As this is a relatively new area, and as we begin to understand more fully the scale of programme and the directly attributable benefits that can be realised from the programme, it is proposed to limit the programme to between $4 6 million per year Travel time information We will explore further opportunities to assist people to make smart travel choices by considering the best approaches to providing travel time information data to customers and third-party providers, including channels such as the 0800 number, SMS, OnTheMove, , smartphone applications, radio coverage, television coverage and social media Data quality We will improve data integration, collection techniques and alternative data sources to better ensure quality, accuracy and reliability of data used to manage the network and inform our customers Programme costs The indicative costs of the journey management programme in order to effectively operate the network are outlined in the table below. Operations/journey management indicative programme costs Operational expenditure Capital expenditure* $120m $17.5m $125m $25m $184m $15m *Including minor improvements
61 Draft State Highway Activity Management Plan NZ Transport Agency PROGRAMME OUTCOMES On the basis of the above programme, investment in journey management will, over , deliver on the following: improved effectiveness of our transport operating centres leading to a more consistent national approach improved travel time reliability and network resilience in Auckland, Christchurch and Wellington improved network efficiency in Auckland, Wellington and Christchurch improved data integration and quality of information sharing. 8.6 INVESTMENT RISKS AND OPPORTUNITIES The risks in the proposed programme are common to most organisations investing in people, relationships, systems and processes. These include: a lack of commonality of standards and processes leading to sub-optimal operations activities inaccurate scope definition for the procurement of services and assets, leading to increased costs and/or no improvements in achieving the outcomes skill shortages in delivering the services required an increase in demand which outweighs our capacity to deliver a lack of integration and/or agreement with our local partners in the implementation of journey management inconsistency in the application of the services provided. The investment program seeks to minimise these risks and presents a number of opportunities including: providing a fully integrated service offering within our current investment program minimising the need to expand resource capacity by moving towards full automated event or incident response, thus reducing workload on TOC operators. The risks of investing in journey management are far outweighed by the benefits to our customers by operating the network effectively and efficient, improving the resilience and reliability of the network.

62 60 NZ Transport Agency Draft State Highway Activity Management Plan SECTION X 9. IMPROVING 2. TITLE OF THE STATE SECTION HIGHWAY Photo: Chris Collins Senior Project Manager, Christchurch
63 Draft State Highway Activity Management Plan NZ Transport Agency OVERVIEW The draft SHAMP seeks to target investment to specific journeys and geographical priorities where state highway network improvements can make the greatest impact. We anticipate a significant level of financial commitment to ongoing work already underway to support economic growth and prosperity, including delivering the remaining six Roads of National Significance 24 and completing our investments in freight efficiency programmes 25. We also have other programmes which optimise our investment in delivering outcomes to meet the government s direction and the strategic direction of the Transport Agency, including: delivering critical infrastructure replacements: We identify structural maintenance by inspection and prioritise deterioration into high, medium and low priority categories. Our structures are replaced when they are in very poor condition and the net present value of repairs is greater than the replacement cost. There may be other structural replacement projects in the programme; however, these are associated with improvements in levels of service such as additional lanes delivering on our commitments to regionally-funded 26 projects delivering on our Safety Journeys 27 activities improving the resilience of our network 28 : Recent seismic events in Canterbury have highlighted the need to ensure the resilience of the state highway network. We commit to improving our understanding of what resilience means in relation to the state highway network and sharpening our investment and planning tools to ensure we have the means to address it. The Transport Agency expects that over 90 percent of available allocation for improving state highways will already be committed in the NLTP period. This will limit the discretionary funding available in the relevant state highway activity classes. New activities, at least in the first NLTP period, are unlikely to be significant in terms of programme size. However, there will be sufficient latitude to allow an element of dynamic programming to respond to revenue changes during the plan period. 9.2 PROGRAMME OPTIONS AND ALTERNATIVES CONSIDERED Five broad state highway programmes have been developed and considered in reaching a consensus on the preferred programme contained within this draft SHAMP These have been tested for their effectiveness and efficiency in contributing to the draft GPS 2015 and Transport Agency s goals and desired outcomes using the performance measures described in section 5. From this work the optimised preferred state highway programme has been identified as set out below and in appendix B. The alternative programmes considered are summarised in appendix C
64 62 NZ Transport Agency Draft State Highway Activity Management Plan PROPOSED PROGRAMME To effectively contribute to the objectives of the draft GPS 2015 and the Transport Agency s broader strategies our improvements programme is focused on five key areas of activity: reducing deaths and serious injuries reducing collective risk improving reliability better utilisation of existing capacity targeted improvements in journey time. These performance areas align with our own Statement of intent. They address journey time gaps on the state highway through the ongoing RoNS programme and accelerated investment in the Auckland transport package. They also address congestion and improve travel times for freight and general traffic by increasing capacity on key routes which are under pressure. This is coupled with significant programme emphasis on reducing collective accident risk through our targeted investment in the ten-year Safer Journeys roads and roadsides programme Commitments We have a significant current programme of committed work including the RoNS, Auckland acceleration and our Safe System demonstration projects. This, coupled with a requirement to exhaust current R-funds (about $100 million) and continue with the RoNS programme, means that for the next NLTP period it is expected that around $70 million will be available for new commitments, later increasing to $1.2 billion for the period and $3.9 billion for We ensure our programme prioritisation is managed in such a way that there is flexibility to react to changes such as allocation changes or project cost adjustments. For the draft SHAMP , we are proposing a $4.2 billion improvements programme and an additional $260 million contingent programme. Incorporating a contingent programme of activities allows us to be agile in responding to cashflow and value for money opportunities as they arise. We have identified the contingent programme items in appendix B. Our intention is to deliver a balanced state highway improvements programme with a significant emphasis on contributing to economic growth and prosperity, while delivering road safety outcomes. As such, we have examined the shape of our current improvements programme (see figure opposite) which suggests the emphases of our present investments are around 90:10 economic growth: safety.
65 Draft State Highway Activity Management Plan NZ Transport Agency 63 EMPHASIS OF OUTCOMES FROM THE COMMITTED LARGE ACTIVITY PORTFOLIO Economic Growth 89% Safety 11% Therefore, we have chosen to target the balance of any discretionary funding in the current draft GPS 2015 primarily towards a safety outcome to maintain an appropriate balance in our overall programme Essential infrastructure We have identified up to 26 candidate structures for replacement over the next 10 years because these structures are at the end of their economic life and will start to cost more to maintain than to replace. This does not include bridges that may need to be replaced for functional reasons such as increased traffic demand. There is one bridge, the Mangahohi Bailey Bridge in Hawke s Bay, scheduled for replacement in the period. The essential infrastructure replacements programme beyond 2018 is based upon qualitative engineering assessments to give an indicative replacement date. More detailed quantitative engineering investigations are then carried out together with a net present value analysis of maintenance versus replacement in order to confirm the next 3 year programme. Often this investigation and analysis demonstrates that it is more economical to retain the bridge until a later date. The forecasts in the following tables are therefore probably an upper estimate of future essential infrastructure demands. Schedule of essential infrastructure replacements No. replacements Total estimated cost ($m) Roads of National Significance (RoNS) Over the period of , work will continue on the Roads of National Significance programme with the aim of delivering the programme to the schedule as set out in the figure below. Notably, it is anticipated that the Tauranga Eastern Link will be complete by 2016, all Christchurch motorways by 2019 and the entire length of the Waikato Expressway by the end of The majority of the Wellington Northern Corridor and all of the Western Ring Route will be complete by 2020.
66 64 NZ Transport Agency Draft State Highway Activity Management Plan SCHEDULE FOR COMPLETION OF ROADS OF NATIONAL SIGNIFICANCE N Warkworth Whangarei Auckland Papatoetoe Auckland Papakura Hamilton Tauranga Levin New Plymouth Hamilton Gisborne Cambridge Porirua Masterton Carterton Wanganui Palmerston North Napier Te Kuiti Tokoroa Wellington Wellington Greymouth Christchurch Timaru LEGEND Queenstown Roads of National Significance Routes by completion date Christchurch By Invercargill Dunedin Ashburton Akaroa After 2020 State highway

67 Draft State Highway Activity Management Plan NZ Transport Agency Auckland accelerated programme In June 2013 the Hon Prime Minister John Key announced to the Auckland Chamber of Commerce an accelerated package of transport infrastructure improvements for Auckland. The following state highway packages were included in the speech, as shown below: Northern Corridor (SH18/1 Constellation Road to Albany). Southern Corridor (SH20/1 to Papakura). SH20A/Kirkbride Road (Airport Access). East West Link. AUCKLAND ACCELERATED STATE HIGHWAY PACKAGE In May 2014, the government announced, as part of the Budget 2014, $375m of capital funding (by way of an interest free loan) to the Transport Agency to accelerate the projects identified above, as shown in the table below. In its Budget Statement the government noted the forecast increases in freight demand around New Zealand, particularly in Auckland. This, combined with a growing population, necessitated the acceleration of these projects.
68 66 NZ Transport Agency Draft State Highway Activity Management Plan SCHEDULE FOR COMPLETION OF AUCKLAND ACCELERATION STATE HIGHWAY PROJECTS GPS FY13/14 GPS FY14/15 GPS FY15/16 Northern Corridor improvements Southern Corridor improvements Business case development Pre-implementation Implementation Business case development Pre-implementation Implementation Business case development SH20A/Airport Pre-implementation Implementation East West Connections (early deliverables) Business case development Pre-implementation Construction Future Investment Fund Programme In June 2014, the government announced a $212 million programme of regional state highway projects to be accelerated after the 2014 election. These will be advanced through funding drawn from the Future Investment Fund, which was set up to invest proceeds from the sale of some state assets. Five projects have been given a high priority by the government and accelerated to construction: Kawarau Falls Bridge in Otago. Mingha Bluff to Rough Creek realignment in Canterbury. Akerama Curves realignment and passing lane in Northland. State Highway 35 slow vehicle bays in Gisborne. Normanby Overbridge realignment in Taranaki. Six projects will receive funding to complete the business case and pre-implementation stages in preparation for construction: Whirokino Trestle Bridge replacement, in Manawatu/Wanganui. Motu Bridge replacement in Gisborne. Opawa and Wairau Bridge replacements in Marlborough. Taramakau road and rail bridge on the West Coast. Loop Rd north to Smeatons Hill safety improvements in Northland. Mt Messenger and Awakino Gorge corridor in Taranaki. Three projects in Nelson (Nelson southern link), Hawke s Bay (a Port of Napier access package) and Bay of Plenty (Rotorua eastern arterial) will receive investigation and/or design funding. Some of the projects provide benefits such as urban form and improved livability, and would not ordinarily be prioritised for funding over other National Land Transport Fund (NLTF) investments. Others on the list might be funded from the NLTF, under the new regional improvements activity class in the draft GPS 2015, once they ve been accelerated through the investigation and consenting phases with the extra Crown funding.
69 Draft State Highway Activity Management Plan NZ Transport Agency Investing in safety Some good road safety gains have been made over the last eight years, with many of these being on the state highway network. The Transport Agency believes further gains can be made in its commitment to Safer Journeys safe roads and roadsides action plans by taking a priority corridor approach. Over the last three years, the safety resources for state highways have been targeted towards high-risk sites in accordance with Safer Journeys. However, on average over the last three years ( ), we still had approximately 970 reported deaths and serious injuries on the state highway network with a total social cost of $1.04 billion per year. Of these, 820 (85%) occurred on the rural state highway network and 840 (87%) were from head-on, run-off road, and intersection crashes. A safety programme has been developed with the aim of: reducing the total state highway deaths and serious injuries (collective risk) increasing the percentage of the state highway network in the higher KiwiRAP rating bands. The scope of the programme includes high risk state highway intersections and high and high-medium collective risk state highway corridors not otherwise addressed by our current programme of major projects. The high-risk intersections identified were based on: state highway intersections on the top 100 intersections list compiled under the Safer Journeys action plan ( ) other state highway intersections not listed on the top 100 intersections list, but which are classified as high risk under the High-risk intersection guide 29 criteria and considered to be a high priority on the basis of local knowledge. The high and high-medium risk rural corridors were identified for analysis on the basis of: state highways classified as high volume national strategic, national strategic or regional strategic with: agreed safe system transformation or safe corridor intervention philosophies greater than three fatal and serious injury crashes per five km per five years. state highways classified as regional connector and regional distributor with greater than three fatal and serious injury crashes per five km per five years. In accordance with high-risk rural roads guidance 30, adjacent lengths of state highway with similar characteristics, traffic volumes, environment and road use purpose were consolidated into a single corridor for purposes of the national programme. The outcome of this is that, over 10 years, we aim to investigate 24 intersections and 66 corridors and invest around $750 million with the aim of reducing deaths and serious injuries by around 1400 and improving the KiwiRAP rating of over 400 km of state highway. In addition to this core programme we will continue to deliver safety projects, currently in development, that are aligned to the Safer Journeys ethos and which continue to offer value for money. Further, the draft SHAMP includes a number of programmed actions to continue to deliver Safe System signature projects. Under Safer Journeys a number of programmes are emerging around safer speeds and further signature projects. As the scope of these programmes evolves and programmes of activity become clearer, it may be necessary to seek an amendment to RLTPs and the NLTP to accommodate these activities
70 68 NZ Transport Agency Draft State Highway Activity Management Plan NORTH ISLAND HIGH RISK INTERSECTIONS AND HIGH RISK RURAL ROADS PROGRAMME N Whangarei Auckland Hamilton Tauranga Gisborne New Plymouth Napier Wanganui Palmerston North LEGEND First three years Intersections Corridors All Wellington Intersections Corridors State highway
71 Draft State Highway Activity Management Plan NZ Transport Agency 69 SOUTH ISLAND HIGH RISK INTERSECTIONS AND HIGH RISK RURAL ROADS PROGRAMME N Blenheim Greymouth Christchurch Timaru Queenstown Dunedin LEGEND First three years Invercargill Intersections Corridors All Intersections Corridors State highway
72 70 NZ Transport Agency Draft State Highway Activity Management Plan Minor improvements safety Minor safety projects primarily target works identified within the safety management and safety maintenance quadrants of the High-risk rural road guide. As part of the minor safety programme, stock underpasses, pedestrian facilities and improvements associated with area-wide pavement treatments are provided in addition to signage, delineation and road safety barrier works. The programme provides a cost effective means of incremental corridor improvement and generates very good safety investment returns as indicated by the METS 31 report. The proposed minor works projects are regionally developed and then prioritised nationally using the Safety Works Investment Prioritisation Process tool. This ensures the initiatives in the programme are best value for money and selection is based on a nationally consistent application of proven countermeasures. As a result, we ensure targeted investment against an agreed safety metric of deaths and serious injuries saved over 10 years per $100 million invested Increasing effectiveness of freight Our proposed improvements programme explicitly focussed on increasing the effectiveness of freight is targeted in three areas: completing any remaining HPMV routes from tranche 1 delivering Weigh right improvements investment in a second tranche of HPMV routes, including working with other road controlling authorities to ensure the first and last kilometres are covered. Weigh right is a programme of investment aimed at reducing the impacts of illegal overloading in the context of supporting the wider HPMV programme. Where the Transport Agency has weigh in motion sites in operation, overloaded trucks accounted for about eight percent of the overall fleet. In 2012, around 267,000 trucks were observed as overloaded as compared to 232,000 in Reducing the impacts of illegal overloading will: improve truck safety contribute to fairer market conditions provide for better management of our pavements and bridges. As part of Weigh right, a programme of physical works has been identified to target roadside facilities and further expand the network of facilities. The programme has been split into three priorities (see below) and will be delivered gradually over the ten years of this draft SHAMP , subject to confirmed business cases. Weigh Right Programme Priority Number of sites Cost estimate ($m) Further HPMV investment routes are under investigation and part implementation of a second tranche is proposed in the programme. The business case is still being finalised as the economic viability of introducing full HPMV vehicles to a route is very dependent on the effects of the increased loading on the infrastructure. The final programme will be confirmed by Spring Developing Safety Levels of Service and Investment Strategies using the Macro Estimates for Target Setting model (Corben et al, Monash University Accident Research Centre, July 2011)
73 Draft State Highway Activity Management Plan NZ Transport Agency Improving reliability and resilience The Transport Agency has developed a national resilience programme to provide a clearer picture of the risk and resilience profile of the state highway network from a national perspective. The programme will provide a nationally coordinated approach to progressively improving the resilience of the state highway network; its ability to withstand natural and man-made events, and recover quickly from road closures. The programme will progressively enable regional teams to plan and improve our preparedness and capability to respond to events or, where appropriate, improve the robustness of a corridor or ensure there is a viable alternative route available. The programme has been developed to provide a clearer picture of the resilience risks to the state highway network from a national perspective. Events such as the Christchurch earthquakes have led to increased emphasis on resilience across many government agencies. The programme has three core elements as set out below: Programme components Resilience improvements planning for priority corridors Resilience improvements spot treatments Resilience management and preparedness Scope/details Corridor strategic and programme business cases are proposed along priority corridors. Auckland, Wellington and Christchurch are the first, with the aim of greater understanding of the resilience risks and possible treatments. These corridor business cases will be developed during the NLTP period Spot treatments include activities associated with scour, bridge seismic retrofit and rockfall programmes. The activity includes enhanced preventative maintenance and work funded under the minor improvements work category. This activity aims to improve emergency planning, incident planning, communications, alternative route planning and business continuity planning. The activity includes enhanced preventative maintenance and work funded under the minor improvements work category which is proposed to be in the region of $10 20 million per year.
74 72 NZ Transport Agency Draft State Highway Activity Management Plan RESILIENCE HIGHEST PRIORITY ROUTES N Whangarei Auckland Hamilton Tauranga Gisborne New Plymouth Napier Wanganui Palmerston North Wellington Blenheim Greymouth Christchurch Timaru LEGEND Corridor prioritisation Priority 1 Queenstown Priority 2 Priority 3 Dunedin Priority 4 Priority 5 Invercargill Regional Council boundary
75 Draft State Highway Activity Management Plan NZ Transport Agency Future planning We also programme for transport planning activities to ensure an integrated approach to planning and to achieve priority outcomes. Future planning allows us to select the right things to do, to implement them in the right way, at the right time and for the right price. For this draft SHAMP a significant amount of planning is proposed in support of both our National Roads and Roadsides programmes and our National Resilience Programme in addition to supporting joint planning activities with our partners in priority areas such as Auckland. Optimising urban networks in Auckland, Wellington and Christchurch by way of network operating plans being developed with our partners continues. Over the period of this draft SHAMP , the transition from network plans to improvement programmes to deliver on these plans is included. In future NLTP periods, we will look to expand this approach further to include Hamilton, Tauranga and Dunedin. We propose a number of national planning activities to allow better coordinated delivery for our key priorities. This includes in the development of regional highway planning for future operation and optimisation of our major urban motorways, improved freight journeys, speed management, and our contribution to improving cycle facilities for vulnerable users. These will provide an overarching direction for regional delivery, similar to the national safer roads and roadsides and resilience business cases Walking and cycling Walking and cycling provides a healthy, economic and environmentally friendly travel option for New Zealanders. Walking and cycling: alleviate congestion help improve travel times for all road users improve the reliability and resilience of the transport networks. For these reasons, we re committed to planning and delivering safe and cost-effective pedestrian and cyclist facilities on state highways, especially where specific safety concerns exist and/or where state highways form part of the most appropriate route for these modes of travel. In the main, we do this as part of our state highways capital improvements programme. However, we also develop and deliver a programme of dedicated walking and cycling facilities as part of the programme of activities delivered from the Walking and Cycling Activity Class 32. Our proposed programme is contained in Appendix B. 32
76 74 NZ Transport Agency Draft State Highway Activity Management Plan PROGRAMME COSTS The programme cost, shown within the draft GPS 2015 funding ranges for the state highway improvements activity class, is shown in the table below: FORECAST ANNUAL EXPENDITURE NEW AND IMPROVED STATE HIGHWAYS ($M) 2,000 Expenditure ($m) 1,500 1, Upper GPS Lower GPS Forecast Expenditure 2015/2016 1,400 1,000 1, /2017 1,450 1,050 1, /2018 1,500 1,100 1, /2019 1,550 1,100 1, /2020 1,600 1,150 1, /2021 1,650 1,200 1, /2022 1,700 1,200 1, /2023 1,850 1,250 1, /2024 1,950 1,300 1, /2025 2,000 1,350 1, PROGRAMME OUTCOMES In the short term, the scope for a significant change in direction has been limited by available uncommitted revenue. However, over the 10 years of the draft SHAMP , an analysis of the programme shows that, while we maintain our focus on economic growth (including resilience of the network) we will have a growing emphasis on delivering on our safety objectives. This is demonstrated in the figure below which shows the percentage of economic benefits gained from the proposed programme based on the Economic evaluation manual measures in dollar terms. The graph shows that, over the 10 years of we aim to treble the safety benefits from our programme and double those from our activities targeting economic growth. This means an overall change in the focus of our programme towards an 80:20 split of benefits between economic growth and safety, compared to the 90:10 split we have presently. DISTRIBUTION OF MONETARY BENEFITS FROM SHAMP YEAR PROGRAMME ($BN) 18,000 16,000 14,000 12,000 Economic Growth Safety $bn 10,000 8,000 6,000 4,000 2,000 0 Years Years Years
77 Draft State Highway Activity Management Plan NZ Transport Agency 75 This is primarily achieved through investment in a national roads and roadside programme which, over 10 years, aims to improve 24 intersections and 66 corridors and invest around $750 million with the aim of reducing deaths and serious injuries by around 1400 and improving the KiwiRAP rating of over 400km of state highway. The figures below show the distribution of benefits by One Network Road Classification. This shows that the proposed programme continues to target our highest classification roads. DISTRIBUTION OF ECONOMIC GROWTH BENEFITS BY ROAD CLASSIFICATION National Strategic High Volume 33% National Strategic 56% Regional Strategic 4% Other 7% DISTRIBUTION OF SAFETY BENEFITS BY ROAD CLASSIFICATION National Strategic High Volume 27% National Strategic 37% Regional Strategic 20% Other 16%
78 76 NZ Transport Agency Draft State Highway Activity Management Plan INVESTMENT RISKS AND OPPORTUNITIES There are a number of risks associated with the draft SHAMP which could impact the improvements programme and our ability to deliver the proposed programme. These are predominantly around either revenue certainty or overspend/underspend within the programme Revenue certainty Revenue for the National Land Transport Fund (NLTF) comes from fuel excise duty, road user charges, motor vehicle registration and licensing fees and state highway property. The draft SHAMP has been developed on the basis that sufficient revenue will be made available to achieve the draft GPS 2015 expenditure targets. The Transport Agency monitors forecast and actual revenue on a regular basis and we adjust our programmes to remain within the actual revenue position Programme overspend/underspend There are a number of opportunities which could enable us to deliver greater outcomes from the improvements programme as we continually strive for value for money. As we develop activities proposed in this draft SHAMP , opportunities for savings will become apparent which will allow us to potentially deliver more activities for the same amount of money. In addition, increased revenue could allow the Transport Agency to fund higher within the funding ranges set by the draft GPS To prepare for such opportunities we develop and monitor a contingent programme which allows us the flexibility to respond to such opportunities. We are able to identify and forecast any overspend or underspend early. Our procurement and project management teams balance available funding and project commencement to ensure our portfolio is managed dynamically Tolling In accordance with the Transport Agency Statement of Intent s maximise returns for New Zealand goal, we are investigating possible revenue options that could be used to further supplement the National Land Transport Fund (NLTF). One of the revenue options identified within operational parameters is our ability to make further use of tolling new state highways. We will continue to investigate possible tolling opportunities.

79 Draft State Highway Activity Management Plan NZ Transport Agency IMPLEMENTING THE SHAMP Photo: Sarah Cronwright Principal Transport Planner, Auckland
80 78 NZ Transport Agency Draft State Highway Activity Management Plan PROCUREMENT The Transport Agency has a state highway procurement strategy 33 which describes the procurement practices the Transport Agency uses in procuring suppliers, and in the delivery of services and products to achieve best value for money. It incorporates a proactive, future-oriented approach to implementing delivery of projects on the state highway network that take into account the specific characteristics of the particular activity or group of activities NETWORK OUTCOME CONTRACTS The new Network Outcomes Contracts for maintenance and operations activities will ensure efficiency and effectiveness through strategic asset management and focused service delivery. As a single contract model (inclusive of physical works and network management functions) they are a combination of outcome and output performance based measures. These contracts are being phased in gradually and all will be in place before the end of PROPERTY In the process of developing and delivering our activities we are required to manage a programme of property purchase and disposal and a portfolio of accumulated property. Our overall goal is to hold property for the shortest time period possible so our accumulated property portfolio is as small as practical at any point in time. This reduces holding and management costs and also allows us to focus on improving our income return. Our property portfolio, held for future state highway projects, is presently valued at around $1031 million. We programme and buy property in advance of projects, with enough lead time to avoid the risk of holding up a project. We purchase under the Public Works Act 1981 (PWA), and work two to three years in advance of a construction start date. In part this time frame is determined by the compulsory purchase provisions of the PWA, and the time it can take to secure ownership of a property for the Crown. Our disposal programme under the PWA allows us to sell the land which we identify as surplus from projects. It can take some years from purchase for us to be able to identify land as surplus; sometimes well after project construction has started and, in some cases, even after projects are completed. Overall our aim is to sell land as soon as possible, but in accordance with the detailed process to work through and many points where our programming can be impacted ANNUAL PLAN PROCESS The three-yearly planning and development cycle aligns budgeting and planning through the Statement of Intent and NLTP. The result is then translated into an annual plan a programme for implementation. The annual plan is an essential tool that provides certainty on activities to be implemented during the year, and the expenditure connected to it, and is the risk-based mechanism that allows us to respond to revenue and savings opportunities (or pressures) dynamically through each NLTP period to ensure our delivery programme is optimised. 33

81 Draft State Highway Activity Management Plan NZ Transport Agency AUDIT AND REVIEW Photo: Collin McLellan Memorial Park Alliance, Wellington
82 80 NZ Transport Agency Draft State Highway Activity Management Plan AUDIT The Transport Agency is subjected to a variety of reviews and audits for reasons of compliance and business improvement. An annual programme of audits and reviews is produced which covers most aspects of the business. The teams that carry out the audits can be external parties or comprise staff from the following, not mutually exclusive, expertise areas: lead auditor (who would normally have expertise in at least one of the following areas) contract management and administration operations, projects and/or asset management other areas as necessary and decided in consultation with the Business Services Manager. Aside from the lead auditor, other members of the team need not necessarily be trained auditors but this is preferred. Auditors may be drawn from other Transport Agency offices (but not the office being audited) including National Office. The audits are business and risk focused REVIEW Programme reviews As mentioned in Section 10.4 above, the three-yearly planning and development cycle aligns budgeting and planning through the Statement of Intent and NLTP. It is on this three-yearly cycle that we review our direction and programme to assess performance against our key performance indicators proposed for the draft SHAMP Given the relatively long lead time for benefits to be realised, a three yearly planning cycle is considered appropriate, in conjunction with our annual planning process described in the previous section, to ensure that our programme is optimised Activity reviews At the activity level the types of review that Transport Agency state highway activities are subjected to includes, but are not limited to: post approval reviews to ensure ongoing confidence in, and consistency of, approvals for delegated projects in the NLTP post implementation reviews to demonstrate whether our investment has been effective in delivering the expected benefits contract management reviews to provide confidence that supplier management systems and practices are appropriate and are delivering contractual and legislative requirements lessons learnt reviews learning from experience and identifying the successes and the areas for improvement, and how these can translate into improved contract delivery in the future review and prioritisation team process reviews the proposed resurfacing and rehabilitation works in the annual plans, and incorporates any key findings into the programme. investment audits provide assurance to the Transport Agency that our land transport investments are being well managed and providing value for money other external (Audit NZ; Office of the Auditor General; Gateway Reviews) special purpose audits conducted within our operating framework, focussing on areas of interest Network Outcomes Contract audits The Transport Agency has begun benchmarking analysis to gauge the comparative performance of the Network Outcome Contracts (NOC). This is currently focussed on service delivery and investment decision-making for reactive maintenance and renewals. This analysis compares the NOCs with respect to each other, to historic performance and to other road controlling authorities and international jurisdictions. This NOC benchmarking considers a range of dimensions, including costs, levels of service and treatment selection.

83 Draft State Highway Activity Management Plan NZ Transport Agency APPENDIX SECTION AX 2. REGIONAL TITLE OF SUMMARIES SECTION Photo: Rachel Thackwray Personal Assistant, Auckland
84 82 NZ Transport Agency Draft State Highway Activity Management Plan Northland OVERVIEW Northland plays a number of important functions and supports economic drivers for New Zealand. As a nationally significant tourism destination, the region attracts in excess of five million visitors annually. The region is also a generator of key freight movements particularly to and from Northport, Marsden Oil Refinery and its many forestry sites. Having a low population density dispersed over a relatively large area, the state highway network plays a vital and integral part of the Northland s transport network, providing the only link between a number of destinations within the region, Auckland and beyond. TRANSPORT NETWORK PRESSURES Network use pressures Due to the relatively low population density in Northland, congestion is primarily focused around Whangarei during the morning and afternoon peak periods. With a high proportion of primary industries in the region, the network also accommodates a large number of freight vehicles access. Development pressures on the network The Northland region currently has low population density with most development focused around the region s biggest town, Whangarei. The town is anticipated to grow in the next 30 years with development focused around the state highway network as access points. There is also planned growth at the Marsden Point area adjacent to Northport over the next 30 years. Consisting of both residential and industrial area the link between State Highway 1 and State Highway 15A will have increased traffic pressure. Other regional centres a including Waipapa, north end of Kaitaia are also been identified in the regional plan to accommodate specific growth. Forestry continues to grow. Primarily focused in the north and west of the region, much of this is transported to the rest of New Zealand or internationally via Northport. With this likely to increase exponentially in the coming years, this creates additional safety, capacity and maintenance pressures on the state highway network. Northland continues to be a key tourism market for New Zealand, particularly around Paihia and the Bay of Islands area which is primarily serviced by State Highway 11. Currently the region attracts around five million visitors per year and as international and domestic tourism demand increases the pressure on the State Highway network is also likely to increase. NETWORK PERFORMANCE Safety The state highway network is ranked between 2 and 3 star Kiwirap rating. Two roads under Transport Agency authority are listed in the 100 high risk intersections. Both schemes have had works complete or are currently underway. Efficiency The majority of routes in the Northland region are classified as Regional Distributor with State Highway 1 between Whangarei and the Auckland region classified as National Strategic. The state highway, throughout the region, supports a number of transport needs including local traffic movements, freight and tourism. Resilience Resilience is a key issue for the Northland region. In many areas the state highway network provides the only practical connections for communities, freight and tourism. The Transport Agency is working to address known weak points. For example, the Transport Agency is working jointly with regional authorities to address flooding problems through the flood mitigation programme. Additionally, TPAC has been identified to progress resilience work between Whangarei and the Wellesford region boundary. Key journey The Northland region contains part of the national identified critical journeys between Whangarei and Auckland.
85 Draft State Highway Activity Management Plan NZ Transport Agency 83 REGIONAL MACRO TRENDS 80,000 70,000 60,000 50,000 40,000 30,000 20,000 10, Northland Auckland Waikato Bay of Plenty Gisborne Hawke's Bay Taranaki Manawatu-Wanganui Wellington GDP Regional GDP was approximately $5.5 billion in 2013 with marginal growth between 2007 and Auckland has the highest GDP in New Zealand. More than a quarter of the GDP is made up by the manufacturing and agriculture sectors. 80,000 70,000 60,000 50,000 40,000 30,000 Northland Auckland Waikato Bay of Plenty Gisborne Hawke's Bay Population The Northland region s population has had steady growth since 2001, increasing by approximately 15,000 people. 20,000 Taranaki 10, Manawatu-Wanganui Wellington 80,000 70,000 60,000 50,000 40,000 30,000 Northland Auckland Waikato Bay of Plenty Gisborne Hawke's Bay Employment The employee count in Northland has continued to grow over the last 10 years currently at just under 75,000 employed across the region. 20,000 Taranaki 10, Manawatu-Wanganui Wellington
86 84 NZ Transport Agency Draft State Highway Activity Management Plan Auckland OVERVIEW According to Statistics NZ s medium growth projections, Auckland is expected to grow by approximately 480,000 people between 2011 and 2031 (from a base of 1.4 million). The Auckland Plan anticipates that between percent of this growth will be accommodated within the existing urban boundary, with the remaining percent being located in new greenfield expansion areas to the south (Drury Karaka Pukekohe), north-west (Kumeu Huapai) and north (Warkworth and Silverdale). Auckland is the largest commercial and financial hub within New Zealand and Auckland International Airport is also the key gateway to the rest of New Zealand. The state highway network is a vital and integral part of the Auckland transport network which supports the transport choices within the region including public transport and local roads. The Transport Agency and Auckland Transport have adopted a one network approach to managing and developing the transport system in Auckland with a view of optimising its use for all transport users. TRANSPORT NETWORK PRESSURES Network use pressures Due to the diverse nature of land uses in Auckland, there are a number of network use issues across the regions. Within the urban area, a number of key interchanges and state highway links currently experience delays particularly on the Southern, Northern and North-Western motorways and the Central Motorway Junction. Development pressures on the network The population of Auckland is anticipated to growth to two million people by This development, together with the associated employment and services, is likely to put substantial additional pressure on the state highway network. As the main economic hub of New Zealand, the Auckland region accounts for nearly 50 percent of the total GDP output of the country. The region is home to the country s largest and primary international airport as well as well as the City of Auckland port. These, together with many inland industrial areas, result in a large amount of freight movements across the region. This is likely to increase over the next 30 years. While the economy of Auckland is focused primary on industry around the urban centre, there are also a small proportion of primary industries such as forestry in the rural hinterland. The Western Ring Route which will provide a viable alternative to State Highway 1 and the Auckland Harbour Bridge is scheduled to be complete by 2020 with the main infrastructure linkage at the Waterview Tunnels opening in There is likely to be a substantial change in the network patterns across the region following this completion. A number of other major schemes including the Auckland Acceleration package of schemes, the Puhoi to Warkworth improvements and an additional crossing of the Waitamata Harbour are likely to influence development patterns across the greater Auckland region. Key journey The Auckland contains three national identified key journeys: Whangarei to Auckland Auckland City Centre Auckland to Tauranga (via Hamilton) NETWORK PERFORMANCE Safety The entire motorway network around Auckland urban area is 4/5 star Kiwirap rated. Routes outside the urban area are generally classified between 2 and 4 star Kiwirap. Three roads under Transport Agency authority are listed in the 100 high risk intersections. Efficiency State Highway 1, State Highway 18 and State Highway 20, together with the urban section of State Highway 16, are classed as National Strategic High Volume with the remaining routes (including SH22) classified as Regional Distributor or National Strategic. Resilience Due to high volume of traffic and the likely impact of long term closing, the sections of State Highway 1 between Upper Queen Street and Greville Road and Taupiri and State Highway 16 between Upper Queen Street and Hobsonville Road and Taupiri have been identified as medium resilience risk corridors.
87 Draft State Highway Activity Management Plan NZ Transport Agency 85 REGIONAL MACRO TRENDS 80,000 70,000 60,000 50,000 40,000 30,000 20,000 10,000 Northland Auckland Waikato Bay of Plenty Gisborne Hawke's Bay Taranaki Manawatu-Wanganui Wellington GDP Regional GDP was approximately $75 billion in 2013 with significant growth between 2007 and Auckland has the highest GDP in New Zealand. More than a quarter of the GDP is made up by the manufacturing and service sectors ,800,000 Population 1,600,000 1,400,000 1,200,000 1,000,000 Northland Region Auckland Region Waikato Region The Auckland region s population has had substantial growth since 2001, increasing by over 200,000 people. It has the largest population in New Zealand. 800, , , , Bay of Plenty Region Gisborne Region Hawke's Bay Region Northland Auckland Waikato Bay of Plenty Gisborne/Hawke's Bay Taranaki Manawatu-Wanganui Employment The employee count in Auckland has continued to grow over the last 10 years currently at just under 800,000 employed across the region Wellington Canterbury Otago Southland
88 86 NZ Transport Agency Draft State Highway Activity Management Plan Waikato OVERVIEW The Waikato represents 8.5% of the New Zealand economy. Principal employment within the region is within the dairy and agricultural industries although strong growth has been seen in the science and technology and health care sectors over the last 10 years. The proportion of primary industries are significant, with 18% of all exotic tree plantations located in the Waikato and 13% of all New Zealand export logs being harvested here. The Waikato has half a million hectares of pasture which is home to 29% of the national dairy and 13% of beef herds. TRANSPORT NETWORK PRESSURES Network use pressures The road network within the region is complex and extensive with over 1,700 km of road covering 24 individual state highways (23% of the all NZ state highways). 18% of all road freight travels through the Waikato, it is a key transport link between the Port of Tauranga and the rest of the Upper North Island. The region s state highways carry 16% of all traffic and 29% of freight vkt. Freight volumes are expected to increase by 53% in the next 30 years adding around half a million truck movements to Waikato roads per year. The Waikato also has major tourist destinations of Waitomo Caves (SH3, SH37), Taupo (SH1, SH5) and the Coromandel (SH25, SH25a), as well as high numbers of visitors travelling on our roads to reach other destinations such as Rotorua (SH5) and the ski fields at Ruapehu (SH4). Development pressures on the network Moderate to high population growth is anticipated in Hamilton, with a long term population growth of 30%, urban congestion is anticipated to be a significant problem in the future. The continued expansion of Auckland has increased demand for housing in satellite communities to the north of the region. The growth of dairy production in the Waikato has seen in excess of 27% of New Zealand s milk production located in the region. Effects on the land transport system from this growth include an increase in road freight, an increase in the amount of slow and oversized farm vehicles and tankers on the road. Forestry production is increasing, and timber processing is expecting to double production over the next decade (both sawn timber and in other products) which is all anticipated to go by road through Kinleith or Kawerau on its way to the Port of Tauranga for export. This is predicted to be a medium term peak in production which will decline to below current levels by NETWORK PERFORMANCE Safety The Waikato has a significant safety problem; with 30 percent of all DSI crashes for New Zealand, it has the worst safety performance of all regions. There are three corridors with high collective risk (SH1, SH2 and SH29) and 22 high risk intersections in the national top 100. Efficiency State Highway 1 is the most significant of the corridors, being National High Volume, it is one of the busiest state highways outside of the major centres with in excess of 20,000 vpd. It is the primary link in between Auckland and the Upper North Island and suffers congestion through the urban centres. There are a number of corridors that demonstrate a deficiency in travel times and reliability, most notably is SH29 linking Hamilton with the Port of Tauranga where it crosses the Kaimai Range. Resilience There are identified risks on a number of key SH corridors with long alternative routes: SH1 on the Central Plateau (winter conditions and volcanic activity) SH29 on the Western approach to the Kaimai Range (slips, crashes and weather conditions) SH2 in the Karangahake Gorge (flooding, crashes) SH3 between Te Kuiti and Urenui (slips and rock falls). Key journey The Waikato has three key journeys: Journey 3 Auckland to Tauranga via Hamilton Journey 4 Bombay hills to Tauranga via Waihi Journey 5 Hamilton to Wellington
89 Draft State Highway Activity Management Plan NZ Transport Agency 87 REGIONAL MACRO TRENDS Regional GDP ($ mil) 80,000 70,000 60,000 50,000 40,000 30,000 20,000 10,000 GDP by Region Auckland Waikato Bay of Plenty Gisborne Hawke's Bay Taranaki GDP GDP was approximately $18 billion in 2013, with an overall rise of 14 percent over the past five years. The above graph shows a high GDP in comparison to the adjacent regions which influence economic activity within the Waikato. Over 30 percent of the economy is related to agriculture (12%) manufacturing (11%) and the forestry, mining and energy sectors (10%) Census Night population Count 1,600,000 1,400,000 1,200,000 1,000, , , , ,000 0 Usually Resident Population by Region Auckland Region Waikato Region Bay of Plenty Region Gisborne Region Hawke's Bay Region Taranaki Region Population With a population of just over 400,000, the Waikato region has seen strong growth since the last census of six percent (0.7% higher than the NZ average). The population is predicted to grow by approx 14 percent by 2031 to around 470,000. There is an underlying trend of shift away from traditional rural living towards urbanisation. The proportion of people of retirement age will increase by over 80%. (StatsNZ) No of People in Employment 700, , , , , , , Employees by Region Auckland Waikato Bay of Plenty Gisborne Hawke's Bay Taranaki Employment Over 166,000 people are employed within the Waikato which represents 64 percent of the population. Over the last 10 years, growth in employment in the region has been marginally (1%) higher than the national average at 12.6 percent.
90 88 NZ Transport Agency Draft State Highway Activity Management Plan Bay of Plenty OVERVIEW The Bay of Plenty region has a strong primary sector base and growing urban population. It is a significant producer of basic commodities ranging from kiwifruit, dairy and forestry. Most of these are exported through the Port of Tauranga which also handles considerable volumes of export/import cargo for the nation generally. Overall population growth is predicted at 0.9% per year, with an emerging trend of urbanisation across Tauranga and the Western Bay of Plenty and de-population of rural areas. Population growth of 1.9% per year and 1.2% per year if forecast for Tauranga and Western Bay of Plenty respectively, whilst eastern areas are likely to decline. The region also has a concentration of employment in the primary sector above the national average, particularly in the Eastern Bay of Plenty and Central North Island. The workforce has started to diversify into secondary and tertiary industries, namely wood, paper and printing manufacturing, admin and support services and the healthcare and social assistance sector. The latter is experiencing the highest employment growth in the region over (as with national trends), consistent with the need to serve an aging population. TRANSPORT NETWORK PRESSURES Network use pressures Urbanisation and rural de-population has increased network pressures in Tauranga and the Western Bay of Plenty. In particular, there is congestion in Tauranga around the central and eastern corridors (Papamoa to Paengaroa) and northern corridor between Bethlehem and Omokoroa. Development pressures on the network The Port of Tauranga accounts for almost 25% of all imports and exports in New Zealand and around $15 billion to the New Zealand economy (8.6% of GDP). Consequently, the region has the highest heavy vehicle weight intensity of all roads in the country. Road freight is forecasted to increase by 86% by 2035 across the Upper North Island, centred on the Port of Tauranga, putting more pressure on SH2 & SH29. The Tauranga Eastern Link, to be completed 2015, will improve freight efficiency and support sub-regional growth on SH2. There is a need to manage the efficiency of SH2 north and SH29 eastern corridors where demand for access from development competes with the need to maintain efficient freight access. NETWORK PERFORMANCE Safety There are medium-high collective risk along SH2 between Waihi and Tauranga, along SH29 between Tauriko and Kaimai Ranges and several corridor sections in the Eastern Bay of Plenty. There are five out of the top 100 high risk intersections in the region. Efficiency Peak hour congestion occurs at some key urban locations in Tauranga, particularly along SH2 at Mount Maunganui, SH29 at Hairini and SH30 in Rotorua. Works to strengthen pavement and bridges are planned along SH2/33/5 Tauranga to Taupo and SH29 Tauranga to Hamilton. This will enable HPMVs to run on the network and therefore deliver more freight on fewer trucks. Resilience The state highway network is at risk of disruption from catastrophic events such as volcanic activity and tsunamis as well as more frequent events such as crashes, floods and slips. Key journey There are two key journeys in the Bay of Plenty region: Journey 3 Auckland to Tauranga (via Hamilton) Journey 4 Pokeno to Taupo via Tauranga
91 Draft State Highway Activity Management Plan NZ Transport Agency 89 REGIONAL MACRO TRENDS GDP $(mil) 250, , , ,000 50,000 GDP, March Year Bay of Plenty New Zealand GDP The region contributes 5.3 percent of national GDP; regional GDP has increased to 25.7 percent, slightly more than the national average. Port of Tauranga is the largest New Zealand export port by volume with its activities contributing $15 billion to the New Zealand economy, ie 8.6 percent of New Zealand s GDP Population 400, , , ,000 Population, (2014.NIDEA) Tauranga Rotorua Bay of Plenty Eastern BoP Western BoP Population The region is home to 278,000 people, 6.2 percent of New Zealand s population, making it the fifth most populated region in the country. Projected population growth for is 0.9 percent per year. The region s age profile is forecast to be one of the oldest, second only to Northland, by % 66% 64% 62% 60% 58% 56% 54% 52% Employment Rate, March Year Employment The Bay of Plenty region accounts for 6 percent of national employment. In , employment growth was 1.7 percent compared to a national average of 1.5 percent.
92 90 NZ Transport Agency Draft State Highway Activity Management Plan Gisborne OVERVIEW Gisborne makes up one percent of New Zealand s economy in employment terms. It includes some of New Zealand s most remote areas, with mountainous topography and difficult transport routes. Gisborne also has a very different age and ethnic profile compared to the country as a whole. Nearly half the population is Māori (47 percent compared to 14 percent for New Zealand), and it is correspondingly younger than most other regions The region s average household incomes are amongst the lowest in New Zealand, and the region experienced relatively low employment growth in the last decade. The region s population has been growing quite slowly, and despite having the highest proportion of children aged 0 14 of any region, it has been losing working-age people. Accordingly, the Gisborne region includes a high proportion of very young and older dependents. The Gisborne region economy has strong comparative advantages in a number of export-intensive primary industries forestry, sheep and beef farming and horticulture. Exports out of the region s port (Eastland Port) have increased by 100 percent over the last three years, on the back of these industries. The majority of these exports are unprocessed or only semi-processed (for example, about four percent of logs grown in Gisborne are processed in the region). Alongside the region s primary industry strengths, employment in public services such as early childhood, education, health care and social assistance is more important in the region than nationally. Gisborne s population growth in the next two decades will be negligible. The region s most significant opportunities are its natural resources, including in the development of Māori natural resources, to provide employment for the region s young population TRANSPORT NETWORK PRESSURES Network use pressures There are no significant network pressures for general traffic due to the low population and economic growth (historically and forecasted). Development pressures on the network The Government announcement of the closure of the rail line from Napier to Gisborne will alter the transport patterns of goods and may place some pressure on the network. This will particularly impact forestry which is a key aspect of the economy and is expected to increase in the future. However forestry has been subject to high fluctuations in recent years due to international demand and prices. A key issue relating to economic development is the state of the roads. The state of the roads is considered to be one of the most fundamental to the economic development of the region, and with the forecast increase in forestry the issue will be magnified. Further to this the current geometric status of SH35 is unsuitable for the current and predicted logging growth, and combined with the expected increase in tourism traffic. Route security is a concern for the region with one route north and south through the region. Beyond Wairoa to the south the road is susceptible to slips and closures in heavy rainfall events. The difficult terrain, climatic issues (flooding, slips, earthquake prone), and dispersed rural population contribute to the resilience problem. Sources: Regional Land Transport Strategy , East Coast Regional economic potential Study April 2014 MED NETWORK PERFORMANCE Safety There are no medium or high collective risk routes, or any high risk intersections in Gisborne. Efficiency There are no Critical Journeys or nationally strategic routes in Gisborne. There is no congestion and low travel time variability. There are generally low average speeds but likely to be caused by topography rather than traffic congestion. There are three bridges with HPMV deficiency. Resilience There is a low ranked resilience route around the East Cape, and nothing nationally significant. Key journey There are no key journeys in the region.
93 Draft State Highway Activity Management Plan NZ Transport Agency 91 REGIONAL MACRO TRENDS GDP $(mil) 30,000 25,000 20,000 15,000 10,000 5,000 GDP by Region Gisborne Hawke's Bay Taranaki Manawatu-Wanganui Wellington Tasman/Nelson Marlborough GDP Gisborne s GDP has been relatively flat been 2007 and It has the lowest GDP in the central region. A third of regional GDP is associated with construction, horticulture, agriculture, viticulture and forestry and associated manufacturing. The GDP by person for the region is the lowest in the country at $30,450 per year compared to the NZ average of $43, Night Population by Region Population Population 600, , , , ,000 Gisborne Hawke's Bay Taranaki Manawatu-Wanganui Wellington Tasman Nelson Marlborough Gisborne s population forecast is to have very low growth ( ), in low growth scenarios the population is in decline. 100, Employees 300, , , , ,000 50, Employee Count by Region Gisborne Hawke's Bay Taranaki Manawatu-Wanganui Wellington Tasman Nelson Marlborough Employment Gisborne has a small share of the National Employment base in the order of 1% with the lowest regional Low Income- Low Growth trend. The employment rate as a proportion of the working age population is currently equal to the NZ average.
94 92 NZ Transport Agency Draft State Highway Activity Management Plan Hawke s Bay OVERVIEW The Hawkes s Bay region comprises about 4% of the New Zealand economy by employment. It is an exportoriented region with a very significant primary sector. However, household income levels are lower than the national average, and the region has been experiencing relatively slow employment growth over the last 10 years. The Hawke s Bay region has a relatively high proportion of Māori (22% compared to 14% nationally). It also has a lower proportion of working-age residents and a higher proportion of both young and older dependents than the national average. Like many New Zealand regions, its population profile is being affected both by ageing and outward migration. The region s overall population is not expected to grow much in the next two decades. Over half of Hawke s Bay s total land area is dedicated to sheep and beef farming. It also has strengths in horticulture which accounts for over a fifth of regional employment (including seasonal employment) and forestry. The region s wine industry has expanded over the last decade, with growing expertise in red grape varietals and increased production. While overall employment in manufacturing has contracted during the last decade, food processing is growing, with several international firms increasing their Hawke s Bay processing capacity in recent years. These activities are highly export oriented. The Napier Port is important to the region s ability to transport primary produce to export markets. It is now the North Island s second largest export port by volume and New Zealand s fourth largest container terminal. Recent growth has been supported by increases in apples, logs and container shipping volumes and in passenger cruise ship berths. Source: Regional Economic Activity Report 2013 MBIE TRANSPORT NETWORK PRESSURES Network use pressures The rail network creates severance across the region s road network, in particular local roads. Napier City Council has approximately 19 crossing points including two along Prebenson Drive. Development pressures on the network The Port of Napier is the second largest in the North Island, in terms of export volumes, and is continuing to grow. Access to the Port of Napier is constrained by competing land uses along the Ahuriri corridor which is part of the critical link between the growing freight distribution centre at Whakatu (the largest cold storage complex in the Southern Hemisphere). Alongside of the Expressway at Prebenson Drive is a proposed 200ha business park zone which will create a high level of demand on a key freight route which will further reduce the efficiency of freight movements to the port. The Hawke s Bay Regional Council is currently developing plans to construct the large scale Ruataniwha dam in the southern Hawke s Bay. This will provide significant growth in exports and investment in the region, doubling the amount of productive land, and will potentially increase freight volumes on the Hawkes Bay Expressway. The Hawke s Bay Airport Company is planning to create a large scale business park around the airport. This park will complement the airport operations and provide land for commercial businesses. The airport is accessed by the Expressway, and will place more pressure on the network. Key journey There is a key journey from Napier Port to New Plymouth Port, which includes SH2 and SH50 between Hastings and Napier Port. NETWORK PERFORMANCE Safety There is a medium high collective risk route on SH2 from Hastings to Takapau, and a high collective risk on SH2 Coastal route. There are five high risk intersections in and around Napier and Hastings in the top 100 worst intersections. Efficiency SH2 is a national strategic state highway, and SH50 is a national strategic high volume route. The Expressway from the south to the Port of Napier does not fully deliver the levels of services attributed to its classification which effects general traffic and freight. There is relatively minor peak hour flow congestion and journey time deficiency on SH50A Hawkes Bay Expressway. There are inefficient connections to Napier Port due to the adjacent land-use along the route between the SH and the port; there are also issues for freight around Pakowhai and Links Road. There is redundancy in the network with unnecessary parallel SH routes which unnecessarily spreads investment. Resilience Connections to Palmerston North through Manawatu Gorge are subject to frequent slips and closures and detour routes are also at risk, noted as a medium risk resilience route, as is Napier to Gisborne.
95 Draft State Highway Activity Management Plan NZ Transport Agency 93 REGIONAL MACRO TRENDS GDP ($ mil) 30,000 25,000 20,000 15,000 10,000 5,000 GDP by Region Gisborne Hawke's Bay Taranaki Manawatu-Wanganui Wellington Tasman/Nelson Marlborough GDP Hawkes Bay s GDP has been relatively flat with marginal average growth of one percent per year between 2007 and The above graph shows Hawkes Bay is in the middle of the pack for GDP in the Central region. A third of regional GDP is associated with horticulture, agriculture, viticulture and forestry and associated manufacturing Population 600, , , , ,000 Night Population by Region Gisborne Hawke's Bay Taranaki Manawatu-Wanganui Wellington Tasman Nelson Marlborough Population Hawkes Bay s population is relatively flat between 2001 and This trend is expected to continue. In low growth models population growth is predicted to slightly decline. 100, Employees 300, , , , ,000 50, Employee Count by Region Gisborne Hawke's Bay Taranaki Manawatu-Wanganui Wellington Tasman Nelson Marlborough Employment Hawkes Bay has a small share of the national employment base at 3.8 percent with a low income-low growth trend. The employment rate as a proportion of the working age population is slightly above New Zealand average.
96 94 NZ Transport Agency Draft State Highway Activity Management Plan Manawatu OVERVIEW The Manawatu-Wanganui region accounts for 5% of the NZ economy in employment terms. There are two urban centres in the region: Wanganui city and Palmerston North city, the remainder of the region is rural. Overall, the region has experienced the lowest level of employment growth in New Zealand in the last decade and has low average incomes. Parts of the region have a large seasonal workforce, and young people in the Wanganui district have lower levels of qualifications. Primary sector employment has been falling as these sectors become more capital intensive and productive. However, the region has a comparative advantage in R&D, with Massey University, the Riddet Institute Centre of Research Excellence (food and digestion science) and Fonterra s research and development centre all located in Palmerston North. Together, these institutions provide strong research and development specialities in biotechnology, agricultural technology, animal health, food and human wellbeing. Outside of the cities, a substantial primary industries base dominates, specialising in sheep, beef and increasingly dairy farming (which earns higher returns). However, farmers are now facing constraints to further converting land to dairy. Freshwater supplies have been compromised and now have some of the highest nutrient concentrations in the country. The challenges and opportunities for the Manawatu- Wanganui region in the future will include finding ways to balance greater agricultural specialisation within current resource constraints (especially water quality), continuing to commercialise ideas from the region s extensive science and research base and developing the region s higher-value industries to create an enduring range and depth of new job opportunities. Source: Regional Economic Activity Report 2013 MBIE TRANSPORT NETWORK PRESSURES Network use pressures With the exception of Palmerston North and Manawatu, all the territorial authorities within Manawatu-Wanganui are expected to experience population decline. The region has an ageing population aged 65 and household sizes will continue to decline. Development pressures on the network Between 2000 and 2008 the number of people employed in the logistics sector in Palmerston North City and Manawatu District increased from about 4000 in 2000 to 5830 in Large scale operators like Foodstuffs, Progressive Enterprises and Ezibuy have all expanded the volumes of goods passing through their distribution centres. Employment projections to 2031 suggest that the logistics sector will have the strongest growth rate of any sector in Palmerston North City. Farming intensification is likely to result in increasing numbers of heavy vehicles servicing these industries. Long-term projections to 2026 of employment and GDP generation for the primary sector show that both will grow during this timeframe. Wanganui District Council has estimated that more than 50 percent of the district s forest estate will reach harvestable age in the period This is anticipated to generate approximately 270,000 truckloads of logs over this period with most of these movements on low volume rural roads en route to SH1, SH3 and SH4. Source: Horizons Regional Land Transport Strategy NETWORK PERFORMANCE Safety SH3 (Wanganui-Palmerston North-Woodville), SH54 (Palmerston North to Fielding), SH57 (Levin to Palmerston North) and SH56 (SH57 to Awapuni) are medium high collective risk. There are also several high risk intersections on state highways in the vicinity of Palmerston North (SH3/SH54 intersection, SH1/SH57 and SH57/Queen Street intersections). Efficiency Improving efficiency and decreasing travel time variability is a strategic priority. There is minimal congestion (other than minor congestion in major town centres), and minimal journey time deficiency for these critical journey passing through East-Wanganui area. Resilience SH3 (Manawatu Gorge) is categorised as a medium risk resilience route. Shannon-SH56-Awapuni and SH1 (Levin to Sanson), are low risk resilience corridors. Key journey Manawatu-Wanganui includes portions of the key journey between Hamilton and Wellington, and the key journey between New Plymouth Port and Napier Port.
97 Draft State Highway Activity Management Plan NZ Transport Agency 95 REGIONAL MACRO TRENDS GDP $(mil) 30,000 25,000 20,000 15,000 10,000 GDP by Region Gisborne Hawke's Bay Taranaki Manawatu-Wanganui Wellington Tasman/Nelson Marlborough GDP Regional GDP was approximately $8.5bn in 2013 with marginal growth since The primary sector is the largest contributor (about 25%) to GDP. 5, Population 600, , , , ,000 Night Population by Region Gisborne Hawke's Bay Taranaki Manawatu-Wanganui Wellington Tasman Nelson Marlborough Population Manawatu-Wanganui population is currently 232,700 and growing at 0.2% pa. According to Statistics NZ s medium growth projections, Wellington is expected to continue to grow at this rate. 100, , ,000 Employee Count by Region Gisborne Hawke's Bay Employment Employment in Manawatu-Wanganui experienced marginal growth between 2000 and 2005, and since has remained steady at about 100, ,000 Taranaki Employees 150, ,000 50, Manawatu-Wanganui Wellington Tasman Nelson Marlborough
98 96 NZ Transport Agency Draft State Highway Activity Management Plan Taranaki OVERVIEW Taranaki comprises nearly three percent of the New Zealand economy in terms of employment. The region has relatively high incomes, and employment has grown strongly over the last decade. The unemployment rate is one of the lowest in New Zealand, while labour participation rates are relatively high. The region s strong economic performance is underpinned by two high-income, export-oriented sectors oil and gas and dairy farming. The region has successfully built a hub of related industries on this base. There is a diverse range of manufacturing and engineering businesses that provide inputs to both the oil and gas industry and to dairy farming and undertaking unrelated activities. Taranaki s regional innovation links appear to be strong, for example, through the region s oil and gas companies and the specialist support firms clustered in the region, despite the absence of a university or other formal research and development infrastructure. The Taranaki region has also been proactive in sharing its knowledge and experience of leveraging key industries with other New Zealand regions. Taranaki is strongly export oriented, and its key industries are very internationally connected. The region s port is a key asset, alongside roads that connect the region to people and markets in larger urban centres. Connectivity to other places in New Zealand, along with Taranaki s small size, may continue to be a constraint on the region s growth. Taranaki s population is projected to hardly grow over the next 20 years. The region s school leavers achieve similar NCEA level 2 or above qualifications as the national average, but many will leave for education and employment opportunities elsewhere. Source: Regional Economic Activity Report 2013 MBIE TRANSPORT NETWORK PRESSURES Network use pressures There are no significant congestion issues on the network, with the exception of general traffic delay around New Plymouth at commuting times. Development pressures on the network Port Taranaki is the only deep water port on the western coast of New Zealand, 85 percent of exports by value are oil and gas related. Rezoning of substantial areas of greenfield site east of New Plymouth to residential & industrial will create additional traffic demand along SH3 east and may exacerbate safety issues along this corridor. Fonterra is set to expand its dry distribution centre in Taranaki, reducing the freight demand on the network. Within both the dairying industry and sheep/beef industry, amalgamation trends have resulted in a concentration of the processing facilities which has significantly altered the pattern of heavy traffic road use involved in these industries. There is an increase in exotic forest plantations in the region from 9,700 hectares in 1990 to an estimated 26,044 hectares in As a consequence a significant tonnage of logs will require transportation to user plants or ports for export (including to other regions such as the Kinleith Pulp and Paper Mill in Tokoroa). Taranaki is recognised as New Zealand s premier engineering region, particularly for mechanical and electrical fabrication, engineering design and project management. Key journey A portion of the key journey between Hamilton and Wellington and a portion of the key journey between New Plymouth Port to Napier Port are in the region. NETWORK PERFORMANCE Safety There are no high collective risk corridors. SH3 (Hawera to New Plymouth) is categorised medium high collective risk corridors. There are several high risk intersections along SH3. They are SH3/Mangati Road, SH3/Princess St and SH3/ Raleigh Street intersections. Efficiency Improving efficiency and decreasing travel time variability is a strategic priority for NZTA. There are a few bridges with HPMV or 50 Max deficiencies on Critical Journeys and HPMV investment routes (SH3). Some deficiencies are also noted in non HPMV investment routes (ie SH4). There is minimal congestion (other than minor congestion in major town centres), and minimal journey time deficiency. Resilience SH3 (Urenui to Mokau), SH 3 near Fitzroy and SH 1 near Waiouru are low risk resilience routes. The main resilience issues facing the region are events causing slips and rock falls and road closures, and the network effects from crashes.
99 Draft State Highway Activity Management Plan NZ Transport Agency 97 REGIONAL MACRO TRENDS GDP $(mil) 30,000 25,000 20,000 15,000 10,000 5,000 0 GDP by Region Gisborne Hawke's Bay Taranaki Manawatu-Wanganui Wellington Tasman/Nelson Marlborough GDP GDP grew rapidly from 2007 to 2008 ($5.4B to $7.9bn) due to the Petrochemical industry, and has remained reasonably consistent. The comparative GDP per person of $74,341 (2013) is significantly greater than the NZ average of $47,532. Approximately 40% of the regional GDP is associated with Petrochemical industry (published in the forestry, fishing, mining, electricity, gas, water, and waste services industry grouping). Taranaki s reliance on mining makes it one of the least diversified regional economies, although it has a strong agriculture industry. Population 600, , , , ,000 Night Population by Region Gisborne Hawke's Bay Taranaki Manawatu-Wanganui Wellington Tasman Nelson Marlborough Population Taranaki s population forecast to have low to moderate growth ( ). The greater West Wanganui area is forecast to have flat growth 165,310 (2001) 164,070 (2031). The region is not attracting a great number of migrants and average annual net migration from the area is slightly negative. 100, GDP $(mil) 30,000 25,000 20,000 15,000 10,000 5,000 0 GDP by Region Gisborne Hawke's Bay Taranaki Manawatu-Wanganui Wellington Tasman/Nelson Marlborough Employment Taranaki has a small share of the National Employment base at 2.6% with a High Income- High Growth trend. The employment rate as a proportion of the working age population is above the NZ average. Growth in employment increased from 2001 to 2007, then has remained static/slightly negative since Much of the employment growth in the region is based mainly around New Plymouth City, with in the order of half the employed population of the West Wanganui area being within the New Plymouth City Council area.
100 98 NZ Transport Agency Draft State Highway Activity Management Plan Wellington OVERVIEW The Wellington region accounts for 12% of the NZ economy and in employment terms it is similar to Canterbury. Wellington is urban the exception being the rural area in Wairarapa. Wellington has a range of important national functions in line with its role as a capital city, including providing institutional connections with the rest of the world. It is home to the head offices of many firms in the information communications and technology, finance and insurance, and business services sectors. The region has high average household incomes (and when housing costs are considered, residents have the highest incomes in New Zealand). There are also low levels of unemployment. Tourism is growing in Wellington with the fourth highest international visitor spend of any region. To build resilience in the Wellington economy, there are opportunities to internationalise Wellington s professional business service firms; continue to improve tourism takings; and commercialise science and research and development. Regional Economic Activity Report 2014 MBIE TRANSPORT NETWORK PRESSURES Network use pressures As a result of the location and type of employment in Wellington, network congestion regularly occurs when commuters travel to and from Wellington city. There is high dependency between road and public transport travel during these times and network shocks, such as severe weather and road crashes, can cause severe delays and result in economic loss. Development pressures on the network The Wellington Regional Strategy identifies a likely growth path for the Wellington region that includes export of knowledge industries such as professional and financial services, ICT, product design, high-end food and wine. The Wellington International airport is planning to double passenger throughput to over 10 million per year by Centreport, Wellington s inland port, is planning to cater for increased freight movements as a result of alliances with Kiwirail and the lack of freight storage elsewhere in the region. Both the airport and the port are geographically constrained, and these growth plans will increase network pressures, particularly on SH1 between Mt Victoria and Terrace Tunnel and at the Ngauranga interchange. Large mixed use developments are proposed at Lincolnshire Farms (between Lower Hutt and Porirua), near Paraparaumu Airport, and in Miramar. Also significant developments are proposed including a redeveloped retail centre in Johnsonville, two new hotels one with a conference facility catering up to 2,500 guests. NETWORK PERFORMANCE Safety Over 60% of the State Highway network in Wellington is 2/3 star Kiwirap rated. SH58, SH2 (Silverstream to Featherston) and SH 1 (Nikau Reserve to Levin) have high collective risk. There are also high risk intersections on the state highway and within Wellington city. Efficiency SH1 between the Wellington International Airport and Levin is classed as National Strategic High Volume. This portion of SH1 experiences unreliable travel times and congestion during commuter times, and the urban parts throughout the weekend days. Resilience Resilience is a key issue for the Wellington region with dependence on SH1 for access to and from Wellington city. The urban motorway portion of SH1 and SH2 adjacent to the harbour and the Wairarapa and Hutt rail lines are high risk resilience corridors. Key journey Wellington includes the key journey of the Wellington city centre and a portion of the key journey between Hamilton and Wellington.
101 Draft State Highway Activity Management Plan NZ Transport Agency 99 REGIONAL MACRO TRENDS GDP $(mil) 30,000 25,000 20,000 15,000 10,000 GDP by Region Gisborne Hawke's Bay Taranaki Manawatu-Wanganui Wellington Tasman/Nelson Marlborough GDP Regional GDP was approximately $28.5bn in 2013 with moderate growth since Just under half of the GDP is made up of professional services encompassing financial, ICT, public administration and R&D. 5, Population 600, , , , ,000 Census Night Population by Region Gisborne Hawke's Bay Taranaki Manawatu-Wanganui Wellington Tasman Nelson Marlborough Population Wellington s population is currently 480,000 and growing at about 1% pa. According to Statistics NZ s medium growth projections, Wellington is expected to continue to grow at this rate. 100, , ,000 Employee Count by Region Gisborne Hawke's Bay Employment Between 2008 and 2013 the employee count in Wellington was steady at about 240,000. Before 2008, employment was experiencing growth of about 3% pa. 200,000 Taranaki Employees 150, ,000 50, Manawatu-Wanganui Wellington Tasman Nelson Marlborough
102 100 NZ Transport Agency Draft State Highway Activity Management Plan Marlborough OVERVIEW Marlborough makes up just over one percent of the economy. It is a highly export focussed producer of primary products, with some similarities to Tasman. Marlborough has been growing faster and has relatively high incomes. Retired people are attracted to the regions climate and natural amenities and it not has the highest proportion of people over 65 of all regions. Marlborough Port, in the Marlborough Sounds, is the main portal for freight and tourists travelling between the North and South Islands. Employment growth in Marlborough appears to have been driven by productivity improvements obtained from changing land uses and population inflows to the region. A fifth of Marlborough s workforce is employed in the primary sector. However, over the last decade, the region has successfully converted most of the land formerly dedicated to cropping and stone fruit orchards to viticulture so that Marlborough is now New Zealand s largest wine-growing region. It has also diversified into manufacturing and services businesses that leverage off primary sector activities. There has been an increase in technology-based and consultancy businesses providing services to farming and in forestry processing. Aquaculture, aviation and tourism are also important sectors in Marlborough. Construction and services have been growing with the population. Marlborough s economic activities are quite reliant on seasonal labour and are highly export oriented. Source: Regional Economic Activity Report 2013 MBIE TRANSPORT NETWORK PRESSURES Network use pressures The relatively low growth and population of the Marlborough region means there is no significant congestion issues on the network. The road network is generally in reasonable condition both from a safety and capacity perspective. Development pressures on the network The rapid growth of viticulture in Marlborough has seen in excess of 50% of New Zealand s grape production located in the region. Effects on the land transport system from this growth includes an increase in road freight, an increase in the amount of slow and oversized farm vehicles on the road, and a change in settlement patterns with vineyard workers seeking accommodation close to vineyards. Forestry production is increasing, and sawmills are expecting to double production in the next five years. This is all likely to go through either Nelson or Picton Ports. Trans-Tasman shipping from Picton could become a reality. Dairying is likely to continue to expand, particularly if vineyards retreat. This is most likely to occur in Wairau Valley where there is a natural conversion of the marginal areas. This could lead to a change in the current dewatering process that occurs with milk at Tuamarina, altering the frequency and routes for milk tankers. A central government shift to increase aquaculture activities, will lead to an increase in the size of the factory like at Havelock (Sanfords) and likely that King Salmon will quadruple production with an option for a plant in Picton as a result. The Government s decision to not proceed with a Port at Clifford Bay gives certainty to existing freight route between Picton and Blenheim, and gives development certainty for Picton. Sources: Marlborough Regional Land Transport Strategy , Blenheim and Wairau Plains Strategy Study 2008 Key journey The Marlborough region contains a portion of critical journey from Picton to Christchurch. NETWORK PERFORMANCE Safety There are medium high collective risk corridors along SH1 between Picton and Blenheim, and along SH6 from Havelock to Nelson. There is a high risk intersection at SH1/SH62 Spring Creek Intersection which is in the country s top 100 worst intersections. Efficiency SH1 is a national strategic route, and part of the critical journey from Picton to Christchurch. Most of the network has an AADT lower than 6000, with the exception of arterials in Blenheim which are closer to 10,000. There is not considered to be any congestion issues on the network. There are several bridges with HPMV deficiency along SH1, and along SH63. There are moderate HCV traffic volumes between Picton and Blenheim (1,500 2,000 AADT). HCV night time speeds show there is generally low travel time variability. Lower speeds are generally caused by difficult topography and urban speed limits rather than a congested network. Resilience: Picton to Kaikoura has a medium ranking it has very high detour route lengths.
103 Draft State Highway Activity Management Plan NZ Transport Agency 101 REGIONAL MACRO TRENDS GDP $(mil) 30,000 25,000 20,000 15,000 10,000 GDP by Region Gisborne Hawke's Bay Taranaki Manawatu-Wanganui Wellington Tasman/Nelson Marlborough GDP Regional GDP was approximately $2bn in 2013 with marginal growth between 2007 and The above graph shows a low GDP in comparison to the rest of the central region. A third of regional GDP is associated with horticulture, agriculture, viticulture and forestry and associated manufacturing. 5, Population 600, , , , ,000 Night Population by Region Gisborne Hawke's Bay Taranaki Manawatu-Wanganui Wellington Tasman Nelson Marlborough Population The Marlborough Region s population has had marginal growth between 2001 and It has one of the smallest populations in the central region. The region s age profile is changing and is noted as forecast to be one of the oldest, by median age, by 2031 (50.6 compared to 42.8 in Hawkes Bay). 100, , ,000 Employee Count by Region Gisborne Hawke's Bay Employment The employee count in Marlborough continues the same trend, of low growth and the lowest in the central region. 200,000 Taranaki Employees 150, ,000 50, Manawatu-Wanganui Wellington Tasman Nelson Marlborough
104 102 NZ Transport Agency Draft State Highway Activity Management Plan Nelson/Tasman Bay OVERVIEW Nelson Tasman makes up less than two percent of the economy. Nelson is predominantly urban, while Tasman (similar to its neighbour Marlborough) is predominantly rural. Nelson has high household incomes while Tasman has most of its work force in the primary sector. Tasman is highly export focussed and relies on the factories, manufacturing and ports in both Nelson and Tasman for export. The Nelson region is the smallest of New Zealand s regions (by population and land area). It is really a city, with the Tasman and Marlborough regions providing its hinterland. Although it is small, Nelson has developed economic activity in diverse sectors as well as some specialisations. It provides services for Tasman and Marlborough people and businesses and has particular strengths in marine construction and aviation manufacturing and almost one-third of New Zealand s fishing and aquaculture. Like Tasman and Marlborough, Nelson has opportunities to add value to primary products and for smaller-scale enterprises to work together to grow and to export. There are encouraging signs of this between the natural products and nutraceutical contract manufacturers and extraction companies that operate in the region. Over half of Tasman s primary sector employment is in horticulture and fruit growing, with forestry and fishing also being important. Tasman s household incomes are relatively low because of the dominance of primary industries and other activities that employ high proportions of labour with elementary skills. Current water resources are over-allocated in the Waimea basin, and water rationing has been a constraint on the local economy. The local council is planning a major investment in the Lee Valley dam to address this. There are also opportunities for tourism and services to contribute more to the economy, for consolidation and cooperation across small-scale enterprises and for increased forestry productivity through mechanisation, improved harvest methodologies and value-added manufacturing. Source: Regional Economic Activity Report 2013 MBIE TRANSPORT NETWORK PRESSURES Network use pressures The two major industries in the region, horticulture and tourism, have large fluctuations in activity throughout the year, and have corresponding variations in the traffic volumes on the road network. Tasman has experienced a large increase in Richmond population over the last ten years, however in recent times the rate of growth has declined. Development pressures on the network The region has one of the highest export road freight levels in the country per its population. With close to 30% of the region s GDP generated from bulk commodity production, road transport, in the absence of a regional rail network, is the only means of getting export product to the port and airport. Growth will focus on both Nelson and Richmond with Richmond experiencing the highest number of new jobs. Furthermore Nelson Airport, Annesbrook and Port Nelson will remain high employment areas. Further diversity in the economy is expected and growth in the tourism sector in particular is expected to be strong. Sources: Connecting Tasman the Regional Land Transport Strategy, Tracking the Nelson Regional Economy 2013, Nelson Tasman Regional Economic Development Strategy 2007, Nelson City Council Regional Land Transport Strategy NETWORK PERFORMANCE Safety There are neither high collective risk corridors nor high risk state highway intersections. However, SH6 (between Havelock to Nelson) is listed as medium high collective risk corridors. Efficiency Improving efficiency and decreasing travel time variability is a strategic priority for NZTA. There is minimal congestion (other than minor congestion in major town centres), and minimal journey time deficiency. Resilience SH60 (Motueka to Renwick), SH65 (from SH6 to SH1), and SH6 (Nelson to Havelock) are categorised as low ranked resilience route. Key journey There are no key journeys in the region.
105 Draft State Highway Activity Management Plan NZ Transport Agency 103 REGIONAL MACRO TRENDS GDP ($ mil) 30,000 25,000 20,000 15,000 10,000 5,000 0 GDP by Region Gisborne Hawke's Bay Taranaki Manawatu-Wanganui Wellington Tasman/Nelson Marlborough GDP Regional GDP was approximately $3.8bn in 2013, and has experience moderate annual growth of approximately 4% ( ). However GDP is still amongst the lowest for the central region. A third of regional GDP is associated with horticulture, agriculture, viticulture and forestry and associated manufacturing. However, GDP from construction and retail has recently grown than that from agriculture. Population 600, , , , ,000 Night Population by Region Gisborne Hawke's Bay Taranaki Manawatu-Wanganui Wellington Tasman Nelson Marlborough Population The Nelson/Tasman s region s population is low compared to the rest of the central region. The region is not attracting a great number of migrants and the interregional labour migration is slightly negative. 100, Employees 300, , , , ,000 50, Employee Count by Region Gisborne Hawke's Bay Taranaki Manawatu-Wanganui Wellington Tasman Nelson Marlborough Employment The employee count follows the same trend as economy and population, being low with little growth between 2000 and 2013.
106 104 NZ Transport Agency Draft State Highway Activity Management Plan West Coast OVERVIEW The West Coast makes up less than one percent of New Zealand s population and workforce. The region spans the greatest length in New Zealand, equivalent to the distance from Auckland to Wellington. 85 percent of its land is part of the National Conservation Estate and not available for commercial use. Over the last decade, average household incomes on the West Coast have grown so that they are now among the highest in New Zealand. The region has experienced significantly higher than average growth in jobs but this growth has now declined in the recent years. The West Coast economy is driven by mining, dairying and tourism. Mining directly employs about 10 percent of the region s workforce and dairying about six percent, but together, these high-value, capital-intensive activities generate over half of the region s income. These businesses make the West Coast highly export orientated. High world prices for minerals and dairy milk have so far protected the West Coast region from the effects of the global financial crisis. The West Coast is likely to remain a small and relatively isolated region with some natural resource advantages. It has a low proportion of people under 40, and the population is forecast to grow only slightly by The region s secondary school education rates are also the lowest in New Zealand. To offset this and build resilience to external shocks on the local economy, the challenge for the West Coast is to diversify economic activity. Regional Economic Activity Report 2013 MBIE Transport network pressures TRANSPORT NETWORK PRESSURES Network use pressures The road network is generally in reasonable condition both from a safety and capacity perspective. The low growth and population of the West Coast region means no significant congestion on the network. Development pressures on the network: Tourism is one of the key contributors to the West Coast economy, with many tourists passing through as part of the loop of the South Island. The most popular destinations in the West Coast are the glacier country encompassing Franz Josef and Fox glaciers, and the South Westland World Heritage Area. The second most visited area is Punakaiki, between Westport and Greymouth. This industry relies heavily on the availability of, and ease of access to, the roading network. There are signs of growing cycling tourism in the region, leading to new infrastructure demands. Mineral extraction is the largest single contributor to the region s GDP and is expected to continue to expand in the next 10 years. In 2008, mining production accounted for 70 percent of the primary sector exports and 92 percent of the total sales made in the region. Coal is the primary mineral extracted and relies on local roads and state highways within the region for transport of material to rail heads, and the rail network for export to markets through Lyttelton. Agriculture is dominated by dairying. It has a heavy reliance on the roading network for the transport of milk product from farms and factories spread throughout the region. Westland s factories are spread across the West Coast, processing around 500 million litres of milk annually. The industry has experienced rapid growth over the past 10 years. Finished product is railed out of the region to be exported from Lyttelton. Forestry has declined in recent years but still remains an important industry on the West Coast. Local roads and state highways provide important linkages between forests, mills, and to market (or rail heads) throughout the region. Key journey The West Coast region does not contain any key journeys. NETWORK PERFORMANCE Safety The corridors have low collective risk throughout the West Coast region. There is high personal risk south of Haast River Bridge, medium-high north of Greymouth, and medium to low risk otherwise. All corridors are 2 and 3 star rated. Efficiency There are low traffic volumes, less than 2000 vpd, throughout most of the region, although there are up to 9,000 vpd around Greymouth and 5,000 vpd near Hokitika. The travel time variability is low, with some winding sections to keep speeds lower. There is no congestion although there are areas of limited and poor passing opportunities and many one lane bridges, especially south of Hokitika. There is not a current HPMV investment route although there are three bridges with 50MAX restrictions. Resilience There are a high number of disruptions south of Haast River Bridge and northern parts of the region. There are very high detour lengths south of Mahinapua, medium and low elsewhere. Risks of road closure across the region are mostly from slips/rock fall, crashes, flooding, as well as snow in the passes.
107 Draft State Highway Activity Management Plan NZ Transport Agency 105 REGIONAL MACRO TRENDS GDP $(mil) 1,800 1,600 1,400 1,200 1, West Coast GDP West Coast GDP Regional GDP was 0.7 percent of national GDP at $1.5bn in 2013, with a growth of 33.4 percent between 2007 and percent of regional GDP is associated with the forestry, fishing, mining, electricity, gas, water, and waste services; manufacturing; and agriculture sectors Year Number of People 32,500 32,000 31,500 31,000 30,500 Estimated Usually Resident Population, West Coast, West Coast Population The West Coast region s population has had slow growth between 2001 and 2013 of 0.5 percent per year. It has the smallest population in New Zealand. 30, Year 16,500 16,000 Employee Count Employment The employee count in the West Coast has had a slight decline in the most recent years. Employees 15,500 15,000 14,500 West Coast 14,000 13, Year
108 106 NZ Transport Agency Draft State Highway Activity Management Plan Canterbury OVERVIEW Canterbury is New Zealand s largest region by area. Christchurch is home to nearly three-quarters of the region s people and a hub for the South Island. The Christchurch earthquakes rebuild, which is estimated to cost $30bn, has had a national as well as regional economic impact. For most of the last decade, average household incomes in Canterbury have been slightly higher than the national average, and employment has grown strongly. Canterbury is New Zealand s second biggest economy at 13.2 percent of GDP with economic activity evenly distributed between the agriculture, manufacturing, and services sectors. There has been a rapid conversion of land to dairy farming in the region over the last decade, and Canterbury now has the highest average dairy herd size in New Zealand and correspondingly high productivity levels. Sixty eight percent of New Zealand s freshwater is located in Canterbury. However, increased irrigation and management of nutrient runoff will be required to support further growth in dairy farming. Regional Economic Activity Report 2013 MBIE TRANSPORT NETWORK PRESSURES Network use pressures There are no significant congestion issues on the rural network but there are congestion issues in and around the urban areas of Christchurch, Ashburton, and Timaru. The road network is generally in reasonable condition both from a safety and capacity perspective. Development pressures on the network Canterbury is known as one of the most productive areas for dairy farming in New Zealand. Fonterra s dairy factory at Clandeboye generates over 300 milk tanker movements on the network every day at peak production to take product for processing. Clandeboye processes up to 12 million litres of milk daily. Fonterra s Darfield Factory processes up to 6.6 million litres of milk daily. Fonterra s factory at Studholme near Waimate is putting increasing pressure on southern part of the network, with over 160 million litres of milk processed every year. There was a sharp increase of 19 percent dairy cattle between 2011 and 2012; this growth drives an increase in freight. Statistics New Zealand The construction industry has increased due to the demands of the Canterbury rebuild following the Canterbury earthquakes in 2010/11. More than 8,000 dwellings will need to be replaced completely and many thousands more need repairing to various degrees. Over 1200 buildings in the CBD have been demolished, along with many other commercial buildings throughout the city. Demolition, repairs, and construction of civil infrastructure, new dwellings and commercial buildings will result in a period of heightened activity. The sector is supported by a complex supply chain of mainly domestic manufacturers. (CDC, 2014) Key journey The Canterbury region contains a portion of key journey 8 from Picton to Invercargill. Key journey 9 occurs within Christchurch. NETWORK PERFORMANCE Safety Most of roads in the region are 2 3 star rating. SH1 between Waipara and Ashburton is rated as med-high collective risk and the balance of SH1 between Kaikoura and Oamaru is medium risk. There are 16 high risk intersections within the region. Efficiency SH1 is a National Strategic Highway with sections of high volume. SH73 is a Regional Strategic highway outside Christchurch. Most state highway traffic volumes are low-moderate. SH1 between Waipara and south of Timaru has over 6000 vpd, with higher volumes in the urban areas. Traffic volumes are very high on RoNs corridors in Christchurch, where volumes can exceed the road capacity. There are varying urban congestion problems in Christchurch, Ashburton, and Timaru. There is low travel time variability over the most of the network, although medium-high in parts of Christchurch. There are moderate HCV traffic volumes along SH1 ( HCV/day) with high HCV volumes in Christchurch. Brougham Street as the freight route to Lyttelton port carries 4300 trucks per day in highly congested conditions. SH79 is an HPMV investment route with some bridges with HPMV restrictions. SH 1 is an HPMV investment route with bridge monitoring at Rakaia and Rangitata rivers and up to nine sites near Kaikoura. Resilience There is high risk to network availability at the Tunnel Motorway/ Lyttelton Tunnel, and medium risk for Springfield- Arthurs Pass and around Kaikoura. There are very high detour distances for the Otira and Arthurs Passes, and high north of Kaikoura and at Rakaia Bridge. There are risks of road closure from flooding, slips and crashes along State Highway 1, with risks from snow and slips/rock fall, through the Alpine Passes.
109 Draft State Highway Activity Management Plan NZ Transport Agency 107 REGIONAL MACRO TRENDS 30,000 Canterbury GDP GDP GDP $(mil) 25,000 20,000 15,000 10,000 5, Canterbury Regional GDP was 13.2 percent of National GDP at $27.8bn in 2013, with a growth of 33.5 percent between 2007 and Canterbury s increase in GDP was led by the Christchurch Rebuild with the construction industry the leading contribution. The above graph shows a steady growth in GDP. A third of regional GDP is associated with manufacturing, agriculture and professional services sectors. Year Number of People 550, , , , , , ,000 Estimated Usually Resident Population, Canterbury, Canterbury Population The Canterbury region s population grew by an average of 0.7 percent each year between 2001 and 2013, compared to the national average of 1.0 percent. With 13 percent of New Zealand s population, it is the second most populous region following Auckland. 480, , Year 280, , ,000 Employee Count Employment The employee count in Canterbury continues the same growth trend as general population. 265,000 Canterbury Employees 260, , , , , , , Year
110 108 NZ Transport Agency Draft State Highway Activity Management Plan Otago OVERVIEW The Otago region has a diverse economy with strengths in education, tourism and agriculture. The Region contributes 4.3% of national GDP, provides 5% of national employment and is home to 4.8% of New Zealand s population. Over the last 10 years, population growth in Queenstown Lakes and Central Otago has been among the highest in New Zealand. Population growth in the rest of the region has been slower. In the last five years, the region has experienced the second-highest positive net migration in the country. Otago has significant employment in sheep, beef cattle and grain farming, with activity primarily concentrated in Waitaki and Clutha, and significant employment growth in dairy farming. Central Otago has strengths in stone and pip fruit, grape growing and wine production. Tourism activity is concentrated in the Queenstown Lakes District and generates a very high share of regional GDP, which has shown solid growth over the last five years. Professional, scientific and technical services experienced 4% annual average employment growth over the last decade, while education and training employment grew 2.1% over the same period, reflecting the strong tertiary education and research activity in Dunedin. The region s average annual household income and GDP per capita sit below the national average. This is likely to be partially driven by the region s high share of tertiary students and seasonal workers earning part-time wages. TRANSPORT NETWORK PRESSURES Network use pressures The large state highway network combined with relatively low population density of the Otago region means there is no significant congestion issues on the network with the exception of Queenstown. The network is generally in reasonable condition both from a safety and efficiency perspective. Development pressures on the network The Queenstown Lakes District is one of the fastest growing districts in New Zealand. In the last seven years Queenstown Lakes District has grown at 23%, increasing the demand for residential housing and accommodation. This has placed significant pressure on the transport network. This rapid growth has created problems unique to the Queenstown area. Congestion is a growing issue with Frankton Road (SH6A) and SH6 in Frankton experience significant peak hour delays. The network also suffers from significant seasonal peaks. The peak seasons are December to March and July and August, where self-drive tourists significantly add to the congestion on the network. Over the last decade there has been a significant increase in the area of irrigated land across the region to support dairy conversions. Similar growth has also been seen with forestry. This has resulted in an increase in the number of heavy vehicles (including HPMV) on the network which causes additional damage to pavements and bridges requiring more maintenance investment. NETWORK PERFORMANCE Safety The area has a high personal risk safety record, particularly on tourist routes, such as SH6 Wanaka to Haast. Dunedin s central city has a history of fatal and serious injury cyclist and pedestrian crashes. Since 2003 there have been several cycle crashes in central Dunedin, including three fatalities, two of these were in 2011 and There is a high risk intersection in Dunedin on SH1, the intersection of Pine Hill Rd and Great King St. Efficiency Overall the efficiency of the region is good, apart from a few isolated areas, i.e. SH6 and SH6A leading into Queenstown. Resilience The state highway network across the region is subject to winter road conditions with the associated resilience issues. Rock falls can have detrimental impact on the region, severing life lines for rural communities, affecting tourism and the movement of freight for primary and other industry. On SH1 between Dunedin and Waitaki River there are a number of locations that are regularly closed due to flooding. Key journey The Otago region contains a portion of key journey 8 which runs from Wellington to Invercargill. The Otago section is on SH1 between the Waitaki River and the Otago/Southland boundary near Clinton.
111 Draft State Highway Activity Management Plan NZ Transport Agency 109 REGIONAL MACRO TRENDS Regional GDP, 2013 $9.1b GDP value 4.3% of national GDP 25.6% Change in GDP GDP From Otago s GDP increased by 26%, slightly above the national increase. The main industries are primary industries followed by tourism, health care and social assistance. $43,086 GDP per capita $14.1b $47, % New Zealand Population 250, , , ,000 Population Growth Otago Southland Population Half of Otago s population live in Dunedin. While the region s overall population is project to grow only slowly in the coming decades, Queenstown and Central Otago are amongst the fastest growing subregions in New Zealand, in both population and economic terms. 50, Year 68% 67% 66% 65% 64% 63% 62% 61% 60% Employment Rate, March Year Otago New Zealand Employment The region s employment rate is above the national average and the people have high levels of education attainment and skills. The region also enjoys a below average unemployment rate and low youth NEET (not in employment, education or training) rate.
112 110 NZ Transport Agency Draft State Highway Activity Management Plan Southland OVERVIEW Southland is a small to medium-sized economy with a strong agriculture and manufacturing base. In 2013, Southland contributed 2.4% to national GDP, 2.3% of national employment, and 2.1% of the national population. Southland has many attributes which make it a solid regional performer, as measured by a range of economic indicators. The region s economy relies extensively on its natural resources. Both the dairy industry and the Tiwai Point Aluminium Smelter, which are large employers and generators of income, are dependent on freshwater. The dairy industry relies on the reliable rainfall for growing grass and Tiwai Point uses the power generated from the Manapouri hydro power station. Southland has a significant amount of employment in exportfocused agri-business, with the sheep, beef, grain farming, and dairy sectors representing 13.7% of total employment in the region. The dairy sector also exhibited strong annual employment growth from From Southlanders report the highest living satisfaction of anywhere in New Zealand. Southland also has the lowest median house price ($190,000), and rental cost per annum ($11,000). The Southland region has opportunity to increase economic outputs by continuing to raise productivity in areas of traditional strengths such as sheep and beef farming, dairy and aquaculture. Other activities include tourism, information technology, manufacturing (pharmaceuticals and electronics), the Awarua Earth Observation system and international education. TRANSPORT NETWORK PRESSURES Network use pressures The relatively low growth and population of the Southland region means there is no significant congestion issues on the network. Similarly, the road network is generally in reasonable condition both from a safety and capacity perspective. Development pressures on the network Over the last decade there has been a significant increase in the area of irrigated land across the region which supports the growth in conversion of farms from sheep and beef to dairying. Similar growth has also been seen with forestry. This has resulted in an increase in the number of heavy vehicles (including HPMV) on the network which causes additional damage to pavements and bridges requiring more maintenance investment to keep these routes to an acceptable level of service. There are number of older bridges and culverts in the region which are susceptible to damage from these increased loadings with some bridges requiring significant upgrading. NETWORK PERFORMANCE Safety The area has a high personal risk safety record, particularly on tourist routes, such as SH94 Te Anau to Milford. Efficiency Overall the efficiency of the region is good, apart from a few isolated areas. Resilience The state highway network across the region is subject to winter road conditions with the associated resilience issues. Rock falls can have detrimental impact on the region, severing life lines for rural communities, affecting tourism (particularly on SH94) and the movement of freight for primary and other industry. There are a number of locations around the region that are regularly closed due to flooding. Key journey The Southland region contains a portion of key journey 8 which runs from Wellington to Invercargill. The Southland section is on SH1 between the Otago/Southland boundary and Invercargill
113 Draft State Highway Activity Management Plan NZ Transport Agency 111 REGIONAL MACRO TRENDS Regional GDP, 2013 $5.0b GDP value 2.4% of national GDP 40.9% Change in GDP GDP Southland s GDP increased by 41%, well ahead of the national increase. From this was driven by large increases in agriculture, especially dairy farming, and in 2012 increased due to sheep and beef farming and manufacturing industries. $52,701 GDP per capita $14.1b $47, % New Zealand Population 250, , , ,000 Population Growth Otago Southland Population Long term, the biggest constraint for Southland is its stagnant population growth and aging population. There is no population growth projected for the region through to 2031, which is the lowest of any region in New Zealand. 50, Year 72% 70% 68% 66% 64% Employment Rate, March Year Employment Southland has one of the highest employment rates in the country and a low unemployment rate. Southland s economy has been generating new employment opportunities faster than the population is able to grow. 62% 60% 58% Southland New Zealand

114 112 NZ Transport Agency Draft State Highway Activity Management Plan APPENDIX SECTION XB 2. DETAILED TITLE OF NATIONAL SECTION PROGRAMME Photo: Kevin Reid National Manager Network Outcomes, Wellington
115 Draft State Highway Activity Management Plan NZ Transport Agency 113 IMPROVEMENTS PROGRAMME FUNDED COMMITMENTS Key: Development Construction Development & Construction Region Activity Name Profile Priority Rank Phase Auckland Western Ring Route RONS HHM 2 Auckland Main Highway Ellerslie Highway Northbound auxilliary lane HMH 2 Canterbury CHCH Southern Motorway Halswell Junction Road to Waterholes (Stage 2) HHM 2 Canterbury CHCH Northern Arterial Rural with QE2 HHM 2 Canterbury Western Airport bypass enabling works (Barters Broughs) HHM 2 Taranaki Vickers Road to New Plymouth City MHH 2 Waikato SH2 Pokeno to Mangatarata Safe System Demonstration Project: Section A HHM 2 Auckland Manukau Harbour Crossing including Old Mangere Bridge HMM 3 Auckland Waitemata Harbour Crossing HHL 3 Bay of Plenty Route K conversion to ETC HHL 3 Bay of Plenty SH 2 Northern Corridor Safe System Programme HMM 3 Bay of Plenty TEL Tauranga Eastern Link HHL 3 Hawkes Bay HB Expressway Southern Extension HHL 3 Manawatu-Whanganui Wellington RoNS 9. Otaki to Levin HHL 3 Manawatu-Whanganui Whakaruatapu Stream Bridge Replacement & Realignment HMM 3 Northland Loop Road North to Smeatons Hill Safety Improvement HMM 3 Northland SH1 Corridor Improvements Whangarei HMM 3 Waikato Cambridge Section HHL 3 Waikato Ngaruawahia Section HHL 3 Waikato Rangiriri Section HHL 3 Wellington SH1/2 Petone to Grenada (Ngauranga to Linden (P2G) HHL 3 Wellington Wellington RoNS 1. Airport to Mt Victoria tunnel HHL 3 Wellington Wellington RoNS 3. Terrace Tunnel Duplication HHL 3 Wellington Wellington RoNs 4. Ngauranga to Aotea Quay HHL 3 Wellington Wellington RoNS 5. Transmission Gully HHL 3 Wellington Wellington RoNS 6. Mackays to Peka Peka HHL 3 Wellington Wellington RoNS 7. Peka Peka to Otaki HHL 3 Wellington Wellington RoNS (2) Tunnel to Tunnel HHL 3 Auckland Warkworth Stage 1 MMH 4 Bay of Plenty Hairini Link Stage 4 MHM 4 Otago Caversham Highway Improvements: Stage 2 HML 5 Auckland Hobsonville Deviation MMM 6 Bay of Plenty Rotorua Eastern Arterial MMM 6 Manawatu-Whanganui Corby Road South Curves MMM 6 Bay of Plenty Tauriko Upgrade HLL 8 Southland Woodlands Passing Lanes MLM 8
116 114 NZ Transport Agency Draft State Highway Activity Management Plan PLANNED Key: Development Construction Development & Construction Region Activity Name Profile Priority Rank Phase Waikato SH2 Pokeno to Mangatarata Safe System Demonstration Project: Section B HHH 1 Waikato SH2 Pokeno to Mangatarata Safe System Demonstration Project: Section E HHH 1 Auckland East West Link HHH 1 Auckland SCI Takanini North HHH 1 Auckland SH1 Upper Harbour Highway to Greville NBD 3-laning HHH 1 Auckland SCI Takanini South HHH 1 Canterbury Brougham Street Corridor Improvements HHH 1 Wellington SH2 Melling Efficiency and Safety Improvement HHH 1 Auckland Northern Corridor Initiative Project Development HHM 2 Nelson SH6 Rai Saddle Second Curve Realignment MHH 2 Canterbury CHCH Northern Arterial Rural with QE2 HHM 2 Canterbury Western Belfast By-Pass HHM 2 Canterbury Groynes to Sawyers Arms 4L HHM 2 Canterbury Harewood Rd to Yaldhurst Rd HHM 2 Canterbury Christchurch Southern Motorway (Stage 2) HHM 2 Wellington SH58 Grays Road to SH2 HHM 2 Canterbury Lyttelton Tunnel Safety Retrofit HMH 2 Bay of Plenty Maunganui-Girven Rd Intersection Improvement (MGI) HHM 2 Waikato SH1 (Cambridge to Piarere), NSRRP HMH 2 Bay of Plenty SH2 Northern Corridor Safe System Programme HMH 2 Auckland NCI SH1 Greville Rd Interchange Upgrade HHM 2 Auckland NCI SH1/18 Interchange Upgrade HHM 2 Auckland NCI SH18 Intersection Improvements HHM 2 Canterbury Ashley to Belfast Safety Improvements HMH 2 Canterbury Pineacres Safety Improvements HMH 2 Hawkes Bay SH2 Napier Road Intersection HMH 2 Bay of Plenty SH2/Wainui Rd-Matekerepu Intersection Route Security MHH 2 Waikato SH3/Waitomo Road Intersection NSRRP HMH 2 Bay of Plenty SH5/SH30 Hemo Road/Old Taupo Road Safety Improvements HMH 2 Otago Glenda Drive HMH 2 Waikato SH1 (Puketarata to Manawatu Bndy), NSRRP HMH 2 Waikato SH1 (Putararu to Tokoroa), NSRRP HMH 2 Waikato SH1 (Upper Atiamuri to Wairakei), NSRRP HMH 2 Waikato SH1 (East Taupo Arterial), National Safety Roads & Roadside Programme HMH 2 Waikato SH3 (Hamilton to Ohaupo), National Safety Roads & Roadside Programme HMH 2 Waikato SH3 Te Awamutu to Otorohonga Imp National Safety Roads & Roadside Programme HMH 2 Manawatu-Whanganui Wanganui-Whangaehu Safety Improvements HMH 2 Waikato SH1B (Taupiri to Gordonton), National Safety Roads & Roadside Programme HMH 2 Waikato SH27 (SH26 to SH24), National Safety Roads & Roadside Programme HMH 2
117 Draft State Highway Activity Management Plan NZ Transport Agency 115 PLANNED Key: Development Construction Development & Construction Region Activity Name Profile Priority Rank Phase Bay of Plenty SH2: Wainui Rd to Opotiki, National Safety Roads & Roadside Programme HMH 2 Waikato SH29 (Bay of Plenty boundary to SH24), National Safety Roads & Roadside Programme HMH 2 Wellington SH2/58 Intersection Improvement HMM 3 Wellington Wellington Port Access Improvements HMM 3 Wellington Wellington RoNS (7) Peka Peka to Otaki Expr HHL 3 Manawatu-Whanganui Wellington RoNS 9. Otaki to Levin HHL 3 Waikato SH1 Waikato Expressway Long Swamp Section HHL 3 Waikato SH1 Waikato Expressway Huntly Section HHL 3 Waikato SH1 Waikato Expressway Hamilton Section HHL 3 Northland Springfield to Mata Median Barrier HMM 3 Bay of Plenty Tauranga Northern Link HMM 3 Canterbury Woodend Corridor Safety Improvements HMM 3 Marlborough SH1 Weld Pass Realignment HMM 3 Auckland Brigham Creek-Railway Rd Median Barrier HMM 3 Auckland SH20A to Auckland Airport HMM 3 Canterbury Brougham/Burlington Intersection HMM 3 Canterbury Carmen/Main South Minor Intersection Improvements HMM 3 Northland Springfield to Mata Median Barrier HMM 3 Canterbury Rakaia to Ashburton Safety Improvements HMM 3 Canterbury SH1 Rolleston Intersection Improvements HHL* 3 Marlborough SH1 SH62 Spring Creek Intersection RAB HMM 3 Gisborne Eastland Port Access HMM 3 Hawkes Bay SH2 Watchman Rd, HB Airport Intersection HMM 3 Auckland Improved Incident and Event Management HHL* 3 Bay of Plenty Minden Te Puna Intersection Improvements HMM 3 Wellington SH2 Guardrails on Rimutaka Hill HMM 3 Manawatu-Whanganui SH57: SH1 to Shannon Safety Improvements HMM 3 Taranaki Waitara to Bell Block Route Improvements HMM 3 Waikato SH1 (Hatepe to Turangi), National Safety Roads & Roadside Programme HMM 3 Waikato SH2/25 intersection upgrade HMM 3 Southland Invercargill Moto Rimu Rd Safety Improvements HMM 3 Southland Longbush Invercargill Safety Improvements HMM 3 Auckland Ngakoroa Realignment & Passing Lane HLH 4 Canterbury Halswell Rd 4-Laning MHM 4 Auckland Muriwai Rd Intersection Improvement HLH 4 Hawkes Bay Pakowhai & Links Rd Intersection Improvement MMH 4 Wellington RH: Two Bobs Corner Realign MMH 4 Hawkes Bay Mangahohi Bridge Replacement MMH 4 Hawkes Bay SH2/SH50A Pakipaki Junction MMH 4
118 116 NZ Transport Agency Draft State Highway Activity Management Plan PLANNED Key: Development Construction Development & Construction Region Activity Name Profile Priority Rank Phase Hawkes Bay Wairoa Stock Effluent Disposal Facility MMH 4 Manawatu-Whanganui Rangitikei/Tremaine Intersection Imp. MMH 4 Manawatu-Whanganui Waiouru Stock Effluent Disposal Facility MMH 4 Southland Gore to Mataura Stock Effluent Disposal Site MMH 4 West Coast Jacksons Stock Truck Effluent Disposal MMH 4 Hawkes Bay Karamu Creek Bridge Replacement MMH 4 Manawatu-Whanganui SH1 Waiouru to Foxton Passing Improvement HML 5 Wellington SH2 Rimutaka Programme HML 5 Otago Pine Hill Rd/Gt King St Intersection Improvements HML 5 Hawkes Bay Corkscrew Gully N&S PL HML 5 West Coast SH7 Stoney Creek Bridge LHH 5 Southland Visiting Driver Signature Project Southland HML 5 Auckland SH1: Wellsford to Warkworth MMM 6 Northland SH1: Ohaewai to Whangarei MMM 6 Hawkes Bay Pakipaki to Waipukurau HLM 6 Southland Edendale Realignment MMM 6 Northland SH1: Whangarei to Brynderwyn MMM 6 Canterbury Curletts Rd Imrpovements MMH 6 Waikato SH3/SH21 Intersection Impt, NSRRP MHL 6 Southland Elles Road Roundabout MMM 6 Southland Falls Creek Bridge MMM 6 Wellington RH: Jims Corner MLH 7 West Coast Franz Josef to Fox Glacier Short Vehicle Bay's MLH 7 West Coast Inangahua Junction to SH67 Short Vehicle Bay's MLH 7 West Coast Springs Junction to Reefton Short Vehicle Bay's MLH 7 Southland Milford Rockfall/Avalanche Protection MML 8 West Coast Taramakau Bridge Safety Improvement MLM 8 Wellington SH2 Buchanan/Ngaumutawa Int (Masterton) MLM 8 Otago Nevis Bluff Rockfall Protection MML 8 Canterbury Barters/Main Sth intersection MML* 8 Wellington SH2 Moonshine Gibbons Safety Improvmts MLM 8 West Coast SH6 Resilience Project MML* 8 Southland Mataura Intersection Improvement MML 8 Waikato SH26 Kirikiri Stream Bridge Replacement MLL 10 Nelson SH6 Quarantine Road I/S MLL 10 Southland Wilsons Crossing Passing Lanes LLM 10 Gisborne Panikau Hill Slow Vehicle Bays LLL 11 Gisborne SH35 Slow Vehicle Bays Stage 1 LLL 11 Gisborne SH35 Slow Vehicle Bays Stage 2 LLL 11
119 Draft State Highway Activity Management Plan NZ Transport Agency 117 CONTINGENT PROGRAMME Key: Development Construction Development & Construction Region Activity Name Profile Priority Rank Phase Nelson HPMV T2 Greymouth to Nelson HHM 2 Nelson HPMV T2 Nelson to Lyttleton HHM 2 Nelson HPMV T2 Takaka to Nelson HHM 2 Nelson HPMV T2 Westport to Nelson HHM 2 Northland Minor Improvements HMH 2 Auckland Minor Improvements HMH 2 Waikato Minor Improvements HMH 2 Bay of Plenty Minor Improvements HMH 2 Gisborne Minor Improvements HMH 2 Hawkes Bay Minor Improvements HMH 2 Manawatu-Whanganui Minor Improvements HMH 2 Taranaki Minor Improvements HMH 2 Wellington Minor Improvements HMH 2 Nelson Minor Improvements HMH 2 Marlborough Minor Improvements HMH 2 Tasman Minor Improvements HMH 2 Canterbury Minor Improvements HMH 2 West Coast Minor Improvements HMH 2 Otago Minor Improvements HMH 2 Southland Minor Improvements HMH 2 Hawkes Bay HPMV T2 HB HNO Napier Port to Sth Bdy HHM 2 Hawkes Bay HPMV T2 HB HNO Napier Port to Gis HHM 2 Wellington SH1 Resilience Ngauranga to Airport HHL 3 Wellington SH1 Resilience Ngauranga to SH58 HHL 3 Wellington SH2 Resilience Ngauranga to SH58 HHL 3 Waikato HPMV SH27 from Morrinsville to SH29 HHL 3 Canterbury HPMV T2 Darfield to Lyttelton HHL 3 Waikato HPMVa: SH26/SH2 Hamilton to Paeroa HHL 3 Waikato HPMVa: SH30/SH34 Te Kuiti to Whakatane HHL 3 Waikato HPMVb: SH2 Paeroa to Waihi HHL 3 Waikato HPMVb: SH32: SH30 to SH1 HHL 3 Waikato HPMVb: SH38 Murupara to SH5 HHL 3 Bay of Plenty HPMV SH2 Waihi to Port of Tauranga HHL 3 Otago Deborah Realignment HML 5 Bay of Plenty HPMV T2 SH30/SH34 Te Kuikti to Whakatane MHL 6 Bay of Plenty HPMV T2 SH2 Edgecumbe to Opotiki MHL 6 Gisborne HPMV T2 Gis HNO Te Araroa to Tologa MMM 6 Auckland Weigh Facility Auckland HML* 3* Waikato Weigh Facility Waikato HML* 3*
120 118 NZ Transport Agency Draft State Highway Activity Management Plan CONTINGENT PROGRAMME Key: Development Construction Development & Construction Region Activity Name Profile Priority Rank Phase Hawkes Bay Weigh Facility Hawkes Bay HML* 3* Manawatu-Whanganui Weigh Facility Manawatu/Wanganui HML* 3* Wellington Weigh Facility Wellington HML* 3* Canterbury Weigh Facility Canterbury HML* 3* Waikato Enhanced Network Resilience Waikato HLL* 8* Bay of Plenty Enhanced Network Resilience Bay of Plenty HLL* 8* Northland Enhanced Network Resilience Northland HLL* 8* Auckland Enhanced Network Resilience Auckland HLL* 8* Taranaki Enhanced Network Resilience Taranaki HLL* 8* Nelson Enhanced Network Resilience Nelson HLL* 8* Marlborough Enhanced Network Resilience Marlborough HLL* 8* Gisborne Enhanced Network Resilience Gisborne HLL* 8* Hawkes Bay Enhanced Network Resilience HB HLL* 8* West Coast Enhanced Network Resilience West Coast HLL* 8* Southland Enhanced Network Resilience Southland HLL* 8* Manawatu-Whanganui Enhanced Network Resilience Man-Wan HLL* 8* Wellington Enhanced Network Resilience Wellington HLL* 8* Tasman Enhanced Network Resilience Tasman HLL* 8* Canterbury Enhanced Network Resilience Canterbury HLL* 8* Otago Enhanced Network Resilience Otago HLL* 8* PLANNED Key: Development Construction Development & Construction Region Activity Name Profile Priority Rank Phase Auckland SCI Takanini South HHH 1 Wellington SH2 Melling Efficiency and Safety Improvements HHH 1 Bay of Plenty TGA East Urban Corridor Optimisation HHH 1 Wellington SH 2 Corridor Improvements HHM 2 Auckland (ac) Western Ring Route RONS HHM 2 Auckland Silverdale I/C Upgrade HMH 2 Auckland NCI SH1 Greville Rd Interchange Upgrade HHM 2 Auckland NCI SH1/18 Interchange Upgrade HHM 2 Bay of Plenty SH2 Route Security Kukumoa Road Improvements MHH 2 Bay of Plenty SH2/Wainui Rd-Matekerepu Intersection Route Security MHH 2 Nelson HPMV T2 Greymouth to Nelson HHM 2 Nelson HPMV T2 Nelson to Lyttleton HHM 2 Wellington SH58 Grays Road to SH2 HHM 2 Bay of Plenty SH29 Tauriko to Waikato Boundary, National Safety Roads & Roadside Programme HMH 2 Waikato SH1 (Three Sisters), NSRRP HMH 2 Waikato SH2 (Paeroa to Waihi), NSRRP HMH 2
121 Draft State Highway Activity Management Plan NZ Transport Agency 119 PLANNED Key: Development Construction Development & Construction Region Activity Name Profile Priority Rank Phase Bay of Plenty SH33: Te Ngae Junction to Sun Valley North, National Safety Roads & Roadside Programme HMH 2 Bay of Plenty SH5: Ngongataha-FairySprings Rd, National Safety Roads & Roadside Programme HMH 2 Waikato SH3 (SH37 to Te Kuiti),NSRRP HMH 2 Bay of Plenty SH30: Te Teko to Awakeri, National Safety Roads & Roadside Programme HMH 2 Bay of Plenty SH34: SH30 Kawerau, NSRRP HMH 2 Bay of Plenty SH2 Hewletts Rd Flyover-Bayfair, HMH 2 Bay of Plenty SH30: Owhata to Te Ngae Junctio, National Safety Roads & Roadside Programme HMH 2 Waikato SH23 (Hamilton to Whatawhata), National Safety Roads & Roadside Programme HMH 2 Waikato SH23 (Te Uku to Raglan), National Safety Roads & Roadside Programme HMH 2 Waikato SH37 ( SH3 to Waitomo), National Safety Roads & Roadside Programme HMH 2 Canterbury Western Corridor Improvements HHM 2 Bay of Plenty SH2 Takitimu Dr Elizabeth St Intersection Improvement Interim HMH 2 Bay of Plenty SH29 Stock Effluent Disposal Facility HMH 2 Bay of Plenty SH2/ Welcome Bay Road HMH 2 Hawkes Bay HB Expressway Kennedy Rd to Meeanee Rd HMH 2 Bay of Plenty Maketu/Rangiuru Intersection Upgrade HMH 2 Wellington Mt Victoria Tunnel Resilience Retrofit HMH 2 Wellington Wellington Port Access Improvements HMM 3 Wellington Wellington RoNS (3) Terrace Tunnel Duplicatn HHL 3 Wellington Wellington RoNS (4) Ngauranga-Aotea Quay: Active Traffic Management HHL 3 Wellington Wellington RoNS (5) Transmission Gully HHL 3 Manawatu-Whanganui Wellington RoNS 9. Otaki to Levin HHL 3 Auckland SH20A to Auckland Airport HMM 3 Waikato SH1 Waikato Expressway Cambridge Section HHL 3 Northland Loop Rd Nth to Smeatons Hill SI HMM 3 Bay of Plenty Tauranga Northern Link HMM 3 Auckland Additional Waitemata Harbour Crossing HHL 3 Auckland Brigham Creek-Railway Rd Median Barrier HMM 3 Canterbury Main South/Aylesbury Intersection HMM 3 Canterbury Walnut Avenue Intersection Improvements HMM 3 Northland Puketona SH11 Intersection. Improvements HMM 3 Otago Waitati Curve Realignment HMM 3 Waikato HPMVa: SH30/SH34 Te Kuiti to Whakatane HHL 3 Waikato HPMVb: SH2 Paeroa to Waihi HHL 3 Waikato HPMVb: SH32: SH30 to SH1 HHL 3 Bay of Plenty HPMV SH2 Waihi to Port of Tauranga HHL* 3 Canterbury Marshlands to Burwood Median Barrier HMM 3 Waikato SH1 (Piarere to Tirau), NSRRP HMM 3 Waikato SH2 Pokeno to Mangatarata Safe System Demonstration Project: Section C HHL 3
122 120 NZ Transport Agency Draft State Highway Activity Management Plan PLANNED Key: Development Construction Development & Construction Region Activity Name Profile Priority Rank Phase Waikato SH2 Pokeno to Mangatarata Safe System Demonstration Project: Section D HHL 3 Auckland Ngakoroa Realignment & Passing Lane HLH 4 Wellington SH2 Active Traffic Management System Ngauranga SH58 MHM 4 Bay of Plenty Hairini Link Stage 4 MHM 4 Otago Beaumont Bridge Replacement MMH 4 Canterbury Leadleys Road Right Turn Bay MMH 4 Marlborough SH6 Bells Road/St Leonards Road Intersection MMH 4 Hawkes Bay Mangahohi Bridge Replacement MMH 4 Waikato SH26 (Onetai Stream) Bridge Replacement MMH 4 Bay of Plenty Forest Passing Lane (SH33) & Alignment HLH 4 Canterbury ChCh to Rolleston Alternative Route MHM 4 Otago Albert Burn Bridge Replacement MMH 4 Waikato Waikato SEDF MMH 4 Northland SH15A/McCathie Road Intersection Upgrade MMH 4 Canterbury SH77/Park St int TS MMH 4 Taranaki Normanby Overbridge Realignment MMH 4 Northland Akerama Curves Realign & Passing Lane HLH 4 Manawatu-Whanganui SH1 Waiouru to Foxton Passing Improvement HML 5 Otago Visiting Driver Signature Project Otago HML 5 Waikato SH1/26 Intersection Improvements HML 5 Wellington SH2 Rimutaka Programme HML 5 Auckland Puhoi to Warkworth RoNS Design & Construction HML 5 Auckland Warkworth to Wellsford Roads and roadside improvements HML 5 Auckland Drury-Glenbrook Wire Rope MB HML 5 Manawatu-Whanganui SH1 Corridor Safety Management Improvements HML 5 Bay of Plenty Pah Road I/S Improvement Te Puke HML 5 Otago Pine Hill Rd/Gt King St Int Improvements HML 5 Canterbury SH82 Elephant Hill Stream Bridge LHH 5 Otago Mosgiel Balclutha Safety Improvements HML 5 Waikato SH5 (Mihi to Wairakei), National Safety Roads & Roadside Programme HML 5 Otago Dunedin Fairfield Safety Improvements HML 5 Auckland Weigh Facility Auckland HML* 5 Waikato Weigh Facility Waikato HML* 5 Bay of Plenty Weigh Facility Bay of Plenty HML* 5 Otago Weigh Facility Gisborne HML* 5 Hawkes Bay Weigh Facility Hawkes Bay HML* 5 Taranaki Weigh Facility Taranaki HML* 5 Manawatu-Whanganui Weigh Facility Manawatu/Wanganui HML* 5 Wellington Weigh Facility Wellington HML* 5 Marlborough Weigh Facility Marlborough HML* 5
123 Draft State Highway Activity Management Plan NZ Transport Agency 121 PLANNED Key: Development Construction Development & Construction Region Activity Name Profile Priority Rank Phase Nelson Weigh Facility Nelson HML* 5 Tasman Weigh Facility Tasman HML* 5 West Coast Weigh Facility West Coast HML* 5 Otago Weigh Facility Otago HML* 5 Otago Big Kuri Creek Flood Mitigation HML 5 Otago Hilderthorpe Straight Flood Mitigation HML 5 Otago Katiki Erosion Protection HML 5 Otago Maheno Flood Mitigation HML 5 Canterbury SH1S Kaikoura Coast Resilience Project HML 5 Otago Waikouaiti Flood Mitigation HML 5 Waikato SH1/Gallagher Drive Intersection Improvements HML 5 Otago Andersons Bay Rd/Caversham Motorway HML 5 Otago St Andrew St Anzac Ave Intersection HML 5 Otago Deborah Realignment HML 5 Otago Oamaru Dunedin Safety Improvements HML 5 West Coast Ahaura Bridge Replacement LHH 5 Auckland SH1: Wellsford to Warkworth MMM 6 Northland SH1: Ohaewai to Whangarei MMM 6 Auckland Bridge Side Screen Protection MMM 6 Otago Kakaho Creek Realignment MMM 6 Waikato SH3/SH21 Intersection Improvements, National Safety Roads & Roadside Programme MHL 6 Bay of Plenty HPMV T2 SH2 Edgecumbe to Opotiki MHL 6 Northland Waiotu North NB HLM 6 Bay of Plenty Banksia Place Northbound PL HLM 6 Bay of Plenty Tuapiro Rd PL HLM 6 Canterbury West Melton to Darfield Passing Opp. MMM 6 Canterbury Dyers Road Improvements MMM 6 Canterbury Yaldhurst to West Melton Passing Opp. MMM 6 Canterbury Ashburton Intersection Improvements MMM 6 Canterbury Bridge St to Waimataitai St 4L MMM 6 Canterbury Hilton Highway 4 Laning MMM 6 Canterbury Timaru Intersection Improvements MMM 6 Canterbury Waimataitai to Te Weka 4L MMM 6 Otago Kawarau Falls Bridge MHL 6 Auckland McKinney/Wech Dr Intersection Project MLH 7 Northland Snake Hill Realign MLH 7 Bay of Plenty SH2 Western Drain Bridge Replacement LMH 7 Bay of Plenty Te Rahu Canal Bridge Replacement LMH 7 Northland Wallis Rd SW and Realignment MLH 7 Bay of Plenty Bridgman Lane Passing Lane HLL 8
124 122 NZ Transport Agency Draft State Highway Activity Management Plan PLANNED Key: Development Construction Development & Construction Region Activity Name Profile Priority Rank Phase Bay of Plenty Tauriko Upgrade HLL 8 Auckland Drury-Glenbrook RTB Treatments HLL 8 Nelson SH6 Cable Bay Road Intersection MLM 8 Auckland Wharehine Rd Realignment MLM 8 Otago Nevis Bluff Rockfall Protection MML 8 Northland Salesyards Rd Intersections Improvements HLL 8 Bay of Plenty Kauri Point PL HLL 8 Bay of Plenty SH2 Matata Straights (resilience) MML 8 West Coast SH7 Resilience Project MML 8 West Coast SH73 Resilience Project MML 8 Otago Grant Rd to KF Bridge Improvements MML 8 Otago Stanley St Corridor Improvements MML 8 Otago Cromwell Intersection Improvement MML 8 Otago Ladies Mile Corridor Improvements MML 8 Otago North Oamaru Corridor Improvements MML 8 Otago Roaring Meg Bridge Widening MML 8 Bay of Plenty SH5 Rotorua Western Corridor, RINS MML 8 Otago SH6A Corridor Improvements MML 8 Canterbury SH74/Scruttons Intersection MML 8 Canterbury Washdyke Creek Bridge MML 8 Auckland Noise Improvement Programme LMM 9 Waikato SH1 Tirau to Taupo Improvements MLL 10
125 Draft State Highway Activity Management Plan NZ Transport Agency 123 TRANSPORT PLANNING ACTIVITY CLASS PLANNED ACTIVITIES Region Activity Name Profile Priority Rank National National business case for speed management implementation HH 1 Auckland SH1 Wellsford to Warkworth (NRR2) HM 1 Northland SH1 Whangarei to Brynderwyn (NRR3) HM 1 Manawatu Waitara to Bell Block Route Improvements (NRR6) HM 1 Northland SH1 Ohaewai to Whangarei (NRR7) HM 1 Waikato SH2: SH1 to SH27 (NRR9) HM 1 Auckland Resilience Auckland Programme Business case HM 1 Wellington Resilience Wellington Programme Business Case HM 1 Auckland SH16 Brigham Creek to Waimauku (NRR11) HM 1 Canterbury SH1 ChCh to Dunedin Corridor (ChCh Section) (NRR21) HM 1 Canterbury SH1 and 71 Picton to ChCh (NRR22) HM 1 Marlborough SH1 and 71 Picton to ChCh (NRR22) HM 1 Waikato SH3 (Ohaupo to Te Kuiti) Improvements TPAC (NRR27,71) HM 1 Manawatu SH3 Wanganui to Whangaehu Route Improvements (NRR28) HM 1 Northland SH12 Dargaville to Tokatoka (NRR29) HM 1 Waikato SH1B: Taupiri to Gordonton (NRR33) HM 1 Waikato SH27: SH26 to SH24 (NRR34) HM 1 Bay of Plenty Wainui Road to Opotiki (NRR35) HM 1 Bay of Plenty SH29 Tauranga to Hamilton PBC (Bay of Plenty Section) (NRR36) HM 1 Auckland SH22 SH1 to Glenbrook Road (NRR37) HM 1 Auckland SH20B Manukau Gardens to Airport (NRR38) HM 1 Otago SH1 ChCh to Dunedin Corridor PBC (Otago Section)(NRR43) HM 1 Bay of Plenty SH2 Paeroa to Tauranga PBC (NRR5,48) HM 1 Waikato SH2 (Paeroa to Waihi), NSRRP TPAC (NRR48) HM 1 National Automated optimisation, compliance and enforcement of the Motorway network HH 2 National Improving delivery for State Highway Operations HH 2 National Improving delivery for State Highway Optimisation HH 2 National Integrated Freight Transport Requirements HH 2 Auckland Responding to changes in the Auckland City Centre HH 2 Auckland Responding to Auckland Growth Areas North West HH 2 Auckland Responding to Auckland Growth Areas Silverdale HH 2 Auckland Responding to Auckland Growth Areas South HH 2 Canterbury Christchurch Network Operating Plan Implementation HH 2 Canterbury SH73/76 West Melton Tunnel HH 2 Canterbury SH75 Halswell Road Corridor HH 2 Auckland Auckland Network Operating Plan Implementation HH 2 Wellington SH2 Corridor Improvements HH 2
126 124 NZ Transport Agency Draft State Highway Activity Management Plan PLANNED ACTIVITIES Region Activity Name Profile Priority Rank Wellington Wellington Port Access HH 2 Wellington Wellington Network Operating Plan Implementation HH 2 National Improving delivery for the upgrade and replacement of state highway structures HM 2 Bay of Plenty Tauriko Network Plan HM 2 National National LED Lighting for State highways HM 2 Otago Central Queenstown Optimisation Plan HM 2 Otago Queenstown Frankton Flats Growth Area HM 2 Waikato SH1 Bombay to Long Swamp HM 2 Waikato Hamilton Urban Optimisation HM 2 CONTINGENT PROGRAMME Region Activity Name Profile Priority Rank Waikato SH5 (Tirau to Taupo) via Rotorua TPAC(NRR49,51,56) HM 1 Otago SH1: Mosgiel to Balclutha (NRR53) HM 1 Wellington SH2 Rimutaka Hill Curves (NRR54) HM 1 Manawatu Hawera to New Plymouth (NRR55) HM 1 Bay of Plenty SH30: Te Teko to Awakeri (NRR59) HM 1 Otago SH1 Dunedin to Invercargill PBC (NRR58,77) HM 1 Northland SH11 Airfield to Lilly Pond (NRR60) HM 1 Bay of Plenty SH34: SH30 to Kawarau (NRR61) HM 1 Northland SH1: SH12 to Wellsford (NRR68) HM 1 Marlborough SH6 Renwick to Hira (NRR72,74) HM 1 Hawkes Bay Hawkes Bay Network Plan and optimisation MM 3 National National business case for improving walking and cycling for schools adjoining or close to the state highway ML 3 Northland Supporting the Waipapa Growth Area ML 3 Otago Strategic Transport Model Updating MM 3 Canterbury Strategic Transport Model Updating MM 3 Waikato Waikato Regional Transport Model Update MM 3 Bay of Plenty Tauranga Transport Model Rebuild MM 3
127 Draft State Highway Activity Management Plan NZ Transport Agency 125 TPAC ACTIVITIES FOR Region Activity Name Profile Priority Rank Waikato SH5 (Mihi to Wairakei) (NRR73) HM 1 Waikato SH23 Hamilton to Whatawhata (NRR80) HM 1 Waikato SH23 (Te Uku to Raglan), NSRRP TPAC (NRR81) HM 1 Waikato SH37 (SH3 to Waitomo), NSRRP TPAC (NRR82) HM 1 Southland SH1: Invercargill to Moto Rimu Rd (NRR76) HM 1 Waikato SH37: SH3 to Waitomo (NRR82) HM 1 Northland Resilience Northland Programme Business case HM 1 Waikato SH5 Taupo to Napier HM 2 Otago Dunedin Central City Optimisation Plan HM 2 Otago Network Operating Plan Dunedin MM 3 Bay of Plenty SH2 Tauranga East Urban Corridor Programme MM 3 Bay of Plenty South Urban Corridor, TTS MM 3 Bay of Plenty Rotorua Eastern Corridor, RINS MM 3 Bay of Plenty SH30A Urban Revitalisation, RINS MM 3 National Providing walking and cycling opportunities for schools ML 3 Gisborne Gisborne Network Plan and Optimisation LL 3 Hawke s Bay Hawke s Bay Network Plan and optimisation ML 3 National Providing walking and cycling opportunities for schools ML 3 Northland Supporting the Waipapa Growth Area LL 3 Gisborne Gisborne Network Plan and Optimisation LL 3
128 126 NZ Transport Agency Draft State Highway Activity Management Plan WALKING AND CYCLING Initiative Name or Short Text Region Assessment Profile Priority Ranking Dunedin One Way Pair Cycle Lanes Otago HHM 2 Kahikatea Dr Greenwood Walking & Cycling Waikato HMH 2 SH 88 Cycling and Pedestrian Facilities Otago MHH 2 Ngauranga to Petone Cycleway/walkway Wellington HMM 3 SH3 Ohaupo Rd W&C (Lorne to Dixon) Waikato MMH 4 State Highway Model Communities Connection Hawkes Bay MHM 4 AKL East Corridor/Meadowbank-Glen Innes Auckland HML 5 SH1 (Cobham Drive) Pedestrian Facility Waikato HML 5 Gentle Annie Shoulder Widening Nelson HML 5 Nelson Street offramp Cycling Imps Auckland HML 5 SH1 Northern Motorway Cycleway Auckland HLM 6 Mourea Bridge Pedestrian Cycleway Bay of Plenty MMM 6 Poike Road Pedestrian & Cycle Facility Bay of Plenty MMM 6 Gisborne Wainui Cycleway SH 35 Gisborne MMM 6 SH6 Rocks Rd Offroad Shared Pathway Nelson MMM 6 SH1 Southern Motorway Cycleway Auckland HLL 8 SH20B Puhinui Road Auckland HLL 8 Bethlehem to Wairoa Ped/Cycle Facilities Bay of Plenty MML 8 Taramakau Bridge Safety Improvement West Coast MLM 8 Walking and Cycling connectivity Gisborne LLM 10

129 Draft State Highway Activity Management Plan NZ Transport Agency APPENDIX SECTION CX 2. IMPROVEMENTS TITLE OF PROGRAMME SECTION DEVELOPMENT Photo: Sarah Cronwright Principal Transport Planner, Auckland
130 128 NZ Transport Agency Draft State Highway Activity Management Plan INTRODUCTION This section of the draft SHAMP outlines the work undertaken to develop and consider alternative improvement programmes in order to reach a recommended programme. PROGRAMME INPUTS AND CONSTRAINTS The starting point for the improvement programme was activities or emergent programmes from regional planning activities or national programmes. In response to the Transport Agency s investment signals 33 each of our regions has considered the regional context to the national investment signals and identified the key level of service gaps that needed to be addressed to align with those signals. Our regions work closely with each other and so, while our structures are regional, the programmes submitted were integrated with each other to ensure proposed improvements took cognisance of journeys on the network to ensure there were consistent levels of services across boundaries. In total some 429 activities totalling $9.3 billion were submitted for consideration for inclusion in the draft SHAMP There were two key constraints to programme development: forecast available funding existing commitments. We have a significant current programme of committed work including the RoNS, Auckland acceleration and our Safe System demonstration projects. This, coupled with a requirement to exhaust current R-funds (about $100 million) and continue with the RoNS programme, means that for the NLTP period it is expected that around $70 million will be available for new commitments, increasing to $1.2 billion for and $3.9 billion for PROGRAMME OPTIONS CONSIDERED Most of the activities undertaken in improving the State Highway can be grouped into broad programmes of work which, in themselves, align to our strategic priorities or fit within broad portfolios of work. In developing programme options we therefore considered the programme in nine broad areas: commitments: we have a significant programme of activity funded and which will continue into the next GPS implicit commitments: while not committed, we have a number of activities where phases have been complete and for which future phases are ready to commence, or for which announcements have been made of our intent to deliver subsequent phases. Examples include future phases of RoNS, the Auckland acceleration programme and Future Investment Fund programme activities critical infrastructure: this is a programme of improvements to replace infrastructure at the end of its economic life R-fund activities: regionally distributed funds which are available for investment in activities that demonstrate the highest value for money priority within regions for activities which might not otherwise be funded are due to expire in We have an identified programme of around $100 million of investment to meet our commitment to use this fund by the deadline National Roads and Roadsides Programme (NRRP): a national programme of investment over ten years targeted at Safer Journeys Roads and Roadsides goals resilience activities: activities aligned to our national resilience programme HPMV: activities related to improving the efficiency of freight, including HPMV investment routes and Weigh Right activities efficiency investment: programmes of activity targeting improved network efficiency
131 Draft State Highway Activity Management Plan NZ Transport Agency 129 Dependent on the degree to which the above programmes were combined and emphasis given, it is possible to formulate different improvement programmes. In developing the draft SHAMP , five broad programmes were considered: deliver what we started and safety primarily safety priority order safety and efficiency priority programmes. Common to all five programmes was a focus on our commitments and an on-going commitment to a minor improvements programme. The particular emphasis of the programmes is shown in the table below and each explained further: SHAMP ALTERNATE PROGRAMMES CONSIDERED THEME Commitments Complete 12/15 Activities NRRP (Year1 3) NRRP (Year4 10) Resilience & HPMV Efficiency Corridors Minor Improvements (Safety) Minor Improvements (Operations) Minor Improvements (Other) 1 Deliver what we started and safety Safety, safety, safety Prioritised activities (traditional approach) $15m $25m $4m $6m $10m $20m 4 Safety and efficiency Deliver on HNO priority programmes 1 2* * Future phases of activities that align with NRRP/Resilience & HPMV only. Deliver what we started and safety: This programme would have delivered HNO activities where previous phases had been funded, followed by Roads and Roadsides programme activities. Primarily safety: this programme would have been heavily weighted towards delivering on our Roads and Roadsides programme. Priority order: This approach was agnostic to any broad strategic direction or desired emphasis and simply prioritised activities in Investment Assessment Framework priority order. Safety and efficiency: This programme aimed to continue to invest equally in efficiency and safety related activities. Priority programmes: This programme was a modified version of programme 1 (deliver what we started and safety) in that it recognised that we would wish to continue delivering on activities which are strongly aligned to our desired Roads and Roadside and Resilience goals, but that we would not want to necessarily pursue all previously developed activities equally. This programme aimed to signal a change towards a more strategically aligned approach.
132 130 NZ Transport Agency Draft State Highway Activity Management Plan PROGRAMME ASSESSMENT A qualitative assessment of the five programme options against the five SHAMP key performance indicators was undertaken. The summary of the assessment is shown in the table below. KPI (SCORE: 0 3) THEME Better Utilisation of Capacity Reduced Travel Time Improved Reliability Reduction in DSI Reduced Collective Risk COMMENT 1 Deliver what we started This programme contributed to most KPIs but did not lead to the desired realignment of our economic growth and safety focus. 2 Primarily safety Priority order Safety is extremely important but is not the only priority for the Agency. As articulated in the national business cases, the three priorities are safety, freight and resilience. This programme did not recognise the expectation generated by projects that are currently in design or investigation. Prioritisation by project profile order is the method that has traditionally used to develop the programme because generally the NLTP had implicitly assumed a funding level below which funds would not be allocated. This approach does not necessarily reflect the intent of the strategic direction of the SHAMP nor recognise the planning importance of the national programmes of activity. 4 Safety and efficiency This programme did not address the key freight efficiency issues or respond to the wide range of resilience challenges on the network. 5 Priority programmes The programme sufficiently balanced the desire to continue to invest in projects which align well to our strategic direction but provided enough flexibility for a change in direction towards nationally planned programmes with the overall aim of giving optimum effect to our strategic goals. On balance, programme approach 5 (priority programmes) was considered to best align with the Transport Agency s overall strategic direction.
133 Draft State Highway Activity Management Plan NZ Transport Agency 131 The final principles for prioritising the available projects, and taking into account the various national programme business cases, was therefore as follows: Priority Description Narrative 1 Commitments Complete funded phases of projects, implicit commitments to future RoNS phases, critical infrastructure and eligible R 1 Fund activities. 2 Finish activites which align with our direction and Minor Improvements Programmes For current activities in the 12/15 programme which align with the NRRP, HPMV or Resilience goals we will prioritise investment in subsequent phases to see them through to completion. 2 Safer Journeys Roads and Roadsides We will deliver the NRRP Programme Year Other National Priorities Programmes We will progress development of resilience programmes and invest in a smaller HPMV programme and other Safer Journeys initiatives. 5 Safer Journeys Roads and Roadsides We will deliver on the NRRP Programme Year Other (including Future R-Funds) Other activities including obligations for R 2. QUANTITATIVE PROGRAMME PERFORMANCE We have compared the outcomes achieved under programme 5 with the traditional approach under programme Programme 5 above generated the following balance of EEM outcomes over the 10 year portfolio: DISTRIBUTION OF MONETARY BENEFITS FROM PROGRAMME 5 ($BN) Safety Economic Growth 12 $ Billion Programme It should be noted that in making this comparison we have not refined the activity economic assessments to reflect different opening years associated with the two programme options.
134 132 NZ Transport Agency Draft State Highway Activity Management Plan This assessment of the EEM benefits over the 10 years masks the emphasis over the three NLTP periods that make up the 10 years. Programme 5 would place an emphasis on safety over the first three years of the 10 year programme. That is, the proposed additional activities over and above the committed and implied committed activities for , would have a safety outcome emphasis. This is illustrated by the graph below that shows the gradual increase in monetised safety benefits over the 10 year period as the safety activities started in the first three years have an impact on outcomes. CUMULATIVE BENEFITS FROM SHAMP ($BN) 18,000 16,000 14,000 Safety Economic Growth 12,000 $ Billion 10,000 8,000 6,000 4,000 2, Under programme 3, activities would be prioritised based on their profile. Overall the result for the 10 years turned out to be similar, but the set of feasible activities in the first three to six years would have less of a safety emphasis, and New Zealanders would not benefit from safety returns which are otherwise realised earlier on in the programme under programme 5.

135 Draft State Highway Activity Management Plan NZ Transport Agency APPENDIX SECTION XD 2. ASSET TITLE OF LIFECYCLE SECTION PLANNING & VALUATION Photo: Collin McLellan Memorial Park Alliance, Wellington
136 134 NZ Transport Agency Draft State Highway Activity Management Plan Detailed lifecycle asset management plans (LAMPs) have been produced to support this plan. The LAMPS provide guidance on how State Highway assets should be maintained and renewed. They document a clear link between One Network Road Classification levels of service, lifecycle management needs and costs as shown in the figure below: LIFECYCLE ASSET MANAGEMENT PLAN CONTENT Section Questions Information provided The extent and distribution of the asset type: Asset overview Operation and maintenance of existing assets Condition Renewals of existing assets* Changes in levels of service * Public health and environmental outcomes* Resilience of infrastructure assets* Summary of issues Summary of expenditure What is the scale of the assets and what does it cost? What state are the assets in? What requires the assets to be maintained and replaced? What intervention strategy is used to maintain and renew the infrastructure to keep services going, address risks for the least long term cost? Why have the asset type what services or levels of service do customers get from it? What programme of works is proposed to implement to ensure service levels are met having applied the intervention strategy? What will the programme achieve in terms of the service level provided and the change in asset condition? What are the risks from asset failure? What could alternative programmes deliver? What are the financial requirements for delivering this programme? quantities and location valuation current spend current depreciation. the performance and condition of the asset type and the distributions of these across the sub-types by area and quantity comparison of current VFM with trend and peers opportunities for effectiveness, efficiency and economy improvements. the factors affecting condition and their forecast change the past rate of decay and the forecast future rate of decay given the forecast factors play out. the approach used to trigger maintenance and why, and to trigger renewal (and why) the feedback loop to technical levels of service, or investigatory or trigger levels the uncertainties ahead and how this may affect outcomes. levels of service provided by this asset type the relationship between customer and technical levels of service, and condition. the quantity of reactive, planned and preventive maintenance the quantity of preventive works and planned renewals. the forecast gap between expected service levels and targets the change in asset condition forecast and the impact on future work programmes. what assets are critical and why they require special treatment what are the risks and how does this affect the work required to deliver services? the quantity of works of each type the expected service levels and condition change costs and risks. revenue and capital requirements related depreciation.
137 Draft State Highway Activity Management Plan NZ Transport Agency 135 ASSET GROUPS AND CLASSES Separate lifecycle management plans have been produced for each of the asset groups shown below. The plans can be viewed at: STATE HIGHWAY ASSET GROUPS Asset Groups 1 Pavement 2 Drainage 3 Structures 4 Signs & roadmarking 5 Traffic guidance structures Asset Classes formation road bases surfacing subsurface (pits and pipes) surface (kerbs and channels) bridges bailey bridges major culverts underpasses retaining walls gantries sea and river protection tunnels (excluding M&E) rock fall netting and fords weigh stations signs visual marking signs marker posts guardrails barriers traffic islands 6 Street lighting columns, brackets, luminaires, control equipment 7 ITS (infrastructure assets) ITS infrastructure: camera detection devices (non camera) electronic barriers electronic signs emergency phone environmental monitoring traffic signals tolling support infrastructure tunnel M&E services: fire fighting ventilation lighting journey management: traffic operation centres traveller information management real-time journey management 8 Roadside vegetation management urban and rural roadside vegetation and gardens 9 Roadside furniture and rest areas seats, tables, bins, rest area assets 10 Network management network management planning & systems asset management planning & systems
138 136 NZ Transport Agency Draft State Highway Activity Management Plan EXPENDITURE CATEGORIES State Highway assets can be categorised into three main expenditure categories, the approximate percentage of expenditure of which is demonstrated in the figure below. PERCENTAGE EXPENDITURE FOR EACH LIFECYCLE MANAGEMENT CATEGORY Operation and Maintenance 40% Renewals Replacement and Rehibilitation 35% New/Improvement Works and Disposals 25% The expenditure categories are discussed below (not mapped to work categories for Funding Assistance Rates): Operations and maintenance Operation is the active process of utilising the asset which will consume resources such as manpower, energy, chemicals and material. Maintenance is all actions necessary for retaining an asset as near as practicable to its original condition (including repairs) but excluding rehabilitation or renewal. Maintenance slows down deterioration and delays when rehabilitation or replacement is necessary so that the full useful life can be achieved. The different types of maintenance are summarised below. MAINTENANCE TYPES Type Routine maintenance Proactive maintenance Reactive maintenance Description Routine maintenance is the regular on-going day-to-day work that is necessary to keep assets operating, including instances where portions of the asset fail and need immediate repair to make the asset operational again. Proactive inspection and maintenance works planned to prevent asset failure. Reactive action to correct asset malfunctions and failures on an as required basis.
139 Draft State Highway Activity Management Plan NZ Transport Agency 137 Renewal This covers the replacement or rehabilitation of assets to restore the asset to its original level of service. The different types of renewal are summarised below. TYPES OF RENEWALS Type Replacement Rehabilitation Description Replacement involves renewing an asset by replacing it on a like with like basis. The deteriorated asset is removed and an equivalent asset replaced. Rehabilitation is the process of renewing major elements of the assets by modifying or rejuvenating them so as to render them able to deliver the original level of service. New/improvement works or disposals This covers the creation of new assets or works which upgrade or improve an existing asset beyond its current capacity or performance. The different types of asset development are summarised below: ASSET DEVELOPMENT REASONS Reason Growth Levels of service Legislative Public health or environmental risk Resilience Vested Disposal Growth Description Any asset development that is required as a result of growth. Any asset development that is required as a result of a change in service levels. Any asset development out of legislative requirements. Any asset development to achieve outcomes for public health or environmental risk. Any asset development to achieve outcomes for resilience against the risks of civil defence emergency events. Any asset that is vested to NZ Transport Agency by others or that is vested to others by the Transport Agency. This covers the disposing of assets when they reach the end of their useful life, are no longer viable, fail to deliver the level of service required or become surplus to requirements. Any asset development that is required as a result of growth.
140 138 NZ Transport Agency Draft State Highway Activity Management Plan For each asset group and class, the 2013 replacement cost, depreciated replacement cost and annual depreciation are set out in the figure below. STATE HIGHWAY ASSET CLASSES AND 2013 VALUATIONS Asset Group Asset Class Replacement Cost ($M) Depreciated Replacement Cost ($M) Annual Depreciation ($M) 1 Pavement 2 Drainage 3 Structures 4 Signs and roadmarking 5 Traffic guidance systems Formation Road bases Surfacing Subsurface (pits and pipes) Surface (kerbs and channels) Bridges Bailey bridges Major culverts Underpasses Retaining walls Gantries Sea and river protection Tunnels (excluding M&E) Rock fall netting and fords Weigh stations Signs Visual marking signs Marker posts Guardrails Barriers Traffic Islands $17,407 $16,402 $40 $2,275 $1,002 $31 $7,969 $4,598 $390 $232 $116 $14 $617 $309 $27 6 Street lighting, roadside vegetation and furniture Poles (columns), brackets, luminaries, control equipment Urban and rural roadside vegetation and gardens Seats, tables, bins, rest area assets $667 $334 $31 7 ITS (infrastructure assets) ITS infrastructure Tunnel M&E services Journey management $281 $193 $12 Total $29,448 $22,954 $545 ASSET VALUATION A valuation of the State Highway is incorporated in the NZ Transport Agency annual reports and statement of performance expectations which can be found at: Further asset valuation information can be found in the lifecycle asset management plans at: processes/maintain-and-operate/lifecycle-asset-management-plans/
141
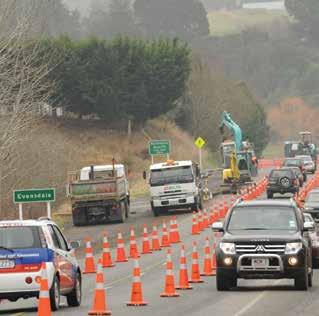


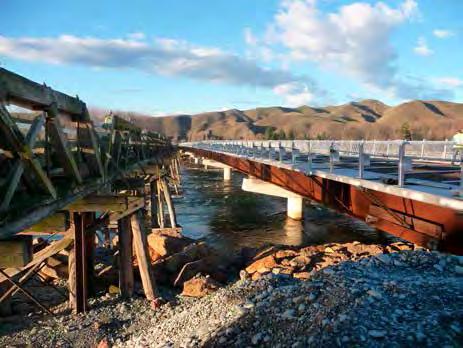
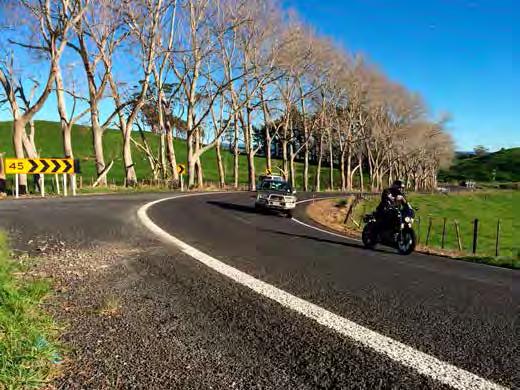
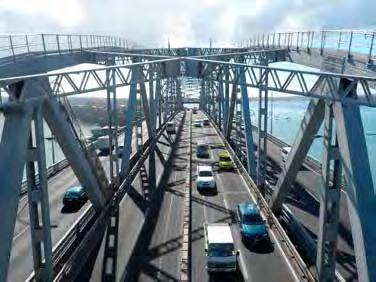
142
Wellington $312 $49 $456 OVERVIEW WELLINGTON REGIONAL SUMMARY
 National Land Transport Programme 2015 18 Wellington WELLINGTON REGIONAL SUMMARY OVERVIEW The Wellington region is made up of a number of cities, urban areas and supporting rural hinterland. The city is
$244 $45 OVERVIEW National Land Transport Programme Bay of Plenty BAY OF PLENTY REGIONAL SUMMARY
 2015 18 National Land Transport Programme Bay of Plenty BAY OF PLENTY REGIONAL SUMMARY OVERVIEW Transport investment in the Bay of Plenty is targeted to support significant residential growth, new industrial
WELLINGTON $422 MILLION $614 MILLION $83 MILLION 22% SPEND $1.9 BILLION
 WELLINGTON WELLINGTON $1.9 BILLION FORECAST TOTAL WELLINGTON INVESTMENT The Wellington region s transport challenges are dominated by the region s concentration of population in the metropolitan cities,
$960 $1,175 $91 OVERVIEW National Land Transport Programme Auckland AUCKLAND REGIONAL SUMMARY
 2015 18 National Land Transport Programme Auckland AUCKLAND REGIONAL SUMMARY OVERVIEW Achieving an effective and efficient transport system is central to supporting Auckland s future. Auckland is home
Regional summary - Wellington
 Regional summary Wellington Regional summary - Wellington This is a summary of data relevant to transportation in this region, viewed from a Land Transport NZ perspective. It s purpose is to inform the
Policy Transport. Policy highlights. Our plan
 Policy 2017 Our plan Policy highlights National is committed to building the world-class infrastructure to ensure New Zealand continues to grow. Record investment in transport Delivering the Roads of National
CHRISTCHURCH MOTORWAYS. Project Summary Statement February 2010
 CHRISTCHURCH MOTORWAYS Project Summary Statement February 2010 Table of Contents 1. Purpose of Document 2. Strategic Context 3. Benefits 4. Project Scope and Economics 5. Implementation Plan 1 ROADS OF
AUCKLAND $1.2 BILLION $1.9 BILLION $149 MILLION 15% SPEND $5.7 BILLION
 AUCKLAND AUCKLAND $5.7 BILLION FORECAST TOTAL AUCKLAND INVESTMENT The next 10 years are expected to underline Auckland s performance as the fastest growing major city in Australasia. The city is expected
$745 $10 $41 OVERVIEW
 2015 1 National Land Transport Programme Southern SOUTHERN REGIONAL SUMMARY The NZ Transport Agency s Southern region comprises the local government regions of Canterbury, Otago, Southland and the West
NATIONAL LAND TRANSPORT PROGRAMME
 NATIONAL LAND TRANSPORT PROGRAMME 2018 21 NATIONAL LAND TRANSPORT PROGRAMME 2018 21 NZ TRANSPORT AGENCY 1 2018 21 NLTP REVENUE AND INVESTMENT FLOWS FUNDING WILL COME FROM National Land Transport Fund Local
Draft Auckland Regional Land Transport Plan
 1 Table of Contents Table of Contents Table of Contents 2 01. Our Vision 3 02. Purpose and Scope of the Regional Land Transport Plan 5 03. Auckland s Challenges 12 04. Addressing Auckland s Challenges
6 Road infrastructure
 6 Road infrastructure 51 ƨƨsummary New Zealand does not score highly for its road infrastructure when compared to other developed nations. This may partly be due to geography and population size, which
The Government s Aviation Strategy Transport for the North (TfN) response
 response") The Government s Aviation Strategy Transport for the North (TfN) response Transport for the North Background Good transport links are a crucial part of a strong economy supporting labour markets and delivering
The Government s Aviation Strategy Transport for the North (TfN) response Transport for the North Background Good transport links are a crucial part of a strong economy supporting labour markets and delivering
REAUTHORISATION OF THE ALLIANCE BETWEEN AIR NEW ZEALAND AND CATHAY PACIFIC
 Chair Cabinet Economic Growth and Infrastructure Committee Office of the Minister of Transport REAUTHORISATION OF THE ALLIANCE BETWEEN AIR NEW ZEALAND AND CATHAY PACIFIC Proposal 1. I propose that the
Quarterly report Q1 2016/17. 1 June 30 September 2016
 Quarterly report Q1 2016/17 1 June 30 September 2016 CONTENTS Contents... 3 Executive summary... 4 Our performance this quarter... 4 Our results at a glance... 6 Summary of delivering our strategy...
Transport Indicators Report June 2018
 Transport Indicators Report June 2018 Board Meeting 21 August 2018 Recommendation That the Board: i. Receives this report. Executive summary 1. The attached Monthly and Quarterly Indicator Reports provide
NATIONAL AIRSPACE POLICY OF NEW ZEALAND
 NATIONAL AIRSPACE POLICY OF NEW ZEALAND APRIL 2012 FOREWORD TO NATIONAL AIRSPACE POLICY STATEMENT When the government issued Connecting New Zealand, its policy direction for transport in August 2011, one
Submission to. Southland District Council on. Draft Stewart Island/Rakiura Visitor Levy Policy and Bylaw
 Submission to Southland District Council on Draft Stewart Island/Rakiura Visitor Levy Policy and Bylaw Date: 9 November 2018 Tourism Industry Aotearoa (TIA) welcomes the opportunity to comment on Southland
land transport at a glance
 ISSN 77-3723 land transport at a glance land transport at a glance Westland District Map of the West Coast Region What is Land Transport At A Glance? Land Transport At A Glance provides a brief overview
SUSTAINABLE DEVELOPMENT PLAN 2015
 LAND USE SUSTAINABLE DEVELOPMENT PLAN 2015 EAST MINILANDS EAST MINILANDS SUSTAINABLE DEVELOPMENT SUSTAINABLE DEVELOPMENT DHL eastmidlandsairport.com OUR AIRPORT FOREWORD by Andy Cliffe Managing Director
Regional summary - Auckland
 Regional summary Auckland Regional summary - Auckland This is a summary of data relevant to transportation in the Auckland region, viewed from a New Zealand Transport Agency perspective. The purpose of
ROTORUA INTEGRATED NETWORK STRATEGY
 ROTORUA INTEGRATED NETWORK STRATEGY 2012-2042 May 2013 This photo provided by RDC Cover photos provided by RDC and BOPRC Contents Context Issues for the Strategy to Address Outcomes and Interventions Implementation
Risk Maps. Risk Maps how the sections were identified
 2007-2011 Risk Maps Risk Maps how the sections were identified For the purpose of comparing the level of risk of crashes between different parts of the network, the state highway network was broken up
The Strategic Commercial and Procurement Manager
 Item 3 To: Procurement Sub Committee On: 8 June 2016 Report by: The Strategic Commercial and Procurement Manager Heading: Renfrewshire Council s Community Benefit Strategy 2016 1. Summary 1.1. The purpose
Unravelling regional insight
 Unravelling regional insight By Steve Riley, TIA Insight Specialist (May 2017) Introduction While national-level insight provides a clear picture of how the tourism industry performs in New Zealand, a
RE: PROPOSED STRATEGIC ALLIANCE AGREEMENT BETWEEN AIR NEW ZEALAND AND SINGAPORE AIRLINES
 28 February 2014 Richard Cross Senior Adviser Ministry of Transport Dear Richard RE: PROPOSED STRATEGIC ALLIANCE AGREEMENT BETWEEN AIR NEW ZEALAND AND SINGAPORE AIRLINES Christchurch International Airport
5 Rail demand in Western Sydney
 5 Rail demand in Western Sydney About this chapter To better understand where new or enhanced rail services are needed, this chapter presents an overview of the existing and future demand on the rail network
Consultation on Draft Airports National Policy Statement: new runway capacity and infrastructure at airports in the South East of England
 Tony Kershaw Honorary Secretary County Hall Chichester West Sussex PO19 1RQ Telephone 033022 22543 Website: www.gatcom.org.uk If calling ask for Mrs. Paula Street e-mail: secretary@gatcom.org.uk 22 May
The Sunshine Coast is part of the global community and generates wealth through export, high-value industries and new investment.
 3.2 Strategic intent 3.2.1 Shaping growth an overview In 2031, the Sunshine Coast is renowned for its vibrant economy, ecological values, unique character and strong sense of community. It is Australia
REGIONAL TRANSPORT COMMITTEE
 REGIONAL TRANSPORT COMMITTEE Report of the Regional Transport Committee of the Waikato Regional Council held in the Council Chamber, Waikato Regional Council Office, 401 Grey Street Hamilton East at 9.32
Urban Cycleways Programme Announcement Questions and Answers
 Urban Cycleways Programme Announcement Questions and Answers 1. What is the Urban Cycleways Programme? The Urban Cycleways Programme is a leveraged investment programe made up of $100 million Government
EAST WEST RAIL EASTERN SECTION. prospectus for growth
 EAST WEST RAIL EASTERN SECTION prospectus for growth September 2018 executive summary The East West Rail Consortium, a partnership of local authorities, rail operators and Network Rail, continues to promote
East Lancashire Highways and Transport Masterplan East Lancashire Rail Connectivity Study Conditional Output Statement (Appendix 'A' refers)
") Report to the Cabinet Member for Highways and Transport Report submitted by: Director of Corporate Commissioning Date: 1 June 2015 Part I Electoral Divisions affected: All East Lancashire Highways and
Report to the Cabinet Member for Highways and Transport Report submitted by: Director of Corporate Commissioning Date: 1 June 2015 Part I Electoral Divisions affected: All East Lancashire Highways and
A TRANSPORT SYSTEM CONNECTING PEOPLE TO PLACES
 THE MAYOR'S VISION FOR TRANSPORT A TRANSPORT SYSTEM CONNECTING PEOPLE TO PLACES VISION We will build a transport system that works for everyone, connecting people to the places they want to go within the
NSW PRE-BUDGET STATEMENT FUTURE ECONOMY FUTURE JOBS
 2017-18 NSW PRE-BUDGET STATEMENT FUTURE ECONOMY FUTURE JOBS Executive Summary The 2017-18 NSW State Budget presents an opportunity for the NSW Government to future-proof the tourism and transport sectors.
Strategic Transport Forum
 Strategic Transport Forum Friday 16 th March 2018 www.englandseconomicheartland.com Item 3: Innovation www.englandseconomicheartland.com Innovation work stream - EEH 1. Policy modelling 2. MaaS 3. EEH
Draft City Centre Transport Proposals
 Draft City Centre Transport Proposals Introduction This draft position paper provides an overview of the current City Centre transport issues, including concepts of the possible future City Centre transport
CBD Rail Link Business Case
 CBD Rail Link Business Case Executive Summary: CBD Link Business Case (Nov 2010) Background The CBD Rail Link will be the most significant improvement to Auckland s transport network since the opening
Wales. Andy Thomas. Route Managing Director Wales. Ken Skates, Cabinet Secretary for Economy and Infrastructure, Welsh Government
 Wales The railway in Wales and Borders plays a critical role in connecting people, businesses and communities to support both regional and national economic growth. We run the safest railway in Europe,
Christchurch City Council. Major Cycleways. Activity Management Plan. Long Term Plan
 Major Cycleways Activity Management Plan Long Term Plan 2015 2025 3 December 2014 Quality Assurance Statement Christchurch City Council Civic Offices 53 Hereford Street PO Box 73015 Christchurch 8154 Tel:
North Waikato Integrated Growth Management
 North Waikato Integrated Growth Management Programme Business Case Draft Revision C November 2017 Contents 1. Introduction... 10 1.1 Partners and key stakeholders... 11 2. Programme context... 12 2.1 Geographic
Urban Cycleways Programme Announcement Questions and Answers
 Urban s Programme Announcement Questions and Answers 1. What is the Urban s Programme? The Urban s Programme is an investment of $100 million over the next four years, dedicated to urban cycling infrastructure.
CONGESTION MONITORING THE NEW ZEALAND EXPERIENCE. By Mike Curran, Manager Strategic Policy, Transit New Zealand
 CONGESTION MONITORING THE NEW ZEALAND EXPERIENCE 26 th Australasian Transport Research Forum Wellington New Zealand 1-3 October 2003 By, Manager Strategic Policy, Transit New Zealand Abstract New Zealand
CIVIL AVIATION AUTHORITY Safety and Security Focus Area Work Programme
 CIVIL AVIATION AUTHORITY 2017-2019 Safety and Security Focus Area Work Programme 1 Contents Safety and Security Focus Areas... 3 The reason these focus areas were chosen... 3 Our current eight focus areas...
The Cobham Room, Novotel Hamilton Tainui, 7 Alma Street, Hamilton
 Board Meeting Minutes Date & time Location Board Membership Apologies NZTA staff in attendance 12 August 2016, 8.00am 12.30pm Board Strategy Session 1.00pm 2.30pm The Cobham Room, Novotel Hamilton Tainui,
Response to the London Heathrow Airport Expansion Public Consultation
 Response to the London Heathrow Airport Expansion Public Consultation Summary This report sets out the response to the Heathrow Airport s consultation on airport expansion and airspace change. The consultation
PO Box 257 PO Box 257 PARRAMATTA NSW 2124 PARRAMATTA NSW 2124
 31 March 2017 Sean O Toole Sheridan Dudley District Commissioner - West District Commissioner - South West Greater Sydney Commission Greater Sydney Commission PO Box 257 PO Box 257 PARRAMATTA NSW 2124
For personal use only
 asx release 21 October 2015 Presentation to Morgans Queensland Conference Please find attached the presentation that Transurban CEO Scott Charlton will be delivering at today s Morgans Queensland Conference.
Submission to. Christchurch City Council. on the. Draft Long Term Plan Date: 12 April 2018
 Submission to Christchurch City Council on the Draft Long Term Plan 2018-2028 Date: 12 April 2018 Tourism Industry Aotearoa (TIA) welcomes the opportunity to comment on the Long Term Plan 2018-2028 of
Mood of the Nation New Zealanders' perceptions of international visitors. March 2018
 Mood of the Nation New Zealanders' perceptions of international visitors March 2018 Contents 1 Background and approach 3 2 Key insights 6 3 Detailed insights 10 4 Appendix: measures by region 31 2 1 Background
Gold Coast. Rapid Transit. Chapter twelve Social impact. Chapter content
 Gold Coast Rapid Transit Chapter twelve Social impact Chapter content Social impact assessment process...235 Existing community profile...237 Consultation...238 Social impacts and mitigation strategies...239
Draft Greater Sydney Region Plan
 Powered by TCPDF (www.tcpdf.org) Draft Greater Sydney Region Plan Submission_id: 31119 Date of Lodgment: 12 Dec 2017 Origin of Submission: Online Organisation name: Serapark Pty Ltd Organisation type:
Hamilton City Council Transport Strategy
 Hamilton City Council Transport Strategy Where Does Access Hamilton Fit? Strategic Vision Deliver an affordable, integrated, safe, responsive and sustainable transport system. Support economic, social,
The Challenges for the European Tourism Sustainable
 The Challenges for the European Tourism Sustainable Denada Olli Lecturer at Fan S. Noli University, Faculty of Economy, Department of Marketing, Branch Korça, Albania. Doi:10.5901/mjss.2013.v4n9p464 Abstract
Waikato Plan. A SUMMARY Building champion communities, together. August 2017
 Waikato Plan A SUMMARY Building champion communities, together August 2017 The mighty Waikato region is a place of powerful possibilities. Forged by a proud history and shared excitement about the future,
Accommodation Survey: November 2009
 Embargoed until 10:45am 19 January 2010 Accommodation Survey: November 2009 Highlights Compared with November 2008: International guest nights were up 2 percent, while domestic guest nights were down 1
Submission to. Palmerston North City Council. on the. Draft Long Term Plan Date: 23 April 2018
 Submission to Palmerston North City Council on the Draft Long Term Plan 2018-2028 Date: 23 April 2018 Tourism Industry Aotearoa (TIA) welcomes the opportunity to comment on the Long Term Plan 2018-2028
Autumn Provides Few Falls For Real Estate Market
 News Release 11 May 2011 Autumn Provides Few Falls For Real Estate Market The national housing market recorded a lift in volumes during the month of April, with the seasonally adjusted number of sales
Major Scheme Business Case Summary Report for Programme Entry
 Paper A Heart of South West Local Transport Board Major Scheme Business Case Summary Report for Programme Entry M5 Junction 25, Taunton July 2016 1 SCHEME SUMMARY Scheme Name M5 Junction 25, Taunton Date
Activity Concept Note:
 Activity Concept Note: Summary Provide a short summary of the proposed Activity including indicative New Zealand funding level and note whether this is a New Zealandled or partner-led process. Why: Rationale
Queensland Tourism Aviation Blueprint to 2016
 Queensland Tourism Aviation Blueprint to 2016 tq.com.au Blueprint outline The purpose of the Queensland Tourism Aviation Blueprint to 2016 is to develop the strategic framework that will guide aviation
Kilometres. Blacktown. Penrith. Parramatta. Liverpool Bankstown. Campbelltown
 0 5 10 15 20 Kilometres Penrith Blacktown Parramatta Liverpool Bankstown Campbelltown accessibility outcomes Legend Outcomes targeted in Western Sydney are: public transport that is accessible throughout
Convention Centre Proposal. Have your say before we make a final decision later this year.
 Convention Centre Proposal Have your say before we make a final decision later this year. Conventions are important to cities because of the economic benefits they bring. Page 2 CONTENTS Introduction...3
NEW ZEALAND REGIONAL TOURISM FORECASTS
 NEW ZEALAND REGIONAL TOURISM FORECASTS 21-216 QUEENSTOWN RTO AUGUST 21 www.tourismresearch.govt.nz Tourism Strategy Group Ministry of Economic Development Contents Introduction 1 1. Summary for Queenstown
Submission to. Queenstown Lakes District Council. on the
 Submission to Queenstown Lakes District Council on the Queenstown Lakes District Proposed District Plan, Section 32 Evaluation, Stage 2 Components October 2017, for Visitor Accommodation Date: 23 Feb 2018
The Local Government Tourism Strategy May 2003 Local Government effective governance
 The Local Government Tourism Strategy May 2003 Introduction and Background This strategy has been prepared in response to the New Zealand Tourism Strategy 2010. The document put forward 43 recommendations,
Auckland Transport Quarterly Indicators Report 2018/19
 Attachment 1 Auckland Transport ly Indicators Report 218/19 September 218 Table of Contents Page 2. 1. Executive summary 2. External indicators 3. Performance by Key Priority 3.1 Deliver an efficient and
Launceston and Tamar Valley Traffic Vision
 Launceston and Tamar Valley Traffic Vision A MAJORITY LIBERAL GOVERNMENT WILL: Address growing congestion issues in the Launceston and Tamar Valley road network Provide high productivity freight movement
Annual Business Plan 2017/2018
 Annual Business Plan 2017/2018 Introduction Visitors to Marlborough spent $368 million to the year-end March 2017 up 1% on the previous year. This is a remarkable achievement considering the region was
ISBN no Project no /13545
 ISBN no. 978 1 869452 95 7 Project no. 18.08/13545 Final report to the Ministers of Commerce and Transport on how effectively information disclosure regulation is promoting the purpose of Part 4 for Auckland
Auckland Regional Public Transport Plan
 Auckland Regional Public Plan 2010 www.arta.co.nz Published in June 2010 by: The Auckland Regional Authority Private Bag 92 236 Auckland, New Zealand This document is available on the ARTA website: www.arta.co.nz
PAGE 602
 PAGE 601 PAGE 602 PAGE 603 PAGE 604 PAGE 605 PAGE 606 PAGE 607 PAGE 608 PAGE 609 PAGE 610 PAGE 611 PAGE 612 PAGE 613 PAGE 614 PAGE 615 PAGE 616 PAGE 617 PAGE 618 PAGE 619 PAGE 620 PAGE 621 PAGE 622 PAGE
ENVIRONMENT ACTION PLAN
 ENVIRONMENT ACTION PLAN 2015 16 Airservices Australia 2015 This work is copyright. Apart from any use as permitted under the Copyright Act 1968, no part may be reproduced by any process without prior written
IATA ECONOMICS BRIEFING AIRLINE BUSINESS CONFIDENCE INDEX OCTOBER 2010 SURVEY
 IATA ECONOMICS BRIEFING AIRLINE BUSINESS CONFIDENCE INDEX OCTOBER SURVEY KEY POINTS Results from IATA s quarterly survey conducted in October show business conditions continued to improve during the third
NEW ZEALAND REGIONAL TOURISM FORECASTS
 NEW ZEALAND REGIONAL TOURISM FORECASTS 21-216 LAKE TAUPO RTO AUGUST 21 www.tourismresearch.govt.nz Tourism Strategy Group Ministry of Economic Development Contents Introduction 1 1. Summary for Lake Taupo
Submission to. South Wairarapa District Council. on the. Draft Long Term Plan Date: 23 April 2018
 Submission to South Wairarapa District Council on the Draft Long Term Plan 2018-2028 Date: 23 April 2018 Tourism Industry Aotearoa (TIA) welcomes the opportunity to comment on the Long Term Plan 2018-2028
NEW ZEALAND REGIONAL TOURISM FORECASTS
 NEW ZEALAND REGIONAL TOURISM FORECASTS 21-216 NELSON RTO AUGUST 21 www.tourismresearch.govt.nz Tourism Strategy Group Ministry of Economic Development Contents Introduction 1 1. Summary for Nelson RTO
NEW ZEALAND REGIONAL TOURISM FORECASTS
 NEW ZEALAND REGIONAL TOURISM FORECASTS 21-216 ROTORUA RTO AUGUST 21 www.tourismresearch.govt.nz Tourism Strategy Group Ministry of Economic Development Contents Introduction 1 1. Summary for Rotorua RTO
KANGAROO ISLAND WATERGAP PROJECT
 KANGAROO ISLAND WATERGAP PROJECT 1. BACKGROUND Although Kangaroo Island is only 112km from Adelaide, it is economically and socially disadvantaged by its 16km watergap separation from the mainland. There
Submission to. Wairoa District Council. on the. Draft Long Term Plan Date: 26 June 2018
 Submission to Wairoa District Council on the Draft Long Term Plan 2018-2028 Date: 26 June 2018 Tourism Industry Aotearoa (TIA) welcomes the opportunity to comment on the Long Term Plan 2018-2028 of Wairoa
South of England north-south connectivity
 South of England north-south connectivity An outline economic case for the inclusion of north-south connectivity improvements to form part of the government s road investment strategy (RIS2) Weston-super-Mare
N4 Carrick-on-Shannon to Dromod Road Project. 2.1 Introduction
 Chapter 2 Need for the Scheme 2.1 Introduction The National Primary Route N4, Dublin to Sligo is a strategic corridor from Dublin to the northwest and border counties (See RCSR 101 in Volume 2). The National
PSP 75 Lancefield Road. Northern Jacksons Creek Crossing Supplementary Information
 PSP 75 Lancefield Road Northern Jacksons Creek Crossing Supplementary Information September 2017 The northern crossing of Jacksons Creek proposed within the Lancefield Road PSP is a key part of the ultimate
IAT Annual Conference 'Driving Forward
 Zero to Hero Transformation of Ireland s National Road Network IAT Annual Conference 'Driving Forward Sean O Neill Topics Overview How It All came together. TII & National Road Network & History A Little
30 th January Local Government s critical role in driving the tourism economy. January 2016 de Waal
 30 th January 2016 Local Government s critical role in driving the tourism economy January 2016 de Waal Contents Local Government can make or break tourism in their jurisdiction... 3 TNQ Tourism Vision...
Report to: Greater Cambridge Partnership Joint Assembly 18 January A10 Foxton level crossing bypass and travel hub
 Report to: Greater Cambridge Partnership Joint Assembly 18 January 2018 Lead officer: Chris Tunstall GCP Director of Transport A10 Foxton level crossing bypass and travel hub 1. Purpose 1.1 The list of
About ABTA. Executive summary
 ABTA response to the Department for Transport Draft Airports National Policy Statement new runway capacity and infrastructure at airports in the South East of England About ABTA ABTA The Travel Association
Part four. In this part you will find: The next steps to deliver the master plan
 Part four NEXT STEPS In this part you will find: The next steps to deliver the master plan 6. How COULD the Master Plan be delivered? There are a number of steps required to take the proposals in the master
[REGIONAL LAND TRANSPORT PROGRAM AND REGIONAL FUEL TAX SUBMISSION ]
![[REGIONAL LAND TRANSPORT PROGRAM AND REGIONAL FUEL TAX SUBMISSION ]](/thumbs/89/99007492.jpg "[REGIONAL LAND TRANSPORT PROGRAM AND REGIONAL FUEL TAX SUBMISSION ]") 2018 Ben Ross Talking Southern Auckland Picture 1: Manukau Bus Station with MIT and rail station in the background [REGIONAL LAND TRANSPORT PROGRAM AND REGIONAL FUEL TAX SUBMISSION ] Submission to the
2018 Ben Ross Talking Southern Auckland Picture 1: Manukau Bus Station with MIT and rail station in the background [REGIONAL LAND TRANSPORT PROGRAM AND REGIONAL FUEL TAX SUBMISSION ] Submission to the
Your Transport Levy Your Transport Future. Sunshine Coast Council Transport Levy Annual Report
 Your Transport Levy Your Transport Future Sunshine Coast Council Transport Levy Annual Report 2016-2017 www.sunshinecoast.qld.gov.au T 07 5475 7272 F 07 5475 7277 Locked Bag 72 Sunshine Coast Mail Centre
PERTH AND KINROSS COUNCIL. Enterprise and Infrastructure Committee 4 November 2009
 PERTH AND KINROSS COUNCIL 4 09/494 Enterprise and Infrastructure Committee 4 November 2009 STRATEGIC PRIORITIES FOR TOURISM AND AREA TOURISM PARTNERSHIP ARRANGEMENTS Report by Depute Director (Environment)
TASMAN REGIONAL LAND TRANSPORT PROGRAMME
 TASMAN REGIONAL LAND TRANSPORT PROGRAMME 2009/10 2011/2012 Table of Contents Message from the Chair... 4 Foreword... 5 1. Introduction... 6 1.1 Purpose... 6 1.2 Scope... 6 1.3 Relationship between Regional
STRATEGIC INVESTMENT IN MANCHESTER AIRPORT
 Report To: EXECUTIVE CABINET Date: 7 February 2018 Cabinet Deputy/Reporting Officer: Subject: Report Summary: Cllr Bill Fairfoull Executive Member (Finance & Performance) Tom Wilkinson, Assistant Director
NZ price index relative to peak
 Media release 10 February Property value growth rate slows The latest monthly property value index shows that nationwide residential values for January have increased 9.6% over the past year, and 2.2 over
The overarching aim of this strategy is to ensure that Devon can achieve its potential to be a first class visitor destination.
 Devon Tourism Strategy 2013-2016 1.0 Introduction This strategy, produced by the Devon Tourism Partnership (), aims to provide an overarching guiding framework for the development of the tourism sector
Scotland s Water Industry: Past, Present and Future
 Scotland s Water Industry: Past, Present and Future A presentation by Katherine Russell Director of Strategy and Corporate Affairs Water Industry Commission for Scotland 16 June 2015 www.watercommission.co.uk
Update on the Thameslink programme
 A picture of the National Audit Office logo Report by the Comptroller and Auditor General Department for Transport Update on the Thameslink programme HC 413 SESSION 2017 2019 23 NOVEMBER 2017 4 Key facts
TOWN PLANNING SUBMISSION TO THE GREATER SYDNEY COMMISSION LANDS AT ARTARMON
 TOWN PLANNING SUBMISSION TO THE GREATER SYDNEY COMMISSION LANDS AT ARTARMON March 2017 TABLE OF CONTENTS 1.0 INTRODUCTION 3 2.0 THE SUBJECT SITE 4 3.0 STRATEGIC PLANNING CONTEXT 6 4.0 SUMMARY AND CONCLUSIONS
TAG Guidance Notes on responding to the Civil Aviation Authority s consultation on its Five Year Strategy
 TAG Guidance Notes on responding to the Civil Aviation Authority s consultation on its Five Year Strategy 1. Introduction (Deadline for consultation responses is 19 February 2016) The CAA is currently
MAXIMUM LEVELS OF AVIATION TERMINAL SERVICE CHARGES that may be imposed by the Irish Aviation Authority ISSUE PAPER CP3/2010 COMMENTS OF AER LINGUS
 MAXIMUM LEVELS OF AVIATION TERMINAL SERVICE CHARGES that may be imposed by the Irish Aviation Authority ISSUE PAPER CP3/2010 COMMENTS OF AER LINGUS 1. Introduction A safe, reliable and efficient terminal