Not all collagen is the same, it s time to choose the right one Analyst Gathering
|
|
|
- Grace May
- 6 years ago
- Views:
Transcription

1 Not all collagen is the same, it s time to choose the right one Analyst Gathering February 2015

2 Table of Contents MACRO OVERVIEW 3 BUSINESS OVERVIEW 6 INDICATIVE 2014 RESULTS & 2015 OUTLOOK 14 2
3 Not all collagen is the same, it s time to choose the right one Section 1 Macro Overview
 ASEAN Economic Community 12.5%* *based on average Rising inflation of 8.")
 triggered by fuel price increase on Nov 2014 Political uncertainty Legislative Election & Presidential Election")
4 Macro Overview 2014 Macro highlights 2015 Macro outlook Weakening Rupiah, but with less volatility Rupiah US Dollar (Exchange Rates on Transaction) ASEAN Economic Community 12.5%* *based on average Rising inflation of 8.36% (yoy) Inflation reached 8.36% (y-o-y) triggered by fuel price increase on Nov 2014 Political uncertainty Legislative Election & Presidential Election International expansion opportunities Non tariff barriers in pharma industry Infrastructure improvement in longer term 4


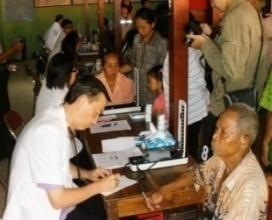
5 Healthcare Industry The new national health insurance roll-out 2014 Highlights JKN covered more than 133 million people, higher than targeted coverage of 120 million people 2015 Outlook Integration of formal sector workers into JKN Discussion of Coordination of Benefits(COB) JKN has been implemented since Jan 1, JKN Coverage million people 2015 Target 170 million people 2019 Target 250 million people Increased health spending in 2015 government budget *in trillion Rp (APBNP) (APBN) 3.5% of Gov t Budget
6 Not all collagen is the same, it s time to choose the right one Section 2 Business Overview


7 Strategic Intent WBAWI We are an Innovative Health Care Business providing Health Care Products & Its Related Services Mission To improve health for a better life Vision To be the best Indonesian Global Health Care company driven by innovation, strong brands and excellent management Strategy 1.Sustainable Growth 2.Innovation & Productivity 3.World Class Competence & Organization Values We believe in : Trust, Mindfulness, Innovation, Strive to be the best, Interconnectedness 7


8 Our Strategies 1. Strengthen business portfolio through innovation and M&A 2. Improve marketing and sales effectiveness CORPORATE BRANDING Morinaga Mall to Mall 2014, attracting more than 288,000 visitors Diabetasol 3J Campaign & Healthy Activities in World Diabetes Day 8


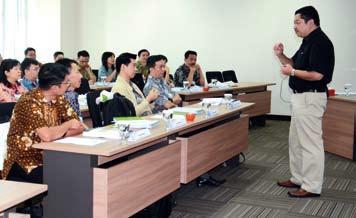


9 Our Strategies 3. Accelerate Go Global implementation 4. Develop future leaders with competence and Kalbe Panca Sradha character Kalbe Middle Management Program Kalbe Learning Center 5. Strengthen quality assurance, compliance, and corporate social responsibilities 9


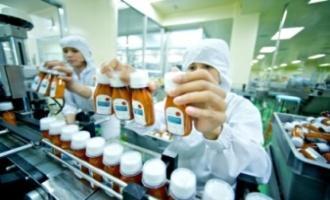
10 2014 Key Achievements & Activities Strengthening production and distribution network Started commercial production of oncology production facilities at Pulogadung Upgraded distribution facilities Bandar Lampung Increased production lines and capacities Tangerang Surabaya 10


11 2014 Key Achievements & Activities Strengthening product portfolio through innovation New Product Launches Research & Development Stem Cell and Cancer Institute 11


12 2014 Key Achievements & Activities International expansion Woods Winter Wholesale Displays Fitbar TV Commercial Diabetasol Product Sampling South Africa Philippines Nigeria Myanmar Vietnam Extra Joss Cup Procold Booth & Sponsorship Mixagrip Store Branding Mixagrip Taxi Branding Kalbe Ethical Product Booth - Medical Forum 12


 2014")


13 2014 Key Achievements & Activities Getting closer to our consumers Integrated Service to Consumers Direct to Consumer (DTC) Activities 2014 Kalbe Customer Care Kalbe e-store Kalbe Home Delivery KALCare Experiential Store Mobile Application Utilization Kalbe Family Rewards Card Morinaga Entrasol KalbeMed Mobile Application Mommychi Mom & Child Mobile Application Diabetes Solution Center Mobile Application Fatigon Hydro Coco 13

14 Not all collagen is the same, it s time to choose the right one Section 3 Indicative 2014 Results & 2015 Outlook
15 Consolidated Sales Consistent Top Line Growth of Internal Kalbe Products Net Sales (in Rp Bn) 31 Dec Dec 2014 (Unaudited) +20.8% 16, % 17, % +16.7% -5.2% 3,869 4,329 2,505 2,924 3,792 4,581 5,836 5,531 Prescription Pharmaceuticals Consumer Health Nutritionals Distribution & Logistics Consolidation 15
 Operating Profit Margin 15.9% + 8.0% 15.")
 Selling & Marketing General & Administrative Research & Development 31 Dec 2013 31 Dec")
16 Consolidated Operating Performance Stable Operating Margin Gross Profit Margin % 48.0% 48.8% 7, Dec , Dec 2014 (Unaudited) Operating Profit Margin 15.9% + 8.0% 15.9% 2,549 2,754 Operating Expenses to Net Sales Ratios 32.1% 32.9% 0.8% 0.8% 4.8% 5.2% 26.4% 26.9% 31 Dec Dec 2014 (Unaudited) Selling & Marketing General & Administrative Research & Development 31 Dec Dec 2014 (Unaudited) Intensive marketing efforts to drive brand awareness R & D to support product development 16
 + 7.0% 16.1% 15.")
 31")


17 Consolidated Net Earnings Consistent Earnings Growth Income Before Tax (in Rp bn) + 7.0% 16.1% 15.9% 2,573 2,753 Net Income (in Rp bn) +6.9 % 12.0% 11.8% 1,920 2, Dec Dec 2014 (Unaudited) 31 Dec Dec 2014 (Unaudited) Income before tax margin declined from 16.1% in FY 2013 to 15.9% in FY 2014 mostly due to higher interest expense and miscellaneous expenses. Net income margin declined from 12.0% in FY 2013 to 11.8% in FY
18 Working Capital Management Improving Days of Inventory Dec Dec Dec 2010 Days of Account Receivables Days of Account Payables No. of days Dec Dec Dec 2013 Days of Inventories Net Operating Cycle Dec 2014 (Unaudited) Improving inventory level due to stabilizing raw material price in 2014 Net Operating Cycle has been decreased by 29 days from 158 days in 2008 to 129 days in 2014 End-to-end supply chain management would be continuously implemented to overcome any fluctuation in inventory 18


 Dividend Payout Ratio (%) *For Fiscal Year *Cash dividend are adjusted for stock split")
19 Solid Financial Position Rp 1.62 Trillion of Net Cash Position Total Debt and Gearing Ratio Cash & Net Cash Balance % 7.2% 2.3% 2.9% 3.2% 0.5% Total Debt in Rp Billion Gearing Ratio (Unaudited) 15.0% 10.0% 5.0% 0.0% 1,562 1, ,291 2,151 1,902 1, Cash and Cash Equivalent in Rp Billion 1,860 1,655 1, ,919 Net Cash in Rp Billion 1, (Unaudited) Dividend Payment Capital Expenditure % % % 51% 42% Cash Dividend* (Rp/share) Dividend Payout Ratio (%) *For Fiscal Year *Cash dividend are adjusted for stock split impact 80% 60% 40% 20% 0% * Capital Expenditure in Rp Billion (Unaudited) 19
20 Outlook 2015 Earnings Guidance 2015 * 1. Year-on-year Sales Growth 11% - 13% 2. Operating Profit Margin 16% - 17% 3. Earnings per Share growth of 14% - 16% 4. Dividend payout ratio minimum 50% * Excluding the impact of product recall Capex Rp Tn for production capacity and distribution network expansion. 20
21 THANK YOU For further information: PT Kalbe Farma Tbk. Jalan Let.Jend. Suprapto Kav. 4 Jakarta 10510, Indonesia Tel. : Fax. : vidjongtius@kalbe.co.id kartika.setiabudy@kalbe.co.id investor.relations@kalbe.co.id Website : 21
Tasty way to reduce cholesterol Analyst Gathering
 Tasty way to reduce cholesterol Analyst Gathering February 2014 Table of Contents BUSINESS OVERVIEW 3 INDICATIVE 2013 RESULTS & 2014 OUTLOOK 12 2 SECTION 1 Business Overview Tasty way to reduce cholesterol
Indicative 2016 Results (Unaudited) February 2017
 February 2017") Indicative 2016 Results (Unaudited) February 2017 Table of Contents 2 Macro Overview 3 Business Overview 35 Indicative 2016 Results 14 3 2017 Outlook 20 3 Macro Overview Gradual Recovery 3 1. Growth Improvement
Indicative 2016 Results (Unaudited) February 2017 Table of Contents 2 Macro Overview 3 Business Overview 35 Indicative 2016 Results 14 3 2017 Outlook 20 3 Macro Overview Gradual Recovery 3 1. Growth Improvement
FY2015 2nd Quarter Business Results
 FY2015 2nd Quarter Business Results Project AH A MAY products Yamaha Corporation and Yamaha Motor Co., Ltd. make products by exchanging the design divisions and their design fields, and present a joint
Corporate Presentation 2012/13 Interim Results
 Corporate Presentation 2012/13 Interim Results 26 February 2013 0 Disclaimer The information contained in this presentation is intended solely for your personal reference. Such information is subject to
Preliminary Figures FY 2016
 February 14, 2017 Preliminary Figures FY 2016 Capital Markets Day 2017 Tom Blades (CEO) Disclaimer This presentation has been produced for support of oral information purposes only and contains forwardlooking
A n n u a l R e s u l t s
 2 0 1 3 A n n u a l R e s u l t s 27 February 2014 Overview Accounting Sales up 3%. Global Brand Sales down 2%. Sales mainly decline in China, Taiwan and Singapore offset by growth in other markets, particularly
PETROSEA RESULTS FOR THE PERIOD ENDED 30 SEPTEMBER 2017
 PETROSEA RESULTS FOR THE PERIOD ENDED 30 SEPTEMBER 2017 PT Petrosea Tbk., a multi-disciplinary mining, infrastructure and oil & gas services company, reported its unaudited consolidated financial statements
Corporate Presentation 2015/16 Interim Results
 Corporate Presentation 2015/16 Interim Results 24 February 2016 0 Disclaimer The information contained in this presentation is intended solely for your personal reference. Such information is subject to
OPERATING AND FINANCIAL HIGHLIGHTS SUBSEQUENT EVENTS
 Copa Holdings Reports Net Income of US$6.2 Million and EPS of US$0.14 for the Third Quarter of 2015 Excluding special items, adjusted net income came in at $37.4 million, or EPS of $0.85 per share Panama
Press Release. Bilfinger with dynamic start to financial year 2018
 Press Release May 15, 2018 Bilfinger with dynamic start to financial year 2018 Book-to-bill ratio reaches 1.2 in the first quarter Fourth consecutive growth quarter in orders received Adjusted EBITA above
Interim Report 6m 2014
 August 11, 2014 Interim Report 6m 2014 Investors and Analysts Conference Call on August 11, 2014 Joachim Müller, CFO Latest ad-hoc release (August 4, 2014) Reduction of forecast, primarily due to a further
Q1 2018/
 Q1 2018/2019 27.02.2019 Highlights Q1/19 CHANGE VS. Q1-18 Financial drivers Total revenue up 6% with broadly unchanged capacity Slight increase in passengers and load factor HIGHLIGHTS Q1/19 Improved unit
OPERATING AND FINANCIAL HIGHLIGHTS
 Copa Holdings Reports Financial Results for the Fourth Quarter of 2015 Excluding special items, adjusted net income came in at $31.7 million, or EPS of $0.73 per share Panama City, Panama --- February
2012 Result. Mika Vehviläinen CEO
 2012 Result Mika Vehviläinen CEO 1 Agenda Market environment in Q4 Business performance and strategy execution Outlook Financials 2 Market Environment According to IATA, Global air travel continues to
China Lodging Group (HTHT.US) Q4 and full year 2017 Earnings Call March 13, 2018
 Q4 and full year 2017 Earnings Call March 13, 2018") China Lodging Group (HTHT.US) Q4 and full year 2017 Earnings Call March 13, 2018 Agenda Strategy Review Operational and Financial Review Q & A Appendix 1 Strong RevPAR Growth Driven by ADR + Occupancy
China Lodging Group (HTHT.US) Q4 and full year 2017 Earnings Call March 13, 2018 Agenda Strategy Review Operational and Financial Review Q & A Appendix 1 Strong RevPAR Growth Driven by ADR + Occupancy
Copa Holdings Reports Net Income of $49.9 million and EPS of $1.18 for the Second Quarter of 2018
 Copa Holdings Reports Net Income of $49.9 million and EPS of $1.18 for the Second Quarter of 2018 Panama City, Panama --- Aug 8, 2018. Copa Holdings, S.A. (NYSE: CPA), today announced financial results
All Time High Quarter I Results, FY Net Sales up 35.7 %, EBITDA up 65.6 %, Net profit up 55.8%
 All Time High Quarter I Results, FY 2014-15 Net Sales up 35.7 %, EBITDA up 65.6 %, Net profit up 55.8% Mumbai, July 30, 2014: Pharma Major, Lupin Ltd. reported its performance for the first quarter ending
China Lodging Group (HTHT.US) Q Earnings Call August 17, 2017
 Q Earnings Call August 17, 2017") China Lodging Group (HTHT.US) Q2 2017 Earnings Call August 17, 2017 Agenda Lodging Landscape in China Strategy Review Operational and Financial Review Q & A Appendix 1 Strong Demand: Domestic Travel Remains
China Lodging Group (HTHT.US) Q2 2017 Earnings Call August 17, 2017 Agenda Lodging Landscape in China Strategy Review Operational and Financial Review Q & A Appendix 1 Strong Demand: Domestic Travel Remains
An innovative media company delivering sustainable, profitable growth Half year results 21 st August 2013
 An innovative media company delivering sustainable, profitable growth Half year results 21 st August 2013 Richard Findlay Chairman An innovative media company delivering sustainable, profitable growth
OPERATING AND FINANCIAL HIGHLIGHTS SUBSEQUENT EVENTS
 Copa Holdings Reports Financial Results for the Third Quarter of 2016 Excluding special items, adjusted net income came in at $55.3 million, or adjusted EPS of $1.30 per share Panama City, Panama --- November
Q Earnings Financial Results for the First Quarter Ended June 30, July 28, 2016 OMRON Corporation
 Q1 2016 Earnings Financial Results for the First Quarter Ended June 30, 2016 July 28, 2016 OMRON Corporation Summary Q1 Results Both sales and operating income are in line with internal plan (decreased
OPERATING AND FINANCIAL HIGHLIGHTS. Subsequent Events
 Copa Holdings Reports Net Income of $103.8 million and EPS of $2.45 for the Third Quarter of 2017 Excluding special items, adjusted net income came in at $100.8 million, or EPS of $2.38 per share Panama
Sales increased and income will be on a recovery track in the second half of the fiscal year.
 Sales increased and income will be on a recovery track in the second half of the fiscal year. Contents I. Results for the First Half of Fiscal Year Ending March 2019 Profit decreased mainly due to temporary
Corporate Presentation
 Corporate Presentation 2010/11 Interim Results 22 February 2011 Bossini International Holdings Limited 堡獅龍國際集團有限公司 Disclaimer The information contained in this presentation is intended solely for your
OPERATING AND FINANCIAL HIGHLIGHTS
 Copa Holdings Reports Net Income of US$32.0 Million and EPS of US$0.72 for the Second Quarter of 2012 Excluding special items, adjusted net income came in at $58.6 million, or EPS of $1.32 per share Panama
SAS Group Presentation Carnegie, May 22, 2012 Sture Stölen, Head of IR
 SAS Group Presentation Carnegie, May 22, 2012 Sture Stölen, Head of IR 1 This is the SAS Group 128 destinations 27,2 million passengers 28 new routes to be launched 2012 1,085 daily flights Revenues 2011,
AIRBUS. H Roadshow Presentation. July 2018
 AIRBUS H1 2018 Roadshow Presentation July 2018 H1 18 HIGHLIGHTS 2 Robust commercial aircraft environment Backlog of ~7,200 a/c underpins ramp-up plans H1 financials reflect mainly A350 performance and
China Lodging Group (HTHT.US) Q Earnings March 15, 2017
 Q Earnings March 15, 2017") China Lodging Group (HTHT.US) Q4 2016 Earnings March 15, 2017 Agenda Strategy Review Acquisition of Crystal Orange Hotel Operational and Financial Review Q & A Appendix 1 What We Have Achieved in 2016
China Lodging Group (HTHT.US) Q4 2016 Earnings March 15, 2017 Agenda Strategy Review Acquisition of Crystal Orange Hotel Operational and Financial Review Q & A Appendix 1 What We Have Achieved in 2016
SAS Group Q Teleconference
 SAS Group Q4 2012 Teleconference December 12, 2012 1 Break-even result in 2012 despite 1.6 bn SEK higher fuel cost 23 MSEK EBT (before non-recurring items) despite 1.6 bn SEK higher fuel cost Positive
For personal use only HILLS HOLDINGS HALF YEAR RESULTS FY2013
 HILLS HOLDINGS HALF YEAR RESULTS FY2013 TODAY KEY HIGHLIGHTS OUR FY13 FIRST HALF RESULTS GROUP PERFORMANACE FIRST HALF NPAT 1 $8.2M IN LINE WITH NOVEMBER AGM GUIDANCE. STRONG MANAGEMENT OF WORKING CAPITAL
2007/08 Full Year Results Investor Briefing
 2007/08 Full Year Results Investor Briefing Highlights of Result Profit before tax up 46% to $1,408 million Up 36% on the reported result Margin improvement $3 billion of Sustainable Future Benefits achieved
Air China Limited Annual Results. March Under IFRS
 Air China Limited 21 Annual Results Under IFRS March 211 Agenda Part 1 Highlights Part 2 Business Overview Part 3 Financial Overview Part 4 Outlook 2 Part 1 Highlights Steady Economic Growth; Asia Pacific
Presentation on Results for the 2nd Quarter FY Idemitsu Kosan Co.,Ltd. November 1, 2016
 Presentation on Results for the 2nd Quarter FY 2016 Idemitsu Kosan Co.,Ltd. November 1, 2016 Table of Contents 1. 2nd Quarter FY 2016 Financials (1) Overview (2) Segment Information 2. Reference Materials
IAG results presentation. Quarter Three st October 2014
 IAG results presentation Quarter Three 2014 31 st October 2014 Q3 financial summary OPERATING PROFIT TOTAL UNIT REVENUE PAX UNIT REVENUE 900m (reported, pre-exceptional items) -1.9% (constant FX) -0.9%
Yoma Strategic s 3Q2017 Revenue grew by 16.6% with improved Gross Profit margins
 Media Release Yoma Strategic s 3Q2017 Revenue grew by 16.6% with improved Gross Profit margins Revenue across the Group s core businesses grew for the quarter Gross Profit margins improved from 34.3% in
OPERATING AND FINANCIAL HIGHLIGHTS. Subsequent Events
 Copa Holdings Reports Net Income of US$113.1 Million and EPS of US$2.57 for the First Quarter of 2015 Excluding special items, adjusted net income came in at US$106.0 million, or EPS of US$2.41 per share
FY RESULTS ROADSHOW PRESENTATION
 1 FY RESULTS 2014 ROADSHOW PRESENTATION FY 2014 HIGHLIGHTS FOCUS ON EXECUTION 2 Strong financial performance Revenues: 61 bn, +5% vs. 2013 EBIT* before one off: 4.1 bn, +15% vs. 2013 EPS: 2.99, +61% vs.
2008/09 Interim Results For the six months ended 31 December 2008
 Bossini International Holdings Limited 2008/09 Interim Results For the six months ended 31 December 2008 Corporate Presentation 18 March 2009 0 0 Disclaimer The information contained in this presentation
OPERATING AND FINANCIAL HIGHLIGHTS
 Copa Holdings Reports Financial Results for the Fourth Quarter of 2018 Excluding special items, adjusted net profit came in at $44.0 million, or Adjusted EPS of $1.04 Panama City, Panama --- February 13,
ANA HOLDINGS Management Strategy Update
 ANA HOLDINGS NEWS ANA HOLDINGS Management Strategy Update TOKYO, April 28, 2017 - ANA HOLDINGS (hereafter ANA HD ) today provides an update to its FY2016-2020 Mid-Term Management Strategy, set out in January
Third Quarter Results
 1 Third Quarter 2010-11 Results Highlights of the Third Quarter Passenger business affected by significant disruptions Dynamic cargo activity Strong improvement in results Decline in ex-fuel unit costs
Results Briefing Year ended 30 June 2013
 Ramsay Health Care Limited Results Briefing Year ended 30 June 2013 Christopher Rex, Managing Director 29 August 2013 AGENDA 1. Group Operational and Financial Highlights 2. Segment Operational and Financial
ANA Holdings Financial Results for FY2013
 ANA HOLDINGS NEWS ANA Holdings Financial Results for FY2013 TOKYO April 30, 2014 - ANA Holdings (hereafter ANA HD ) today reports its consolidated financial for fiscal year 2013 (April, 2013 March, 2014).
Corporate presentation CIBC Whistler Institutional Investor Conference January 21, 2010
 Corporate presentation CIBC Whistler Institutional Investor Conference January 21, 2010 Forwardlooking statement Certain information in this presentation and statements made during this presentation, including
Interim Business Report 2017
 April 1, 2017 through September 30, 2017 November 22, 2017 Contents SECTION 1 01 Consolidated Statement of Income 02 Factors Leading to Difference in Consolidated Ordinary Income Compared With Same Period
News Release. LANXESS: 2013 to remain challenging
 LANXESS: 2013 to remain challenging Q2 sales EUR 2.1 billion, down 12 percent Q2 EBITDA pre exceptionals EUR 198 million, down 45 percent Q2 net income EUR 9 million, down 95 percent Outlook for 2013:
Fourth quarter 2018 Martin Lundstedt, President and CEO
 Martin Lundstedt, President and CEO FOURTH QUARTER HIGHLIGHTS NET SALES SEK bn 91.6 12 months 391 bn 105.8 Net sales +SEK 14.2 bn, up 16% (+10% excl. currency) Adjusted operating income increased to SEK
AIR NEW ZEALAND ANNUAL RESULTS ANNUAL RESULTS
 AIR NEW ZEALAND ANNUAL RESULTS 2008 1 HIGHLIGHTS Record operating revenue, up 9% Normalised earnings* $197m Net cash position of $1.3bn Launched direct service to Vancouver and Beijing Award winning product
Financial Results Q1 FY September 2017
 Financial Results Q1 FY18 12 September 2017 2 Key Highlights Q1FY18 Net profit after tax of INR 58cr Ninth successive profitable quarter for the Group Gross debt reduced by INR 398cr and net debt almost
Q Earnings Financial Results for the Third Quarter Ended December 31, January 29, 2015 OMRON Corporation
 Q3 2014 Earnings Financial Results for the Third Quarter Ended December 31, 2014 January 29, 2015 OMRON Corporation Contents 1. Summary 2. Q1-Q3 Results P. 2 P. 4 3. Full-Year Forecast P. 13 4. Corporate
Ramsay Health Care Limited Results Briefing Half Year ended 31 December 2018
 Ramsay Health Care Limited Results Briefing Half Year ended 31 December 2018 Craig McNally, Group Managing Director & Bruce Soden, Group Finance Director 28 February 2019 ramsayhealth.com Agenda Group
Q Earnings Financial Results for the Third Quarter Ended December 31, January 28, 2016 OMRON Corporation
 Q3 2015 Earnings Financial Results for the Third Quarter Ended December 31, 2015 January 28, 2016 OMRON Corporation Summary FY15 Q1-Q3 Results Sales remained flat while operating income decreased, Y/Y.
INVESTOR PRESENTATION. Imperial Capital Global Opportunities Conference September 2015
 INVESTOR PRESENTATION Imperial Capital Global Opportunities Conference September 2015 Forward-looking Statements This presentation contains forward-looking statements within the meaning of the Private
Q1 Fiscal 2018 Statistics
 Q1 Fiscal 2018 Statistics FedEx Corporation Financial and Operating Statistics First Quarter Fiscal 2018 September 19, 2017 This report is a statistical supplement to FedEx s interim financial reports
Presentation on Results for the 2nd Quarter FY Idemitsu Kosan Co.,Ltd. November 14, 2018
 Presentation on Results for the 2nd Quarter FY 2018 Idemitsu Kosan Co.,Ltd. November 14, 2018 Table of Contents 1. FY 2018 2nd Quarter Financials (1) Overview (2) Segment Information 2. Reference Materials
2013 Annual Results Press Conference, March 13, 2014 Eric Trappier, Chairman & CEO
 2013 Annual Results Press Conference, March 13, 2014 Eric Trappier, Chairman & CEO Falcon: an expanded product line 77 Falcon delivered in 2013 : Falcon 7X Certification of EASy II cockpit Falcon 900LX
Tabcorp 2011 full year results
 16 August 2011 Tabcorp 2011 full year results Highlights including demerged Casinos business Reported Net Profit After Tax (NPAT) $534.8 million, up 13.9% (includes oneoff demerger impacts) Normalised
Meeting the Management 2017 Structurally improving the financial profile. Michael Pontzen, CFO
 Meeting the Management 2017 Structurally improving the financial profile Michael Pontzen, CFO Safe harbor statement The information included in this presentation is being provided for informational purposes
For personal use only I SYNERGY GROUP LIMITED H12017 INVESTOR UPDATE
 I SYNERGY GROUP LIMITED H12017 INVESTOR UPDATE DISCLAIMER This presentation and the following discussion may contain forward looking statements by I Synergy Group Limited (isynergy) related to financial
Financial Results 1 st Quarter Mar/2016 (FY2015) 30 July, 2015
 30 July, 2015") Financial Results Mar/2016 (FY2015) 30 July, 2015 Today s Topics P.2 P.3 P.15 1 Overview of FY Mar/2016 Financial Results Operating Revenue Operating Profit 320 307.0 +4.9Bn (+1.6%) 312.0 50 +17.6Bn (+94.6%)
Financial Results Mar/2016 (FY2015) 30 July, 2015 Today s Topics P.2 P.3 P.15 1 Overview of FY Mar/2016 Financial Results Operating Revenue Operating Profit 320 307.0 +4.9Bn (+1.6%) 312.0 50 +17.6Bn (+94.6%)
For personal use only
 HELLOWORLD TRAVEL LIMITED RESULTS ANNOUNCEMENT Highlights for the year ended 30 June 2018 Total Transaction Value (TTV) growth of 3.5% to $6.1 billion, underpinned by strong air ticket sales volume growth.
Press Release. Bilfinger 2017: Stable foundation laid for the future
 Press Release February 14, 2018 Bilfinger 2017: Stable foundation laid for the future Organic growth in orders received after three years of decline Trend reversal: Output volume better than expected Growth
Lippo Malls Indonesia Retail Trust 4Q 2016 Results Presentation
 Lippo Malls Indonesia Retail Trust 4Q 2016 Results Presentation 15 February 2017 Disclaimer Certain statements in this presentation concerning our future growth prospects are forward-looking statements,
Volaris Reports Strong First Quarter 2015: 32% Adjusted EBITDAR Margin, 9% Operating Margin
 Volaris Reports Strong First Quarter 2015: 32% Adjusted EBITDAR Margin, 9% Operating Margin Mexico City, Mexico, April 22, 2015 Volaris* (NYSE: VLRS and BMV: VOLAR), the ultra-low-cost airline serving
AIRBUS. Member States Shareholder Meeting. Toulouse 4 October 2017
 AIRBUS Member States Shareholder Meeting Toulouse 4 October 2017 SAFE HARBOUR STATEMENT 2 DISCLAIMER This presentation includes forward-looking statements. Words such as anticipates, believes, estimates,
OPERATING AND FINANCIAL HIGHLIGHTS. Subsequent Events
 Copa Holdings Reports Financial Results for the First Quarter of 2016 Excluding special items, adjusted net income came in at US$69.9 million, or EPS of US$1.66 per share Panama City, Panama --- May 5,
INVESTOR PRESENTATION. May 2015
 INVESTOR PRESENTATION May 2015 Forward-looking Statements This presentation contains forward-looking statements within the meaning of the Private Securities Litigation Reform Act of 1995 that reflect the
FY 2013 Nippon Paint Group Analysts' Meeting for Financial Results of First Half FY 2013
 FY 2013 Nippon Paint Group Analysts' Meeting for Financial Results of First Half FY 2013 November 18, 2013 Nippon Paint Co., Ltd. Disclaimer The forward-looking statements in this document are based on
SAS Q3 2016/
 SAS Q3 2016/2017 05.09.2017 A strong summer performance drives result improvements Q3 IN SUMMARY Positives + Currency adjusted passenger revenue up 6.4% + Passengers up by ~300,000 + Ancillary and cargo
TUI News Investor Relations
 records very successful financial year 2013/2014 Merger with TUI Travel PLC about to be closed Significant outperformance against earnings targets in full financial year 2013/2014; earnings growth driven
Copa Holdings Reports Net Income of US$113.9 Million for the Fourth Quarter of 2013
 Copa Holdings Reports Net Income of US$113.9 Million for the Fourth Quarter of 2013 Panama City, Panama --- February 12, 2014. Copa Holdings, S.A. (NYSE: CPA), today announced financial results for the
Interim Report 3m Bilfinger Berger SE, Mannheim May 10, 2012 Joachim Müller, CFO
 Interim Report 3m 2012 Bilfinger Berger SE, Mannheim May 10, 2012 Joachim Müller, CFO Bilfinger Berger SE Interim report 3m 2012 May 10, 2012 Page 1 3m 2012: Highlights Growth in output volume and orders
Ramsay Health Care Limited Results Briefing Year ended 30 June 2018
 Ramsay Health Care Limited Results Briefing Year ended 30 June 2018 Craig McNally, Managing Director & Bruce Soden, Group Finance Director 30 August 2018 ramsayhealth.com Agenda Group Performance Overview
SAS AB Q December 2018
 SAS AB Q4 2018 4 December 2018 Q4 financial highlights Q4 POSITIVES Q4-18 CHANGE VS. Q4-17 Record number of passengers Total revenue up SEK 1bn vs. LY Yield (nominal) up 5.1% vs. LY RASK (nominal) up 7.0%
Thor Basics: An Introduction to the Company. 1
 Thor Basics: An Introduction to the Company www.thorindustries.com 1 FORWARD LOOKING STATEMENTS This presentation includes certain statements that are forward looking statements within the meaning of the
OPERATING AND FINANCIAL HIGHLIGHTS
 Copa Holdings Reports Net Income of US$18.6 Million and EPS of US$0.42 for the Second Quarter of 2010 Excluding special items, adjusted net income came in at $26.3 million, or $0.60 per share Panama City,
S$ million 2Q2012 2Q2011 Change 1H2012 1H2011 Change Revenue % % Gross Profit % % Gross Profit Margin
 Roxy-Pacific Holdings Limited NEWS RELEASE ROXY-PACIFIC ACHIEVES 8% INCREASE IN NET PROFIT TO S$17.7 MILLION IN 2Q2012 - Revenue rises 13% to S$52.7 million - 18% surge in revenue from Property Development
SAS Q1 2017/2018. Q1 in Summary: Improved earnings CHANGE VS. Q1 FY17
 SAS 2017/2018 27.02.2018 in Summary: Improved earnings POSITIVES + Passenger revenue up 1% (FX adj.) + Cargo and EB-point sale revenue increased MSEK 109 + Efficiency program delivered MSEK 165 + Positive
First Quarter Results August 31 st, 2006
 First Quarter Results 2006-07 August 31 st, 2006 Key features of the First Quarter Market context Sustained global economic growth, and a recovery in Europe Average jet fuel price of 691 $/t, up 25% year-on-year
Helloworld Travel Limited results announcement Half year ended 31 December 2017
 Helloworld Travel Limited results announcement Half year ended 31 December 2017 HIGHLIGHTS FOR THE HALF YEAR ENDED 31 DECEMBER 2017 Total Transaction Value (TTV) growth of 2.7% to $2.968 billion. Earnings
Finnair Q Result
 Finnair Q1 2015 Result 7 May 2015 CEO Pekka Vauramo, Interim CFO Mika Stirkkinen 1 Turbulent market environment The weakness of the Finnish economy continued to be reflected in the demand in the first
China Lodging Group (HTHT.US) Investor Presentation March 2016
 Investor Presentation March 2016") China Lodging Group (HTHT.US) Investor Presentation March 2016 Agenda Our Vision Who We Are Company Highlights Strategic Focus Operational and Financial Review Q & A 1 Our Vision We will build a world-class,
China Lodging Group (HTHT.US) Investor Presentation March 2016 Agenda Our Vision Who We Are Company Highlights Strategic Focus Operational and Financial Review Q & A 1 Our Vision We will build a world-class,
STAYING TRUE. BofAML Global Transportation Conference. May
 STAYING TRUE BofAML Global Transportation Conference May 19 2011 FORWARD-LOOKING STATEMENT Certain information in this presentation and statements made during this presentation, including any question
Q4 Fiscal 2017 Statistics
 Q4 Fiscal 2017 Statistics FedEx Corporation Financial and Operating Statistics Fourth Quarter Fiscal 2017 July 17, 2017 This report is a statistical supplement to FedEx s interim financial reports and
Heathrow (SP) Limited
 Limited") Draft v2.0 10 Feb Heathrow (SP) Limited Results for year ended 31 December 2013 24 February 2014 Strong operational and financial performance in 2013 Passenger satisfaction at record high and over 72 million
Draft v2.0 10 Feb Heathrow (SP) Limited Results for year ended 31 December 2013 24 February 2014 Strong operational and financial performance in 2013 Passenger satisfaction at record high and over 72 million
UBS 14 th Global Emerging Markets Conference. New York, November 2016
 UBS 14 th Global Emerging Markets Conference New York, November 2016 This presentation may include forward-looking comments regarding the Company s business outlook and anticipated financial and operating
SAS Q2 2017/2018 TELECONFERENCE
 SAS Q2 2017/2018 TELECONFERENCE 30 May 2018 Earnings as expected despite negative currency effect POSITIVES + Total revenue up MSEK 73 vs. LY + Currency adjusted yield up 0.6% vs. LY + EB-point sale revenue
2005 Interim Results. September 7, 2005
 2005 Interim Results September 7, 2005 Outline First-Half 2005 Results Business activity at August 31, 2005 Update on the Real Estate and Expansion Strategies 2 First-half 2005 +22.8% Solid growth in interim
SAS Q3 2017/ August 2018
 SAS Q3 2017/2018 31 August 2018 Strong earnings in peak season POSITIVES Record number of passengers Total revenue up MSEK 936 vs. LY Currency adjusted yield up 1.1% vs. LY EB point sale up 27% vs. LY
Thank you for participating in the financial results for fiscal 2014.
 Thank you for participating in the financial results for fiscal 2014. ANA HOLDINGS strongly believes that safety is the most important principle of our air transportation business. The expansion of slots
RESULTS RELEASE 20 August GENTING HONG KONG GROUP ANNOUNCES FIRST HALF RESULTS FOR 2015 Highlights
 RESULTS RELEASE 20 August 2015 FOR IMMEDIATE RELEASE INTERNATIONAL GENTING HONG KONG GROUP ANNOUNCES FIRST HALF RESULTS FOR 2015 Highlights The commentary below is prepared based on a comparison of the
Yoma Strategic continues strong growth trajectory of Automotive & Heavy Equipment and Consumer businesses in 3Q2018
 Media Release Yoma Strategic continues strong growth trajectory of Automotive & Heavy Equipment and Consumer businesses in 3Q2018 New Holland tractors business grew by 43.9% year-on-year and received another
Investor Relations Update January 25, 2018
 General Overview Investor Relations Update Accounting Changes On January 1, 2018, the company adopted two new Accounting Standard Updates: (ASUs): ASU 2014-9: Revenue from Contracts with Customers (the
2007/08 Interim Results
 Bossini International Holdings Limited 2007/08 Interim Results For the six months ended 31 December 2007 Corporate Presentation 19 March 2008 0 Agenda Results Highlights Review of Operations Future Plans
FY 2018 ROADSHOW PRESENTATION. February 2019
 FY 2018 ROADSHOW PRESENTATION February 2019 SAFE HARBOUR STATEMENT DISCLAIMER This presentation includes forward-looking statements. Words such as anticipates, believes, estimates, expects, intends, plans,
Third Quarter 2014 Results. 29 October 2014
 Third Quarter 2014 Results 29 October 2014 Highlights of the Third Quarter Operating environment Air France-KLM Economic environment remains weak Further currency volatility affecting revenues and results
Presentation on Results for the 3rd Quarter FY Idemitsu Kosan Co.,Ltd. February 2, 2016
 Presentation on Results for the 3rd Quarter FY 2015 Idemitsu Kosan Co.,Ltd. February 2, 2016 Table of Contents 1. 3 rd Quarter FY 2015 Financials (1) Overview (2) Segment Information 2. Forecast for FY
CONTACT: Investor Relations Corporate Communications
 NEWS RELEASE CONTACT: Investor Relations Corporate Communications 435.634.3200 435.634.3553 Investor.relations@skywest.com corporate.communications@skywest.com SkyWest, Inc. Announces Second Quarter 2017
Financial Results 3 rd Quarter MAR/2016 (FY2015)
") Financial Results MAR/2016 (FY2015) January 29 th, 2016 CONTENTS P.1 P.2 P.3 P.4~ Overview of FY MAR/16 Results Operating Revenue Operating Profit 1,030 1,020 1,010 +1.0Bn 1,022.3 1,023.4 (+0.1%) 180 160
Financial Results MAR/2016 (FY2015) January 29 th, 2016 CONTENTS P.1 P.2 P.3 P.4~ Overview of FY MAR/16 Results Operating Revenue Operating Profit 1,030 1,020 1,010 +1.0Bn 1,022.3 1,023.4 (+0.1%) 180 160
Page 1. John Guscic Managing Director, Webjet Limited
 Page 1 John Guscic Managing Director, Webjet Limited spanning both consumer markets (through B2C) and global wholesale markets (through B2B) B2C TRAVEL Leading online consumer travel brands B2B TRAVEL