A n n u a l R e s u l t s
|
|
|
- Whitney Maxwell
- 5 years ago
- Views:
Transcription

1 A n n u a l R e s u l t s 27 February 2014
2 Overview Accounting Sales up 3%. Global Brand Sales down 2%. Sales mainly decline in China, Taiwan and Singapore offset by growth in other markets, particularly Thailand and Indonesia. GP % up 2pp to 60.7%. ME acquisition up 2.3% offset by adverse SEA currencies devaluation. OPEX down 1% (excluding Middle East acquisition impact). PATS down 3% excluding non-recurring exceptional gains. Total system inventory stayed flat. Inventory profile is fresh. Dividend payout remained at 40 HK cents (94% payout ratio), reflecting the Group s strong cash flow position 27 February 2014 Giordano 2013 Annual Results 2
3 Operations Highlights Group Sales up 3% but Trading PATS down 3% (In HK$ millions) Variance Sales 5,848 5,673 +3% Gross margin 60.7% 58.7% +2.0pp Operating expenses (2,836) (2,620) +8% Comparable operating expenses (without Middle East) (2,606) (2,620) -1% Net profit as reported % Net profit margin as reported 11.3% 14.6% -3.3pp Net profit excluding exceptional disposal gains % Net profit margin excluding exceptional disposal gains 11.3% 12.0% -0.7pp 27 February 2014 Giordano 2013 Annual Results 3
4 PATS Reconciliation (HK$ millions) (143) (34) (39) (50) % 663 3% Reported PATS Less: exceptional disposal gains 2012 Trading PATS Decrease in profit from Mainland China Decrease in profits from Hong Kong & Taiwan Decrease in profits from Rest of Asia Pacific Corporate expenses, wholesale & interco margins, NCI and others 2013 Trading Profit (excludes additional profits from Middle East) Additional profits from Middle East 2013 Reported PATS 27 February 2014 Giordano 2013 Annual Results 4
![2013 Final Dividend Dividend remained 40 HK cents, 94% pay-out ratio (In HK cents) DPS [1] EPS Payout Ratio Dividend yield on full year average share price [2] on current share price 2013 40.0 42.](/docs-images/95/122759911/images/5-1.jpg "6 94% 5% 8% 2012 as reported 40.0 53.8 74% 6% 2012 excluding accounting gains on deemed disposals (HK cents) 60 50 40 30 20 10 0 86% 192% Dividend Per Share Payout Ratio 96% 23.0 26.5 26.5 40.0 46.")
5 2013 Final Dividend Dividend remained 40 HK cents, 94% pay-out ratio (In HK cents) DPS [1] EPS Payout Ratio Dividend yield on full year average share price [2] on current share price % 5% 8% 2012 as reported % 6% 2012 excluding accounting gains on deemed disposals (HK cents) % 192% Dividend Per Share Payout Ratio 96% % 6% % 46% February 2014 Giordano 2013 Annual Results 5 83% % 79% % 94% [1] Includes interim dividend of 16.0 HK cents and final dividend of 24.0 HK cents (2012: interim 15.0 HK cents; final 25.0 HK cents) [2] Calculated on full-year average share price (2013: HK$7.45; 2012: HK$6.22) Book close date: May 22-23, 2014 / Dividend payment date: on or about Jun 27, 2014 (%) 200% 160% 120% 80% 40% 0%
 1,756 (31%) 1,427 (25%) Mainland China 9% / 11%* Hong Kong & Taiwan 2% / 1%* Rest of Asia Pacific 2% / 8%* 1,727 (30%) 1,725 (29%) 1,460 (25%) 108 (2%) Middle East Wholesale sales to 485%")
6 Sales Growth and Contribution by Region Sales growth continuing in Southeast Asia; sales decline in China, Taiwan and Singapore (HK$ millions) 7,000 6,000 5,673 5,848 5,000 4,000 3,000 2,000 1, ,898 (33%) 1,756 (31%) 1,427 (25%) Mainland China 9% / 11%* Hong Kong & Taiwan 2% / 1%* Rest of Asia Pacific 2% / 8%* 1,727 (30%) 1,725 (29%) 1,460 (25%) 108 (2%) Middle East Wholesale sales to 485% 632 (11%) 484 (9%) overseas & others 37% 304 (5%) (ex-me: 5%) Mainland China Hong Kong & Taiwan Rest of Asia Pacific Middle East Wholesale sales to overseas & others % to group sales in brackets * Sales growth excludes exchange effects 27 February 2014 Giordano 2013 Annual Results 6
7 Brand Sales Growth for the last 8 quarters Tough trading conditions reflecting weakening macro and intense competition 6% 4% 2% 3% 3% Variance Global brand sales (HK$ millions) 7,912 8,062-2% Comparable store sales growth -2% -1% 2% 0% -2% -1% 0% 0% -2% -1% -1% -1% -2% -2% -2% -2% -2% -4% -3% 1Q12 2Q12 3Q12 4Q12 1Q13 2Q13 3Q13 4Q13 Total Brand Sales Growth Comparable Store Sales Growth 27 February 2014 Giordano 2013 Annual Results 7
8 Store Number by Market as at 31 December 2013 Other Markets, 1% 24 outlets as at Dec-13-5 in 2013 Japan, 0% 10 outlets as at Dec in 2013 Myanmar, 4% 109 outlets as at Dec in 2013 Philippines, 2% 62 outlets as at Dec in 2013 Australia, 1% 32 outlets as at Dec-13 Unchanged in 2013 Singapore, 2% 52 outlets as at Dec-13-2 in 2013 India, 3% 65 outlets as at Dec in 2013 Malaysia, 3% 87 outlets as at Dec in 2013 Hong Kong & Macau, 3% 88 outlets as at Dec in 2013 Mainland China, 44% 1,161 outlets as at Dec in 2013 South Korea, 9% 244 outlets as at Dec-13-9 in 2013 Worldwide Total 2,642 outlets -6 in 2013 Taiwan, 8% 201 outlets as at Dec in 2013 Indonesia, 7% 179 outlets as at Dec in 2013 Thailand, 5% 133 outlets as at Dec in 2013 Middle East, 8% 195 outlets as at Dec in February 2014 Giordano 2013 Annual Results 8
9 Gross Margin Reconciliation Margin improved by Middle East acquisition and product mix changes. SEA currency depreciation adversely affected margin 62% 61% 2.3% 0.3% 60% (0.5%) (0.1%) 59% 58% 60.7% 57% 58.7% 56% 55% 2012 Gross Margin Middle East Impact Increase in purchase costs due to currency depreciation in Rest of AP Margin erosion in Mainland China Margin improvement in Rest of AP 2013 Gross Margin 27 February 2014 Giordano 2013 Annual Results 9
10 Gross Profit Reconciliation Margin improved but volume went down (HK$ millions) 4,000 3,500 3,000 (95) Avg. Cost 4% 356 Avg. Price 7% (337) Volume 12% 329 (33) 2,500 2,000 1,500 3,331 (58.7%) +220m ( 7%) 3,551 (60.7%) 1, Gross Profit Cost Increase Price Increase Volume Decrease Middle East (Jan-Oct 2013) Stock Provision and Exchange Difference 2013 Gross Profit 27 February 2014 Giordano 2013 Annual Results 10
 (6) ( 2%) 27 ( 3%) (5) ( 5%) (35) 230 (13) 2,000 1,500 1,000 2,620 46% of sales +216m ( 8%) 2,836 48% of sales 500 0 2012 Total OPEX Shop")
11 Total Operating Expenses Reconciliation OPEX excluding Middle East down 1% reflecting strong cost controls (HK$ millions) 3,500 Shop area 3% Rent/sq.ft. Flat Headcounts Flat Average salaries 3% 3,000 2, ( 2%) (6) ( 2%) 27 ( 3%) (5) ( 5%) (35) 230 (13) 2,000 1,500 1,000 2,620 46% of sales +216m ( 8%) 2,836 48% of sales Total OPEX Shop Rental Other Shop Overhead Staff Costs (shop & office) Advertising & Marketing Other Operating Expenses Middle East (Jan-Oct 2013) Exchange Difference 2013 Total OPEX 27 February 2014 Giordano 2013 Annual Results 11
12 Operating Profit (Margin) by Region Low sales growth deteriorated profit (HK$ millions) Profit Contribution 18% 13% 31% 26% 35% 31% 3% 15% 13% 15% 269 (15.3%) 218 (12.6%) 301 (21.1%) 259 (17.8%) (8.2%) 112 (6.5%) (19.6%) (26.9%) 0 Mainland China Hong Kong & Taiwan Rest of Asia Pacific Middle East Wholesale Sales to Group Companies & Overseas Franchisees The above exclude the corporate function of -HK$8m (2012: -HK$29m excluding exceptional disposal gains) 27 February 2014 Giordano 2013 Annual Results 12
 (55) (31) 600 400 929 (184) 599 200 0 EBIT Depreciation & amortization CAPEX less disposal Share of pre-tax profit of JCE/associate (net of dividend income) Changes in working capital Others Tax")
13 EBIT and Free Cash Flow from Operations Free cash flow weakened by increased working capital for inventory and rental deposits for store expansion in SE Asia (HK$ millions) 1,200 1, (156) (41) (55) (31) (184) EBIT Depreciation & amortization CAPEX less disposal Share of pre-tax profit of JCE/associate (net of dividend income) Changes in working capital Others Tax paid Free cash flow from operations 27 February 2014 Giordano 2013 Annual Results 13
14 Changes in Working Capital (In HK$ millions) At Dec-12 Changes in working capital Middle East completion dividend (net) At Dec-13 Inventory Trade receivables 361 (45) 316 Trade payables (193) 33 (160) Other receivables and payables (189) 25 (164) Middle East completion dividend (net) (87) February 2014 Giordano 2013 Annual Results 14
15 (HK$ millions) Inventory (ex-me: 63 days) 74 (ex-me: 68days) ME ME Dec 2011 Dec 2012 Dec 2013 Inventory Turnover days (Days) (HK$ millions) Trade Receivables Dec 2011 Dec 2012 Dec 2013 Trade receivables Days Sales Outstanding (Days) (HK$ millions) Trade Payables Dec 2011 Dec 2012 Dec 2013 Trade payables Days Purchases Outstanding (Days) (HK$ millions) Capital Expenditure Dec 2011 Dec 2012 Dec 2013 Capital expenditure Depreciation 27 February 2014 Giordano 2013 Annual Results 15
16 Total Inventory including finished goods at suppliers (In HK$ millions) Dec 2013 Dec 2012 Inventory balance held by the Group Inventory held by franchisees in Mainland China Finished goods at suppliers (not yet shipped) Total system inventory Inventory Aging Analysis GROUP MAINLAND CHINA Dec 2013 Dec 2012 Dec 2013 Dec 2012 Core items 16% 30% 2% 15% Current season 61% 49% 88% 70% Past seasons 23% 21% 10% 15% 100% 100% 100% 100% 27 February 2014 Giordano 2013 Annual Results 16
17 Change in Net Cash and Bank Balances (HK$ millions) 2,000 1,800 1, (87) Completion dividend paid to NCI of subsidiaries in Middle East 1,400 1, , (768) 600 1,173 1, Net Cash & Bank Balances on 31 Dec 2012 Free Cash Flow from Operations Dividend paid to shareholders & NCI Proceeds from issuance of new shares Exchange difference on opening net cash and bank balances Net Cash & Bank Balances on 31 Dec February 2014 Giordano 2013 Annual Results 17


18 outlook


19 Mainland China: Multi-brand Strategy To put the right merchandise in the right place New Budget brand* New Women brand* Giordano Men (GM) Giordano Women (GW) (GL) (GJ) New Budget brand New Women brand Department stores strategy: move from casual apparel floor to separate Men, Women and Junior counters Strong VM, more innovative merchandise & more intimate store ambience Replicate the success of BSX in HK to China Open shops in prime shopping centers and co-location with international brands To launch in 2Q14 Change of channel strategy Replace GIO shops in supermarket which offer good quality functional merchandise at a reasonably low price Replace cashier by cell phone To launch in 2H14 Italian design values but still functional simplicity Price point in between GL and GW * To launch in 2014 by China as pioneer 27 February 2014 Giordano 2013 Annual Results 19
 applications >50% Eshop specific")


20 Mainland China: Other Strategies E-strategy Partner with Alipay online to offline (O2O) applications >50% Eshop specific merchandise Fast marketing and brand x-over 12 campaigns launched in 2H positive feedback from business partners still need to improve the quality and coverage Improve Eshop gross margin AD strategy Further concentration of franchisees Subsidy only for shop refurbishment and marketing initiatives which build the brand Store portfolio development Not chasing sales from opening shops but delivering profits from good store portfolio Special task force was set up to turnaround material loss making stores 27 February 2014 Giordano 2013 Annual Results 20

21
22 Outlook for other regions Hong Kong & Taiwan New multi-brand mini-department store format to roll out in Macau in 2014 High quality fast marketing programs continue to launch in 2014 X-over campaigns in Taiwan South East Asia Continue to expand to realize First mover advantage Launch Marketing programs as brand differentiator Continue to develop small markets such as Vietnam, Cambodia, Myanmar Middle East Back to growth momentum in 2014 after a disappointing year Emerging new markets development including Middle East, Asia Minor, Central Asian republics, Africa, Eastern and Central Europe and Latin America 27 February 2014 Giordano 2013 Annual Results 22
23 Concepts Idea came from mini department store Each brand has its own renovation elements to highlight its brand image Elements of mini department store: 4 zones (Giordano, Giordano Essential, Junior, BSX) Corridor Different colour signature and renovation Variety of choices


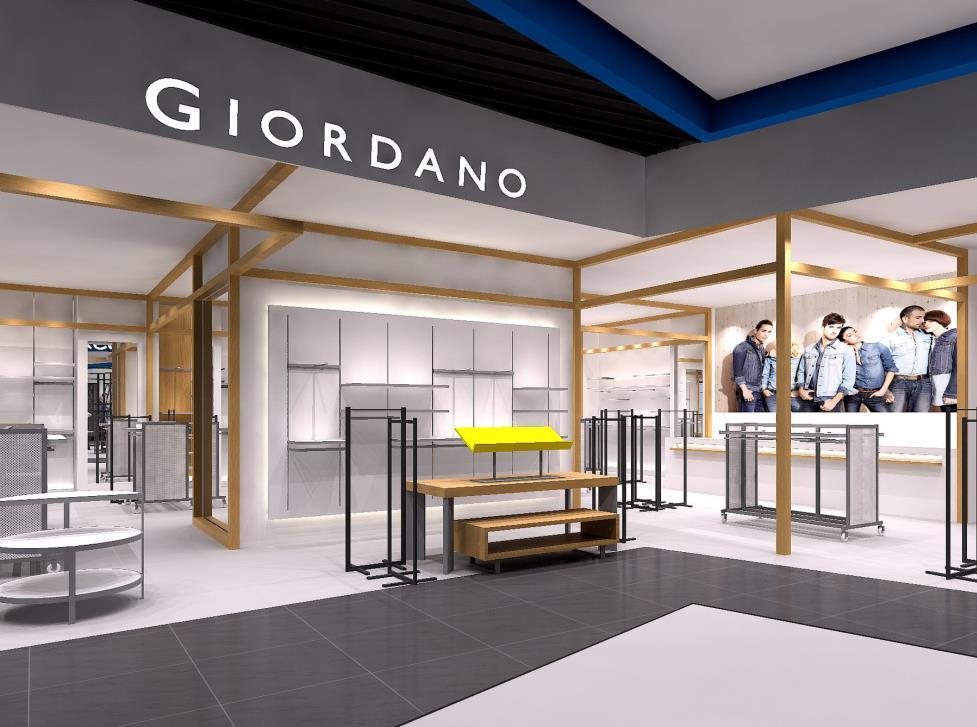
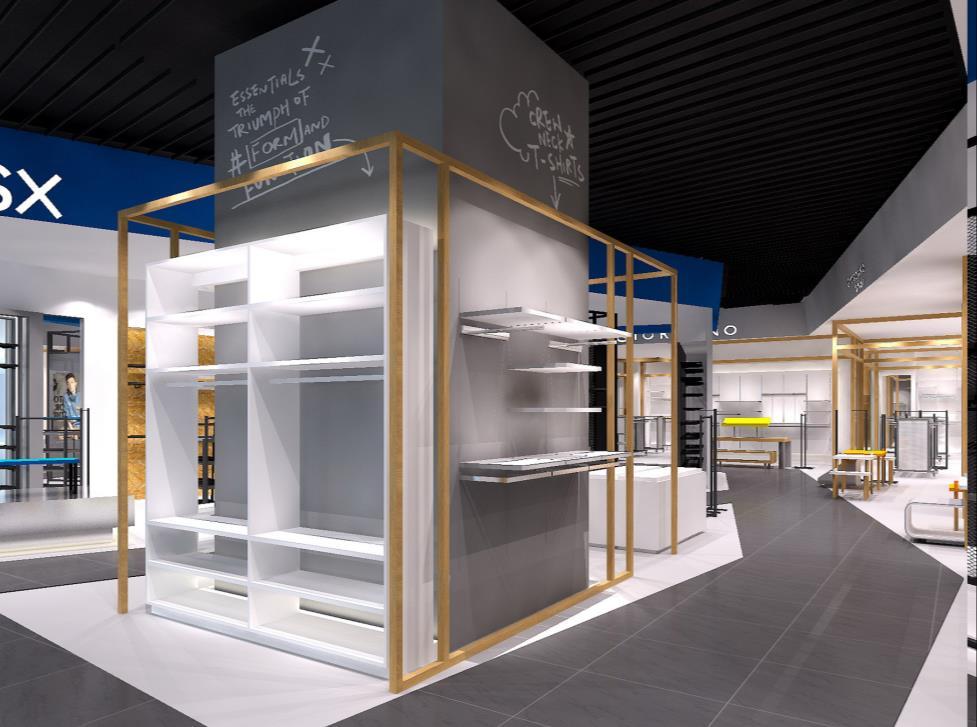

24 Giordano 4 zones Giordano Essential Junior BSX
, a famous Art Photographer in Taiwan Event & pop-up store at a Brand New Arty Place, PMQ ( 元創方 ) @ Hollywood")
25 An Artistic Collaboration Product by 11 Asian Designers from Hong Kong, China, Taiwan, Japan, Korea, and Thailand Images taken by WANG Chien-yang ( 王建揚 ), a famous Art Photographer in Taiwan Event & pop-up store at a Brand New Arty Place, PMQ ( 元創方 Hollywood Road


26

27

28
29 Other objectives for 2014 Maintain Strong Cash Flow Further rationalize inventory in 2014 Concentrating more cash at Headquarter by treasury initiatives Widen supplier base to maintain gross margin Invest prudently in store upgrades and marketing initiatives. Maintain strong control on headcount and operating costs Portfolio Development Continue to review opportunities to develop the Group s operations through direct investment, partnerships with franchisees and joint ventures. 27 February 2014 Giordano 2013 Annual Results 29


30 Q&A 27 February 2014 Giordano 2013 Annual Results 30
31 Summary of Total Sales and Comparable Store Sales Growth by Market Total sales [1] Comparable store sales [2] (HK$ millions) Variance Mainland China 1,727 1,898-9% -6% -6% Hong Kong 1,042 1,024 +2% +2% +11% Taiwan % -4% -9% Singapore % -5% -5% Indonesia % +14% +18% Malaysia % +2% +3% Thailand % +13% +9% Australia % -13% -2% India % -4% -3% UAE % -2% +2% Saudi Arabia % -4% +7% Other Middle East regions 51 n/a -8% -1% Retail & Distribution total 5,544 5,189 +7% -2% -1% Wholesale sales to overseas & others % Group total 5,848 5,673 +3% [1] Total Sales are total retail sales in self-operated stores and total wholesale sales to franchisees, translated at average exchange rates. [2] Comparable Store Sales are total brand sales, at constant exchange rates, from existing stores and e-shop that have been opened/operated in the prior period. 27 February 2014 Giordano 2013 Annual Results 31
32 Global Retail Network Number of outlets Giordano & Junior Giordano Ladies As at 31 December 2013 BSX Others Total As at Dec-12 Change Mainland China 1, ,161 1, Hong Kong & Macau Taiwan Singapore Indonesia Malaysia Thailand Australia India UAE Saudi Arabia South Korea Other markets Group total 2, ,642 2, February 2014 Giordano 2013 Annual Results 32
Corporate Presentation 2012/13 Interim Results
 Corporate Presentation 2012/13 Interim Results 26 February 2013 0 Disclaimer The information contained in this presentation is intended solely for your personal reference. Such information is subject to
2007/08 Interim Results
 Bossini International Holdings Limited 2007/08 Interim Results For the six months ended 31 December 2007 Corporate Presentation 19 March 2008 0 Agenda Results Highlights Review of Operations Future Plans
Corporate Presentation 2015/16 Interim Results
 Corporate Presentation 2015/16 Interim Results 24 February 2016 0 Disclaimer The information contained in this presentation is intended solely for your personal reference. Such information is subject to
2008/09 Interim Results For the six months ended 31 December 2008
 Bossini International Holdings Limited 2008/09 Interim Results For the six months ended 31 December 2008 Corporate Presentation 18 March 2009 0 0 Disclaimer The information contained in this presentation
Corporate Presentation
 Corporate Presentation 2010/11 Interim Results 22 February 2011 Bossini International Holdings Limited 堡獅龍國際集團有限公司 Disclaimer The information contained in this presentation is intended solely for your
HK GAAP RESULTS RELEASE 25 February 2008 STAR CRUISES GROUP ANNOUNCES FOURTH QUARTER AND FULL YEAR RESULTS FOR 2007
 HK GAAP RESULTS RELEASE 25 February 2008 FOR IMMEDIATE RELEASE INTERNATIONAL STAR CRUISES GROUP ANNOUNCES FOURTH QUARTER AND FULL YEAR RESULTS FOR 2007 Key points for the quarter in comparison with 4Q
SIA ENGINEERING COMPANY 1 st Half FY17/18 Financial Review
 SIA SIA ENGINEERING ENGINEERING COMPANY COMPANY 11 st st Half Half FY17/18 FY17/18 Performance Performance Review Review 1 2 SIA ENGINEERING COMPANY 1 st Half FY17/18 Financial Review 1H17/18 Financial
2012 Result. Mika Vehviläinen CEO
 2012 Result Mika Vehviläinen CEO 1 Agenda Market environment in Q4 Business performance and strategy execution Outlook Financials 2 Market Environment According to IATA, Global air travel continues to
HOPEWELL HOLDINGS LIMITED ANNOUNCES FY 2018/19 INTERIM RESULTS
 Press Release HOPEWELL HOLDINGS LIMITED ANNOUNCES FY 2018/19 INTERIM RESULTS Highlights 1H FY19 (1 April to 30 September 2018) First financial year after the change of financial year end date from 30 June
Autron Corporation Limited posts 50% growth in half yearly profit to AUD 10.6 million
 28 February 2005 The Manager Company Announcements Office Australian Stock Exchange Limited Dear Sir re : Autron Corporation Limited posts 50% growth in half yearly profit to AUD 10.6 million The Board
Cathay Pacific Airways 2010 Annual Results 9 March 2011
 Cathay Pacific Airways 2010 Annual Results 9 March 2011 1 Annual Result 2010 2009 Change Group Profit/(Loss) HK$14,048m HK$4,694m +199.3% Group Turnover HK$89,524m HK$66,978m +33.7% Profit Margin 15.7%
Cathay Pacific Airways Interim Results for the six months ended 30 June 2012
 Cathay Pacific Airways Interim Results for the six months ended 30 June 2012 8 August 2012 1 Interim Result 1H2012 1H2011 Change Group attributable (loss) / profit HK$ million (935) 2,808-133.3% Group
FY2015 2nd Quarter Business Results
 FY2015 2nd Quarter Business Results Project AH A MAY products Yamaha Corporation and Yamaha Motor Co., Ltd. make products by exchanging the design divisions and their design fields, and present a joint
1 st Half FY17/18 FY17/18
 SIA SIA ENGINEERING ENGINEERING COMPANY COMPANY 1 st Half Performance Performance Review Review 1 2 SIA ENGINEERING COMPANY Financial Review Financial Highlights The Group posted a net profit of $184.1M
Convenience Retail Asia maintains growth momentum in turnover and profit for first half
 For Immediate Release Convenience Retail Asia maintains growth momentum in turnover and profit for first half Saint Honore integration well underway and synergies being achieved Hong Kong, 2 August 2007
HK GAAP RESULTS RELEASE 12 August 2008 STAR CRUISES GROUP ANNOUNCES FIRST HALF RESULTS FOR 2008
 HK GAAP RESULTS RELEASE 12 August 2008 FOR IMMEDIATE RELEASE INTERNATIONAL STAR CRUISES GROUP ANNOUNCES FIRST HALF RESULTS FOR 2008 The below commentary is prepared based on the comparison of the results
MANAGEMENT DISCUSSION AND ANALYSIS
 MANAGEMENT DISCUSSION AND ANALYSIS COMPANY AND SUBSIDIARIES FINANCIAL STATUS AND PERFORMANCE MINOR INTERNATIOANL PUBLIC COMPANY LIMITED CONSOLIDATED FINANCIAL STATEMENTS AS OF JUNE 2006 1.) Overview In
OPERATING AND FINANCIAL HIGHLIGHTS. Subsequent Events
 Copa Holdings Reports Net Income of US$113.1 Million and EPS of US$2.57 for the First Quarter of 2015 Excluding special items, adjusted net income came in at US$106.0 million, or EPS of US$2.41 per share
Cathay Pacific Airways 2011 Interim Results 10 August 2011
 Cathay Pacific Airways 2011 Interim Results 10 August 2011 1 Interim Result 1H 2011 1H 2010 Group profit HK$2,808m HK$6,840m Group turnover HK$46,791 HK$41,337m Profit margin 6.0% 16.5% Return on capital
Helloworld Travel Limited results announcement Half year ended 31 December 2017
 Helloworld Travel Limited results announcement Half year ended 31 December 2017 HIGHLIGHTS FOR THE HALF YEAR ENDED 31 DECEMBER 2017 Total Transaction Value (TTV) growth of 2.7% to $2.968 billion. Earnings
OPERATING AND FINANCIAL HIGHLIGHTS SUBSEQUENT EVENTS
 Copa Holdings Reports Financial Results for the Third Quarter of 2016 Excluding special items, adjusted net income came in at $55.3 million, or adjusted EPS of $1.30 per share Panama City, Panama --- November
HALF YEAR REPORT February Leighton Holdings Limited
 HALF YEAR REPORT February 2009 PRESENTATION OUTLINE Results highlights Operational update Financial statements Strategy and outlook 2 Half Year Report I 12 February 2009 I RESULTS HIGHLIGHTS 3 Half Year
2017 Results 2018 Half-Yearly Results
 2017 Results 2018 Half-Yearly Results Presentation Presentation 27 July 2018 Agenda Speakers: Robert Wong, Chief Executive & Simon Dixon, Chief Financial Officer 1. 2018 Half-Yearly Highlights 2. Investment
Cathay Pacific Airways
 Cathay Pacific Airways Interim Results for the six months ended 30 th June 2014 13th August 2014 1 Interim Results 1H2014 1H2013 Change Profit attributable to the shareholders of Cathay Pacific HK$ million
Cathay Pacific Airways Interim Results 04 August Cathay Pacific Airways Interim Results 6 August 2008
 Cathay Pacific Airways 2010 Interim Results 04 August 2010 Cathay Pacific Airways 2008 Interim Results 6 August 2008 Interim Result 1H 2010 1H 2009 Group Profit/(Loss) HK$6,840m HK$812m Group Turnover
OPERATING AND FINANCIAL HIGHLIGHTS SUBSEQUENT EVENTS
 Copa Holdings Reports Net Income of US$6.2 Million and EPS of US$0.14 for the Third Quarter of 2015 Excluding special items, adjusted net income came in at $37.4 million, or EPS of $0.85 per share Panama
Q Earnings Financial Results for the First Quarter Ended June 30, July 28, 2016 OMRON Corporation
 Q1 2016 Earnings Financial Results for the First Quarter Ended June 30, 2016 July 28, 2016 OMRON Corporation Summary Q1 Results Both sales and operating income are in line with internal plan (decreased
Analysts Briefing. 18 March Cathay Pacific Airways Limited
 Analysts Briefing 18 March 2015 Cathay Pacific Airways Limited Annual Results 2014 2013 Change Group attributable profit HK$m 3,150 2,620 +20.2% Group turnover HK$m 105,991 100,484 +5.5% Profit margin
Tasty way to reduce cholesterol Analyst Gathering
 Tasty way to reduce cholesterol Analyst Gathering February 2014 Table of Contents BUSINESS OVERVIEW 3 INDICATIVE 2013 RESULTS & 2014 OUTLOOK 12 2 SECTION 1 Business Overview Tasty way to reduce cholesterol
SET Opportunity Day #3/2011
 SET Opportunity Day #3/2011 2Q11 & 1H11 Performance & Outlook 18 August 2011 The views expressed here contain some information derived from publicly available sources that have not been independently verified.
Blackmores Limited Presentation to Goldman Sachs Emerging Companies Conference 15 May 2013
 Blackmores Limited Presentation to Goldman Sachs Emerging Companies Conference 15 May 2013 Welcome Chris Last Chief Financial Officer Blackmores Limited Our Proud Pioneer Heritage Blackmores has been an
OPERATING AND FINANCIAL HIGHLIGHTS
 Copa Holdings Reports Financial Results for the Fourth Quarter of 2015 Excluding special items, adjusted net income came in at $31.7 million, or EPS of $0.73 per share Panama City, Panama --- February
Merrill Lynch Australasia Investment Conference, New York. ASX Code: BSL
 Merrill Lynch Australasia Investment Conference, New York ASX Code: BSL BlueScope Steel A Different Kind of Steel Company Page 2 We focus on total shareholder return - ASX Top 50 total shareholder return
2016 Half-Yearly Results
 Presentation 29th July 2016 2016 Half-Yearly Review Underlying profit down 6% Commercial portfolio benefited from higher occupancy Steady contribution from mainland China residential business Profit attributable
CROWN ANNOUNCES 2010 FULL YEAR RESULTS
 ASX / MEDIA RELEASE FOR IMMEDIATE RELEASE 26 August 2010 CROWN ANNOUNCES 2010 FULL YEAR RESULTS MELBOURNE: Crown Limited (ASX: CWN) today announced its results for the full year ended 30 June 2010: Normalised
Cathay Pacific Airways Analyst Briefing. 21 November 2014
 Cathay Pacific Airways Analyst Briefing 21 November 2014 Operating Performance Passenger demand remains strong, although growth in North America is significantly short of increase in capacity. Demand for
Fact Sheet for Q4 and Full Year 2016 February 2, 2017
 Fact Sheet for Q4 and Full Year 2016 February 2, 2017 Contents Daimler Group Stock Market Information 3 Earnings and Financial Situation 4-13 Information for Divisions Mercedes-Benz Cars 14-17 Daimler
2017 Half-Yearly Results
 2017 Half-Yearly Results Presentation 4th August 2017 Agenda Speakers: Robert Wong, Chief Executive & Simon Dixon, Chief Financial Officer 1. 2017 Half-Yearly Highlights 2. Investment Properties 3. Development
Finnair Q Result
 Finnair Q1 2015 Result 7 May 2015 CEO Pekka Vauramo, Interim CFO Mika Stirkkinen 1 Turbulent market environment The weakness of the Finnish economy continued to be reflected in the demand in the first
Quarterly Meeting# 4/2018
 Quarterly Meeting# 4/2018 3Q18 & 9M18 Performance & Outlook 14 November 2018 1 2016 ERAWAN. All rights reserved. The views expressed here contain some information derived from publicly available sources
OPERATING AND FINANCIAL HIGHLIGHTS. Subsequent Events
 Copa Holdings Reports Net Income of $103.8 million and EPS of $2.45 for the Third Quarter of 2017 Excluding special items, adjusted net income came in at $100.8 million, or EPS of $2.38 per share Panama
Interim Report 6m 2014
 August 11, 2014 Interim Report 6m 2014 Investors and Analysts Conference Call on August 11, 2014 Joachim Müller, CFO Latest ad-hoc release (August 4, 2014) Reduction of forecast, primarily due to a further
H1 FY2013/14 Performance Review
 H1 FY2013/14 Performance Review 1 H1 FY2013/14 Performance Review (Financial) 2 Summary of Group Results 1HFY1314 1HFY1213 Variance $M $M % Revenue 583.3 585.0-0.3 Expenditure 527.1 519.0 + 1.6 Operating
OPERATING AND FINANCIAL HIGHLIGHTS. Subsequent Events
 Copa Holdings Reports Financial Results for the First Quarter of 2016 Excluding special items, adjusted net income came in at US$69.9 million, or EPS of US$1.66 per share Panama City, Panama --- May 5,
HK GAAP RESULTS RELEASE 18 November 2005
 HK GAAP RESULTS RELEASE 18 November 2005 FOR IMMEDIATE RELEASE INTERNATIONAL STAR CRUISES GROUP ANNOUNCES THIRD QUARTER AND FIRST NINE MONTHS RESULTS FOR 2005 Key points for the quarter in comparison with
BANYAN TREE HOLDINGS LIMITED (Company Registration Number: H)
") BANYAN TREE HOLDINGS LIMITED (Company Registration Number: 200003108H) 2 ND QTR RECORDED A SMALLER LOSS OF S7.0 MILLION Highlights: 2Q11: - Revenue increased 3% to S63.6 million; Operating Profit doubled
BANYAN TREE HOLDINGS LIMITED (Company Registration Number: 200003108H) 2 ND QTR RECORDED A SMALLER LOSS OF S7.0 MILLION Highlights: 2Q11: - Revenue increased 3% to S63.6 million; Operating Profit doubled
Minor International Public Company Limited
 Minor International Public Company Limited Management Discussion & Analysis MINT s financial performance as of 30th June 2008 Summary of Key Financial Performance 2Q08 Performance Minor International Public
OPERATING AND FINANCIAL HIGHLIGHTS
 Copa Holdings Reports Net Income of US$18.6 Million and EPS of US$0.42 for the Second Quarter of 2010 Excluding special items, adjusted net income came in at $26.3 million, or $0.60 per share Panama City,
RESULTS RELEASE 20 August GENTING HONG KONG GROUP ANNOUNCES FIRST HALF RESULTS FOR 2015 Highlights
 RESULTS RELEASE 20 August 2015 FOR IMMEDIATE RELEASE INTERNATIONAL GENTING HONG KONG GROUP ANNOUNCES FIRST HALF RESULTS FOR 2015 Highlights The commentary below is prepared based on a comparison of the
Crown Resorts Limited
 Crown Resorts Limited Annual General Meeting 20 October 2016 1 Presentation Outline F16 Year in Review 2 Crown Resorts Limited Group Result F16 Normalised $m F15 Normalised $m Variance F/(U) F16 Actual
Fact Sheet for Q3 and January-September 2017 October 20, 2017
 Fact Sheet for Q3 and January-September 2017 October 20, 2017 Contents Daimler Group Stock Market Information 3 Earnings and Financial Situation 4-12 Information for Divisions Mercedes-Benz Cars 13-16
Not all collagen is the same, it s time to choose the right one Analyst Gathering
 Not all collagen is the same, it s time to choose the right one Analyst Gathering February 2015 Table of Contents MACRO OVERVIEW 3 BUSINESS OVERVIEW 6 INDICATIVE 2014 RESULTS & 2015 OUTLOOK 14 2 Not all
Presentation Results. 4th March 2016
 Presentation 4th March 2016 2015 Review Sound result in 2015 Continued strong performance from commercial portfolio Entry into Shanghai with prime mixed-use site Stable asset values 1 Highlights 2014 2015
Crown Resorts Limited
 Crown Resorts Limited 2016 Half Year Results Presentation 25 February 2016 1 Crown Resorts Limited Results Overview Crown Resorts Limited (Crown) performance: The 2016 First Half results across Crown s
Tat Hong Reports 13% Decline in FY2017 Revenue
 FOR IMMEDIATE RELEASE Registration No: 199105392H Tat Hong Reports 13 Decline in FY2017 Revenue - Cash and cash equivalents of S$114.3 million - Cash flow from operations of S$85.2 million - Net gearing
Copa Holdings Reports Net Income of US$113.9 Million for the Fourth Quarter of 2013
 Copa Holdings Reports Net Income of US$113.9 Million for the Fourth Quarter of 2013 Panama City, Panama --- February 12, 2014. Copa Holdings, S.A. (NYSE: CPA), today announced financial results for the
The Accounting Case Competition for Secondary Schools and Tertiary Institutes. Tertiary Institutes Group
 The Accounting Case Competition for Secondary Schools and Tertiary Institutes 2004 Time allowed 2 hours Answer ALL the questions Marks Section A 50 Section B 20 Section C 15 Section D 15 100 DO NOT OPEN
REPORT OF THE CHAIRMAN AND MANAGING DIRECTOR. Report of the. Chairman and. Managing Director
 Report of the Chairman and Managing Director 10 We have pleasure in reporting to shareholders the Group s results as follows : Year to 31st Year to 31st December 2000 December 1999 HK$ HK$ Turnover 439.6
BANYAN TREE HOLDINGS LIMITED (Company Registration Number: H) 1H07 Results Snapshot (in S$million) : 2Q07 Results Snapshot (in S$million) :
 1H07 Results Snapshot (in S$million) : 2Q07 Results Snapshot (in S$million) :") BANYAN TREE HOLDINGS LIMITED (Company Registration Number: 200003108H) BANYAN TREE S HALF YEAR PROFITS UP 55% ON 23% REVENUE GAIN. Highlights: - 1H07 Revenue increased by 23% to S$187.9 million - 1H07
BANYAN TREE HOLDINGS LIMITED (Company Registration Number: 200003108H) BANYAN TREE S HALF YEAR PROFITS UP 55% ON 23% REVENUE GAIN. Highlights: - 1H07 Revenue increased by 23% to S$187.9 million - 1H07
Fact Sheet for Q and H July 21, 2016
 Fact Sheet for Q2 2016 and H1 2016 July 21, 2016 Contents Daimler Group Stock Market Information 3 Earnings and Financial Situation 4-13 Information for Divisions Mercedes-Benz Cars 14-17 Daimler Trucks
FIRST QUARTER RESULTS 2017
 FIRST QUARTER RESULTS 2017 KEY RESULTS In the 1Q17 Interjet total revenues added $4,421.5 million pesos that represented an increase of 14.8% over the income generated in the 1Q16. In the 1Q17, operating
Summary of Results for the First Quarter of FY2015/3
 Summary of for the First Quarter of FY2015/3 August 8, 2014 Tokyu Corporation (9005) http://www.tokyu.co.jp/ Contents Ⅰ.Executive Summary 2 Ⅱ.Conditions in Each Business 4 Ⅲ.Details of Financial for the
BANYAN TREE HOLDINGS LIMITED (Company Registration Number: H) FY2007 Results Snapshot (in S$million) :
 FY2007 Results Snapshot (in S$million) :") BANYAN TREE HOLDINGS LIMITED (Company Registration Number: 200003108H) FULL YEAR OPERATING PROFITS UP 10% TO S122.5 MILLION Highlights: - FY2007 Revenue up 26% to S421.9 million - 4Q07 Revenue up 33% to
BANYAN TREE HOLDINGS LIMITED (Company Registration Number: 200003108H) FULL YEAR OPERATING PROFITS UP 10% TO S122.5 MILLION Highlights: - FY2007 Revenue up 26% to S421.9 million - 4Q07 Revenue up 33% to
OPERATING AND FINANCIAL HIGHLIGHTS
 Copa Holdings Reports Net Income of US$32.0 Million and EPS of US$0.72 for the Second Quarter of 2012 Excluding special items, adjusted net income came in at $58.6 million, or EPS of $1.32 per share Panama
Copa Holdings Reports Net Income of $49.9 million and EPS of $1.18 for the Second Quarter of 2018
 Copa Holdings Reports Net Income of $49.9 million and EPS of $1.18 for the Second Quarter of 2018 Panama City, Panama --- Aug 8, 2018. Copa Holdings, S.A. (NYSE: CPA), today announced financial results
Quarterly Meeting# 2/2017
 Quarterly Meeting# 2/2017 1Q17 Performance & Outlook 16 May 2017 1 2017 ERAWAN. All rights reserved. The views expressed here contain some information derived from publicly available sources that have
01 Amadeus at a glance
 01 Amadeus at a glance 7 Amadeus Annual Report 2011 1.1 Company s origins and development Most people associate the birth of electronic commerce distribution with the arrival of the internet. In fact,
2017 Pre-Close Analyst Briefing. 5 January 2018 Hong Kong
 2017 Pre-Close Analyst Briefing 5 January 2018 Hong Kong 2 Agenda 2017 Business & Performance - Pre-close Michelle Low, Finance Director Patrick Healy, Managing Director Swire Beverages Q&A 3 2017 Business
Interim Report 3m Bilfinger Berger SE, Mannheim May 10, 2012 Joachim Müller, CFO
 Interim Report 3m 2012 Bilfinger Berger SE, Mannheim May 10, 2012 Joachim Müller, CFO Bilfinger Berger SE Interim report 3m 2012 May 10, 2012 Page 1 3m 2012: Highlights Growth in output volume and orders
FY 2013 Nippon Paint Group Analysts' Meeting for Financial Results of First Half FY 2013
 FY 2013 Nippon Paint Group Analysts' Meeting for Financial Results of First Half FY 2013 November 18, 2013 Nippon Paint Co., Ltd. Disclaimer The forward-looking statements in this document are based on
Passenger services 7,438 10,550 Cargo services 4,405 4,225 Catering and other services Turnover 1 12,275 15,511
 Cathay Pacific Airways Limited - 2003 Interim Results Consolidated Profit and Loss Account - Unaudited Six months ended 30th June 2003 2002 Note Passenger services 7,438 10,550 Cargo services 4,405 4,225
75 Years of Thrills and Entertainment. The Rank Group Plc Preliminary Results to 30 June 2012
 75 Years of Thrills and Entertainment The Rank Group Plc Preliminary Results to 30 June 2012 Agenda Introduction Ian Burke, chairman and chief executive Review of financial results Clive Jennings, finance
Fact Sheet for Q4 and Full Year 2017 pre IFRS 15 and 9 adjustments February 1, 2018
 Fact Sheet for Q4 and Full Year 2017 pre IFRS 15 and 9 adjustments February 1, 2018 Contents Daimler Group Stock Market Information 3 Earnings and Financial Situation 4-12 Information for Divisions Mercedes-Benz
Cathay Pacific Airways
 Cathay Pacific Airways Annual Results for the year ended 31 st December 2011 14 March 2012 1 Annual Result 2011 2010 Change Group attributable profit HK$5,501m HK$14,048m -60.8% Group Turnover HK$98,406m
RTL Group with good start into 2014: solid results, new channel launches and significant US acquisition in first quarter
 RTL Group with good start into 2014: solid results, new channel launches and significant US acquisition in first quarter Revenue remained stable while late Easter effect on the advertising markets and
OCBC BANK TO ACQUIRE WING HANG BANK BY WAY OF VOLUNTARY GENERAL OFFER
 Press Release OCBC BANK TO ACQUIRE WING HANG BANK BY WAY OF VOLUNTARY GENERAL OFFER HK$125 cash offer per share provides opportunity for Wing Hang Bank shareholders to realize their investment at a 49%
JOINTLY ANNOUNCES 2017/18 INTERIM RESULTS * * * RENTAL INCOME SURGES 25% STRENGTHS RECURRING INCOME STREAMS FOR SUSTAINABLE GROWTH
 [For Immediate Release] JOINTLY ANNOUNCES 2017/18 INTERIM RESULTS * * * RENTAL INCOME SURGES 25% STRENGTHS RECURRING INCOME STREAMS FOR SUSTAINABLE GROWTH (Hong Kong, 23 November, 2017) Emperor International
Finnair Q Result
 Finnair Q2 2015 Result 14 August 2015 CEO Pekka Vauramo, Interim CFO Mika Stirkkinen 1 Market environment shows signs of improvement There were signs of a recovery in the demand for consumer and business
Presentation on Results for the 2nd Quarter FY Idemitsu Kosan Co.,Ltd. November 14, 2018
 Presentation on Results for the 2nd Quarter FY 2018 Idemitsu Kosan Co.,Ltd. November 14, 2018 Table of Contents 1. FY 2018 2nd Quarter Financials (1) Overview (2) Segment Information 2. Reference Materials
2005 INTERIM ANNOUNCEMENT
 (Stock Code: 78) 2005 INTERIM ANNOUNCEMENT FINANCIAL HIGHLIGHTS Six months ended 30th June, 2005 (Unaudited) HK$ M Six months ended 30th June, 2004 (Unaudited and restated) HK$ M % Change Turnover 542.4
FIRST QUARTER OPERATING PROFIT RISES TO $281 MILLION
 27 July 2017 Page 1 of 5 No. 03/17 27 July 2017 FIRST QUARTER OPERATING PROFIT RISES TO $281 MILLION Revenue improvement seen for all SIA Group airlines, but pressure on yields remains Earnings supported
CENTURION CORP ACHIEVES RECORD NET PROFIT OF S$31.1 MILLION FROM ITS CORE BUSINESS OPERATIONS FOR FY2014
 PRESS RELEASE For Immediate Release CENTURION CORP ACHIEVES RECORD NET PROFIT OF S$31.1 MILLION FROM ITS CORE BUSINESS OPERATIONS FOR FY2014 Highest ever revenue of S$84.4 million for FY2014 63% growth
Positive rental reversions in Hong Kong portfolio. Rising contribution from Singapore office portfolio. Strong performance from Residential business
 2012 Review The Group performed well in 2012 Positive rental reversions in Hong Kong portfolio Rising contribution from Singapore office portfolio Strong performance from Residential business 2 Highlights
FY RESULTS ROADSHOW PRESENTATION
 1 FY RESULTS 2014 ROADSHOW PRESENTATION FY 2014 HIGHLIGHTS FOCUS ON EXECUTION 2 Strong financial performance Revenues: 61 bn, +5% vs. 2013 EBIT* before one off: 4.1 bn, +15% vs. 2013 EPS: 2.99, +61% vs.
2008 INTERIM ANNOUNCEMENT
 (Stock Code: 78) 2008 INTERIM ANNOUNCEMENT FINANCIAL HIGHLIGHTS Six months ended 30th June, 2008 (Unaudited) Six months ended 30th June, 2007 (Unaudited) HK$ M HK$ M Revenue 750.8 622.0 Operating profit
Q Earnings Financial Results for the Third Quarter Ended December 31, January 28, 2016 OMRON Corporation
 Q3 2015 Earnings Financial Results for the Third Quarter Ended December 31, 2015 January 28, 2016 OMRON Corporation Summary FY15 Q1-Q3 Results Sales remained flat while operating income decreased, Y/Y.
Yongnam Holdings Limited
 Yongnam Holdings Limited FY2008 Results Presentation February 27, 2009 Contents Our Business Corporate Updates FY2008 Financial Performance Prospects and Market Outlook Growth Strategies and Plans Key
MAINFREIGHT LIMITED FULL YEAR RESULT TO MARCH 2015
 MAINFREIGHT LIMITED FULL YEAR RESULT TO MARCH 2015 Result Summary NET SURPLUS Net surplus after tax and before abnormal items up 7.7% to $83.48 million REVENUE EBITDA Revenue up 6.8% to $2.05 billion Excluding
2011 Hotel investment strategy :
 2011 Hotel investment strategy : What every developer should know New World Hotel 27 Sept, 2011 Presented by: Robert McIntosh, Executive Director, CBRE Hotels, Asia Pacific. SUMMARY Hotel Performance Hotel
Interim Business Report 2017
 April 1, 2017 through September 30, 2017 November 22, 2017 Contents SECTION 1 01 Consolidated Statement of Income 02 Factors Leading to Difference in Consolidated Ordinary Income Compared With Same Period
Amadeus continues strong growth momentum into 2018
 Press release May 4, 2018 Results for the three months Highlights Amadeus continues strong growth momentum into 2018 Competitive gains in both Distribution and IT Solutions powered growth in revenues and
For personal use only
 HELLOWORLD TRAVEL LIMITED RESULTS ANNOUNCEMENT Highlights for the year ended 30 June 2018 Total Transaction Value (TTV) growth of 3.5% to $6.1 billion, underpinned by strong air ticket sales volume growth.
First Half 2013 Results. 16 mai 2013
 First Half 2013 Results 16 mai 2013 26 July 2013 Results Increasing effects of Transform 2015 Highlights of the First Half A difficult global economic environment Transform 2015 plan roll-out on track
Q Earnings Financial Results for the Third Quarter Ended December 31, January 29, 2015 OMRON Corporation
 Q3 2014 Earnings Financial Results for the Third Quarter Ended December 31, 2014 January 29, 2015 OMRON Corporation Contents 1. Summary 2. Q1-Q3 Results P. 2 P. 4 3. Full-Year Forecast P. 13 4. Corporate
2017 Results. Presentation. 9 March 2018
 2017 Results Presentation 9 March 2018 Agenda Speakers: Robert Wong, Chief Executive & Simon Dixon, Chief Financial Officer 1. 2017 Results Highlights 2. Investment Properties 3. Development Properties
Japan Foods 9M2017 earnings up 23.8% due to performance of new brands
 (Company Registration No.: 200722314M) 420 North Bridge Road #02-01 North Bridge Centre Singapore 188727 Tel: (65) 6333 9781 Fax: (65) 6333 9782 Japan Foods 9M2017 earnings up 23.8% due to performance
Year ended December 31, 2012
 Consolidated Earnings Report - Supplementary Information Consolidated Results ( ) 1. Consolidated Financial Highlights 2. Major Sales Sales Volume Data 3. Condensed Consolidated Statements of Income Condensed
2006 INTERIM ANNOUNCEMENT
 (Stock Code: 78) 2006 INTERIM ANNOUNCEMENT FINANCIAL HIGHLIGHTS Six months ended 30th June, 2006 (Unaudited) Six months ended 30th June, 2005 % Change (Unaudited) HK$ M HK$ M Revenue 608.3 542.4 +12.1%
2008 INTERIM RESULTS
 PRESS RELEASE Friday, June 13th 2008 INTERIM RESULTS A very satisfactory winter: - Strong growth in revenue, up 11.2% like-for-like (12.6% as reported) - Faster customer gains, with a net 20,000 new customers
Results Briefing Year ended 30 June 2013
 Ramsay Health Care Limited Results Briefing Year ended 30 June 2013 Christopher Rex, Managing Director 29 August 2013 AGENDA 1. Group Operational and Financial Highlights 2. Segment Operational and Financial