RUNWAY OPERATIONAL QUALITY ASSURANCE
|
|
|
- Amelia Haynes
- 5 years ago
- Views:
Transcription


1 1 RUNWAY OPERATIONAL QUALITY ASSURANCE MELANIE BAKER, DARIC MEGERSA & ALFONSO PANLILIO Sponsors: Dr. George Donohue and Mr. Yimin Zhang
2 Agenda Background Context Problem Statement Need Statement Design Plan Simulation Results Conclusions 2
3 Increase in Demand for Air Travel The top 35 airports in the country are currently predicted to experience a 75% increase in demand by the year Capacity of existing airports will need to be increased to meet future demand Based on the FAA s Capacity Needs in the National Airspace System, many of the top 35 airports are at or nearing their limit on capacity (27 out of 35 airports ) which will lead to an increase in congestion on runways 3 FAA Aerospace Forecasts FY


4 Ways to Increase Capacity 1. The most direct way to increase capacity is by adding more runways This is not feasible due to several factors such as 1. No real estate space 2. Insufficient capital 2. An alternative way to increase capacity of existing runways is to reduce separation between aircrafts LGA(La Guardia ) SFO(San Francisco Int.)


5 Arrival/Landing Process The arrival event is when aircrafts are close to each other and are flying at high speeds. This is when bottlenecks occur with the expected increase in capacity. Runway occupancy time Inter arrival Time 5
6 How Do we measure the Capacity of a Runway? Maximum Throughput Capacity(MTC)- It s a measure of the capacity of a runway. It defines the average movements(both arrival and departure) that can be performed in an hour time. Determining Factors : No simultaneous runway occupancy(sro) Wake-vortex separation distance ATC added buffer (positive means a gap, negative means separation violation) Fleet Mix (Heavy, Large, Medium and Small) Final approach path distance 6
7 Runway Throughput Capacity for Homogeneous Fleet Mix The capacity of the runway to meet SRO (Simultaneous Runway Occupancy) runway determined by ROT (runway occupancy time) MTC= 3600sec/ ROT i where i= 1 to n SRO (Simultaneous runway occupancy)- an aircraft cannot land while another aircraft is on the active runway. ROT (Runway Occupancy Time)- is the length of time required for an arriving aircraft to proceed from the runway threshold to a point clear of the runway 7
. MTC=3600/( t ij ) Where t ij= s ij / v j s ij v j 8 http://catsr.ite.gmu.edu/syst460/runwaycapacityworkbook.")
8 Runway Throughput Capacity for Homogeneous Fleet Mix The Runway Throughput for a runway, to meet only the Wake Vortex Separation Rule, for a homogeneous fleet mix, is determined by the time between arriving aircraft at the runway threshold, known as interarrival time (t). MTC=3600/( t ij ) Where t ij= s ij / v j s ij v j 8
9 Runway Throughput Capacity for Homogeneous Fleet Mix For a homogeneous fleet mix to account for the ATC Separation Buffer for maintaining Wake Vortex Separation Distance requirements is determined by the separation distance plus the buffer distance. MTC=3600/( t ij + b ij ) b ij = buffer time added to the Inter arrival time(iat) v i S ij + buffer v j 9
10 Runway Throughput Capacity for Non- Homogeneous Fleet Mix Runway capacity for non-homogeneous fleet mix dependent on the probability of the lead-follow pair. Fleet mix on the runway represented by the probability of each aircraft arriving To meet only the Simultaneous Runway Occupancy (SRO) rule, for a nonhomogeneous fleet mix, MTC= 3600/ [ROT] ROT (in sec) [ROT]= = i (pi *ROT i ) Probability of the lead-follow (of Fleet Mix) 10
11 Runway Throughput Capacity for Non- Homogeneous Fleet Mix The Wake Vortex Separation Rule is determined by: The separation distance between the lead and the follow The groundspeed of the aircraft The probability of a lead-follow pair The inter-arrival time (t ij ) is represented by the Inter-arrival Time Matrix T 11
12 Runway Throughput Capacity for Non- Homogeneous Fleet Mix the Inter-Arrival Time Matrix T, is computed as follows: r=length of the approach path Compression Case- When the lead aircraft is slower than the follow aircraft, the follow aircraft will catch up Separation Cases- When the lead aircraft is faster than the follow aircraft, the follow aircraft drops back from the lead aircraft as they fly constant speed down the approach path to the lead aircraft as they fly constant speed down the approach path. 12
13 Runway Related Safety Risk Simultaneous Runway Occupancy (SRO) Following aircraft reaches runway threshold before leading aircrafts leads the runway Precursor to collisions on a runway Wake Vortex Encounter Could lead to loss of control of following aircraft depending on the strength of wake Based on ICAO standards, collisions should be on the rate of 10-7 to 10-9, since the scope of the project deals with these violations, the acceptable rate should be a couple of magnitudes below the collision rate (10-4 to 10-5 ) 13
14 Runway Occupancy Time (ROT) and Inter Arrival Time (IAT) DTW, Detroit SRO was in [0.0021, ] range of 95% confidence interval with the mean Sample size: 6,832 landings P(SRO)= P(IAT) U P(ROT) Current FAA runway safety regulation: No Simultaneous Runway Occupancy (SRO) allowed A bigger overlap of IAT and ROT implies a bigger P{IAT(τ)<ROT} P{IAT(τ)<ROT} gets larger as separation buffer decreases 14 Jeddi, Babak G. A Statistical Analysis of the Aircraft Landing Process. Olney, UK: Journal of Industrial and Systems Engineering, Fall PDF.
15 Tradeoff between safety and throughput Runway related safety sacrificed as throughput grows 15 Jeddi, Babak G. A Statistical Analysis of the Aircraft Landing Process. Olney, UK: Journal of Industrial and Systems Engineering, Fall PDF.
16 FAA efforts to increase capacity Next Generation Air Transportation System (NextGen) New national airspace system which will be implemented across the US in stages between Proposes to implement satellite-based system to improve air traffic control system Automatic dependent surveillance-broadcast(ads-b) Surveillance technology part of NextGen which allows the precise position of an aircraft to be monitored using GPS Allows aircraft to be sequenced precisely to avoid conflicts and to be more closely spaced in the airport vicinity 16
17 FAA efforts to increase capacity Next Generation Air Transportation System (NextGen) New national airspace system which will be implemented across the US in stages between Proposes to implement satellite-based system to improve air traffic control system Automatic dependent surveillance-broadcast(ads-b) Surveillance technology part of NextGen which allows the precise position of an aircraft to be monitored using GPS Allows aircraft to be sequenced precisely to avoid conflicts and to be more closely spaced in the airport vicinity
18 Stakeholder Analysis Primary Stakeholders Contribution to the terminal airspace ROQA system contribution FAA Rules and regulation to measure safety Maintaining level of safety Pilots Safe takeoff and landing within the airport airspace Increase the level of safe movements on the runway ATC Monitoring safety(separation) Improve performance level Airport Owns the runways Increase aircraft movements (Increase profit) 18 Airlines Provide air transportation service Minimize delay Maximize Profit
19 Problem Statement The future utilization of runways to meet the growing demand for air transportation has a risk which is a probability of loss of safety. NextGen plans to enable high density operations with reduced separation (IAT) between successive flights and reduced runway occupancy times (ROT) Separation between flights and runway occupancy will remain a stochastic process 19
20 Need Statement A tool is needed to monitor stochasticity of arrival process (IAT, ROT, SRO, Wake Vortex Encounters) and to show how changing parameters (IAT, ROT) affect safety and throughput 20
21 Design Alternatives Changing the ROT distribution by reducing its standard deviation Changing the IAT distribution variance by reducing the ATC buffer standard deviation Changing the IAT distribution mean by reducing the ATC buffer mean Changing both the IAT distribution mean and variance 21
22 ROQA Mission Requirements The system shall have compatibility with airport surveillance devices such as ASDE-x(Airport Surface Detection Equipment) and AMASS(Airport Movement Area Safety System) The system shall take inputs from surveillance data (IAT, ROT, Speed) The system shall provide a report which would include the runway related risk (% SRO + wake vortex encounters) and throughput (arrivals per hour) The system shall operate within 3-8 miles of runways (FAF) Based on National Airspace System Requirements Specification (NAS- SR-1000) The system shall have a mean-time between failures (MTBF) of more than 2190 hours The system shall be 99.9 % available 24/7 under any weather conditions The ROQA system shall not require more than 30 minutes mean time to repair (MTTR) 22
23 ROQA System Design FAA standards and Regulations (SRO and ATC buffer) Aircraft speed, ROT, IAT Fleet Mix ROQA %SRO + %Sep. Violation Runway Throughput Surveillance data 23


24 ROQA Implementation FAA standards Aircraft speed, ROT, IAT Fleet Mix Inputs to the system Analysis and computation 24 Surveillance data %SRO +%Sep % #/hr % #/hr % #/hr Throughput Distribution and output data Results
25 Runway Quality Assurance Report Users Objective Display FAA (ATO) The primary service of the Air Traffic Organization is to move air traffic safely and efficiently Airport Managers The main objective of the airport manager is to ensure the safe and efficient operation of the runway on a daily basis 25
26 Runway Quality Assurance Report Users Objective Display ATC supervisors Responsible for the coordination and facilitation of the inbound movement of airplane Airline Operation Managers Main objective is to look after both air traffic and ground operations control 26
27 ROQA prototype/java Simulation Purpose Simulation of the approach and landing process to show how ROT and ATC buffers affect the number of separation violations and SRO violations that occur on the runway To find out which parameters impact spacing between aircrafts the most To test different alternatives and compare it with historical data (such as DTW, Detroit) in order to see the variation. Boundaries/Scope The system operates within FAF of runways Model Assumptions Single runway Only Arrival process Normal dist. ATC buffer, Airplane speed & ROT 27
28 28
29 ROQA prototype/java Simulation Functions Generate arrival flights Assign Approach Speed, ROT, and Sep. Distance Fly Planes Calculate Throughput & SRO/Sep Violations Steps: 1. Generate a random string of arrival flights (H,L,M,S) 2. Assign an approach speed and ROT (normal dist. with average, std. dev. = 5) to each flight (speed: S=90 knots, M=110 knots, L=130 knots, H=150 knots) (ROT: S=50, M=55, L=60, H=70) 3. Assign separation distance between lead- follow pair of flights based on Sep. Dist. Table due to wake vortex and include ATC buffer 4. Fly airplanes (generate trajectory) and compare between lead/follow to decide if sep. violation and SRO violation occurred 5. Calculate throughput (planes per hour)
30 Simulation: Arrival Process (Final Approach Fix) 30
31 Simulation Functions and Equations 31 Equations Distance to Runway Dist(t) = Dist(t-1) (Ground Speed * Time) Approach Speed to Ground Speed Ground speed = cos(glide Angle) x Approach Speed NM/Hr to NM/Sec NM/Sec = NM/Hr * Compression/Expansion Case (3600*(RunwayLen+followSep/followSpeed RunwayLen/leadSpeed)) H-HLSM L-LMS M-MS S-S (3600*(followSep*1)/followSpeed) Compression Time RunwayLen * (followspeed-leadspeed) * 3600
32 Results (Change in Std.dev) 1,000,000 Flights RESULTS ATC Buffer % (SRO+Wake vortex encounter) Throughput Mean(sec) Std.dev(sec) 10 1,000,000 Flights ROT * * * % (SRO+ Wake vortex encounter) Throughput 32 Mean(sec) Std.dev(sec) * * *
33 Sensitivity Analysis 1.00E-06 Safety vs. Change in ATC Buffer Std Deviation 1.00E-06 Safety vs. Change in ROT Std Deviation Acceptable safety 1.00E-05 Safety (% SRO + % Sep. Violation) 1.00E E-05 Safety (% SRO + % Sep. Violation) 1.00E E Std Deviation of ATC Buffer (seconds) 1.00E Std Deviation of ROT (seconds) 33 Increase in the standard deviation of the ATC buffer to 7.5 would lead to violation of safety from the acceptable safety level The change in standard deviation for ROT did also affect safety, however not as much as changing the standard deviation of the ATC buffer.
34 Results (Change in Mean) 100,000 flights RESULTS ATC Buffer %(SRO +Sep Violation) Throughput Mean(sec) Std.dev(sec) * * * *
35 Sensitivity Analysis 1.00E-06 Mean ATC Buffer= 12.5 Safety vs. Throughput 1.00E-05 Mean ATC Buffer = E-04 Safety (% SRO + Wake Turbulence Encounter) 1.00E-03 Mean ATC Buffer = E-02 Mean ATC Buffer = E Throughput (Aircrafts per hour) 37 Mean ATC Buffer = 2.5 Decreasing the mean to 7.5, 5 and 2.5 showed a big change as the capacity was increased but safety was sacrificed. Decreasing the mean to 2.5 decreased the safety level to well below the acceptable rate of 10-4.
36 Verification The ROQA simulation and a study done by CATSR have shown that there is an inverse relationship of throughput and safety. The results differ in the way they were obtained. ROQA simulation measured SRO and Wake vortex encounters. 36 Jeddi, Babak G. A Statistical Analysis of the Aircraft Landing Process. Olney, UK: Journal of Industrial and Systems Engineering, Fall PDF.
37 Results (Change in Mean and StdDev of ATC Buffer) 100,000 flights RESULTS ATC Buffer %(SRO +Sep Violation) Throughput Mean(sec) Std.dev(sec) * * * *
38 1.00E-06 Current Technology - Safety vs. Throughput (ATC Buffer Std dev 5) Mean ATC Buffer= E E-04 Safety (% SRO + Wake Turbulence Encounter) 1.00E E-02 Mean ATC Buffer = 10 Mean ATC Buffer = 7.5 Mean ATC Buffer = 5 Expon. (TrendLine) Linear (Acceptable Safety) 1.00E Throughput (Aircrafts per hour) Mean ATC Buffer = 2.5 y = 1E-30e x R² = E-06 NextGen - Safety vs. Throughput (ATC Buffer Std dev 2.5) Mean ATC Buffer= E E-04 Safety (% SRO + Wake Turbulence Encounter) 1.00E-03 Mean ATC Buffer = 10 Mean ATC Buffer = 7.5 Mean ATC Buffer = 5 Mean ATC Buffer = 2.5 TrendLine Acceptable Safety 1.00E-02 Expon. (TrendLine) 1.00E Throughput (Aircrafts per hour) 38 Reduction in the ATC Buffer Stddev from 5 to 2.5 reduced the rate of runway risk as the ATC buffer mean was increased Linear (Acceptable Safety) y = 9E-18e x R² =
39 Conclusions ATC buffer mean affects throughput and SRO/ WV encounters Throughput is not affected by standard deviation of ATC buffer or ROT (within range examined) SRO & Separation decreases as standard deviation decreases IAT dominates capacity (IAT > ROT) To reduce variance, we need NextGen ADS-B To reduce mean, we need new separation standards or new ATC buffer- This is a change in procedures (no technology required) The only way to increase capacity while maintaining proper safety is to reduce the variance of IAT and ROT first, then reduce the mean of IAT. 39
40 Conclusions 40 To increase capacity 1. Reduce ATC buffer and ROT variance (ADS-B) 2. Reduce ATC buffer mean
41 Future work Increase the number of simulation runs to get a more accurate safety level when changing parameters Add a runway class so we could have multiple runways that intersect or are parallel to represent busier airports like ATL Study other airport fleet mixes & runway approach paths to see how changing those variables changes the safety level 41

42 42
43 43
44 Simulation: Class Diagram Driver trajarray4lead:arraylist() trajarray4follow:arraylist() lead:aircraft follow:aircraft current:aircraft numaircraft:double airtype:string comp:double exp:double atcbuffer:int ntype:double type,speed,rot,sep:random main() Aircraft type:string speed:int rot:int sep:double iat:double next:aircraft prev:aircraft Trajectory:t getnext():aircraft setnext(aircraft):void getprev():aircraft setprev(aircraft):void setsep(double):void setiat(double):void fly(int):arraylist Trajectory altitude:double = 1584 dist2run:double = 6 glideangle:int = 3 time:int = 0 speed:int T t = ArrayList(100) app2grd(int):double k2nmps(double):double gettraj():arraylist Creates a linked list on n# aircrafts and then compares Trajectory between lead/follow Aircraft to determine if sep violation or SRO has occurred Creates an aircraft with a type ( H, L, M, S ), speed (knots), runway occupancy time (sec) Aircraft Landing/Approach to runway threshold
45 Agenda Background What is ROQA? Context Stakeholder Analysis Problem Statement Need Statement Design Plan Project Plan and Budget 45

46 46 WBS

47 47 Schedule

48 Budget (Earned Value and Planed Value ) Task Name Planned Value - PV Earned Value - EV (BCWS) (BCWP) ROQA $70,008 $64,769 Management $15,649 $13,206 Research $27,949 $27,949 Design $1,944 $1,944 Analysis $19,842 $17,047 Final Report $4,622 $4,622 48
49 Cost Earned value(cont.) Earned Value Over Time Report Earned Value Planned Value Week 1 Week 2 Week 3 Week 4 Week 5 Week 6 Week 7 Week 8 Week 9 Week 10 Week 11 Q3 Q4 Q
50 CPI and SPI CPI SPI Activities
51 Project Risk Risk: Not getting simulation completed(coding) by the due date Encountering difficulties processing arrival data Coding and debugging simulation Contingency plan: Allocate more time for completing simulation by due date Risk Not getting enough time to run simulation to 10^6 Contingency Plan: Use multiple computers to get the desired number of runs. 51
52 ATC Manager Display Maintaining Safety but throughput is not maximized Desired Region Max Throughput while maintaining proper safety Undesired Region Safety is below acceptable rate and throughput is not maximized Maximize throughput but safety is below acceptable rate 52
53 References 53 [1] The Economic Impact of Civil Aviation on the U.S. Economy [2] FAA Aerospace Forecasts FY /media/2012%20FAA%20Aerospace%20Forecast.pdf [3] FAA runway safety statistics [4] FAA Annual Safety Report pdf [5] RITA BTS Airline Traffic Statistics [6] FAA Order [7] Statistical Analysis of the Aircraft Landing Process [8] General Aviation Fatal Accident Rate n_fatal_accident_rate.pdf [9] ASDE-X Fact Sheet
54 References s/gaswp05/summerly/home.html p2005/atag_socialbenefitsairtransport.pdf Thompson.pdf 54
55 Gap (Demand vs Safety) 300 Demand vs Safety 250 Safety 200 Gap Current standards 50 2,250,000 2,350,000 2,450,000 2,550,000 2,650,000 2,750,000 Demand (Departures) 55
56 Compare Trajectories (Large/Large) Lead: Ground Speed = 130, ROT = 60sec Time Distance to Runway Follow: Ground Speed = 130, ROT = 60sec Time Distance to Runway
57 Arrival Trajectories (Large/Large) Generate occupancy time=time t + ROT Arrival Event occurs at time (t) t in sec No LS(t) = 1 Yes Increase LP (t) Arrival Event t - Arrival time ROT runway occupancy time s t separation time between aircraft (required by the FAA ) LP (t) - the number of aircrafts in waiting to land LS (t) the number of aircrafts on the runway A - Arrival event to runway 57 Generate Separation Time t + s t Collect data and start arrival process again

58 58 ASDE_X block diagram
59 59 ATC
 Action of a pilot that violates any Federal Aviation Regulation Vehicle/Pedestrian Deviation (V/PD Pedestrian or vehicles entering any portion of the airport movement area")
60 Runway Incursions Incursion type Operational Errors on (OE/D) Action of an air traffic controller that results in less than required minimum separation between two or between two or more aircraft Pilot Deviations (PD) Action of a pilot that violates any Federal Aviation Regulation Vehicle/Pedestrian Deviation (V/PD Pedestrian or vehicles entering any portion of the airport movement area without authorization 60 Only consider Operational Errors and Pilot Deviations news/publications/media/annual_runway_sa fety_report_2010.pdf
61 Pilot ATC interaction Arrival process ATC will provide the pilot on an IFR clearance with separation from other IFR traffic. This separation is provided: 1. Vertically by assignment of different altitudes. 2. Longitudinally by controlling time separation between aircraft on the same course. 3. Laterally by assignment of different flight paths. 4. By radar including all of the above. There is delay because transmissions are not instant A buffer space is added to make up for this = loss in capacity 61

62 Wake Vortex Vortex that forms behind an aircrafts wings as it passes through the air Caused by the air pressure at the top of the wing and at the bottom of the wing meeting at the tip which forms a vortex effect 62
63 Runway Separation Violation Simulation How often do airplane violations occur? 1000 ft 500 ft 100 ft 63

64 Wake Vortex Separation Minima Separation The circulation strength and duration of the wake vortex largely depends on the size of the leading and following aircraft Larger aircrafts produce stronger vortices Separation between aircraft depends on the size of the leading and trailing aircraft Decay Factors Atmospheric turbulence Viscous interactions Buoyancy Vortex Instability _Jeddi_Header.pdf The table above shows the minimum separation based on the size of the aircraft edesign/documentation/dei_statement/vol_2/media/fig_1_04_aircraftseparation.pdf
65 Who benefits from ROQA? FAA ATO( Air traffic Organization)---safety Office of Airport Safety and Standards airport safety Airports capacity on the runway Improved Runway and Safety design to reduce ROT based on the out put from the system Airlines Increase capacity is an increase in revenue 65
Federal Aviation Safety Officer Office of safety and standards")


66 Stakeholder Interactions with ROQA FAA ATO(Air Traffic Organization ) (ASO)Federal Aviation Safety Officer Office of safety and standards Regulations to keep the runway safe Primary users of the runway Runway control movements on the runway ATC ROQA Provide the service of landing and takeoff AIRPORT Enable to increase aircraft movements on the runway 66 Pilots Use the runway Work for the airlines Airlines (Flight operations)
67 FAA Money Flow FAA Air Traffic Organization(ATO) Secure and efficient air traffic management services and aeronautical information 67 Congress Aviation taxes Airport and Airway Trust Fund (AATF) Users(passe ngers) En Route and Oceanic Services System Operations Services Technical Operations Services Terminal Services Safety and Technical Training Manage aircraft at the highest levels over the U.S. and far out into the Atlantic and Pacific oceans Provides a safe, secure and efficient customerfocused air transportation system Supports the delivery and efficient flight services to customers Deployment of Terminal s automation, surveillance and facilities projects Safety on the runway
68 FAA Operations FAA Provide safe and effective lifecycle management of the NAS 68 Air Traffic Organization(ATO) Federal Aviation Safety Officer (ASO) Office of Airport Safety and Standards Terminal Services Safety and Technical Training Primary responsibility for all airport program matters related to standards for airport design, construction, maintenance, operations, safety ATC Facilities Safety & Operations Support Safety on the runway Source: faa.gov
69 ASDE-X Data Airport Surface Detection Equipment, Model X Runway-safety tool that is used by ATC Uses surface movement radar and multilateration sensors to track movement of aircraft on and within 30 to 40 miles of an airport [9] Obtains identification information of aircraft using transponders Updates every second 69
70 jpg?uri=semmo.net Prototype Design Scheduled Arrival ASDEX ATC Buffer ATC Pilot Loop FAA Reg. IAT ROT Risk (prob. Of accident) Flights per hour
71 Pilot-ATC control loop Represents the response time delay between the pilot and ATC interactions 71
72 Earned value Task Name Planned Value - PV (BCWS) Earned Value - EV (BCWP) CPI BAC EAC ROQA $48, $38, $133, $136, Management $5, $5, $14, $16, Research $30, $25, $30, $30, Design $1, $ $14, $14, Modeling $1, $ $37, $30, Analysis $6, $3, $31, $31, Final Report $2, $2, $4, $4, CPI cost performance index EAC- estimate at completion 72
73 73 Network Diagram
74 Problem Statement The IAT of an aircraft to a runway is currently measured as discrete event but it needs to be measured as a stochastic distribution. The FAA has employed measures to reduce runway incursions but as of right now there are no statistical methods that properly measure the safety and flow of aircraft on a runway in real time. With an increase in demand for air transportation comes a demand to decrease IAT distributions and maintain safety probabilities. FAA regulations on runway capacity and runway occupancy stand in the way of increasing a runway s capacity. A proper methodology for estimating safety probability and flow can be used to increase capacity of a system while maintaining runway safety. 74
75 Hypothesis Current standards used for landing could be improved to have a higher aircraft throughput while maintaining proper safety because separation standards set by the FAA are based on old radar technology Possible variables to change Runway Occupancy Time (ROT) FAA separation standards 75
76 Decrease in Safety 51% of fatal aviation accidents occur during the initial approach, final approach, and landing phases Safety data taken from FAA runway safety statistics
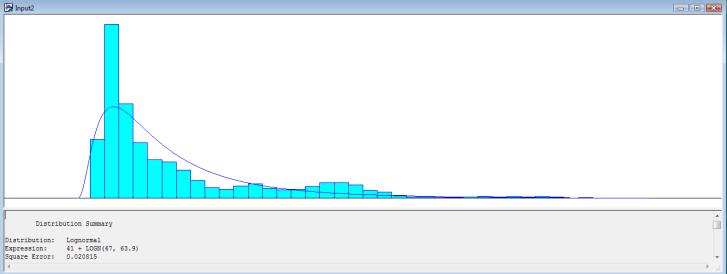
77 Arrival Process(cont.) Event Inter Arrival Time (IAT) Inter Arrival Time of aircraft to final approach fix Detroit Metropolitan Wayne County, 2007 PDF Landing Time interval (LTI) Interval between successive aircrafts at a runway threshold Based on the current separation standards Homogeneous fleet mix Detroit Metropolitan Wayne County, 2007 Runway Occupancy Time (ROT) It is the length of time required for an arriving aircraft to proceed from the runway threshold to a point clear of the runway Detroit Metropolitan Wayne County, 2007 N = 1623 Range [39, 233] Mean 102 Std 32 P =.72 CI = 76%c Bimodal due to mix of small and large aircraft N = 1098 Mean = 47 Std = 9.3s CI = 95% 77
78 What is ROQA? Runway Operational Quality Assurance Stochastic data collection and analysis system which could be used by FAA and Air Traffic Control(ATC) ROQA would receive surveillance data and compute it to provide FAA ATC with stochastic metric for runway performance 78

79 79 Class Diagram

80 80 Preliminary Results
RUNWAY OPERATIONS: Computing Runway Arrival Capacity
 RUNWAY OPERATIONS: Computing Runway Arrival Capacity SYST 560/460 USE Runway Capacity Spreadsheet Fall 2008 Lance Sherry 1 CENTER FOR AIR TRANSPORTATION SYSTEMS RESEARCH Background Air Transportation System
Application of TOPAZ and Other Statistical Methods to Proposed USA ConOps for Reduced Wake Vortex Separation
 Application of TOPAZ and Other Statistical Methods to Proposed USA ConOps for Reduced Wake Vorte Separation G. L. Donohue, J. F. Shortle, Yue Xie Wakenet2-Europe November 11, 2003 Dept. of Systems Engineering
Analysis of Air Transportation Systems. Airport Capacity
 Analysis of Air Transportation Systems Airport Capacity Dr. Antonio A. Trani Associate Professor of Civil and Environmental Engineering Virginia Polytechnic Institute and State University Fall 2002 Virginia
Proceedings of the 2005 Systems and Information Engineering Design Symposium Ellen J. Bass, ed. RUNWAY OPERATIONAL QUALITY ASSURANCE (ROQA) SYSTEM
 SYSTEM") Proceedings of the 05 Systems and Information Engineering Design Symposium Ellen J. Bass, ed. RUNWAY OPERATIONAL QUALITY ASSURANCE (ROQA) SYSTEM Janet Geldermann Yusuf Mohamed Robert Smith Mahmoud Yessad
Proceedings of the 05 Systems and Information Engineering Design Symposium Ellen J. Bass, ed. RUNWAY OPERATIONAL QUALITY ASSURANCE (ROQA) SYSTEM Janet Geldermann Yusuf Mohamed Robert Smith Mahmoud Yessad
Surveillance and Broadcast Services
 Surveillance and Broadcast Services Benefits Analysis Overview August 2007 Final Investment Decision Baseline January 3, 2012 Program Status: Investment Decisions September 9, 2005 initial investment decision:
Federal Aviation Administration Flight Plan Presented at the Canadian Aviation Safety Seminar April 20, 2004
 Federal Aviation Administration Flight Plan 2004-2008 Presented at the Canadian Aviation Safety Seminar April 20, 2004 Challenges Reducing an Already Low Commercial Accident Rate Building an Air Traffic
Airfield Capacity Prof. Amedeo Odoni
 Airfield Capacity Prof. Amedeo Odoni Istanbul Technical University Air Transportation Management M.Sc. Program Air Transportation Systems and Infrastructure Module 10 May 27, 2015 Airfield Capacity Objective:
Analysis of ATM Performance during Equipment Outages
 Analysis of ATM Performance during Equipment Outages Jasenka Rakas and Paul Schonfeld November 14, 2000 National Center of Excellence for Aviation Operations Research Table of Contents Introduction Objectives
USE OF RADAR IN THE APPROACH CONTROL SERVICE
 USE OF RADAR IN THE APPROACH CONTROL SERVICE 1. Introduction The indications presented on the ATS surveillance system named radar may be used to perform the aerodrome, approach and en-route control service:
! Figure 1. Proposed Cargo Ramp at the end of Taxiway Echo.! Assignment 7: Airport Capacity and Geometric Design. Problem 1
 CEE 4674: Airport Planning and Design Spring 2014 Assignment 7: Airport Capacity and Geometric Design Solution Instructor: Trani Problem 1 An airport is designing a new ramp area to accommodate three Boeing
Airspace Complexity Measurement: An Air Traffic Control Simulation Analysis
 Airspace Complexity Measurement: An Air Traffic Control Simulation Analysis Parimal Kopardekar NASA Ames Research Center Albert Schwartz, Sherri Magyarits, and Jessica Rhodes FAA William J. Hughes Technical
Wake Turbulence Research Modeling
 Wake Turbulence Research Modeling John Shortle, Lance Sherry Jianfeng Wang, Yimin Zhang George Mason University C. Doug Swol and Antonio Trani Virginia Tech Introduction This presentation and a companion
Appendix B Ultimate Airport Capacity and Delay Simulation Modeling Analysis
 Appendix B ULTIMATE AIRPORT CAPACITY & DELAY SIMULATION MODELING ANALYSIS B TABLE OF CONTENTS EXHIBITS TABLES B.1 Introduction... 1 B.2 Simulation Modeling Assumption and Methodology... 4 B.2.1 Runway
LARGE HEIGHT DEVIATION ANALYSIS FOR THE WESTERN ATLANTIC ROUTE SYSTEM (WATRS) AIRSPACE CALENDAR YEAR 2016
 AIRSPACE CALENDAR YEAR 2016") International Civil Aviation Organization Seventeenth meeting of the GREPECAS Scrutiny Working Group (GTE/17) Lima, Peru, 30 October to 03 November 2017 GTE/17-WP/07 23/10/17 Agenda Item 4: Large Height
International Civil Aviation Organization Seventeenth meeting of the GREPECAS Scrutiny Working Group (GTE/17) Lima, Peru, 30 October to 03 November 2017 GTE/17-WP/07 23/10/17 Agenda Item 4: Large Height
NextGen Priorities: Multiple Runway Operations & RECAT
 NextGen Priorities: Multiple Runway Operations & RECAT May 2018 Presented by Paul Strande & Jeffrey Tittsworth Federal Aviation Administration National Airspace System Today Air traffic services for the
The SESAR Airport Concept
 Peter Eriksen The SESAR Airport Concept Peter Eriksen EUROCONTROL 1 The Future Airport Operations Concept 1.1 Airports The aim of the future airport concept is to facilitate the safe and efficient movement
Design of a Control Law for an Autonomous Approach and Landing Spacing System
 Design of a Control Law for an Autonomous Approach and Landing Spacing System Lance Sherry, 1 Oleksandra Snisarevska, 2 and John Shortle. 3 Center for Air Transportation Systems Research at George Mason
TWELFTH WORKING PAPER. AN-Conf/12-WP/137. International ICAO. developing RNAV 1.1. efficiency. and terminal In line.
 International Civil Aviation Organization WORKING PAPER 31/10/12 English only TWELFTH AIR NAVIGATION CONFERENCE Montréal, 19 to 30 November 2012 Agenda Item 5: Efficient flight paths through trajectory-based
LFPG / Paris-Charles de Gaulle / CDG
 This page is intended to draw commercial and private pilots attention to the aeronautical context and main threats related to an aerodrome. They have been identified in a collaborative way by the main
Air Transportation Infrastructure and Technology: Do We have Enough and Is this the Problem?
 Air Transportation Infrastructure and Technology: Do We have Enough and Is this the Problem? Dr. George L. Donohue George Mason University 1 April, 2004 NEXTOR-MIT Symposium on the Economic and Social
Interval Management A Brief Overview of the Concept, Benefits, and Spacing Algorithms
 Center for Advanced Aviation System Development Interval Management A Brief Overview of the Concept, Benefits, and Spacing Algorithms Dr. Lesley A. Weitz Principal Systems Engineer The MITRE Corporation,
Aircraft Arrival Sequencing: Creating order from disorder
 Aircraft Arrival Sequencing: Creating order from disorder Sponsor Dr. John Shortle Assistant Professor SEOR Dept, GMU Mentor Dr. Lance Sherry Executive Director CATSR, GMU Group members Vivek Kumar David
Aviation Safety Information Analysis and Sharing ASIAS Overview PA-RAST Meeting March 2016 ASIAS Proprietary Do Not Distribute
 Aviation Safety Information Analysis and Sharing ASIAS Overview PA-RAST Meeting March 2016 ASIAS Proprietary Do Not Distribute Updated: March 2016 2 12 How can safety be improved in an environment of near-zero
ATC-Wake: Integrated Air Traffic Control Wake Vortex Safety and Capacity System
 ATC-Wake: Integrated Air Traffic Control Wake Vortex Safety and Capacity System L.J.P. (Lennaert) Speijker, speijker@nlr.nl WakeNet Europe, 8/9 January 2009 http://www.nlr.nl/public/hosted-sites/atc-wake
Wake Turbulence Standards
 Recategorization of ICAO Wake Turbulence Standards RECAT Phase I Overview Joint FAA/EUROCONTROL Project Three year study (25 meetings) RECAT Team Comprised of worldwide wake turbulence and aviation experts
Space Based ADS-B. ICAO SAT meeting - June 2016 AIREON LLC PROPRIETARY INFORMATION
 Space Based ADS-B ICAO SAT meeting - June 2016 1 Options to Detect an Aircraft Position Position Accuracy / Update Interval Voice Position Reporting ADS-C Position Reporting Radar Surveillance / MLAT Space
The Fourth ATS Coordination meeting of Bay of Bengal, Arabian Sea and Indian Ocean Region (BOBASIO/4) Kolkata, India, September, 2014.
 Kolkata, India, September, 2014.") The Fourth ATS Coordination meeting of Bay of Bengal, Arabian Sea and Indian Ocean Region (BOBASIO/4) Kolkata, India, 22-24 September, 2014. Agenda Item 4: Strategic ATM Plans of Participating States Upper
The Fourth ATS Coordination meeting of Bay of Bengal, Arabian Sea and Indian Ocean Region (BOBASIO/4) Kolkata, India, 22-24 September, 2014. Agenda Item 4: Strategic ATM Plans of Participating States Upper
Federal Aviation Administration Portfolio for Safety Research and Development. Seminar Paul Krois October, 2008
 Portfolio for Safety Research and Development Presented to: By: Date: EUROCONTROL Safety R&D Seminar Paul Krois October, 2008 Introduction The FAA National Aviation Research Plan (NARP) integrates and
Have Descents Really Become More Efficient? Presented by: Dan Howell and Rob Dean Date: 6/29/2017
 Have Descents Really Become More Efficient? Presented by: Dan Howell and Rob Dean Date: 6/29/2017 Outline Introduction Airport Initiative Categories Methodology Results Comparison with NextGen Performance
ART Workshop Airport Capacity
 ART Workshop Airport Capacity Airport Research Bob Graham Head of Airport Research 21 st September 2016 Madrid Expectations The issues and opportunities for future research New solutions / directions for
Analysis of Operational Impacts of Continuous Descent Arrivals (CDA) using runwaysimulator
 using runwaysimulator") Analysis of Operational Impacts of Continuous Descent Arrivals (CDA) using runwaysimulator Camille Shiotsuki Dr. Gene C. Lin Ed Hahn December 5, 2007 Outline Background Objective and Scope Study Approach
Analysis of Operational Impacts of Continuous Descent Arrivals (CDA) using runwaysimulator Camille Shiotsuki Dr. Gene C. Lin Ed Hahn December 5, 2007 Outline Background Objective and Scope Study Approach
CHAPTER 5 SEPARATION METHODS AND MINIMA
 CHAPTER 5 SEPARATION METHODS AND MINIMA 5.1 Provision for the separation of controlled traffic 5.1.1 Vertical or horizontal separation shall be provided: a) between IFR flights in Class D and E airspaces
Application of Wake Turbulence Separation at London Heathrow. Paul Johnson Development Manager NATS Heathrow
 Application of Wake Turbulence Separation at London Heathrow Paul Johnson Development Manager NATS Heathrow Heathrow Vital Statistics Passengers per year 67 Million Aircraft movements per year 470,000
Automated Integration of Arrival and Departure Schedules
 Automated Integration of Arrival and Departure Schedules Topics Concept Overview Benefits Exploration Research Prototype HITL Simulation 1 Lessons Learned Prototype Refinement HITL Simulation 2 Summary
PBN AIRSPACE CONCEPT WORKSHOP. SIDs/STARs/HOLDS. Continuous Descent Operations (CDO) ICAO Doc 9931
 ICAO Doc 9931") International Civil Aviation Organization PBN AIRSPACE CONCEPT WORKSHOP SIDs/STARs/HOLDS Continuous Descent Operations (CDO) ICAO Doc 9931 Design in context Methodology STEPS TFC Where does the traffic
International Civil Aviation Organization PBN AIRSPACE CONCEPT WORKSHOP SIDs/STARs/HOLDS Continuous Descent Operations (CDO) ICAO Doc 9931 Design in context Methodology STEPS TFC Where does the traffic
Ground movement safety systems and procedures - an overview
 Ground movement safety systems and procedures - an overview Thorsten Astheimer, Fraport AG Airside System Development Purpose of Surface Movement Guidance Systems Definition of A-SMGCS Levels (ICAO): 1)
A Network Model to Simulate Airport Surface Operations
 A Network Model to Simulate Airport Surface Operations Project Proposal February 11, 2014 Prepared by: Adel Elessawy Robert Eftekari Yuriy Zhylenko For: Dr. Kathryn Laskey Sponsored by: Dr. Lance Sherry
RNP AR APCH Approvals: An Operator s Perspective
 RNP AR APCH Approvals: An Operator s Perspective Presented to: ICAO Introduction to Performance Based Navigation Seminar The statements contained herein are based on good faith assumptions and provided
Air Navigation Bureau ICAO Headquarters, Montreal
 Performance Based Navigation Introduction to PBN Air Navigation Bureau ICAO Headquarters, Montreal 1 Performance Based Navigation Aviation Challenges Navigation in Context Transition to PBN Implementation
Session III Issues for the Future of ATM
 NEXTOR Annual Research Symposium November 14, 1997 Session III Issues for the Future of ATM Synthesis of a Future ATM Operational Concept Aslaug Haraldsdottir, Boeing ATM Concept Baseline Definition Aslaug
Time-Space Analysis Airport Runway Capacity. Dr. Antonio A. Trani. Fall 2017
 Time-Space Analysis Airport Runway Capacity Dr. Antonio A. Trani CEE 3604 Introduction to Transportation Engineering Fall 2017 Virginia Tech (A.A. Trani) Why Time Space Diagrams? To estimate the following:
AIR/GROUND SIMULATION OF TRAJECTORY-ORIENTED OPERATIONS WITH LIMITED DELEGATION
 AIR/GROUND SIMULATION OF TRAJECTORY-ORIENTED OPERATIONS WITH LIMITED DELEGATION Thomas Prevot Todd Callantine, Jeff Homola, Paul Lee, Joey Mercer San Jose State University NASA Ames Research Center, Moffett
Evaluation of Strategic and Tactical Runway Balancing*
 Evaluation of Strategic and Tactical Runway Balancing* Adan Vela, Lanie Sandberg & Tom Reynolds June 2015 11 th USA/Europe Air Traffic Management Research and Development Seminar (ATM2015) *This work was
Establishing a Risk-Based Separation Standard for Unmanned Aircraft Self Separation
 Establishing a Risk-Based Separation Standard for Unmanned Aircraft Self Separation Roland E. Weibel, Matthew W.M. Edwards, and Caroline S. Fernandes MIT Lincoln laboratory Surveillance Systems Group Ninth
WAKE TURBULENCE SEPARATION MINIMA
 1. Definition WAKE TURBULENCE SEPARATION MINIMA Wake turbulence is turbulence that forms behind an aircraft as it passes through the air, causing wingtip vortices. 2. Radar wake turbulence separation minima
Flight Trials of CDA with Time-Based Metering at Atlanta International Airport
 Flight Trials of CDA with Time-Based Metering at Atlanta International Airport John-Paul Clarke, James Brooks, Liling Ren, Gaurav Nagle, and Evan McClain Georgia Institute of Technology Grady Boyce Delta
IFR SEPARATION WITHOUT RADAR
 1. Introduction IFR SEPARATION WITHOUT RADAR When flying IFR inside controlled airspace, air traffic controllers either providing a service to an aircraft under their control or to another controller s
CAUTION: WAKE TURBULENCE
 CAUTION: WAKE TURBULENCE This was the phrase issued while inbound to land at Boeing Field (BFI) while on a transition training flight. It was early August, late afternoon and the weather was clear, low
Airport capacity effects of RECAT or: An airport view on RECAT
 Airport capacity effects of RECAT or: An airport view on RECAT 21st June 2011, WakeNet-3 Europe RECAT Workshop at TU Berlin S. Wendeberg (FBA-IL2) Fraport AG Seite 2 The best way to anticipate the future
Looking for the Capacity in NGATS
 Looking for the Capacity in NGATS George L. Donohue, John Shortle and B. Jeddi Systems Engineering and Operations Research Center for Air Transportation Systems Research Volgenau School of Information
Integrated Optimization of Arrival, Departure, and Surface Operations
 Integrated Optimization of Arrival, Departure, and Surface Operations Ji MA, Daniel DELAHAYE, Mohammed SBIHI ENAC École Nationale de l Aviation Civile, Toulouse, France Paolo SCALA Amsterdam University
ADS-B via Low Earth Orbiting Satellites Benefits Assessment
 ADS-B via Low Earth Orbiting Satellites Benefits Assessment Jeff Dawson Director, Operational Support NAM/CAR ANI/WG/1 July 2013 Aireon LLC is a joint venture between NAV CANADA and Iridium to finance,
Analysis of Aircraft Separations and Collision Risk Modeling
 Analysis of Aircraft Separations and Collision Risk Modeling Module s 1 Module s 2 Dr. H. D. Sherali C. Smith Dept. of Industrial and Systems Engineering Virginia Polytechnic Institute and State University
IFR SEPARATION USING RADAR
 IFR SEPARATION USING RADAR 1. Introduction When flying IFR inside controlled airspace, air traffic controllers either providing a service to an aircraft under their control or to another controller s traffic,
Worst-case analysis of wake vortex induced risk of 700ft vertical separation. Gerben van Baren
 Worst-case analysis of wake vortex induced risk of 700ft vertical separation Gerben van Baren Contents Incentive Objective Approach Results Conclusions NLR Air Transport Safety Institute 15-1-2009 2 Incentive
The NextGen contribution to the near and mid-term safety. Steve Bradford NextGen Chief Scientist Date: June 12th 2017
 The NextGen contribution to the near and mid-term safety Steve Bradford NextGen Chief Scientist Date: June 12th 2017 NextGen &Safety Focus on four areas where safety is primary focus ª ACAS X ª ASIAS ª
SESAR Solutions. Display Options
 SESAR Solutions Outputs from the SESAR Programme R&I activities which relate to an Operational Improvement (OI) step or a small group of OI steps and its/their associated enablers, which have been designed,
Trajectory Based Operations
 Trajectory Based Operations Far-Term Concept Proposed Trade-Space Activities Environmental Working Group Operations Standing Committee July 29, 2009 Rose.Ashford@nasa.gov Purpose for this Presentation
Measuring the Business of the NAS
 Measuring the Business of the NAS Presented at: Moving Metrics: A Performance Oriented View of the Aviation Infrastructure NEXTOR Conference Pacific Grove, CA Richard Golaszewski 115 West Avenue Jenkintown,
Identifying and Utilizing Precursors
 Flight Safety Foundation European Aviation Safety Seminar Lisbon March 15-17 / 2010 Presented by Michel TREMAUD ( retired, Airbus / Aerotour / Air Martinique, Bureau Veritas ) Identifying and Utilizing
Beijing, 18 h of September 2014 Pierre BACHELIER Head of ATM Programme. Cockpit Initiatives. ATC Global 2014
 Beijing, 18 h of September 2014 Pierre BACHELIER Head of ATM Programme Cockpit Initiatives for ATM ATC Global 2014 Page 2 Cockpit Initiatives for ATM Airbus vision on ATM transformation Airbus position
Using PBN for Terminal and Extended Terminal Operations
 Using PBN for Terminal and Extended Terminal Operations Navigation Performance Data Analysis and its Effect on Route Spacing Dijana Trenevska EUROCONTROL 27 June 2017 Content Background and Objective Data
Benefits Analysis of a Runway Balancing Decision-Support Tool
 Benefits Analysis of a Runway Balancing Decision-Support Tool Adan Vela 27 October 2015 Sponsor: Mike Huffman, FAA Terminal Flight Data Manager (TFDM) Distribution Statement A. Approved for public release;
Chapter 6. Nonradar. Section 1. General DISTANCE
 12/10/15 JO 7110.65W Chapter 6. Nonradar Section 1. General 6 1 1. DISTANCE Use mileage based (DME and/or ATD) procedures and minima only when direct pilot/controller communications are maintained. FIG
National Transportation Safety Board Aviation Incident Final Report
 National Transportation Safety Board Aviation Incident Final Report Location: Los Angeles, CA Incident Number: Date & Time: 08/16/2007, 1257 PDT Registration: Aircraft: Boeing 737-700 Aircraft Damage:
Comparison of Arrival Tracks at Different Airports
 Comparison of Arrival Tracks at Different Airports Yimin Zhang, Ph.D. Student Systems Engineering and Operations Research Center for Air Transportation Systems Research Fairfax, VA yzhangk@gmu.edu John
A Statistical Separation Standard and Risk-Throughput Modeling of the Aircraft Landing Process
 A Statistical Separation Standard and Risk-Throughput Modeling of the Aircraft Landing Process A dissertation submitted in partial fulfillment of the requirements for the degree of Doctor of Philosophy
Wake Vortex R&D. Status Briefing. NBAA Convention. Federal Aviation Administration. By: Steve Lang Date: September 2007
 Wake Vortex R&D Status Briefing NBAA Convention By: Steve Lang Date: September 2007 Topics for Today Wake Turbulence Program Overview Near Term Achievements The Future Wake Program Activities Near-Term
Cockpit Display of Traffic Information (CDTI) Assisted Visual Separation (CAVS)
 Assisted Visual Separation (CAVS)") Cockpit Display of Traffic Information (CDTI) Assisted Visual Separation (CAVS) Randall Bone 6 th USA / Europe ATM 2005 R&D Seminar Baltimore, Maryland June 2005 Overview Background Automatic Dependent
Cockpit Display of Traffic Information (CDTI) Assisted Visual Separation (CAVS) Randall Bone 6 th USA / Europe ATM 2005 R&D Seminar Baltimore, Maryland June 2005 Overview Background Automatic Dependent
Runway Status Lights (RWSL) in Japan. July 2015
 in Japan. July 2015") Ministry of Land, Infrastructure, Transport and Tourism CIVIL AVIATION BUREAU OF JAPAN Runway Status Lights (RWSL) in Japan July 2015 Table of contents Civil Aviation Bureau Japan What is RWSL Background
Ministry of Land, Infrastructure, Transport and Tourism CIVIL AVIATION BUREAU OF JAPAN Runway Status Lights (RWSL) in Japan July 2015 Table of contents Civil Aviation Bureau Japan What is RWSL Background
TWELFTH AIR NAVIGATION CONFERENCE
 International Civil Aviation Organization 19/3/12 WORKING PAPER TWELFTH AIR NAVIGATION CONFERENCE Montréal, 19 to 30 November 2012 (Presented by the Secretariat) EXPLANATORY NOTES ON THE AGENDA ITEMS The
International Civil Aviation Organization CHINA RMA REPORT. (Presented by the China RMA) SUMMARY
 SUMMARY") International Civil Aviation Organization RASMAG/17 WP15 28-31/8/2012 The 17 th Meeting of the Regional Airspace Safety Monitoring Advisory Group (RASMAG/17) Bangkok, Thailand, 28 31 August 2012 Agenda
International Civil Aviation Organization RASMAG/17 WP15 28-31/8/2012 The 17 th Meeting of the Regional Airspace Safety Monitoring Advisory Group (RASMAG/17) Bangkok, Thailand, 28 31 August 2012 Agenda
Quiz 2 - Solution. Problem #1 (50 points) CEE 5614 Fall Date Due: Wednesday November 20, 2013 Instructor: Trani
 CEE 5614 Fall Date Due: Wednesday November 20, 2013 Instructor: Trani") CEE 5614 Fall 2013 Quiz 2 - Solution Date Due: Wednesday November 20, 2013 Instructor: Trani Problem #1 (50 points) The North Atlantic Organized System (OTS) is typically made up of 6 Eastbound Track as
CEE 5614 Fall 2013 Quiz 2 - Solution Date Due: Wednesday November 20, 2013 Instructor: Trani Problem #1 (50 points) The North Atlantic Organized System (OTS) is typically made up of 6 Eastbound Track as
Real-time Simulations to Evaluate the RPAS Integration in Shared Airspace
 Real-time Simulations to Evaluate the RPAS Integration in Shared Airspace (WP-E project ERAINT) E. Pastor M. Pérez-Batlle P. Royo R. Cuadrado C. Barrado 4 th SESAR Innovation Days Universitat Politècnica
Airport Characterization for the Adaptation of Surface Congestion Management Approaches*
 MIT Lincoln Laboratory Partnership for AiR Transportation Noise and Emissions Reduction MIT International Center for Air Transportation Airport Characterization for the Adaptation of Surface Congestion
SULAYMANIYAH INTERNATIONAL AIRPORT MATS CHAPTER 11
 KURDISTAN REGIONAL GOVERNMENT SULAYMANIYAH INTERNATIONAL AIRPORT MATS CHAPTER 11 SEPARATION STANDARDS & APPLICATIONS International and Local Procedures ( First Edition ) April 2012 Ff Prepared By Fakhir.F.
SPADE-2 - Supporting Platform for Airport Decision-making and Efficiency Analysis Phase 2
 - Supporting Platform for Airport Decision-making and Efficiency Analysis Phase 2 2 nd User Group Meeting Overview of the Platform List of Use Cases UC1: Airport Capacity Management UC2: Match Capacity
ADS-B. Not just a mandate! Forrest Colliver Becker Avionics GmbH Becker Avionics GmbH All rights reserved -
 ADS-B Not just a mandate! Forrest Colliver Becker Avionics GmbH 2016 Becker Avionics GmbH All rights reserved - www.becker-avionics.com Automatic Dependent Surveillance Broadcast What are the benefits?
AN-Conf/12-WP/162 TWELFTH THE CONFERENCE. The attached report
 29/11/12 TWELFTH AIR NAVIGATION CONFERENCE Montréal, 19 to 30 November 2012 REPORT OF THE COMMITTEE TO THE CONFERENCE ON AGENDA ITEM 2 The attached report has been approved by thee Committee for submission
CANSO Workshop on Operational Performance. LATCAR, 2016 John Gulding Manager, ATO Performance Analysis Federal Aviation Administration
 CANSO Workshop on Operational Performance LATCAR, 2016 John Gulding Manager, ATO Performance Analysis Federal Aviation Administration Workshop Contents CANSO Guidance on Key Performance Indicators Software
Office of Aviation Safety Analytical Services
 Office of Aviation Safety Analytical Services Discussion on the NASA National Aviation Operational Monitoring Service (NAOMS) Project Presented to: Aeronautics and Space Engineering Board (ASEB) - NAOMS
Air/Ground ATN Implementation Status ATN Seminar, Chiang Mai - 11/14 December
 Air/Ground ATN Implementation Status ATN Seminar, Chiang Mai - 11/14 December 2001 - Mike Murphy ATN Systems, Inc. (ATNSI) 703-412 412-2900, 2900, Mike.Murphy@atnsi.com ATNSI, ATN Seminar 1 Presentation
SECTION 6 - SEPARATION STANDARDS
 SECTION 6 - SEPARATION STANDARDS CHAPTER 1 - PROVISION OF STANDARD SEPARATION 1.1 Standard vertical or horizontal separation shall be provided between: a) All flights in Class A airspace. b) IFR flights
SUMMARY. of the North. Reference: A B
 International Civil Aviation Organization South American Regional Office 10/ /10/17 Twentieth Workshop/Meeting of the SAM Implementation Group (SAM/IG/20) - Regional Project RLA/06/901 (Lima, Peru, 16
Design Airspace (Routes, Approaches and Holds) Module 11 Activity 7. European Airspace Concept Workshops for PBN Implementation
 Module 11 Activity 7. European Airspace Concept Workshops for PBN Implementation") Design Airspace (Routes, Approaches and Holds) Module 11 Activity 7 European Airspace Concept Workshops for PBN Implementation Design in Context TFC Where does the traffic come from? And when? RWY Which
Design Airspace (Routes, Approaches and Holds) Module 11 Activity 7 European Airspace Concept Workshops for PBN Implementation Design in Context TFC Where does the traffic come from? And when? RWY Which
Peter Sorensen Director, Europe Safety, Operations & Infrastructure To represent, lead and serve the airline industry
 Future of ATM Peter Sorensen Director, Europe Safety, Operations & Infrastructure To represent, lead and serve the airline industry 1 1 Air Traffic Management (ATM) Management of aircraft and airspace
Learning Objectives. By the end of this presentation you should understand:
 Designing Routes 1 Learning Objectives By the end of this presentation you should understand: Benefits of RNAV Considerations when designing airspace routes The basic principles behind route spacing The
Developing an Aircraft Weight Database for AEDT
 17-02-01 Recommended Allocation: $250,000 ACRP Staff Comments This problem statement was also submitted last year. TRB AV030 supported the research; however, it was not recommended by the review panel,
American Airlines Next Top Model
 Page 1 of 12 American Airlines Next Top Model Introduction Airlines employ several distinct strategies for the boarding and deboarding of airplanes in an attempt to minimize the time each plane spends
ASPASIA Project. ASPASIA Overall Summary. ASPASIA Project
 ASPASIA Project ASPASIA Overall Summary ASPASIA Project ASPASIA Project ASPASIA (Aeronautical Surveillance and Planning by Advanced ) is an international project co-funded by the European Commission within
Operational Evaluation of a Flight-deck Software Application
 Operational Evaluation of a Flight-deck Software Application Sara R. Wilson National Aeronautics and Space Administration Langley Research Center DATAWorks March 21-22, 2018 Traffic Aware Strategic Aircrew
Continuous Descent? And RNAV Arrivals
 Continuous Descent? And RNAV Arrivals From an ATC Perspective Presentation to: CDA Workshop GA Tech Name: Don Porter RNP Project Lead FAA, RNAV RNP Group Date: 18 April 2006 My Background 22 years Terminal
A Study of Tradeoffs in Airport Coordinated Surface Operations
 A Study of Tradeoffs in Airport Coordinated Surface Operations Ji MA, Daniel DELAHAYE, Mohammed SBIHI ENAC École Nationale de l Aviation Civile, Toulouse, France Paolo SCALA, Miguel MUJICA MOTA Amsterdam
Atlantic Interoperability Initiative to Reduce Emissions AIRE
 ICAO Colloquium on Aviation and Climate Change ICAO ICAO Colloquium Colloquium on Aviation Aviation and and Climate Climate Change Change Atlantic Interoperability Initiative to Reduce Emissions AIRE Célia
Analyzing Risk at the FAA Flight Systems Laboratory
 Analyzing Risk at the FAA Flight Systems Laboratory Presented to: Workshop By: Dr. Richard Greenhaw, FAA AFS-440 Date: 29 November, 2005 Flight Systems Laboratory Who we are How we analyze risk Airbus
Federal Aviation Administration DCA. By: Terry Biggio, Vice President Air Traffic Services Date: June 18, Federal Aviation Administration
 DCA Presented to: Arlington County By: Terry Biggio, Vice President Air Traffic Services Date: June 18, 2015 Air Traffic Roles and Responsibilities As aviation technology advances, the FAA is putting in
30 th Digital Avionics Systems Conference (DASC)
") 1 30 th Digital Avionics Systems Conference (DASC) Next Generation Air Transportation System 2 Equivalent Visual Systems Enhanced Vision Visual Synthetic Vision 3 Flight Deck Interval Management Four Broad
1 30 th Digital Avionics Systems Conference (DASC) Next Generation Air Transportation System 2 Equivalent Visual Systems Enhanced Vision Visual Synthetic Vision 3 Flight Deck Interval Management Four Broad
Future Automation Scenarios
 Future Automation Scenarios Francesca Lucchi University of Bologna Madrid, 05 th March 2018 AUTOPACE Project Close-Out Meeting. 27th of March, 2018, Brussels 1 Future Automation Scenarios: Introduction
Lessons Learnt From The EUROCONTROL Wake Impact Severity Assessment Flight Simulator Campaign
 Lessons Learnt From The EUROCONTROL Wake Impact Severity Assessment Flight Simulator Campaign Vincent Treve (EUROCONTROL) Cpt. Dirk De Winter (Contrator to EUROCONTROL) Content Objectives Experiment setup
Name of Customer Representative: Bruce DeCleene, AFS-400 Division Manager Phone Number:
 Phase I Submission Name of Program: Equivalent Lateral Spacing Operation (ELSO) Name of Program Leader: Dr. Ralf Mayer Phone Number: 703-983-2755 Email: rmayer@mitre.org Postage Address: The MITRE Corporation,