Sensitivity analysis of counter utilization in an airport terminal
|
|
|
- Clarissa Johns
- 5 years ago
- Views:
Transcription
1 Sensitivity analysis of counter utilization in an airport terminal by Simone Cronjé Submitted in partial fulfillment of the requirements for the degree of BACHOLEORS OF INDUSTRIAL ENGINEERING in the FACULTY OF ENGINEERING AND INFORMATION TECHNOLOGY UNIVERSITY OF PRETORIA October 2010
2 Executive Summary Virtual Consultant Engineering is a multi-disciplined organization and was established in Currently they are situated across South Africa with offices in Pretoria, Durban and Cape Town. They have a variety of projects running from Infrastructure maintenance to project management services. For a new project they are developing a design proposal for an upgraded airport at Lanseria. The new design will differ a considerable amount from the current airport. The idea is to develop an airport, which will be able to control the same capacity and even more as O.R. Tambo International. In this project the passenger queue time will be observed using simulation techniques. The influence the number of checkpoints have on the system will be monitored. There are also possibilities of constraints in the process, which is identified and given possible solutions through constraint management. The time it will take a passenger from the terminal to the specific boarding station is calculated. Queuing Theory is used to explain the concept of a system. Time studies is done since it depicts what is actually happening in the system. The model provides passenger flow analysis obtained by using the simulation and generate trends for future references. New methodologies of biometric technology currently being tested on the market is investigated. In the simulation model, these methodologies is implemented to observe the affect it have on the system. Four different processes is used in the project. Sensitivity analysis is done on each of these process to identify the influence the changes in the system parameters have on the process. The utilization of the process counters is compared to the number of counters and the queue time of the passengers. 1
3 Table of Content 1. Introduction and Background Project Aim Project Scope Literature Study Simulation Definition of Simulation Simulation Terminologies Definition of a System Definition of a State Discrete System Continuous System Static Simulation Model Dynamic Simulation Model Deterministic and Stochastic Models Why use Simulation? Advantages of Simulation Disadvantages of Simulation Time Study Definition of Time Study Purpose of Time Studies Queues Definition of a Queue Definition of a Queuing System Definition of Queuing Theory Characteristics of a Queuing Process Input or Arrival Process Output or Service Process Queue Discipline System Capacity Number of Service Channels Determine Peak Periods Methods of Describing Peaking Standard Busy Rate (SBR) Busy Hour Rate (BHR) Typical Peak Hour Passengers (TPHP) Busiest Timetable Hour (BTH) Peak Profile Hour Capacity Planning Approximation of maximum peak period delay Maximum delay in passageways Maximum delay in processing stations Methods to Identify Constraints Goldratt s Theory of Constraints (TOC)
4 4.6.2 Definition of Bottleneck Improvement Methods Queue Improvements Biometrics Technology What is Biometrics? Types of Biometrics Pegase Biodev1 and Visabio IRIS SMARTGATE misense Body Scanner Various Check-In Methods Internet Check-In Remote Check-In SMS Check-In Common Use Systems Kiosk Check-In Simulation Model Domestic process International Process Model Breakdown Arrivals Group Allocation Assigning Baggage Check-in Counter Security Check-point Passport Control Walk to Boarding Stations Stopping the Model Results Domestic Domestic with one flight Domestic with two flights International International with one flight International with two Flights Future Analysis Conclusion References
5 Appendix Domestic 1 Flight Model Domestic 2 Flights Model International 1 Flight Model International 2 Flights Model Domestic 1 Flight Model using Biometric Technology 4
6 List of Figures Figure 1: Illustration of active sectors... 8 Figure 2: Typical distribution of hourly passenger traffic volumes at an air transport airport throughout the year Figure 3: Location of the standard busy rate Figure 4: Five percent busy rate hour Figure 5: The basic steps of the Domestic Process Figure 6: An illustration of how the simulation model is designed for the domestic process Figure 7: The basic steps of the international process Figure 8: An illustration of how the simulation model is designed for the domestic process Figure 9: Creation node used for arrivals Figure 10: Probability of Domestic Arrivals for a single flight Figure 11: Probability of Domestic Arrivals for two flights Figure 12: Probability of International Arrivals for a single flight Figure 13: Probability of International Arrivals for two flights Figure 14: Create node properties Figure 15: Nodes used to allocate groups Figure 16: Probability of Group Size Figure 17: Properties of the assign node Figure 18: Probability of Arriving with or without baggage for Domestic Flight Figure 19: Nodes to assign baggage to group Figure 20: Service time for groups with baggage options Figure 21: Properties of assign node Figure 22: Process node used for service counter Figure 23: Properties of Process Node Figure 24: Nodes used to divide groups Figure 25: Properties of Separate node Figure 26: Nodes used for security check-point
7 Figure 27: Properties of security check-point Figure 28: Process node used for passport control Figure 29: Properties of passport control process Figure 30: A simplified version of the airport layout Figure 31: Process node used for walking to boarding station Figure 32: Process properties for walk to boarding station Figure 33: Properties of nodes used for stopping the model Figure 34 : Domestic one flight Utilization with constant security counters Figure 35: Domestic one flight Utilization with constant check-in counters Figure 36: Domestic 1 Flight: Utilization vs Queue Time Figure 37: Domestic 2 Flights utilization with constant Security Counters Figure 38: Domestic 2 Flights utilization with constant Check-in Counters Figure 39: Domestic 2 Flights Utilization vs Queue Time Figure 40: International one Flight Utilization Figure 41: International 1 Flight Utilization vs Queue Time Figure 42: International two flights Utilization Figure 43: International two flights utilization vs Queue Time Figure 44: Waiting Time Biometric methods vs Normal service counter
8 List of Tables Table 1: FAA Relationships for TPHP Computations from Annual Figures. 21 Table 2: The probability of passenger arrivals..31 Table 3: Probability of Group Size Table 4: Probability of group baggage. 35 Table 5: Service time for groups with baggage options. 36 Table 6: Resources in the system with capacity Table 7: The average walking time from terminal to respective boarding stations Table 8: Capacity of aircrafts.. 42 Table 9: Six Categories of the level of service according to the IATA Manual.44 Table 10: Sensitivity Analysis of Domestic one Flight..45 Table 11: Sensitivity Analysis of Domestic two Flights. 47 Table 12: Sensitivity Analysis International one Flight.. 49 Table 13: Sensitivity Analysis with constant security counters...50 Table 14: Sensitivity Analysis International two Flights...51 Table 15: Sensitivity Analysis with Biometric Methods. 55 7


9 1. Introduction and Background Virtual Consulting Engineering was established in 1999 as a professional project management consultancy under the name Virtual Buro. Over the years the multi disciplinary company has been a leading force as project managers on several projects, which among others includes employment creation, infrastructure maintenance and infrastructure provision programs. As a turn-key service provider, Virtual Consulting Engineers offers clients a complete, inclusive range of consulting engineering and project and program management services. The company is active in various sectors, as illustrated below: Figure 1: Illustration of active sectors Virtual Consultant Engineering is currently developing a design proposal for a new airport for Lanseria. The new design will render a whole new concept of Lanseria, since the airport will be considerably larger than the current airport. The project s aim is increase the capacity and size to be equal or even larger than O.R. Tambo International. 8
10 The new design will consist of a terminal and several piers. Various boarding station will be allocated in the piers. Each pier will consist of two levels, an arrival level and a departure level. The arrival process in the international piers will be divided into South African passport holders and international passport holders. There will be different piers for international and domestic flights, since there is a difference in processing these passengers. The transportation from the terminal to the various piers will be under ground. Different processes are simulated. The two main processes are domestic and international. The simulation is built to simulate the arrivals for one or two flights respectively for each of the main processes. The arrivals occur over a period of two hours. The amount of passengers in the system is equal to the amount of passengers boarding an aircraft. The dwelling time of passengers is not included in the simulation. Dwelling time is used when the area capacity is calculated, which is not included in the project. 9
11 2. Project Aim The aim of the project is to investigate the throughput of the terminal and determine the influence the number of checkpoints have on the system by using simulation techniques. By making the checkpoints the variable in the simulation model, the airport can identify the optimum utilization of the different counters and the influence it have on the queuing time. The bottlenecks of the system are identified and possible solutions suggested. Another requirement for this project is to determine the traveling time from the terminal to a boarding station. Sensitivity analysis is done on the utilization of each type of process counter and the effect it has on the queuing time in the check-in process. 10
12 3. Project Scope There are various aspects to consider in the project. An explanation of Queuing Theory gives an understanding of how a system work in terms of arrivals, services and departures. The peak times in the terminal is determined through time studies. Other new methodologies of biometric technology on decreasing queue lengths that is currently being tested on the market is tested in the simulation. The effect the new methodologies have on the system is investigated. The number of checkpoints is a variable in the simulation; to determine the effect the amount of counters have on the passenger queuing time. The results of the sensitivity analysis is used to indentify constraints in the system. Domestic and International piers should be taken into consideration, since there is a difference between the related processes. Only departures for both domestic and international will be investigated. The project scope does not include a practical implementation. 11
13 4. Literature Study 4.1 Simulation Law, Kelton (1982, p.9) suggests before deciding on the appropriateness of a simulation application, the relevant factors of the problem on hand should be closely examined. This is because in most cases a simulation and analytical approach is equally viable. A simulation model can also be used to verify if the assumptions of the analytical model is valid Definition of Simulation According toe Kelton, Sadowski, Sturrock (2007, p. 1) simulation mimics the behavior of actual systems by using various methods and applications. Simulating a real system, the user can observe any techniques or change in the system before implementing the changes in the actual system. A simulation model can be seen as the testing component in any planning situation Simulation Terminologies Wayne L. Winston (2004, p. 403) defines the basic terminologies for simulations. Because there are large variety of systems and various ways to define each system, terminologies are used to identify and understand the concept of the system. The terminologies are as follow: Definition of a System Each system has to accomplish some kind of end. The system includes both the entities waiting in line and the entities being served. All these entities interact with one another to complete the specific task Definition of a State A system consists of numerous variables that describe the system. These variables are known as the state variables. These variables can apply to the entities of the system and their attributes and resources, and to all the events in system, that is arrivals, departures and the end. 12
14 4.1.5 Discrete System In the system the state variable will only change when an entity arrives and enter the system and when an entity leave the system after the serving process. Winston calls this the discrete or countable point in time Continuous System Were the state variables in a discrete system change over countable points in time, the state variables in a continuous system change continuously over time Static Simulation Model This is a representation of a system at a specific point in time. Monte Carlo simulation models are static models Dynamic Simulation Model This is a representation of a system as it evolves over a period of time Deterministic and Stochastic Models Kelton, Sadowski, Sturrock (2007, p.7) describes a deterministic model as a model with no random variables. A stochastic model operates with random variables present at some point in the system Why use Simulation? Simulation can provide a pictorial illustration of what is happening in the system. Changes in the simulation model are easier than in the actual systems. The effect various scenarios have on the system can by investigated without much difficulty. Law, Kelton (1982, p.1) indicated to obtain a better understanding of a system, various assumptions should be made about how that system works. These assumptions generally consist out of mathematical and logical reasoning. With the constructed model the interaction and behavior of corresponding systems can be investigated. Altiok, Malamed (2001, p.1) states that a simulation model provides predictions of the system s performance measures. 13
15 Advantages of Simulation Law, Kelton (1982, p.8) describe the advantages of simulation as follow: In some cases when dealing with complex systems, systems with stochastic elements cannot accurately be described by mathematical models. In these cases the only evaluation and testing of the system is mostly dependant on the simulation model. If there is assigned performance conditions, the system can be investigated, to observe the influence these conditions have on the system and the performance of the system. Various different design types of a system can be observed to achieve the best possible solution. Because it is easier to change a simulation model, changes in the system can easily be observed and rectified. Simulation is able to study systems over a long period of time Disadvantages of Simulation Law, Kelton (1982, p.8) describe the disadvantages of simulation as follow: Simulation models can be expensive and time consuming to develop. Simulation is not ideal for optimizing a system, rather comparing systems, because for each set of input parameters, a number of independent runs of the model will be required. In some cases the model can produce the actual true characteristic of a system, this will be a valid model. If the model is not valid there can be a tendency of to much confidence in the model that is vindicated, this is if there is enough numbers produced. 4.2 Time Study Since the data of the time studies depicts what is actually happening in the system, it will be used when constructing the simulation model Definition of Time Study According to Niebel, Freivalds (1993, p.317) time study is most commonly defined as a fair day s work. Time studies are used to establish time standards, were time standards can be determined by three elements: estimates, historical records and work measurement procedures. The time standard is the allowable time allocated to performing a specific task, always 14
16 regarding the measurement of the work content for the specific task. The technique also includes the allowance for fatigue and for personal and unavoidable delays Purpose of Time Studies Time studies will be used to determine the peak hours (Section 4.4) at the checkin counters. The values will be plotted and the type of distribution identified with the specific mean and standard deviation calculated. These values will be used in the simulation model. 4.3 Queues Queuing is used to explain the concept of arrivals, service delivery and the outcome of a system. The answers obtain is merely theoretical and will not be used in the simulation model Definition of a Queue According to Kelton, Sadowski, Sturrock (2007, p. 22) a queue is when an entity is not able to move, a place where an entity can wait before being served. When an entity is waiting in a queue it is waiting, for instance, for another entity that is being served. Queues can also have a certain capacity determined by the size of the system or available space Definition of a Queuing System Gross, Shortle, Thompson, Harris (2008, p. 2) describes a queuing system as entity arriving in a system for a specific service and waiting for that service if it is not immediately available. A queuing system can differ in various ways. Example, the number of servers, the capacity of the line and the number of services the system can provide Definition of Queuing Theory According to Gross, Shortle, Thompson, Harris (2008, p.2) queuing theory is the means of modeling a system to observe the behavior within that system. The objective of the system is to provide a service to arising entities. 15
17 Thomas G. Robertazzi (1994, p.1) describes the study of queuing as the study of waiting. In queuing theory there is numerous types of models. Each one of these models describes a different queuing system Characteristics of a Queuing Process All queuing systems should have an input process and an output process. The characteristics of a queuing process describes the queuing system in term of the input and output processes, the capacity of the system, the queuing discipline and the number of servers and services Input or Arrival Process According to Wayne L. Winston (2004, p. 308) arrivals are called customers. Arrivals can be unaffected or affected by the number of entities in the system. When the number of entities affects the customer in the system, it can either be a finite source model, where an arrival is drawn from a small population or, the customer fails to enter the system, thus balked. When the customer is unaffected, the interarrival times should be specified with a probability distribution. Gross, Shortle, Thompson, Harris (2008, p. 3) says it is necessary to know the probability distribution describing the interarrival times, because arrivals are stochastic. Arrivals can occur as a single arrival, a batch arrival and bulk arrival Output or Service Process According to Wayne L. Winston (2004, p. 309) a service time distribution should be specified, to indicate the time it will take to service a customer. There are two arrangements of services; service in parallel and service in series. Parallel servers all provide the same service to all customers, thus the customers can only pass through one server. Series servers, is a series of servers providing different services which the customers should all pass through. According to Gross, Shortle, Thompson, Harris (2008, p. 4) the sequence of customer service times should be defined by a probability distribution. Service can also be single or batch. The number of customer in line can also have an 16
18 influence on the service process. If the queue is getting longer, the server may work a bit faster. Working faster can also cause the server to be less accurate Queue Discipline Wayne L. Winston (2004, p. 309) describes queuing discipline as the method used to determine the order in which customers are served. Gross, Shortle, Thompson, Harris (2008, p.4) refers to queuing discipline as the manner in which customers are selected for service when a queue has formed. There are various queue disciplines; the most commonly known is the first come first serve (FCFS). Other known models are the last come last serve (LCLS), and service in random order (SIRO) System Capacity According to Gross, Shortle, Thompson, Harris (2008, p.5) the system capacity is the maximum number of customers in the available space. When the system reaches a specific capacity, a customer cannot enter until another customer leaves the system Number of Service Channels The amount of servers can differ. According to Gross, Shortle, Thompson, Harris (2008, p.5), it is preferred to design a system with multiple servers, which is fed by a single queue. Thus design makes use of parallel service stations that can serve various customers at the same time. 4.4 Determine Peak Periods According to Ashford, Stanton, Moore (1997, p. 29) airports have large variations on the demand. This is caused by peak times of passengers. The variation can be described in 4 ways. Annual variation Monthly peaks Daily peaks Hourly peaks 17
19 Figure 2: Typical distribution of hourly passenger traffic volumes at an air transport airport throughout the year Methods of Describing Peaking Ashford, Stanton, Moore (1997, p. 31) states that an airport is sometimes busier than other times. These are called the peak times. The airport cannot plan their capacity according to the busiest time of the year. There will always be a few hours in a year that the system will be in overload. With delays and inconvenience as a result. The system cannot be planned otherwise because it will lead to uneconomical and wasteful operations. described in the following manner: Standard Busy Rate (SBR) The peaking can be The SBR is also defined as the 30 th highest hour of passenger flow and has been used for years to determine the design volumes. According to this method the system will not run its capacity in overload or beyond for more than 30 hours per year, there is of course no way to guarantee this. described as: absolute peak hour volume = 1.2 x standard busy rate The relationship is Studies showed that as the traffic at an airport develops the extremes tend to disappear. The higher the volume in the system the lower the ratio between SBR and absolute peak will be. 18
20 Figure 3: Location of the standard busy rate Busy Hour Rate (BHR) The Busy Hour Rate is also known as the 5 percent busy hour. This indicates the hourly rate above which 5 percent of the traffic at the airport is handled. Using this method: Arrange all volumes in magnitude Calculate the cumulative sum of all the volumes that amount to 5 percent of the annual volume The next ranked volume is the BHR. Because a large amount of data should be collected to use this method, it is not recommended for small airports. Figure 4: Five percent busy rate hour Typical Peak Hour Passengers (TPHP) Typical Peak Hour Passengers is a peak measure that is defined as the peak hour of the average peak day of the peak month. By looking at the relationship between the annual figures and the TPHP as a percentage of annual flow, it is apparent that the smaller the airport, the more prominent the peak will be. The 19
21 peak will level the larger the airport grows and the troughs between the peaks will become less prominent. Table 1: FAA Relationships for TPHP Computations from Annual Figures Busiest Timetable Hour (BTH) The BTH is calculated by using average load factors and existing or projected timetables. The method is used for small airports with limited databases. A disadvantage is that the method is subject to errors in forecasting and variations in average load factors Peak Profile Hour Also called the average daily peak. The method for calculating the Peak Profile Hour: Select peak months Compute the average hourly for each hour across the month This will provide an average hourly volume for an average peak day. The largest hourly value in the average peak day will indicate the Peak Profile Hour. 4.5 Capacity Planning According to Solak, Clarke, Johnson (2009) the goal of terminal capacity analysis is to minimize congestion related passenger delay in the terminals. Because demand in a terminal can be very transient, most estimations for a simulation model is based on observation. The procedures derived by Solak, Clarke, Johnson can be used for testing and comparing the system. The capacity for an airport is calculated by looking at the available area. Area is not considered in the project. 20
22 4.5.1 Approximation of maximum peak period delay To determine the capacity of the system, the walking and processing times are considered separately. Solak, Clarke, Johnson (2009) developed delay time approximations for the two areas Maximum delay in passageways Though the studies related to pedestrians in transportation terminals are rare, there was exception, Young (1999), evaluated the pedestrian walking speed in a terminal. The result showed that the terminals are normally distributed with mean of 80.5 m per minute and a standard deviation of 15.9 m per minute. Solak, Clarke, Johnson (2009) makes use of the following variables to determine maximum walking time in a system: Maximum density of the passageway Peak flow rate Interarrival times Effective area of passageway Maximum delay in processing stations Most of the congestion is at some kind of service point. The maximum delay in processing stations is developed as a function of flow and capacity. By observing the arrival times, the passenger arrival rate can be calculated. The data is then plotted; the highest peak on the plot will be used for peak demand analysis. A peak is defined as a period during which the arrival rate remains above the average arrival rate. Depending on the sharpness and shape of the peak either triangular, parabolic of half-elliptical approximation can be used. 4.6 Methods to Identify Constraints Constraints are present in all systems. In this project the most likely constraints will be queue lengths and queue waiting times. 21
23 4.6.1 Goldratt s Theory of Constraints (TOC) Jacobs, Chase, Aquilano (2009, p.681) defines the Theory of Constraints as follow: 1. Identify the system constraints 2. Decide how to exploit the system constraints 3. Subordinate everything else to that decision 4. Evaluate the system constraints 5. If constraints have been broken in previous step, go back to step one Definition of Bottleneck Jacobs, Chase, Aquilano (2009, p.686) defines a bottleneck as any resource whose demand is more than its capacity. When there is a bottleneck, there will be long queues. If there are not any bottlenecks present, the system has excess capacity and will lead to uneconomical and wasteful operations according to Ashford, Stanton, Moore (1997, p. 31). Thus, when the airport is running on the average capacity, there should be no bottlenecks. Only during the peak hours should bottlenecks be present. 22
24 5. Improvement Methods The improvement methods is tested in the simulation model to indicate if there is any improvement if applied. 5.1 Queue Improvements All travelers are on the lookout for queue-less travel. There is a variation of products available on the market that can reduce queues Biometrics Technology Stuart Thorn (Airport International September 2007, p. 28), Chief Executive of Electron Europe, wrote in his article that Biometrics Technology could offer a plethora of benefits to airports and passengers. These benefits include increased airline security, shorter check-in queues and passport-free traveling. However, he warns that there are some concerns to examine closely, such as health and safety, privacy and security What is Biometrics? According to Steven Furnell, Nathan Clarke (2005) the International Biometric Group defines biometrics as The auto- mated use of physiological or behavioral characteristics to determine or verify identity. There are two stages: 1. Initial registration and the creation of a biometric template for the user. 2. Authentication by comparing a required sample against a template already held. There are various methods from two main categories being considered: Physiological Facial recognition Facial thermogram Fingerprint recognition Hand geometry Iris scanning Retinal scanning Vein checking 23
25 Behavioral Gait recognition Keystroke analysis Mouse dynamics Signature analysis Voice verification Types of Biometrics Francis Weiss (Airports International April 2007, p.32), from the e-border department of Sagem Dèfense Sècuritè gives an explanation of various types of Biometric technologies which is currently being tested Pegase A study started in June 2005 until May 2007 by Sagem with Air France concerning a fingerprint scanner. Using fingerprints stored in a database, the scheme could evaluate technologies that include uniqueness detection, staff procedures and passenger acceptance Biodev1 and Visabio In 2006 Segem integrated a scheme test of Europe-wide multi-biometric visas containing face and fingerprint data. The system will be connected to European Union s Visa Integrated Circuit Card Specifications (VIS) IRIS IRIS is the United Kingdom s immigration control system, developed by Sagem. An iris recognition camera is used to allow enrolled passengers to pass through an automated immigration control gate SMARTGATE SMARTGATE makes use of facial recognition technology; this matches the traveler s identity to a photograph. For the facial recognition scheme to work, biometric passports should be used (e-passports). The photographs are located in an e-passport system. Tom Allett (Airport International Jan/Feb 2008, p.29) reports the technology of SMARTGATE kiosk. Some technologies used are touch screen, thermal/magnetic 24
26 ticket printer/readers and an electronic passport reader. Further the gate has digital cameras, sensors and mechanical doors misense Uses the latest technologies to simplify a passenger s journey through the airport while strengthening security. This include the check-in, ticket control, boarding and immigration control procedures Body Scanner There are two methods, the millimeter-wave or the X-Ray part of the spectrum. The scanner scans the body in full length to determine if any concealed objects are present. The millimeter-wave is new technology. Different materials have different properties. What the scanner does is detect anything foreign to the human body. The scanner will show the object on a fully clothed image on a screen Various Check-In Methods Shawn Richards (Airport International March 2007, p.32) discuss a number of check-in methods. He states that airports should provide a number of check-in channels before they arrive on the airport and in the airport self Internet Check-In Since most passengers purchase their tickets online, online check-in is the most convenient. According to studies a combined 80% of the passengers will use this channel, clearly indicating the benefit Remote Check-In A third party is used for the check-in process. The idea is for the travelers to check-in at the Hotels, railway stations and transport interchanges, which provide assisted check-in on demand SMS Check-In Cell phones are commonly used in most of the counties. Texting has become part of our daily lives. With SMS Check-in, the passengers can check-in by sending a text message. The passenger should be well aware of the common mistakes 25
27 people make with mobile phones. The communication between the airline and the passenger should be clear, short and precise Common Use Systems This system shares the hardware that the various software systems run on, with the exception of the needed dedicated system. According to Richards this is the key to maximizing the throughput of the passengers through the check-in area. Wherever desk and kiosk are shared the passenger throughput can increase by multiples Kiosk Check-In The passengers have to serve themselves; they are able to retrieve their boarding passes. According to Carroll McCormick (Airports International March 2008, p.26) passengers can use the kiosk for self-serve baggage tagging. In some countries this is not possible, because it is illegal for passengers to tag their own baggage. 26


28 6. Simulation Model The simulation is done in sections. Each section is a simulation of a different process, the domestic and international process. These processes and the logic followed during the simulation model are explained in this section. The time studies used was provided by VCE. 6.1 Domestic process The basic steps of the domestic process are arrivals, check-in, bag drop, security check-point and boarding of the passengers. Figure 5 is a simplified version of what is happening in the system. Arrival at the airport Check-In Bag drop Security Check-point Boarding Figure 5: The basic steps of the Domestic Process When simulating the whole process, the process looks quite different while the same concept is being followed. The figure below will create an idea of how the simulation model is designed. Create Arrivals Assign Entities to Group Sizes Decide if traveling with Baggage Move through Service Counters Move through Security Checkpoint Walk to Boarding Station Leave the System Figure 6: An illustration of how the simulation model is designed for the domestic process 27
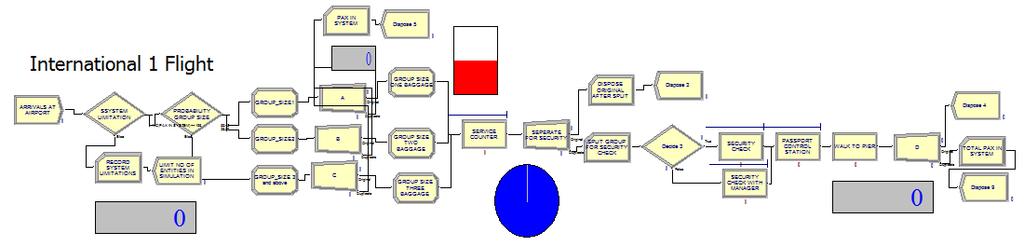
29 Firstly the passenger arrivals is created. The arriving entities are then assigned to three different group sizes. Not all passengers travel with baggage when flying domestic, thus the groups are divided into groups traveling with baggage and traveling without baggage. The passenger then move through the service counters in the allocated groups to be checked-in. After the check-in process the passengers move on to the security check-point, were they are checked individually. The next step is for the passenger to walk to the boarding station to board the plane and then leave the system. The boarding of the plane is not simulated, only the arrival at the boarding station is included. 6.2 International Process There are only two changes in the simulation model when modeling the international process. There are no passengers travelling without baggage and the passport control process is added. A simplified version of the basic steps of the international process is seen below. Arrival at the airport Check-In Bag drop Security Check-point Passport Control Boarding Figure 7: The basic steps of the international process Again, when looking at the simulation the process can look quite different while following the same concept. Below is an illustration of what happens in the simulation model. 28

30 Create Arrivals Assign entities to group sizes Go through service counter Go through security checkpoint Go through passport control Walk to baording stationc Leave the system Figure 8: An illustration of how the simulation model is designed for the domestic process Passengers arrive at the airport, and is then allocated to a group size. All passengers arriving for an international flight have baggage to check-in at the service counters. After moving through the check-in process, passengers have to pass the security check-point and the passport control process. Once through all these processes the passenger can walk to the respective boarding stations and leave the system. 6.3 Model Breakdown Arrivals The arrivals of the passengers are obtained through a time study. Through these time studies the probability of the amount of arrivals per minute is calculated. An arrival does not necessarily represent a single entity, as the group size is determined by a discrete probability based on the a study explained in section The probability of passengers arriving is calculated over a period of two hours. Two simulation models are built, one for the arrivals of only one flight and the other for the arrivals of two flights with the same departure time. 29

31 Figure 9: Creation node used for arrivals A create node is used to create the arrivals for the model. By looking at the amount of entities arriving per minute the probabilities illustrated in the figures and tables below are obtained. The probability of passenger arrivals of each simulation is done separately, because the arrival rate of each of these instances is different from the other. Table 2: The probability of passenger arrivals 100% 80% Probability of Domestic Arrivals for 1 Flight 60% 40% 20% Probabilities Accumulated Probabilities 0% Figure 10: Probability of Domestic Arrivals for a single flight 30
32 Probability of Domestic Arrivals for 2 Flights % 80.00% 60.00% 40.00% 20.00% Probability Accumulated Probability 0.00% Figure 11: Probability of Domestic Arrivals for two flights Probability of International Arrivals for 1 Flight % 90.00% 80.00% 70.00% 60.00% 50.00% 40.00% 30.00% 20.00% 10.00% 0.00% Probability Accumulated Probability Figure 12: Probability of International Arrivals for a single flight Probability of International Arrivals for 2 Flights % 90.00% 80.00% 70.00% 60.00% 50.00% 40.00% 30.00% 20.00% 10.00% 0.00% Probability Accumulated Probability Figure 13: Probability of International Arrivals for two flights The probability of arrival and the accumulated probability is calculated. The accumulated probability is used to define the entities per arrival, using discrete probability as seen below. 31


33 Figure 14: Create node properties Group Allocation When doing the group allocation, three group sizes are considered: 1. Group with size 1 2. Group with size 2 3. Group with size 3 and above Figure 15: Nodes used to allocate groups The picture above is an illustration of how the group sizes are allocated. A decision node is used to allocate the percentage of entities for a certain group to an assign node. These probabilities were obtained through time studies and is illustrated below. Table 3: Probability of Group Size 32

34 Probability of Group Size 60.00% 50.00% 40.00% 30.00% 20.00% 10.00% 0.00% Group Size 1 Group Size 2 Group Size 3 & Above Probability of Group Size Figure 16: Probability of Group Size Figure 17: Properties of the assign node The name of the assign node is according to the group size. The type is an attribute which is named GROUP SIZE_B. The value of the attribute is respective to the group size. The attribute is created so that the groups can be separated later in the model to go through the security checkpoint. This is illustrate later in the document when the security checkpoint is explained Assigning Baggage Not all the passengers arrive with luggage when flying domestic. When assigning the baggage the passengers are divided into two groups; passengers with baggage and passengers with no baggage. A passenger who has enough luggage so that it should be checked in at the check-in counter is considered having baggage. Passengers only traveling with hand luggage are considered without baggage. The percentage of passengers arriving with or without baggage is obtained through studies. These studies indicate the probability that each group size will arrive with or without baggage. 33


35 Table 4: Probability of group baggage Probability of Arriving with or without baggage for Domestic Flight % 90.00% 80.00% 70.00% 60.00% 50.00% 40.00% 30.00% 20.00% 10.00% 0.00% Baggage No Baggage Baggage No Baggage Baggage No Baggage Group Size 1 Group Size 2 Group Size 3 > Domestic Probability Figure 18: Probability of Arriving with or without baggage for Domestic Flight Figure 19: Nodes to assign baggage to group When simulating the baggage, a decision node with type 2-way-by-chance is chosen. The respective probabilities of table 4 is used and illustrated in figure 18. The decision is true when the passenger/group has baggage and false when the passenger/group has no baggage. The assign node allocates the respective service time to the passengers or groups. The service time for passengers who has to check-in their luggage during the check-in process will be different from those passengers only travelling with hand luggage. 34


36 By naming the attribute SERVICE_TIME, and assigning a value using a normal distribution, the service time is calculated for each respective passenger or group. The values used to calculated the service time is shown in table 5. Table 5: Service time for groups with baggage options The average or mean and standard deviation is used for a normal distribution. Service Times AVERAGE STDEV 1 without baggage 1 with baggage 2 without baggage 2 with baggage >3 without baggage >3 with baggage Figure 20: Service time for groups with baggage options Figure 21: Properties of assign node During the international process it is assumed that all passengers arrive with baggage that has to be checked-in. 35


37 6.3.4 Check-in Counter At the service counter passenger go through the check-in process. The passengers are served at a rate called SERVICE_TIME. The service time is different for each group size and also differs depending if the passenger has baggage or no baggage. A process node is used to simulate the service counters. Figure 22: Process node used for service counter The process is given a resource which is called SERVICE COUNTERS. As seen below in Figure 23, the resource has a quantity of 1. This quantity indicate the amount of attributes/entities the service counter can service at a certain time, and not the amount of service counters available. The amount of service counters is changed by changing the resource capacity in the Basic Processes indicated in table 6. The processing time given in the Expression box is the SERVICE_TIME, thus, the SERVICE_TIME explained in section is the processing time. Figure 23: Properties of Process Node Table 6: Resources in the system with capacity 36


38 6.3.5 Security Check-point Before the passengers can go through the security check-point, the groups should be separated, because the passengers are checked individually during this process. Disposal of the group Duplicate of attribute value Figure 24: Nodes used to divide groups Figure 25: Properties of Separate node In figure 24 and 25 it is shown that a separate node is used to create duplicates of the attribute GROUP_SIZE_B. As previously explained in section 6.3.2, there are different values for this attribute. These values are duplicated so that passengers can move through the security check-point individually. The green balls in Figure 24 visually illustrates how the duplications work. Suppose the group size is two, thus, when the value two of the attribute GROUP_SIZE_B is duplicated, two attributes are the result. The original attribute, which is the group, are disposed. 37


39 Figure 26: Nodes used for security check-point After the groups are separated, the passenger can move individually through the security check-point. A decide node is used to determine the amount of passengers who are thoroughly searched by the manager and those passing through the process without any problems. Figure 27: Properties of security check-point As seen in figure 27, a normal distribution with a mean of 4.1 minutes and a standard deviation of 30 seconds is used for the security check-point. The process is given a resource called SECURITY CHECK POINT with a value of 1. The value indicate the amount of passengers one security check-point can service. The amount of security counters can be changed by changing the resource capacity in table Passport Control The passport control process only occur during the international process. Here passengers have to move through the process individually. 38


40 Figure 28: Process node used for passport control Figure 29: Properties of passport control process A normal distribution with mean 1.16 minutes and standard deviation of 30 seconds is used for the process. A resource called PASSPORT CONTROL with a value of one is created for the process. Again the value indicate the number of passengers a passport control counter can serve. The amount of counters can be changed by changing the resource capacity seen in table Walk to Boarding Stations A requirement for the project is to determine the walking time from the terminal to the respective boarding stations. The figure below is a simplified illustration of the airport layout. The blocks marked from A1 to E10 is the docking station for an aircraft and represent a boarding station. 39


41 Figure 30: A simplified version of the airport layout Figure 31: Process node used for walking to boarding station A simple process node is used to simulate the walking to the boarding stations. The average walking time per passenger was calculated using the formula: See section for the average walking speed of 85.5 meters/minute. In table 7 the average walking time it will take a passenger to walk from the terminal to the respective boarding station is illustrated. The walking time for Pier A and Pier E is the same, and the walking time for Pier B and Pier D is the same, which is way Pier D en E is not included in the table. Table 7: The average walking time from terminal to respective boarding stations 40


42 Figure 32: Process properties for walk to boarding station A normal distribution with a mean of the average walking time and standard deviations of 2 minutes is used for the simulation Stopping the Model Since the simulation is done for the domestic process with 1 or 2 flights, the number of passengers in the system cannot be more than the aircraft capacity. It is assumed that 85% of seats available on the aircraft will be occupied. Table 8 indicates the capacity per aircraft. The A340 is used for the international process, while the B is used for the domestic process. The capacity used during the processes with two flights, is the 85% capacity multiplied by two. Table 8: Capacity of aircrafts


43 Passengers in System Total number of Passengers Figure 33: Properties of nodes used for stopping the model Block 2 makes use of a record node to count the number of individual passengers in the system, named PAX IN SYSTEM. A separate node is used on the same principle as explained in section to make duplicates of the service time. When the PAX IN SYSTEM is above or equal to the 85% capacity of the aircraft in table 8, block 1 will not allow any new entities to enter the system. While new entities cannot enter the system, the entities in the system at that stage should be able to move through the whole model. By creating a counter name TOTAL NUMBER OF PAX seen in block 3, the setup of the model can be modified. If the TOTAL NUMBER OF PAX is above the 85% capacity, the model will stop, ensuring that all entities go through the whole model. 42
44 7. Results Sensitivity analysis is used to study the outcome of the simulation model. According to L. Breierova, M. Choudhari (1996, p.47) sensitivity analysis is a test in how sensitive a model is to change in its values and parameters. By showing how the model react to change and change in behaviour if the changes are made, sensitivity analysis can be handy tool. Sensitivity Analysis is used for the following: Easy reference for the client In depth insight into the model for people who do not understand the software It can highlight the uncertainties in the parameters of the model Can indicate what parameters are best to use in the model Gives a better understanding of the dynamics of the model Indicated possible constraints in the system Table 9: Six Categories of the level of service according to the IATA Manual Table 9 indicates the level of service (LOS) of an airport according to the IATA manual. According to the manual, the acceptable queue waiting time for the check-in process is maximum 12 minutes, considering the airport operates at level C. In the figures below the utilization of the service counters in the check-in process is compared to the queue time at the service counters. The utilization of all the different processes is also investigated. 43

45 7.1 Domestic The variable in the domestic process is the service counters for the check-in process, while the number of security check-points stay unchanged. In the tables below the utilization for both the check-in counters and the security checkpoints are tabulated. The waiting times and queuing lengths is only for the check-in counters. All the queue waiting times written in red is not up to standard according to level C of the IATA Manual Domestic with one flight Table 10: Sensitivity Analysis of Domestic one Flight In figure 35 the relationship between the two utilizations in table 10 is illustrated. In the data used for the figure, the security counters is a constant, thus the small change in the counter s utilization. A definite decrease in the check-in counter utilization is visible. Figure 36 illustrates the utilization of the security check-point when the amount of check-in counters is the constant. 44
46 From both these figures the observation is that the utilization do not change much if the counters are the constant in the analysis. Figure 37 in turn illustrates that as the amount of counters increase, the counter utilization will decrease. While the utilization of the counters is very important it is also of importance to keep in mind that the maximum waiting time is 12 minutes. According to the analysis, the most favourable option will be to have 15 security counters and 6 check-in counters with a maximum waiting time of minutes % 60.00% Domestic 1 Flight Utilization with Constant Security Counters 40.00% 20.00% 0.00% Check-in Utilization Security Utilization Figure 34 : Domestic one flight Utilization with constant security counters Domestic 1 Flight Utilization with Constant Check-in Counters 80.00% 60.00% 40.00% 20.00% 0.00% Security Counters Check-in Counters Figure 35: Domestic one flight Utilization with constant check-in counters Domestic 1 Flight Utilization vs Queue Time Utilization Queue Time Figure 36: Domestic 1 Flight: Utilization vs Queue Time 45


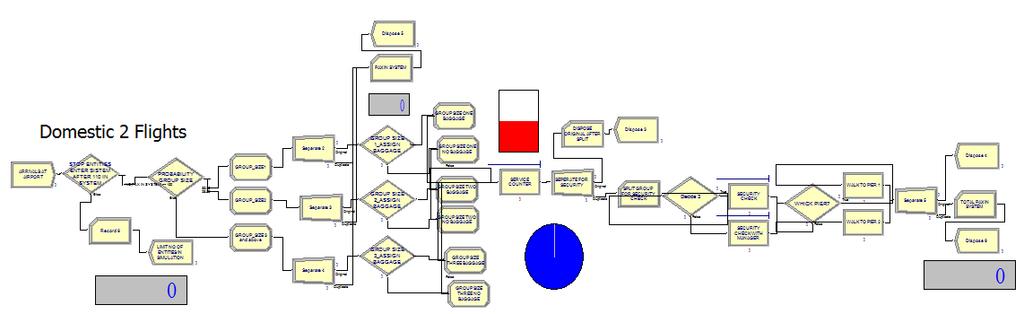
47 7.1.2 Domestic with two flights Table 11: Sensitivity Analysis of Domestic two Flights Figure 37 and figure 38 respectively illustrates the utilization of the counters. If the counter is a constant, the utilization does not change much, but if the counter is the variable, the utilization will show a definite change. In figure 39 the relationship between the counter utilization and the waiting time can be seen. The result is the same as in section As the waiting time decrease so will the utilization of the counter decrease. 46
48 Domestic 2 Flights Utilization with constant Security Counters 60.00% 50.00% 40.00% 30.00% 20.00% 10.00% 0.00% Check-in Counters Security Counters Figure 37: Domestic 2 Flights utilization with constant Security Counters Domestic 2 Flights Utilization with Constant Check-in Counters 60.00% 50.00% 40.00% 30.00% 20.00% 10.00% 0.00% Security Counters Check-in Counters Figure 38: Domestic 2 Flights utilization with constant Check-in Counters Domestic 2 Flights Utilization vs Queue Time Check-in Utilization Queue Time Figure 39: Domestic 2 Flights Utilization vs Queue Time 7.2 International During the international process s sensitivity analysis, the passport control counter, security check-point counter and check-in counter is analyzed. Again 47


49 the check-in counter is the variable, but the passport and security counters are also tested as variables International with one flight Table 12: Sensitivity Analysis International one Flight In figure 40 the utilization of all three counters can been seen, with the passport and security counters as constants. Again as in the previous two sections, if the counters are constant, the change in the utilization is minimal. Only when the amount of counters change, the utilization will have significant changes. The optimum usage for this process would be to have 15 security counters, 5 passport counters and 9 check-in counters with a maximum waiting time of 8.6 minutes. Figure 41 illustrates the relationship between the counter utilization and the queue time. As the queue time decrease, the utilization will also decrease. As the amount of counters increase, the queue time will decrease. 48

50 90.00% 80.00% 70.00% 60.00% 50.00% 40.00% 30.00% 20.00% 10.00% 0.00% International 1 Flight Utilization Check-in Counters Security Counters Passport Counters Figure 40: International one Flight Utilization International 1 Flight Utilization vs Queue Time Service Utilization Queue Time Figure 41: International 1 Flight Utilization vs Queue Time Table 13: Sensitivity Analysis with constant security counters 49


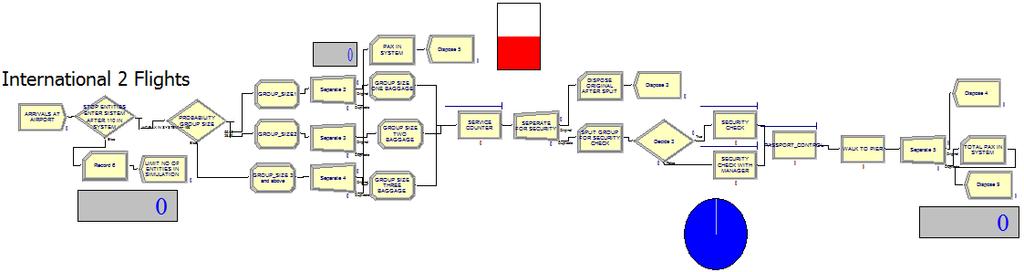
51 In table 13 above, the amount of security counters are kept constant. The result of the analysis is the same as for table International with two Flights Table 14: Sensitivity Analysis International two Flights Figure 42 illustrates the utilization of the counters of an international process with two flights. Regardless of the change in the amount of counters, the security counters always work with a very high utilization compared to the other counters. From the previous sections it is clear that when the utilization is high, the queue time for that process is also very high. Thus, the security counters is a constraint in the system. A possible solution is to increase the amount of counters. The optimum usage for this process from the sensitivity analysis would be to use 15 security counters, 10 passport counters and 14 check-in counters with a maximum waiting time of minutes. Figure 43 illustrates that as the queue decrease, the utilization of that counters will decrease. 50
52 International 2 Flights Utilization % 80.00% 60.00% 40.00% 20.00% Service Utilization Security Utilization Passport Utilization 0.00% Figure 42: International two flights Utilization International 2 Flights Utilization vs Queue Time Service Utilization Queue Time Figure 43: International two flights utilization vs Queue Time 51

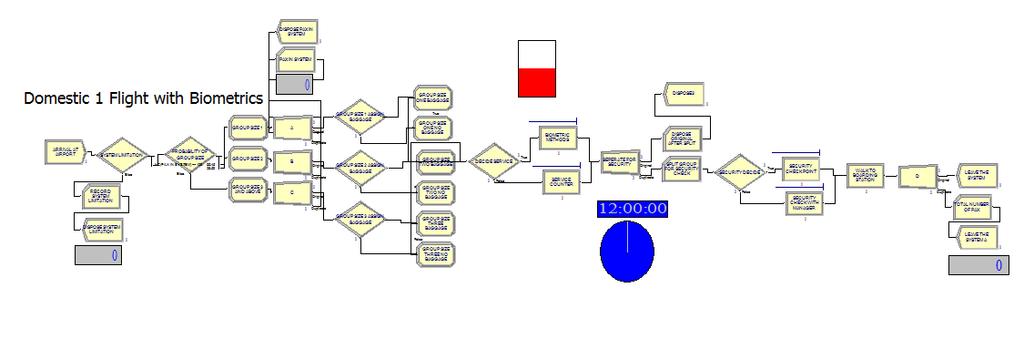
53 8. Future Analysis For future references, a sensitive analysis is done using the biometric methods explained in section 5. Not a specific method was used for the simulation and the assumption was made that 50% of arriving passengers will make use of the biometric methods. Table 15: Sensitivity Analysis with Biometric Methods In table 15 it can clearly be seen that the maximum queuing time at the service counters drastically decrease when using the improved methods. By increasing the number of biometric counters/check-in points, the utilization decrease. Figure 44 illustrates the relationship between the queuing times of a system making use and a system not making use of biometric technology. It is clear that the queuing time significantly decrease when using biometric technology Waiting Time Biometric Methods vs Normal Service Counters With Biometric Counters No Biometric Counters Figure 44: Waiting Time Biometric methods vs Normal service counter 52
54 9. Conclusion Sensitivity analysis indicate that as the number of processing counters increase, the queue time will decrease and in turn the utilization of those processing counters will also decrease. The utilization for any process will increase when that process has a high usage. By increasing the number of counters, the usage for some of the counters will decrease because the workload is divided between more counters. The queuing time and queuing length is the constraints within the system. Solutions for these constraints are found by using the sensitivity analysis to identify the optimum amount of counters for each process. Using the biometric technology it is clear that the queue time at the check-in counters is drastically decreased. For implementation in the future, the biometric technology is a very good solution to the above constraints in the system. The simulation model can also be used to test alternative counter utilization if VCE finds the need for the change. 53
55 References Law, A.M. & Kelton, W.D. (1982). Simulation Modeling & Analysis. McGraw-Hill Series in Industrial Engineering & Management Science. Kelton, W.D., Sadowski, R.P., Sturrock, D.T. (2007). Edition). McGraw-Hill International Edition. Simulation with Arena (Fourth Winston, W.L. (2004). Introduction to Probability Models (Operations Research: Volume Two, Fourth Edition). Thompson Books. Altiok, T., Melamed, B. (2001). Simulation modeling & analysis with Arena. Niebel, B., Freivalds, A. (1993). Methods, Standards & Work design (10 th Edition). Gross, D., Shortle, J.F., Thompson, J.M., Harris, C.M. (2008). Fundamentals of Queuing Theory (Fourth Edition). Wiley Publications. Robertazzi, T.G. (1994). Computer Networks and Systems: Queuing Theory and Performance Evaluation (Second Edition). Springer-Verlag. Ashford, N., Stanton, H.P.M., Moore, C.A. (1997). Airport Operations (Second Edition). McGraw-Hill. Solak, S., Clarke, J.B., Johnson, E.L. (2009). Airport Terminal Capacity planning (Volume 43, Issue 6, July 2009, Pages ). Transportation & Research Part B: Methodological. Jacobs, F.R., Chase, R.B., Aquilano, N.J. (2009). Operations and supply management (12 th Edition). McGraw-Hill International Edition. Furnall, S., Clarke, N. (2005). Biometrics: no silver bullets (Volume 2005, Issue 8, August 2005, pages 9-14). Computer Fraud & Security Thorn, S. (September 2007, page 28). Airport International. Weiss, F. (April 2007, page 32). Airport International. Allett, T. (January/February 2008, page 28). Airport International. Richards, S. (March 2007, page 32). Airport International. 54
56 McCormick, C. (March 2008, page 26). Airport International. Young, S.B., (1999). Evaluation of pedestrian walking speeds in airport terminals. Transportation Research Record 1674, How is 'Biometrics' Defined?,International Biometric Group. Breierova L, Choudhari M, (1996). An Introduction to Sensitivity Analysis International Air Transportation Association (IATA) Manual 55

57 Appendix 56
58 57
59 58
60 59
61 60
PRAJWAL KHADGI Department of Industrial and Systems Engineering Northern Illinois University DeKalb, Illinois, USA
 SIMULATION ANALYSIS OF PASSENGER CHECK IN AND BAGGAGE SCREENING AREA AT CHICAGO-ROCKFORD INTERNATIONAL AIRPORT PRAJWAL KHADGI Department of Industrial and Systems Engineering Northern Illinois University
Aviation ICT Forum 2014
 Aviation ICT Forum 2014 More ground to break Shaping the future. Together 16 17 October 2014 Panel Name: Biometrics: Securing future passenger self service at the airport Discussion points Biometrics recap
Analysis of Air Transportation Systems. Airport Capacity
 Analysis of Air Transportation Systems Airport Capacity Dr. Antonio A. Trani Associate Professor of Civil and Environmental Engineering Virginia Polytechnic Institute and State University Fall 2002 Virginia
White Paper: Assessment of 1-to-Many matching in the airport departure process
 White Paper: Assessment of 1-to-Many matching in the airport departure process November 2015 rockwellcollins.com Background The airline industry is experiencing significant growth. With higher capacity
ADVANTAGES OF SIMULATION
 ADVANTAGES OF SIMULATION Most complex, real-world systems with stochastic elements cannot be accurately described by a mathematical model that can be evaluated analytically. Thus, a simulation is often
Flight Arrival Simulation
 Flight Arrival Simulation Ali Reza Afshari Buein Zahra Technical University, Department of Industrial Engineering, Iran, afshari@bzte.ac.ir Mohammad Anisseh Imam Khomeini International University, Department
SIMULATION MODELING AND ANALYSIS OF A NEW INTERNATIONAL TERMINAL
 Proceedings of the 2000 Winter Simulation Conference J. A. Joines, R. R. Barton, K. Kang, and P. A. Fishwick, eds. SIMULATION MODELING AND ANALYSIS OF A NEW INTERNATIONAL TERMINAL Ali S. Kiran Tekin Cetinkaya
Aircraft Arrival Sequencing: Creating order from disorder
 Aircraft Arrival Sequencing: Creating order from disorder Sponsor Dr. John Shortle Assistant Professor SEOR Dept, GMU Mentor Dr. Lance Sherry Executive Director CATSR, GMU Group members Vivek Kumar David
THIRTEENTH AIR NAVIGATION CONFERENCE
 International Civil Aviation Organization AN-Conf/13-WP/22 14/6/18 WORKING PAPER THIRTEENTH AIR NAVIGATION CONFERENCE Agenda Item 1: Air navigation global strategy 1.4: Air navigation business cases Montréal,
FACILITATION PANEL (FALP)
") International Civil Aviation Organization WORKING PAPER 23/3/16 English only FACILITATION PANEL (FALP) NINTH MEETING Montréal, 4-7 April 2016 Agenda Item 3: Amendments to Annex 9 AIRPORT TRAFFIC FLOW ARRANGEMENTS
International Civil Aviation Organization WORKING PAPER 23/3/16 English only FACILITATION PANEL (FALP) NINTH MEETING Montréal, 4-7 April 2016 Agenda Item 3: Amendments to Annex 9 AIRPORT TRAFFIC FLOW ARRANGEMENTS
American Airlines Next Top Model
 Page 1 of 12 American Airlines Next Top Model Introduction Airlines employ several distinct strategies for the boarding and deboarding of airplanes in an attempt to minimize the time each plane spends
An Analysis of Dynamic Actions on the Big Long River
 Control # 17126 Page 1 of 19 An Analysis of Dynamic Actions on the Big Long River MCM Team Control # 17126 February 13, 2012 Control # 17126 Page 2 of 19 Contents 1. Introduction... 3 1.1 Problem Background...
Security Queue Management Plan
 1. Introduction 1.1 Purpose The Queue Management Plan (QMP) describes the process for managing the flow of passengers through the security queue at the CVG Airport Passenger Terminal. In all conditions
7 Ways Facial Recognition Can Unlock A Secure, Frictionless and Personalized Travel Experience COURTESY OF A SINGLE, UNIFIED BIOMETRIC KEY
 7 Ways Facial Recognition Can Unlock A Secure, Frictionless and Personalized Travel Experience COURTESY OF A SINGLE, UNIFIED BIOMETRIC KEY INTRODUCTION Boarding a plane used to be the exciting start to
Evaluation of Quality of Service in airport Terminals
 Evaluation of Quality of Service in airport Terminals Sofia Kalakou AIRDEV Seminar Lisbon, Instituto Superior Tecnico 20th of October 2011 1 Outline Motivation Objectives Components of airport passenger
CHAPTER 5 SIMULATION MODEL TO DETERMINE FREQUENCY OF A SINGLE BUS ROUTE WITH SINGLE AND MULTIPLE HEADWAYS
 91 CHAPTER 5 SIMULATION MODEL TO DETERMINE FREQUENCY OF A SINGLE BUS ROUTE WITH SINGLE AND MULTIPLE HEADWAYS 5.1 INTRODUCTION In chapter 4, from the evaluation of routes and the sensitive analysis, it
You Must Be At Least This Tall To Ride This Paper. Control 27
 You Must Be At Least This Tall To Ride This Paper Control 27 Page 1 of 10 Control 27 Contents 1 Introduction 2 2 Basic Model 2 2.1 Definitions............................................... 2 2.2 Commonly
Analysis of ATM Performance during Equipment Outages
 Analysis of ATM Performance during Equipment Outages Jasenka Rakas and Paul Schonfeld November 14, 2000 National Center of Excellence for Aviation Operations Research Table of Contents Introduction Objectives
Note on validation of the baseline passenger terminal building model for the purpose of performing a capacity assessment of Dublin Airport
 Note on validation of the baseline passenger terminal building model for the purpose of performing a capacity assessment of Dublin Airport 1 Background Under Section 8(1) of the Aviation Regulation Act
SIMAIR: A STOCHASTIC MODEL OF AIRLINE OPERATIONS
 SIMAIR: A STOCHASTIC MODEL OF AIRLINE OPERATIONS Jay M. Rosenberger Andrew J. Schaefer David Goldsman Ellis L. Johnson Anton J. Kleywegt George L. Nemhauser School of Industrial and Systems Engineering
FACILITATION (FAL) DIVISION TWELFTH SESSION. Cairo, Egypt, 22 March to 2 April 2004
 DIVISION TWELFTH SESSION. Cairo, Egypt, 22 March to 2 April 2004") 19/2/04 English only FACILITATION (FAL) DIVISION TWELFTH SESSION Cairo, Egypt, 22 March to 2 April 2004 Agenda Item 2: Facilitation and security of travel documents and border control formalities 2.5:
19/2/04 English only FACILITATION (FAL) DIVISION TWELFTH SESSION Cairo, Egypt, 22 March to 2 April 2004 Agenda Item 2: Facilitation and security of travel documents and border control formalities 2.5:
The Transforming Airport
 DAY 2 FOUR PATHWAYS The Transforming Airport Distributed Airport Infrastructure Airport infrastructure; Creating greater choice and convenience for passengers is driving the trend for off-airport facilities.
2012 IATA GLOBAL PASSENGER SURVEY HIGHLIGHTS
 2012 IATA GLOBAL PASSENGER SURVEY HIGHLIGHTS * The information contained in our databases and used in this presentation has been assembled from many sources, and whilst reasonable care has been taken to
e- Check in project at Narita Airport
 ACI Airport Service Quality & Facilitation Conference e- Check in project at Narita Airport 1 April, 2008 Narita International Airport Co. ISAO KOTAKE i-kotake@naa.jp 1 Contents 1. Facts on Narita Airport
CAPAN Methodology Sector Capacity Assessment
 CAPAN Methodology Sector Capacity Assessment Air Traffic Services System Capacity Seminar/Workshop Nairobi, Kenya, 8 10 June 2016 Raffaele Russo EUROCONTROL Operations Planning Background Network Operations
SPADE-2 - Supporting Platform for Airport Decision-making and Efficiency Analysis Phase 2
 - Supporting Platform for Airport Decision-making and Efficiency Analysis Phase 2 2 nd User Group Meeting Overview of the Platform List of Use Cases UC1: Airport Capacity Management UC2: Match Capacity
Capacity Planning Overview
 Capacity Planning Overview Brazil Strategic Airport Capacity Improvement Project August 2016 1. Capacity Primer Capacity Basics Capacity is how much stuff something holds Measurement depends on the stuff
Abstract. Introduction
 COMPARISON OF EFFICIENCY OF SLOT ALLOCATION BY CONGESTION PRICING AND RATION BY SCHEDULE Saba Neyshaboury,Vivek Kumar, Lance Sherry, Karla Hoffman Center for Air Transportation Systems Research (CATSR)
Prepared By: Dr. William Hynes William Hynes & Associates October On Behalf of the Commission for Aviation Regulation
 Critical Appraisal of Dublin Airport Baseline Report E (Prepared by Consultant Team PM/TPS/SOM) Regarding Robustness of Terminal Capacity (and Functionality) Analysis Prepared By: Dr. William Hynes William
HOW TO IMPROVE HIGH-FREQUENCY BUS SERVICE RELIABILITY THROUGH SCHEDULING
 HOW TO IMPROVE HIGH-FREQUENCY BUS SERVICE RELIABILITY THROUGH SCHEDULING Ms. Grace Fattouche Abstract This paper outlines a scheduling process for improving high-frequency bus service reliability based
An Econometric Study of Flight Delay Causes at O Hare International Airport Nathan Daniel Boettcher, Dr. Don Thompson*
 An Econometric Study of Flight Delay Causes at O Hare International Airport Nathan Daniel Boettcher, Dr. Don Thompson* Abstract This study examined the relationship between sources of delay and the level
FUTURE PASSENGER PROCESSING. ACRP New Concepts for Airport Terminal Landside Facilities
 FUTURE PASSENGER PROCESSING ACRP 07-01 New Concepts for Airport Terminal Landside Facilities In association with: Ricondo & Associates, TransSolutions, TranSecure RESEARCH Background Research Objective
FLIGHT TRANSPORTATION LABORATORY REPORT R87-5 AN AIR TRAFFIC CONTROL SIMULATOR FOR THE EVALUATION OF FLOW MANAGEMENT STRATEGIES JAMES FRANKLIN BUTLER
 FLIGHT TRANSPORTATION LABORATORY REPORT R87-5 AN AIR TRAFFIC CONTROL SIMULATOR FOR THE EVALUATION OF FLOW MANAGEMENT STRATEGIES by JAMES FRANKLIN BUTLER MASTER OF SCIENCE IN AERONAUTICS AND ASTRONAUTICS
Measure 67: Intermodality for people First page:
 Measure 67: Intermodality for people First page: Policy package: 5: Intermodal package Measure 69: Intermodality for people: the principle of subsidiarity notwithstanding, priority should be given in the
Schedule Compression by Fair Allocation Methods
 Schedule Compression by Fair Allocation Methods by Michael Ball Andrew Churchill David Lovell University of Maryland and NEXTOR, the National Center of Excellence for Aviation Operations Research November
APPENDIX D MSP Airfield Simulation Analysis
 APPENDIX D MSP Airfield Simulation Analysis This page is left intentionally blank. MSP Airfield Simulation Analysis Technical Report Prepared by: HNTB November 2011 2020 Improvements Environmental Assessment/
Analyzing Risk at the FAA Flight Systems Laboratory
 Analyzing Risk at the FAA Flight Systems Laboratory Presented to: Workshop By: Dr. Richard Greenhaw, FAA AFS-440 Date: 29 November, 2005 Flight Systems Laboratory Who we are How we analyze risk Airbus
ultimate traffic Live User Guide
 ultimate traffic Live User Guide Welcome to ultimate traffic Live This manual has been prepared to aid you in learning about utlive. ultimate traffic Live is an AI traffic generation and management program
Materna Integrated Passenger Services (Materna ips)
") Materna Integrated Passenger Services (Materna ips) Materna ips accompanies airline passengers throughout their whole journey: from web check-in at home, through all the handling points at their departure
Materna Integrated Passenger Services (Materna ips) Materna ips accompanies airline passengers throughout their whole journey: from web check-in at home, through all the handling points at their departure
Todsanai Chumwatana, and Ichayaporn Chuaychoo Rangsit University, Thailand, {todsanai.c;
 Using Hybrid Technique: the Integration of Data Analytics and Queuing Theory for Average Service Time Estimation at Immigration Service, Suvarnabhumi Airport Todsanai Chumwatana, and Ichayaporn Chuaychoo
Collaboration for best Passenger Experience Check-In of the Future Enhancing the Passenger Experience
 Collaboration for best Passenger Experience Check-In of the Future Enhancing the Passenger Experience Presentation at the 23 rd ACI Africa Region Annual Conference 14 th October 2014, Durban by Torsten
Application of Queueing Theory to Airport Related Problems
 Global Journal of Pure and Applied Mathematics. ISSN 0973-1768 Volume 13, Number 7 (2017), pp. 3863-3868 Research India Publications http://www.ripublication.com Application of Queueing Theory to Airport
UC Berkeley Working Papers
 UC Berkeley Working Papers Title The Value Of Runway Time Slots For Airlines Permalink https://escholarship.org/uc/item/69t9v6qb Authors Cao, Jia-ming Kanafani, Adib Publication Date 1997-05-01 escholarship.org
FACILITATION PANEL (FALP)
") International Civil Aviation Organization WORKING PAPER FALP/10-WP/19 Revised 29/8/18 FACILITATION PANEL (FALP) TENTH MEETING Montréal, 10-13 September 2018 Agenda Item 6: Other matters FACILITATION FOR
International Civil Aviation Organization WORKING PAPER FALP/10-WP/19 Revised 29/8/18 FACILITATION PANEL (FALP) TENTH MEETING Montréal, 10-13 September 2018 Agenda Item 6: Other matters FACILITATION FOR
2013 IATA GLOBAL PASSENGER SURVEY HIGHLIGHTS
 2013 IATA GLOBAL PASSENGER SURVEY HIGHLIGHTS * The information contained in our databases and used in this presentation has been assembled from many sources, and whilst reasonable care has been taken to
Runway Length Analysis Prescott Municipal Airport
 APPENDIX 2 Runway Length Analysis Prescott Municipal Airport May 11, 2009 Version 2 (draft) Table of Contents Introduction... 1-1 Section 1 Purpose & Need... 1-2 Section 2 Design Standards...1-3 Section
Quantitative Analysis of Automobile Parking at Airports
 Quantitative Analysis of Automobile Parking at Airports Jiajun Li, M.Sc. Candidate Dr. Richard Tay, Professor, AMA/CTEP chair Dr. Alexandre de Barros, Assistant Professor University of Calgary Abstract
US explores catalytic potential of biometrics
 US explores catalytic potential of biometrics [Content preview Subscribe to Jane s Airport Review for full article] Federal agencies and aviation partners are pushing the adoption of biometrics at airports,
Appendix B Ultimate Airport Capacity and Delay Simulation Modeling Analysis
 Appendix B ULTIMATE AIRPORT CAPACITY & DELAY SIMULATION MODELING ANALYSIS B TABLE OF CONTENTS EXHIBITS TABLES B.1 Introduction... 1 B.2 Simulation Modeling Assumption and Methodology... 4 B.2.1 Runway
Efficiency and Automation
 Efficiency and Automation Towards higher levels of automation in Air Traffic Management HALA! Summer School Cursos de Verano Politécnica de Madrid La Granja, July 2011 Guest Lecturer: Rosa Arnaldo Universidad
SIMULATION S ROLE IN BAGGAGE SCREENING AT THE AIRPORTS: A CASE STUDY. Suna Hafizogullari Gloria Bender Cenk Tunasar
 Proceedings of the 2003 Winter Simulation Conference S. Chick, P. J. Sánchez, D. Ferrin, and D. J. Morrice, eds. SIMULATION S ROLE IN BAGGAGE SCREENING AT THE AIRPORTS: A CASE STUDY Suna Hafizogullari
Price-Setting Auctions for Airport Slot Allocation: a Multi-Airport Case Study
 Price-Setting Auctions for Airport Slot Allocation: a Multi-Airport Case Study An Agent-Based Computational Economics Approach to Strategic Slot Allocation SESAR Innovation Days Bologna, 2 nd December
Washington Dulles International Airport (IAD) Aircraft Noise Contour Map Update
 Aircraft Noise Contour Map Update") Washington Dulles International Airport (IAD) Aircraft Noise Contour Map Update Ultimate ASV, Runway Use and Flight Tracks 4th Working Group Briefing 8/13/18 Meeting Purpose Discuss Public Workshop input
Washington Dulles International Airport (IAD) Aircraft Noise Contour Map Update Ultimate ASV, Runway Use and Flight Tracks 4th Working Group Briefing 8/13/18 Meeting Purpose Discuss Public Workshop input
INTERNATIONAL CIVIL AVIATION ORGANIZATION AFI REGION AIM IMPLEMENTATION TASK FORCE. (Dakar, Senegal, 20 22nd July 2011)
") IP-5 INTERNATIONAL CIVIL AVIATION ORGANIZATION AFI REGION AIM IMPLEMENTATION TASK FORCE (Dakar, Senegal, 20 22nd July 2011) Agenda item: Presented by: Implementation of a African Regional Centralised Aeronautical
IP-5 INTERNATIONAL CIVIL AVIATION ORGANIZATION AFI REGION AIM IMPLEMENTATION TASK FORCE (Dakar, Senegal, 20 22nd July 2011) Agenda item: Presented by: Implementation of a African Regional Centralised Aeronautical
SIMULATION OF AN AIRPORT PASSENGER SECURITY SYSTEM. David R. Pendergraft Craig V. Robertson Shelly Shrader
 Proceedings of the 2004 Winter Simulation Conference R.G. Ingalls, M. D. Rossetti, J. S. Smith, and B. A. Peters, eds. SIMULATION OF AN AIRPORT PASSENGER SECURITY SYSTEM David R. Pendergraft Craig V. Robertson
Applicability / Compatibility of STPA with FAA Regulations & Guidance. First STAMP/STPA Workshop. Federal Aviation Administration
 Applicability / Compatibility of STPA with FAA Regulations & Guidance First STAMP/STPA Workshop Presented by: Peter Skaves, FAA Chief Scientific and Technical Advisor for Advanced Avionics Briefing Objectives
12 th Facilitation Division
 12 th Facilitation Division The Impact of the A380 Georgina Graham Manager Passenger Facilitation Introduction Significant change will be required to many aspects of existing airport infrastructure and
EN-024 A Simulation Study on a Method of Departure Taxi Scheduling at Haneda Airport
 EN-024 A Simulation Study on a Method of Departure Taxi Scheduling at Haneda Airport Izumi YAMADA, Hisae AOYAMA, Mark BROWN, Midori SUMIYA and Ryota MORI ATM Department,ENRI i-yamada enri.go.jp Outlines
Assignment 9: APM and Queueing Analysis
 CEE 4674: Airport Planning and Design Spring 2014 Assignment 9: APM and Queueing Analysis Solution Instructor: Trani Problem 1 a) An international airport has two parallel runways separated 800 meters
Air Traffic Flow Management (ATFM) in the SAM Region METHODOLOGY ADOPTED BY BRAZIL TO CALCULATE THE CONTROL CAPACITY OF ACC OF BRAZILIAN FIR
 in the SAM Region METHODOLOGY ADOPTED BY BRAZIL TO CALCULATE THE CONTROL CAPACITY OF ACC OF BRAZILIAN FIR") International Civil Aviation Organization SAM/IG/6-IP/03 South American Regional Office 21/09/10 Sixth Workshop/Meeting of the SAM Implementation Group (SAM/IG/6) - Regional Project RLA/06/901 Lima, Peru,
International Civil Aviation Organization SAM/IG/6-IP/03 South American Regional Office 21/09/10 Sixth Workshop/Meeting of the SAM Implementation Group (SAM/IG/6) - Regional Project RLA/06/901 Lima, Peru,
ARRIVAL CHARACTERISTICS OF PASSENGERS INTENDING TO USE PUBLIC TRANSPORT
 ARRIVAL CHARACTERISTICS OF PASSENGERS INTENDING TO USE PUBLIC TRANSPORT Tiffany Lester, Darren Walton Opus International Consultants, Central Laboratories, Lower Hutt, New Zealand ABSTRACT A public transport
Project: Implications of Congestion for the Configuration of Airport Networks and Airline Networks (AirNets)
") Research Thrust: Airport and Airline Systems Project: Implications of Congestion for the Configuration of Airport Networks and Airline Networks (AirNets) Duration: (November 2007 December 2010) Description:
Research Thrust: Airport and Airline Systems Project: Implications of Congestion for the Configuration of Airport Networks and Airline Networks (AirNets) Duration: (November 2007 December 2010) Description:
MODAIR. Measure and development of intermodality at AIRport
 MODAIR Measure and development of intermodality at AIRport M3SYSTEM ANA ENAC GISMEDIA Eurocontrol CARE INO II programme Airports are, by nature, interchange nodes, with connections at least to the road
Predicting Flight Delays Using Data Mining Techniques
 Todd Keech CSC 600 Project Report Background Predicting Flight Delays Using Data Mining Techniques According to the FAA, air carriers operating in the US in 2012 carried 837.2 million passengers and the
AIRPORT OF THE FUTURE
 AIRPORT OF THE FUTURE Airport of the Future Which airport is ready for the future? IATA has launched a new activity, working with industry partners, to help define the way of the future for airports. There
INNOVATIVE TECHNIQUES USED IN TRAFFIC IMPACT ASSESSMENTS OF DEVELOPMENTS IN CONGESTED NETWORKS
 INNOVATIVE TECHNIQUES USED IN TRAFFIC IMPACT ASSESSMENTS OF DEVELOPMENTS IN CONGESTED NETWORKS Andre Frieslaar Pr.Eng and John Jones Pr.Eng Abstract Hawkins Hawkins and Osborn (South) Pty Ltd 14 Bree Street,
APPLICATION OF SIMULATION MODELS IN AIRPORT FACILITY DESIGN
 Proceedings of the 2002 Winter Simulation Conference E. Yücesan, C.-H. Chen, J. L. Snowdon, and J. M. Charnes, eds. APPLICATION OF SIMULATION MODELS IN AIRPORT FACILITY DESIGN Naren Doshi Robert Moriyama
PREFACE. Service frequency; Hours of service; Service coverage; Passenger loading; Reliability, and Transit vs. auto travel time.
 PREFACE The Florida Department of Transportation (FDOT) has embarked upon a statewide evaluation of transit system performance. The outcome of this evaluation is a benchmark of transit performance that
Aircraft Noise. Why Aircraft Noise Calculations? Aircraft Noise. SoundPLAN s Aircraft Noise Module
 Aircraft Noise Why Aircraft Noise Calculations? Aircraft Noise Aircraft noise can be measured and simulated with specialized software like SoundPLAN. Noise monitoring and measurement can only measure the
Approximate Network Delays Model
 Approximate Network Delays Model Nikolas Pyrgiotis International Center for Air Transportation, MIT Research Supervisor: Prof Amedeo Odoni Jan 26, 2008 ICAT, MIT 1 Introduction Layout 1 Motivation and
PASSENGER JOURNEY. Our vision: a seamless, secure and efficient walking pace journey that is highly personalized throughout.
 NEXTT JOURNEY Our vision: a seamless, secure and efficient walking pace journey that is highly personalized throughout. 00 THROUGHOUT THE JOURNEY IDENTITY MANAGEMENT Biometrics are used to confirm identity
Forecast of Aviation Activity
 DETROIT METROPOLITAN WAYNE COUNTY AIRPORT FAR PART 150 NOISE COMPATIBILITY STUDY UPDATE CHAPTER B FORECAST OF AVIATION ACTIVITY Forecast of Aviation Activity Introduction This chapter summarizes past aviation
Simulation of disturbances and modelling of expected train passenger delays
 Computers in Railways X 521 Simulation of disturbances and modelling of expected train passenger delays A. Landex & O. A. Nielsen Centre for Traffic and Transport, Technical University of Denmark, Denmark
Predicting a Dramatic Contraction in the 10-Year Passenger Demand
 Predicting a Dramatic Contraction in the 10-Year Passenger Demand Daniel Y. Suh Megan S. Ryerson University of Pennsylvania 6/29/2018 8 th International Conference on Research in Air Transportation Outline
Validation of Runway Capacity Models
 Validation of Runway Capacity Models Amy Kim & Mark Hansen UC Berkeley ATM Seminar 2009 July 1, 2009 1 Presentation Outline Introduction Purpose Description of Models Data Methodology Conclusions & Future
On-time departure rate up. Less congestion. RFID changes ferry travel.
 On-time departure rate up. Less congestion. RFID changes ferry travel. Singapore is a key international hub and Singapore Cruise Centre Pte Ltd which manages 4 terminals, decided to improve its IT systems
TERMINAL DEVELOPMENT PLAN
 5.0 TERMINAL DEVELOPMENT PLAN 5.0 TERMINAL DEVELOPMENT PLAN Key points The development plan in the Master Plan includes the expansion of terminal infrastructure, creating integrated terminals for international,
Airport Systems: Planning, Design, and Management
 Airport Systems: Planning, Design, and Management Richard de Neufville AmedeoR. Odoni McGraw-Hill New York Chicago San Francisco Lisbon London Madrid Mexico City Milan New Delhi San Juan Seoul Singapore
Queuing analysis using Viswalk for check-in counter: Case study of Lombok Praya International Airport
 Queuing analysis using Viswalk for check-in counter: Case study of Lombok Praya International Airport Sony Sulaksono Wibowo 1,*, and Siti Raudhatul Fadilah 1 1 Bandung Institute of Technology, Study Prog.
2013 Travel Survey. for the States of Guernsey Commerce & Employment Department RESEARCH REPORT ON Q1 2013
 213 Travel Survey for the States of Guernsey Commerce & Employment Department RESEARCH REPORT ON Q1 213 May 21st 213 Table of Contents Page No. Summary of Results 1 Survey Results 2 Breakdown of departing
Transfer Scheduling and Control to Reduce Passenger Waiting Time
 Transfer Scheduling and Control to Reduce Passenger Waiting Time Theo H. J. Muller and Peter G. Furth Transfers cost effort and take time. They reduce the attractiveness and the competitiveness of public
The forecasts evaluated in this appendix are prepared for based aircraft, general aviation, military and overall activity.
 Chapter 3: Forecast Introduction Forecasting provides an airport with a general idea of the magnitude of growth, as well as fluctuations in activity anticipated, over a 20-year forecast period. Forecasting
A Multi-Agent Microsimulation Model of Toronto Pearson International Airport
 A Multi-Agent Microsimulation Model of Toronto Pearson International Airport Gregory Hoy 1 1 MASc Student, Department of Civil Engineering, University of Toronto 35 St. George Street, Toronto, Ontario
A RECURSION EVENT-DRIVEN MODEL TO SOLVE THE SINGLE AIRPORT GROUND-HOLDING PROBLEM
 RECURSION EVENT-DRIVEN MODEL TO SOLVE THE SINGLE IRPORT GROUND-HOLDING PROBLEM Lili WNG Doctor ir Traffic Management College Civil viation University of China 00 Xunhai Road, Dongli District, Tianjin P.R.
According to FAA Advisory Circular 150/5060-5, Airport Capacity and Delay, the elements that affect airfield capacity include:
 4.1 INTRODUCTION The previous chapters have described the existing facilities and provided planning guidelines as well as a forecast of demand for aviation activity at North Perry Airport. The demand/capacity
Digital twin for life predictions in civil aerospace
 Digital twin for life predictions in civil aerospace Author James Domone Senior Engineer June 2018 Digital Twin for Life Predictions in Civil Aerospace Introduction Advanced technology that blurs the lines
Passenger movement simulation in intermodal air-rail terminal
 Passenger movement simulation in intermodal air-rail terminal Antonia COKASOVA, EUROCONTROL Experimental Centre, Brétigny, France and University of Zilina, Slovakia There are numerous advantages in transferring
FACILITATION PANEL (FALP)
") International Civil Aviation Organization WORKING PAPER 23/3/16 English only FACILITATION PANEL (FALP) NINTH MEETING Montréal, 4-7 April 2016 Agenda Item 3: Amendments to Annex 9 ELECTRONIC TRAVEL SYSTEMS
International Civil Aviation Organization WORKING PAPER 23/3/16 English only FACILITATION PANEL (FALP) NINTH MEETING Montréal, 4-7 April 2016 Agenda Item 3: Amendments to Annex 9 ELECTRONIC TRAVEL SYSTEMS
Aviation Trends. Quarter Contents
 Aviation Trends Quarter 1 2013 Contents Introduction 2 1 Historical overview of traffic 3 a Terminal passengers b Commercial flights c Cargo tonnage 2 Terminal passengers at UK airports 7 3 Passenger flights
ANALYSIS OF THE CONTRIUBTION OF FLIGHTPLAN ROUTE SELECTION ON ENROUTE DELAYS USING RAMS
 ANALYSIS OF THE CONTRIUBTION OF FLIGHTPLAN ROUTE SELECTION ON ENROUTE DELAYS USING RAMS Akshay Belle, Lance Sherry, Ph.D, Center for Air Transportation Systems Research, Fairfax, VA Abstract The absence
Special edition paper Development of a Crew Schedule Data Transfer System
 Development of a Crew Schedule Data Transfer System Hideto Murakami* Takashi Matsumoto* Kazuya Yumikura* Akira Nomura* We developed a crew schedule data transfer system where crew schedule data is transferred
Optimizing process of check-in and security check at airport terminals
 Optimizing process of check-in and security check at airport terminals Jaromír Široký 1,*, and Pavlína Hlavsová 1 1 University of Pardubice, Faculty of Transport Engineering, Department of Transport Technology
Wake Turbulence Research Modeling
 Wake Turbulence Research Modeling John Shortle, Lance Sherry Jianfeng Wang, Yimin Zhang George Mason University C. Doug Swol and Antonio Trani Virginia Tech Introduction This presentation and a companion
TRANSPORTATION RESEARCH BOARD. Passenger Value of Time, BCA, and Airport Capital Investment Decisions. Thursday, September 13, :00-3:30 PM ET
 TRANSPORTATION RESEARCH BOARD Passenger Value of Time, BCA, and Airport Capital Investment Decisions Thursday, September 13, 2018 2:00-3:30 PM ET Purpose Discuss research from the Airport Cooperative Research
Automated Border Control. AFI-SECFAL meeting 24 May 2017, Gaborone (Botswana)
") Automated Border Control AFI-SECFAL meeting 24 May 2017, Gaborone (Botswana) Background The need to facilitate smooth and secure border crossings will continue to rise significantly, especially at airports.
Automated Border Control AFI-SECFAL meeting 24 May 2017, Gaborone (Botswana) Background The need to facilitate smooth and secure border crossings will continue to rise significantly, especially at airports.
1. Introduction. 2.2 Surface Movement Radar Data. 2.3 Determining Spot from Radar Data. 2. Data Sources and Processing. 2.1 SMAP and ODAP Data
 1. Introduction The Electronic Navigation Research Institute (ENRI) is analysing surface movements at Tokyo International (Haneda) airport to create a simulation model that will be used to explore ways
Including Linear Holding in Air Traffic Flow Management for Flexible Delay Handling
 Including Linear Holding in Air Traffic Flow Management for Flexible Delay Handling Yan Xu and Xavier Prats Technical University of Catalonia (UPC) Outline Motivation & Background Trajectory optimization
A 3D simulation case study of airport air traffic handling
 A 3D simulation case study of airport air traffic handling Henk de Swaan Arons Erasmus University Rotterdam PO Box 1738, H4-21 3000 DR Rotterdam, The Netherlands email: hdsa@cs.few.eur.nl Abstract Modern
7 Ways Face Recognition Can Unlock A Secure, Frictionless and Personalized Travel Experience COURTESY OF A SINGLE, UNIFIED BIOMETRIC KEY
 7 Ways Face Recognition Can Unlock A Secure, Frictionless and Personalized Travel Experience COURTESY OF A SINGLE, UNIFIED BIOMETRIC KEY INTRODUCTION Boarding a plane used to be the exciting start to any
Performance and Efficiency Evaluation of Airports. The Balance Between DEA and MCDA Tools. J.Braz, E.Baltazar, J.Jardim, J.Silva, M.
 Performance and Efficiency Evaluation of Airports. The Balance Between DEA and MCDA Tools. J.Braz, E.Baltazar, J.Jardim, J.Silva, M.Vaz Airdev 2012 Conference Lisbon, 19th-20th April 2012 1 Introduction