This report, and information or advice which it contains, is prov ded by MVA Consultancy Ltd solely for internal use and reliance by ts Client in
|
|
|
- Tyrone Sharp
- 5 years ago
- Views:
Transcription
1
2 This report, and information or advice which it contains, is prov ded by MVA Consultancy Ltd solely for internal use and reliance by ts Client in performance of MVA Consultancy Ltd s duties and liabilities under ts contract with the Client. Any advice, opin ons, or recommendat ons within this report should be read and relied upon only in the context of the report as a whole. The advice and opinions in this report are based upon the informat on made available to MVA Consultancy Ltd at the date of this report and on current UK standards, codes, technology and construction practices as at the date of this report. Following final delivery of this report to the Client, MVA Consultancy Ltd will have no further obligations or duty to advise the Client on any matters, including development affecting the information or advice provided in this report. This report has been prepared by MVA Consultancy Ltd in their professional capacity as Consultants. The contents of the report do not, in any way, purport to include any manner of legal adv ce or opinion. This report is prepared in accordance w th the terms and conditions of MVA Consultancy Ltd s contract with the Client. Regard should be had to those terms and conditions when cons dering and/or placing any reliance on this report. Should the Client wish to release this report to a Third Party for that party's reliance, MVA Consultancy Ltd may, at its discretion, agree to such release provided that: (a) MVA Consultancy Ltd's written agreement is obtained prior to such release, and (b) by release of the report to the Third Party, that Third Party does not acquire any rights, contractual or otherwise, whatsoever against MVA Consultancy Ltd and MVA Consultancy Ltd, accordingly, assume no duties, liabil ties or obligations to that Third Party, and (c) MVA Consultancy Ltd accepts no responsibility for any loss or damage incurred by the Client or for any conflict of MVA Consultancy Ltd's interests arising out of the Client's release of this report to the Third Party.
3
4 Contents 6.2 Current Rail Services and Demand Future Year Rail Services and Demand Without HS Initial HS2 Option Assessment Options for Serving City Centres Options to Serve both Derby and Nottingham Final Options Enhancing the Toton Option using classic-compatible Services Summary 60 7 South Yorkshire Overview Current Rail Services and Demand Future Year Rail Services and Demand Without HS Initial HS2 Option Assessment Meadowhall vs. Sheffield Victoria Loop classic-compatible Spur to Sheffield Midland Summary 79 8 Leeds Overview Current Rail Services and Demand Future Year Rail Services and Demand Without HS HS2 Options Summary 88 9 Joining the East Coast Mainline Overview Current Rail Services and Demand Future Year Rail Services and Demand Without HS HS2 Options Summary HS2 Service Pattern Optimisation Introduction Approach to Optimising Service Patterns Optimising HS2 Service Patterns in the West Optimising HS2 Service Patterns in the East Summary of Proposed Service Pattern HS2 and Released Capacity Service Specification Overview Initial Assessment of Released Capacity Initial Specifications of Conventional Lines Optimising the Conventional Service Specification 106 2
5 Contents 11.5 Final Released Capacity Specifications 109 Tables Table /11 Weekday Rail Trips to and from Manchester 10 Table Weekday Rail Trips to and from Manchester 12 Table Weekday Rail Trips without HS2 from Manchester Area to London for Noninterchanging Passengers (One-way) 14 Table Weekday Rail Trips without HS2 from Stockport Station to London for non-interchanging passengers (One-way) 15 Table Weekday Rail Trips to London from Manchester Piccadilly and Salford Central 17 Table 3.6 Economic Benefits and Revenues for Salford Central and Manchester Interchange Scenario 18 Table 3.7 Economic Benefits and Revenues of South Manchester Interchange Station compared to No Interchange Station 19 Table /11 Weekday Rail Trips to and from Liverpool 23 Table Weekday Rail Trips to and from Liverpool 25 Table HS2 boarding Daily Demand on Liverpool/ North West Southbound Services in the Base Case 28 Table 4.4 Average Weekday 2043 Southbound Load Factors on HS2 Trains to London from Liverpool for the Base Case 29 Table 4.5. HS2 boarding Daily Demand on Liverpool/ North West Southbound Services for the Base Case and Enhanced Base Case 30 Table 4.6 HS2 boarding Daily Demand on Liverpool/ North West Southbound Services for the Base Case, Enhanced Base Case and Warrington Option 32 Table 4.7 Average Weekday 2043 Southbound Load Factors on HS2 Trains to London from Liverpool for the Base Case and Warrington Option 32 Table 4.8 HS2 boarding Daily Demand on Liverpool/ North West Southbound Services for the Enhanced Base Case and Crewe Option 34 Table 4.9 Average Daily 2043 Southbound Load Factors on HS2 Trains to London from Liverpool for Reference Scenario and Crewe Connection Scenario 35 Table /11 Weekday Rail Trips to and from Warrington, Wigan and Preston 39 Table Weekday Rail Trips to and from Warrington, Wigan and Preston 40 Table 5.3 Benefits, Revenues and Costs of Options 42 Table 5.4 Benefits, Revenues and Costs with Lower Demand Assumptions for Scotland 43 Table /11 Weekday Rail Trips to and from Nottingham, Leicester and Derby 46 Table Weekday Rail Trips to and from Nottingham, Leicester and Derby 48 Table Weekday Rail Trips to London and Birmingham from a Spur serving Nottingham 54 Table 6.4 Revenues and Benefits for Options Service Nottingham and Derby 54 Table 6.5 Revenues and Benefits for Derby Through versus Nottingham Spur 54 Table /11 Weekday Rail Trips to and from Sheffield 65 Table Weekday Rail Trips to and from Sheffield 67 Table Weekday Rail Trips from Sheffield to Main HS2 Destinations 70 Table 7.4 Costs and Benefits of Sheffield Midland Through, Loop and Spur Options 70 Table Weekday Rail Trips from Sheffield Victoria and Meadowhall to Main HS2 Destinations 75 3
6 Contents Table 7.6 Daily 2043 Southbound Weekday Rail Trips on Trains to London from South Yorkshire for Meadowhall Scenario and Replacement classic-compatible Services 77 Table 7.7 Average Daily 2043 Southbound Demand on Trains to London from South Yorkshire for Meadowhall Scenario and Additional classic-compatible Service Scenario 79 Table /11 Weekday Rail Trips to and from Leeds 83 Table Weekday Rail Trips to and from Leeds 85 Table 8.3 Benefit Components for the Leeds Station Options compared to Leeds Station North Option 87 Table 8.4 Total Benefits Components and Costs for the Leeds Station Options compared to Leeds Station North Option 88 Table /11 Weekday Rail Trips to and from Newcastle, Darlington and York 91 Table Weekday Rail Trips to and from Newcastle, Darlington and York 91 Table 9.3 Daily Rail Demand from the North East to London with and without HS2 in Figures Figure 1.1 Indicative Map of Proposed HS2 Y Network 2 Figure 3.1 Manchester Location Map 9 Figure 3.2 Concentrations of daily Rail Demand in the Manchester Area (Source: NRTS) 11 Figure 3.3 Access to Manchester Piccadilly Station by Car (Source: PFM) 13 Figure 3.4 Access to Manchester Piccadilly Station by Public Transport (Source: PFM) 14 Figure 3.5 HS2 Service Specification with Manchester Interchange 19 Figure 4.1 The Liverpool and Wider North West Study Area 22 Figure 4.2 Long-distance Rail Demand in Liverpool and the Wider North West (Source NRTS) 24 Figure 4.3 Access to Liverpool, Runcorn, Warrington, Crewe and Stafford Stations by Car (Source: PFM) 26 Figure 4.4 Access to Liverpool, Runcorn, Warrington, Crewe and Stafford Stations by Public Transport (Source: PFM) 26 Figure 4.5 HS2 Service Specification: Base Case 28 Figure 4.6 HS2 Service Specification: Enhanced Base Case 29 Figure 4.7 HS2 Service Specification: Warrington Option 31 Figure 4.8 HS2 Service Specification: Crewe Option 34 Figure 5.1 Joining the West Coast Main Line Location Map 38 Figure 5.2 Existing Long-distance Services from the North West 39 Figure 5.3 HS2 Service Specification for Options Serving Scotland 41 Figure 6.1 The East Midlands Location Map 45 Figure 6.2 Long-distance Rail Demand in the East Midlands (Source: NRTS) 47 Figure 6.3 Access to Derby Station by Car (Source: PFM) 49 Figure 6.4 Access to Derby Station by Public Transport (Source: PFM) 49 Figure 6.5 Access to Nottingham Station by Car (Source: PFM) 50 Figure 6.6 Access to Nottingham Station by Public Transport (Source: PFM) 50 Figure 6.7 Access to Leicester Station by Car (Source: PFM) 51 Figure 6.8 Access to Leicester Station by Public Transport (Source: PFM) 51 Figure 6.9 Access to Derby Station Demand for Derby Through Scenario (Source: PFM) 56 Figure 6.10 Source of 2043 Demand for HS2 with a HS2 Station at Toton (Source: PFM) 57 Figure 6.11 HS2 Service Specification: Additional classic-compatible Service Scenario between Derby and London 59 4
7 Contents Figure 6.12 HS2 Service Specification: Additional classic-compatible Services Scenario between Nottingham and London and Nottingham and Birmingham 59 Figure 7.1 South Yorkshire Location Map 64 Figure 7.2 Long-distance Rail Demand in South Yorkshire (Source: NRTS) 66 Figure 7.3 Access to Sheffield Midland Station by Car (Source: PFM) 68 Figure 7.4 Access to Sheffield Midland Station by Public Transport (Source: PFM) 68 Figure 7.5 HS2 Service Specification: Meadowhall Option 72 Figure 7.6 HS2 Service Specification: Sheffield Victoria Loop Option 73 Figure 7.7 Source of 2043 Rail demand for HS2 from South Yorkshire to London with an HS2 Station at Meadowhall (Source: PFM) 74 Figure 7.8 Source of 2043 Rail demand for HS2 from South Yorkshire to London with an HS2 Station at Sheffield Victoria (Source: PFM) 74 Figure 7.9 HS2 Service Specification: Replacement classic-compatible Services 76 Figure 7.10 HS2 Service Specification: Additional classic-compatible Services 78 Figure 8.1 Leeds Study Area 82 Figure 8.2 Long-distance Rail Demand in Leeds (source: NRTS) 84 Figure 8.3 Access to Leeds Station by Car (Source: PFM) 86 Figure 8.4 Access to Leeds Station by Public Transport (Source: PFM) 86 Figure 9.1 Joining the East Coast Main Line: Area of Study 90 Figure 9.2 HS2 Service Specification: Base Option 93 Figure 9.3 HS2 Service Specification: Option 1 (Garforth and York) 94 Figure 9.4 HS2 Service Specification: Option 2 (Garforth, no York) 95 Figure 9.5 HS2 Service Specification: Option 3 (York Bypass) 96 Figure 9.6 HS2 Service Specification: Option 4 (York Bypass with Knaresborough Interchange station) 97 Figure 10.1: Base Service Pattern for West Side Services and Average Load Factors 100 Figure 10.2 Base Service Pattern and Load Factor for Birmingham Trains to the North West 101 Figure 10.3 Base Service Pattern for East Side Services and Average Load Factors 102 Figure 10.4 Phase Two HS2 Service Pattern 104 Figure 11.1 Service Re-specifications 110 Figure 11.2 Service Truncations and Diversions 111 Figure 11.3 Use of Released Capacity 112 5
8
9 1 Introduction Figure 1.1 Indicative Map of Proposed HS2 Y Network 1.2 Structure of Report The following chapter summarises the optioneering process. Subsequent chapters consider each of the areas through which the proposed HS2 scheme passes: Western Leg Chapter 3 Chapter 4 Chapter 5 Manchester Liverpool and the Wider North West Joining the West Coast Main Line (WCML) Eastern Leg Chapter 6 Chapter 7 East Midlands South Yorkshire 2
10 1 Introduction Chapter 8 Chapter 9 Leeds Joining the East Coast Main Line (ECML) Rail Service Specification Optimisation Chapter 10 Chapter 11 Optimising the HS2 service pattern Optimising the Conventional Rail Service patterns The final released capacity specification is given in Appendix A. 3
11
12 2 The Optioneering Process 2.3 Demand Forecasting Framework The optioneering process took place over a 13-month period in a series of stages, informed by demand forecasting and appraisal work. At the end of each stage, HS2 Ltd decided which options were taken forward. At each stage, further investigation was undertaken and information became available on the remaining options. The stages were as follows: - Stage 1 Longlist of options - Stage 2 Shortlisting stations and types of route - Stage 2.5 Further refinement of shortlist - Stage 3 Preferred package Following completion of Stage 3, further modelling work was carried out to optimise the conventional rail service specifications in light of the introduction of HS2 services which would attract passengers from the conventional network and release capacity; the further modelling also optimised the exact specification of HS2 services The demand forecasting and appraisal work has drawn heavily on transport modelling outputs. The model used for analysing demand, called the PLANET Framework Model (PFM), is based on the PLANET Long-distance (PLD) model, which in turn is based on specialist transport-planning software. This has been developed for HS2 Ltd, and is based on PLANET Strategic, which was developed in 2000 for the Department for Transport. Further details on PFM are included in the Model Development and Baseline Report, HS2 to West Midlands, April and the Options for Phase 2 of the high speed rail network PLANET modelling framework, model development report PfM V3 which is available at The model was enhanced throughout the optioneering process, with a particular focus on the areas served by HS2. Much of the early work, up to and including Stage 2.5, relied on a model version developed to assess Phase One of the scheme. This model was suitable for comparison of through, loop or spur city-centre station options The updated model was primarily available for Stage 3 with enhancements at a local level informed by early engagement with delivery partners. In some cases, this affected input data, such as journey times from zones to stations, and in others, more fundamental changes to the model structure. In all cases, base-year demand data and demand forecasts were consistent with those published in the 2011 public consultation (with a cap year of 2043). While subsequent updates to these forecasts may have affected the overall case for HS2, they are unlikely to have substantially affected the relative attractiveness of different options When looking at the catchment areas in the following chapters, it should be noted that the model is focused on public transport, with around 36% of total demand accessing the rail network in the No HS2 scenario doing so by highway, and the remainder by public 4 Jan2012.pdf 5
13 2 The Optioneering Process transport. This is a reflection of the assumptions made about access modes for each of the nine trip purposes 5 in the PFM model Further details of the changes made to the model are provided in the Model Development and Baseline Report, HS2 London West Midlands, April Demand and Appraisal Optioneering Outputs A range of outputs from demand forecasting and appraisal of the various scheme options have informed HS2 s route alignment and station location decisions, including forecasts of: - HS2 (and conventional rail) demand; - economic benefits; - revenue; and - benefit-to-cost ratios (BCRs) Forecast levels of demand, economic benefits and revenue have been estimated using the HS2 PFM (as discussed above) Capital and operating cost estimates quoted in this report and used in calculating BCRs have been estimated by HS2 engineers. Costs quoted in the report are the costs used at the time of analysis. 2.5 Steps in the Optioneering Process The Optioneering Process initially considered each area of interest separately. For areas where there were several possible locations for an HS2 station, the following process was followed: The market size of the different cities was considered to inform the viability of different train service levels in each area. The catchment area of each possible location was plotted to understand the attractiveness of the different locations. Modelling work was undertaken using the PFM, and the model outputs were analysed to understand the impact of different journey times on demand. The forecast economic benefits, revenue and BCRs of each option were assessed This analysis fed into the shortlisting process, along with the engineering assessment of whether routes were feasible and the estimated costs of the route alignments Optioneering activities were undertaken in the context of assumed HS2 and conventional rail service specifications. This was appropriate for shortlisting options, but once the station locations had been narrowed down within each area (and in light of the resulting forecast 5 The nine purposes are car available to the station, car available from the station and no car available for each of business, leisure and commuting purposes. 6 Jan2012.pdf 6
14 2 The Optioneering Process levels and patterns of rail demand), consideration was given to optimising the conventional rail network and the overall HS2 service specification Given the inter-relationships between HS2 and conventional service classifications in terms of both capacity and demand, their optimisation was undertaken in parallel We are confident that the early decisions on station location were not affected by the reoptimisation. Decisions were revisited where appropriate to consider evidence emerging from the re-optimisation The remaining chapters provide more details on the optioneering process in each of the areas of interest. 7
15

16 3 Manchester 3.2 Current Rail Services and Demand The city of Manchester sits at the centre of the large, and predominately urban, administrative area of Greater Manchester. The conurbation had around 2.6 million residents in The current rail network is focused around two primary central Manchester stations Piccadilly and Victoria. Manchester Piccadilly is the principal station, with fast and frequent long-distance services to most cities in the UK, as well as local services. Manchester Victoria services are more local and many share stops with Salford Central and Salford Crescent, which have played a more important role in recent years as regeneration of this area continues. A substantial number of regional and local services that call at Manchester Piccadilly also serve Oxford Road, a smaller station with a strong role in serving the business and university areas of the city. The area of interest is illustrated in Figure 3.1. Figure 3.1 Manchester Location Map Manchester Victoria and Manchester Piccadilly are linked by the Metrolink tram service, which has an expanding network that links into northern, southern and western areas of the conurbation Many of Manchester s long-distance services are on the West Coast Main Line, with all of these services calling at Stockport to the south of Manchester and continuing to principal destinations. Services to London consist of three trains per hour (tph), with Macclesfield, Stoke, Milton Keynes, Crewe and Wilmslow varyingly served as intermediate stations. Other notable services include half-hourly services to Birmingham and the South, services to Scotland and North England, and four trains per hour via Huddersfield to Leeds and the East. 9
17 3 Manchester The wider catchment area of Greater Manchester and Cheshire (bounded by Preston to the north and Crewe to the south) has the following service pattern for London services: Preston 1tph Wigan North Western 1tph Warrington Bank Quay 1tph Manchester Piccadilly 3tph Stockport 3tph Wilmslow 1tph Macclesfield 1tph Crewe 2tph The maximum distance between any of the stations listed above is 50 miles (Preston- Crewe). The distance between many of the station pairs is much smaller, which means that average access distances within the catchment area for long-distance London services are low: the majority of passengers in the North West benefit from an attractive local service to London. This is particularly true of the high-yield south Manchester/Cheshire market, with Stockport, Macclesfield and Wilmslow all benefiting from good links to the capital We now consider the current levels of demand. Table 3.1 shows 2010/11 numbers of weekday rail trips to and from Manchester and a range of key long-distance stations derived from the PFM. Table /11 Weekday rail trips to and from Manchester Manchester to: Weekday rail trips (two-way) London 8,400 Birmingham 1,300 Leeds 3,300 Liverpool 5,300 Crewe 1,500 Glasgow 400 Edinburgh 400 Note: The daily trips are rounded to the nearest 100 trips if over 100, and to the nearest 10 trips if less than 100. All trips come from PFM The destination with the greatest long-distance demand to and from Manchester is London, with 8,400 trips being made on average on each weekday. There are also high numbers of trips made to Leeds and Liverpool. However, more importantly for the location of a HS2 10

18 3 Manchester station, we need to understand the distribution of the ultimate origins and destinations of this demand for long-distance rail in Manchester To inform the identification of the location of the high speed rail station, we need to understand the travel origins and destinations of people who might use high speed rail. In doing so, we consider long-distance rail trips (i.e. more than 50 miles), as this represents the main market for high speed rail; and business and leisure trips, as these make up the vast majority of long-distance rail trips An analysis of the total demand for long-distance rail travel is shown in Figure 3.2. The figure is based on National Rail Travel Demand Survey (NRTS) data from 2004/5 and shows concentrations of high daily rail demand in central Manchester (around Manchester Piccadilly and Manchester Victoria stations), as well as in south Manchester. The area near Manchester Airport is also a significant generator of long-distance rail demand, as is the area of Cheshire to south of the airport. Figure 3.2 Concentrations of daily rail demand in the Manchester Area (Source: NRTS) 3.3 Future Year Rail Services and Demand Without HS In the 2043 forecast year, without HS2, the long-distance 2043 services to and from Manchester are expected to be broadly similar to the current services, with the same 11
19 3 Manchester destinations served. The most significant changes programmed are those associated with the Northern Hub and associated electrification schemes. These will see faster journey times on the East-West Trans-Pennine routes and some local routes, and a more intensive usage of Manchester Victoria station for these services. Services to Preston, Liverpool, Leeds and Chester should see the greatest benefits Looking at passenger demand in 2043, Table 3.2 shows the number of forecast weekday rail trips to and from Manchester and the same key long-distance stations as were shown in Table 3.1. The rail demand has been taken from the PFM. Table Weekday rail trips to and from Manchester Manchester to: Weekday rail trips (two-way) London 15,300 Birmingham 2,100 Leeds 3,300 Liverpool 5,300 Crewe 1,500 Glasgow 400 Edinburgh 600 Note: The daily trips are rounded to the nearest 100 trips if over 100 and the nearest 10 trips if less than 100. All trips come from PFM Most noticeable is the significant growth in demand to and from London, Leeds, Crewe and Birmingham compared to the present day. Manchester to London, for example, increases from a two-way flow of 8,400 to 15,300, representing an increase of over 80%. Flows between Manchester and Birmingham, Leeds and Crewe register increases of 800 (60%), 1,700 (50%) and 900 (60%), respectively In order to better understand these markets and how HS2 might best serve them, work was undertaken to understand the travel patterns around Manchester, and in particular to understand more about how the true origins and destinations of long-distance rail passengers in the Manchester area were likely to influence decisions over HS2 service and station provision. 12

20 3 Manchester Figure 3.3 shows where the passengers who access Manchester Piccadilly station for longdistance rail journeys by car come from. Figure 3.4 shows where the passengers who access Manchester Piccadilly station for long-distance rail journeys by public transport come from. The two figures are at the same scale. They show that the highest concentrations of those accessing Manchester Piccadilly 7 by car generally start their journey from areas fairly close to the station, while those accessing by public transport cover a much wider area around Manchester, particularly in the area to the southwest. Figure 3.3 Access to Manchester Piccadilly Station by car (Source: PFM) 7 Manchester stations include Manchester Piccadilly, Manchester Oxford Road, Manchester Victoria and Salford Central. In this analysis, focusing on trips to London, nearly all passengers would be expected to choose Manchester Piccadilly for access to long-distance services. 13
 the")
21 3 Manchester Figure 3.4 Access to Manchester Piccadilly Station by public transport (Source: PFM) Table 3.3 shows (for 2043 without HS2) the originating area within Manchester of noninterchanging passengers (i.e. not including those who are modelled as accessing their longdistance rail journey by connecting rail service) from Manchester stations to Greater London destination stations. Table Weekday rail trips without HS2 from Manchester Area to London for non-interchanging passengers (one-way) Area Weekday rail trips (one-way) Manchester 6,600 Oldham 200 South Lancashire 70 Others 50 Note: The daily trips are rounded to the nearest 100 trips if over 100 and the nearest 10 trips if less than 100. All trips come from PFM The values in the table illustrate that for this key market, non-interchanging demand at Manchester stations comes from a fairly narrow catchment area, with the vast majority of demand coming from the Manchester modelling zone (which includes the local authorities of Manchester, Salford, Trafford and Bury). This reflects non-interchanging demand; many London trips from areas such as Bolton, Rochdale and Oldham will also use Manchester 14
22 3 Manchester Piccadilly to access London rail services. However, these trips will be connecting using the local rail network and therefore do not appear in the above analysis The absence of any significant level of longer-distance direct access to Manchester Piccadilly for London services is unsurprising for two reasons. Firstly, many passengers will use local rail services to access Piccadilly and therefore do not appear in the non-interchanging demand figures. Secondly, the North West is well served by the Intercity West Coast franchise and people can optimise their choice of origin station, as they have a significant number of options Evidence of this optimisation of origin-station choice is also seen in the analysis in Table 3.4, which shows the equivalent information for Stockport station in The station effectively acts as a South Manchester parkway -type station, serving not only the sizeable Stockport zone demand, but also the southern parts of Manchester, in particular Trafford (to the west of Stockport). The analysis also shows that Stockport does not attract significant levels of demand from the South and West of the station. Analysis of Wilmslow, Crewe and Macclesfield stations shows that they offer preferable options for much of this market. Table weekday rail trips without HS2 from Stockport station to London for non-interchanging passengers (one-way) Area Weekday rail trips (one-way) Stockport 1,400 Manchester 700 Derbyshire East 90 Tameside 90 Others 110 Note: The daily trips are rounded to the nearest 100 trips if over 100 and the nearest 10 trips if less than 100. All trips come from PFM From the analysis undertaken, we better understand the characteristics of prospective users of HS2: Public transport connectivity is important; the majority of long-distance passengers access Central Manchester stations by public transport or on foot. A lot of long-distance demand is concentrated on the city centre, but there is also significant demand for long-distance journeys to London from the south of the conurbation. The North West has very good rail links to London. This means passengers average access distances to stations are relatively short, particularly in the important south Manchester market. 15
23 3 Manchester 3.4 Initial HS2 Option Assessment In determining appropriate HS2 provision for Manchester, early options for city-centre stations were widely spread, including options around Salford Quays to the west of the city. During this stage, heavy emphasis was placed on the engineering and sustainability impacts of these stations. However, since several sites were some distance from the central business district, HS2 Ltd also needed to understand the potential impacts on accessibility of these stations Demand analysis was undertaken at the shortlisting stage. Data from the National Accessibility Model and National Rail Travel Survey (NRTS) were used to understand the demand-weighted average access time to each potential station location. This provided some indication of the potential scale of differences and therefore the implications of stations on less accessible sites Although the analysis did not show a large variation in highway access times, it highlighted the considerable variation in access times by public transport. Options around Salford Quays to the west of the city were shown to be considerably less accessible by public transport than options in the city centre. In particular, options to the west of the city would impose additional access time on passengers whose ultimate origin or destination was in the city centre itself. 3.5 Preferred Station Options Taking into account sustainability and engineering assessments, HS2 Ltd identified three potential station options: two clustered around Salford Central station and one to the east of Manchester Piccadilly. Analysis was conducted on these options, with extensive challenge and sense checking conducted using Transport for Greater Manchester s public transport model to ensure that local access and distribution of demand reflected the widest possible evidence base These model tests concluded that Manchester Piccadilly would provide the strongest economic case, with overall benefits being around 870 million higher and revenues around 750 million higher The Manchester Piccadilly option performed more strongly than the Salford Central option because: long-distance rail demand to and from the city centre is concentrated more towards the southern-eastern side of the city centre. Piccadilly benefits from more extensive public transport connectivity compared to Salford Central, particularly tram and local rail connectivity; Crucially, Piccadilly has better public transport links to the south of the conurbation, including Trafford, Stockport and parts of Cheshire. As Table 3.5 shows, Piccadilly would capture more of the Manchester, Stockport and Macclesfield markets, while Salford Central benefits areas to the north of the conurbation (e.g. Bolton). 16
24 3 Manchester Table Weekday rail trips to London from Manchester Piccadilly and Salford Central Area: Manchester Piccadilly (base case) Salford Central Difference Blackburn % Bolton % Macclesfield % Manchester 3,011 2,841-6% Oldham % Rochdale % Stockport % Tameside % Wigan % Total 4,485 3,921-13% 3.6 Impact of interchange stations on the choice of city-centre station The analysis of city-centre stations demonstrated that the market for the centre and south of Manchester was an important factor in the choice of station. Since Salford Central was not well connected to the southern markets, it was a relatively unattractive proposition from passengers perspectives. However, including an interchange station in combination with a Salford Central location had the potential to change this An interchange station around the southern edge of Manchester had the potential to capture this key market in combination with a Salford Central station. Tests were conducted to consider whether this combination might change conclusions around the city-centre stations. These tests ignored the question of whether the interchange itself was desirable, and whether the line of route to serve both Salford and an idealised interchange station (around the southern edge of Manchester) would be attractive. In this sense they were tests of concepts, rather than tests of real design proposals. The results of these tests are shown in Table
25 3 Manchester Table 3.6 Economic benefits and revenues for Salford Central and Manchester interchange scenario Benefits Revenues Salford Central with interchange v. Salford Central 574 million 650 million Salford Central with interchange v. Manchester Piccadilly only million - 90 million Adding an interchange station to the Salford city-centre station would add around 570 million in benefits and 650 million in revenue. These benefits are primarily gained through improving access to HS2 for the South Manchester market However, the combination of Salford Central plus an interchange station still generated lower overall benefits and revenue than the Piccadilly city-centre option without an interchange station. Although the interchange would provide better access for the south Manchester market, Piccadilly remains slightly more accessible to the important central Manchester market. In addition, trains stopping at the interchange would increase journey times for those travelling on to central Manchester, which further reinforces the benefits of Piccadilly. Overall, therefore, interchange stations are unlikely to change conclusions on city-centre stations The next section looks at the desirability of an interchange station, given that Manchester Piccadilly is the choice of the city-centre station. 3.7 The Case for a South Manchester Interchange station A wide range of options for interchange stations were identified by HS2 Ltd. Many of these were eliminated as the line of route developed and following assessment of engineering and sustainability impacts Two main options were modelled in more detail for the location of a South Manchester Interchange station: a station near Manchester Airport, and a further option located by the M6 motorway near Knutsford. Both options were assumed to have the same journey times and service specification. There were alternative locations for both options; however, these were close enough to be considered as single options for demand forecasting purposes The service specification included in these tests assumed all Manchester trains would call at South Manchester interchange, and that this additional station call would increase HS2 journey times to/from central Manchester by five minutes. The modelled journey times are shown in the service specification in Figure 3.5. Passengers were assumed to be limited to long-distance trips (i.e. local trips between the interchange station and central Manchester were not allowed within the model). 18

26 3 Manchester Notes: 1. Each line represents one train per hour 2. Journey times are those assumed in the demand modelling Figure 3.5 HS2 service specification with Manchester interchange The benefit of an interchange station is to improve accessibility to passengers on the outskirts of Manchester and surrounding areas, which is an important market. However, there are drawbacks to the inclusion of the interchange station, including longer journey times for passengers travelling through the station on trains which stop, and the extent to which the station draws new passengers to HS2 or just leads to abstraction of demand from other HS2 stations in the area. Whether an interchange station adds to the overall case for HS2 depends on the trade-off between these two factors The expected economic benefits and revenues of the two tests, examining the impacts of a Manchester interchange station in combination with Manchester Piccadilly, are given in Table 3.7. In both cases, the results are compared against the reference case of Manchester Piccadilly station with no interchange station. Table 3.7 Economic benefits and revenues of South Manchester interchange station compared to no interchange station Benefits Revenues Manchester Piccadilly with Airport interchange Manchester Piccadilly with Knutsford interchange 152 million 187 million million million Present value in 2009 prices 19
27 3 Manchester As the results show, an airport location for the interchange performs much more strongly than a Knutsford location. There are two primary reasons for this Firstly, a station near Manchester Airport lies within an area of significant demand for longdistance travel. The airport is well located for the important catchment areas of Trafford, South Manchester, Stockport and eastern Cheshire, markets that are well served at present by direct London services from Stockport, Macclesfield and Wilmslow. A station near Manchester Airport minimises access times Secondly, a station close to Manchester Airport can take advantage of good motorway links, as well as the extensive public transport connectivity offered by the airport ground transport interchange, which provides bus, conventional rail and tram connections to the south Manchester conurbation. By comparison, the Knutsford interchange location would be well located for the M6 motorway, but is sited in an area of poor public transport connectivity Knutsford interchange is also located further from the core catchment of a South Manchester interchange station, which makes the station less attractive. The benefits of the faster journey times on HS2 are in part eroded by the longer access times required to access the station, particularly for passengers from South Manchester, Trafford and Stockport For the airport option, the benefits to the South Manchester market are sufficient to offset the reduction in benefits for passengers who continue to use the central Manchester HS2 station. For the Knutsford option, the location is further from the core catchment area of Stockport, South Manchester and Trafford. The longer access times make the station less attractive, and the patronage gained is insufficient to offset the dis-advantages for through passengers. 3.8 Summary Initial option assessment identified three potential station options, two clustered around the Salford Central station, and one to the east of Manchester Piccadilly station. Model tests concluded that Manchester Piccadilly would provide the strongest economic case Next consideration was given to an interchange station designed to capture the South Manchester/Cheshire markets. Two main options were for the location of a South Manchester Interchange station: a station in the vicinity of Manchester Airport, and a further option located by the M6 motorway near Knutsford. Of the two options Manchester Airport provided more benefits than a Knutsford location Consideration was given as to whether the addition of an interchange station to Salford Central station would alter the case for Manchester Piccadilly station; however, this did not change the conclusion that Manchester Piccadilly station was the preferred city-centre station A test adding Manchester Airport interchange station to Manchester Piccadilly station suggested that an interchange station near Manchester Airport would provide net user benefits and revenues. However, marginal changes in both our assumptions and costs can move this element from a low to a high incremental value for money. This means that it is difficult to use the demand and appraisal results to come to a firm conclusion on Manchester Airport interchange station. 20
28

29 4 Liverpool and the Wider North West Figure 4.1 The Liverpool and Wider North West study area The rail network focused on Liverpool consists of two distinct operations: local services, and long-distance and inter-urban services. Long-distance and inter-urban services are concentrated on Liverpool Lime Street station. Liverpool is also served by the Merseyrail network of local services, which provides high-frequency services to the city centre via three lines and four underground stations, including Liverpool Lime Street Long-distance services to London are focused on the West Coast Main Line, with all services calling at Runcorn. There is one train to London per hour, typically with stops at Runcorn and Stafford. During the peak some additional trains run, and at the start and end of the day there is some variation to the stopping pattern, with Crewe having additional stops. Other notable services include half-hourly services to Birmingham and three fast trains an hour to Manchester, which also provide onward links to Manchester Airport, Yorkshire and the East of England The wider North West market has a variety of additional long-distance and inter-urban services: The area benefits from hourly London services from Chester/North Wales, calling at Crewe, and hourly Scotland services calling at Warrington and Wigan. Crewe also has an hourly non-stop service to London (from Manchester). Stafford is primarily served by the hourly Liverpool services to London. 22
30 4 Liverpool and the Wider North West Cross country services provide additional links for Stafford between Manchester and the South West, with Crewe benefiting from long-distance services between Birmingham and Scotland. A variety of additional inter-urban services are focused on Crewe Table 4.1 shows the daily weekday rail trips in 2010/11 to and from a number of North West stations and a range of long-distance destinations derived from the PFM. It shows the largest overall demand flow is to and from Manchester, with London as the other main destination. Table /11 Weekday Rail Trips to and from Liverpool Liverpool Runcorn Crewe Stafford (two-way) (two-way) (two-way) (two-way) London 3,400 1,100 1,400 1,100 Birmingham Leeds Manchester 5, , Note: The daily trips are rounded to the nearest 100 trips if over 100 and the nearest 10 trips if less than 100. All trips come from PFM Table 4.1 shows that Liverpool is obviously a key destination to serve with HS2. However, to understand the need to serve any intermediate stations, we need to understand the distribution of demand for long-distance rail in the wider North West An analysis of the total demand for long-distance rail travel (defined as journeys greater than 50 miles) for business and leisure purposes from the Liverpool and the wider North West was undertaken and is shown in Figure 4.2. The figure is based on National Rail Travel Survey (NRTS) data from 2004/05 and shows concentrations of high daily rail demand in Liverpool, Stafford, Crewe and Warrington, with the most extensive concentration in Crewe. Other lower concentrations of demand are evident between Liverpool and Runcorn and between Runcorn and Warrington. It is clear from Figure 4.2 that long-distance rail demand in the area is not concentrated; rail services draw from a wide catchment, including wider Liverpool and parts of Cheshire and North Stafford. 23

31 4 Liverpool and the Wider North West Figure 4.2 (Source: NRTS) Long-distance rail demand in Liverpool and the Wider North West 4.3 Future Year Rail Services and Demand Without HS Moving to the forecast year without HS2, the long-distance 2043 services to and from Liverpool are expected to be similar to the current services, with the same destinations served. The most significant changes programmed are those associated with the Northern Hub 8 and associated electrification schemes. Long-distance services will see faster journey times and more frequent services on the East-West Trans-Pennine route from Liverpool to Leeds Looking at passenger demand in 2043, Table 4.2 shows the number of forecast weekday rail trips to and from a number of North West stations and the same key long-distance stations shown in Table 4.1. The rail demand has again been taken from the PFM. 8 For a description of the Northern Hub please see: 24
32 4 Liverpool and the Wider North West Table Weekday rail trips to and from Liverpool Liverpool Runcorn Crewe Stafford (two-way) (two-way) (two-way) (two-way) London 6,000 2,900 3,400 2,000 Birmingham 1, Leeds Manchester 6, , Note: The daily trips are rounded to the nearest 100 trips if over 100 and the nearest 10 trips if less than 100. All trips come from PFM Compared to 2010/11, most noticeable is the significant growth in overall rail demand to and from London, with total daily two-way trips from all the North West locations forecast to increase by 7,300 - just over 100% We now consider how and from where people are expected to access Liverpool station and the other stations of interest in this area (i.e. Stafford, Crewe, Warrington and Runcorn) Figure 4.3 shows where the passengers accessing Liverpool, Stafford, Crewe, Warrington and Runcorn by car for long-distance rail journeys come from, and Figure 4.4 shows where the passengers accessing these stations by public transport for long-distance rail journeys come from. The majority of long-distance rail passengers in the region access the stations by public transport. The highest concentrations of those accessing by car are generally starting their journey in areas fairly close to a station, with fairly strong car demand in zones around Crewe and along the M6. Those accessing by public transport tend to be concentrated in a wider area around each of the stations, with greatest demand around Liverpool and Crewe. 25
 4.4 HS2 Options Considered 4.4.1 We have discussed the existing demand and the modelled travel patterns in a future without HS2.")
33 4 Liverpool and the Wider North West Figure 4.3 Access to Liverpool, Runcorn, Warrington, Crewe and Stafford stations by car (Source: PFM) Figure 4.4 Access to Liverpool, Runcorn, Warrington, Crewe and Stafford stations by public transport (Source: PFM) 4.4 HS2 Options Considered We have discussed the existing demand and the modelled travel patterns in a future without HS2. Four options were considered for serving Liverpool with HS2. The options essentially revolve around where HS2 connects to the WCML as follows: 26
34 4 Liverpool and the Wider North West Connection to WCML at Lichfield (base case): The reference case follows the service specification for Phase One with Liverpool served by two trains per hour via a connection to the WCML at Lichfield. One train serves the intermediate markets of Stafford, Crewe, Runcorn and Liverpool; the second serves Warrington and Liverpool only. Enhanced base case: We investigated the impact of having two stopping services to Liverpool connecting to the conventional network at Lichfield, to better serve the intermediate markets of Stafford, Crewe and Runcorn. This provided additional capacity to the intermediate markets, as well as maintaining two trains per hour to Liverpool. Connection to WCML at Warrington: A fast service to Liverpool via a fast connection to the WCML in the Warrington area. However, it rapidly became clear that decisions on this connection could not be made in isolation, as there are trade-offs between serving Liverpool and capacity to serve the wider region, including Stafford, Crewe, Warrington and Runcorn. Connection to WCML at Crewe: A connection between HS2 and the WCML immediately south of Crewe station offers some of the benefits of providing a faster service to Liverpool, as well as enabling an improved level of service to some of the intermediate markets, since it allows services to be accelerated by remaining on the HS2 network until Crewe, instead of Lichfield The following sections present an assessment of each of these options in turn, discussing the analysis undertaken to support decisions on the preferred option for serving Liverpool with HS2 and the resultant location of connections to the WCML. 4.5 Connection to the WCML at Lichfield (Base Case) The base case of HS2 service to Liverpool matched the service specification for Phase One, with Liverpool served by two trains per hour via a connection to the WCML at Lichfield. One train serves the intermediate markets of Stafford, Crewe, Runcorn and Liverpool; the second serves Warrington and Liverpool only. In this test, the stopping service would have a journey time to Liverpool of 110 minutes (a reduction from 128 minutes without HS2). For the purposes of modelling, it is assumed that the other service would have a time to Liverpool of 98 minutes, 12 minutes quicker than the stopping service, as shown in Figure Subsequent analysis suggests that the 98 minutes assumed for the Liverpool via Warrington service is over-optimistic; however, the test as coded provides a useful reference point for assessing the various options for serving Liverpool, and does not affect the conclusions drawn. 27
 rail demand from stations in the North West for the base case. Table 4.")
35 4 Liverpool and the Wider North West Notes: 1. Each line represents one train per hour. 2. Journey times are those assumed in the demand modelling. Figure 4.5 HS2 service specification: base case Table 4.3 sets out the total HS2 boarding (southbound) rail demand from stations in the North West for the base case. Table HS2 boarding daily demand on Liverpool/ North West southbound services in the base case Base case Liverpool HS2 6,806 Runcorn HS2 820 Warrington - HS2 925 Crewe HS2 1,428 Stafford - HS2 2,237 Total 12, Load factors for the Warrington (fast) and Runcorn (slow) routing services in this base case are shown in Table 4.4. The load factor on the slow service is particularly high at 80%, suggesting a high degree of overcrowding and indicating the need to increase train capacity. 28
 (on departure from Stafford).")
36 4 Liverpool and the Wider North West Table 4.4 Average weekday 2043 southbound load factors on HS2 trains to London from Liverpool for the base case Base case Southbound on HS2 Liverpool to London service (slow) (on departure from Stafford). Southbound on HS2 Liverpool to London service (fast) (on departure from Warrington Bank Quay). 80% 43% 4.6 Enhanced Base Case The first option was to increase the train capacity and frequency to Stafford and Crewe. This saw us test the impact of having two stopping services to Liverpool connecting to the conventional network at Lichfield. The aim of this test was to provide the additional capacity to the intermediate markets, as well as maintaining two trains per hour to Liverpool This service pattern saw the loss of the faster Liverpool service via Warrington and increases average journey times to Liverpool to 110 minutes. It also removed Warrington from the HS2 network, as shown in Figure 4.6. Notes: 1. Each line represents one train per hour. 2. Journey times are those assumed in the demand modelling. Figure 4.6 HS2 service specification: enhanced base case Table 4.5 sets out the total HS2 boarding (southbound) rail demand from stations in the North West for the Liverpool base case and the enhanced base case (with two stopping 29
37 4 Liverpool and the Wider North West services to Liverpool). With two stopping services to Liverpool, the number of HS2 passengers on this branch increases by 2,700, despite there no longer being an HS2 service at Warrington, with HS2 demand at Crewe, Runcorn and Stafford almost doubling. There is a slight reduction of passengers at Liverpool, in line with the increased journey time for the second HS2 service The modelling suggests that the market in the Warrington area is relatively flexible, with many passengers who would otherwise have used Warrington switching to use Wigan and Runcorn to access HS2 services, although these passengers will receive some disbenefit from longer access times. Benefits to Runcorn, Crewe and Stafford dominate the overall demand picture, noting that particularly with Crewe, a high proportion of these will come from railconnecting passengers (including some from Warrington). Table 4.5. HS2 boarding daily demand on Liverpool/ North West southbound services for the base case and enhanced base case Base case Enhanced base case Liverpool HS2 6,806 6,634 Runcorn HS ,513 Warrington - HS Crewe HS2 1,428 2,807 Stafford - HS2 2,237 3,972 Total 12,216 14, The effect on demand is to make the load factors 74% on both services (on departure from Stafford) in the southbound direction (from Liverpool). Hence this option reduces the very high load factors forecast south of Stafford on the slow Liverpool services in the base case. However, even with a doubling of capacity to both Crewe and Stafford, forecast load factors are very high. The doubling of service frequency at these two locations attracts more passengers to the HS2 network, suggesting there is considerable benefit to providing these intermediate markets with sufficient capacity and good service frequency to London Replacing the faster hourly Liverpool via Warrington service with a second (slower) service an hour calling at Stafford, Crewe and Runcorn generates net benefits of 550 million and net revenues of 340 million, despite increasing average journey times to Liverpool and removing Warrington from the HS2 network. The results suggest that providing a good service to the intermediate markets of Crewe and Stafford is important, and this more than offsets the disbenefits to Liverpool from increasing end-to-end journey times to a standard 110 minutes These results suggested that assuming a direct choice between either a faster Liverpool service or serving the intermediate markets, the intermediate markets provide higher benefits. 30
38 4 Liverpool and the Wider North West 4.7 Connection to WCML at Warrington During the optioneering phase, options to provide a faster connection to Liverpool were also identified. The options examined here would have connected HS2 to either the Liverpool to Manchester via Warrington line or the Chat Moss Line; this test focuses on the potential for a connection to the former of these options. The aim of this option was to test the impact of providing faster services to Liverpool, since it allowed services to be accelerated by remaining on the HS2 network until Warrington, instead of Lichfield Figure 4.7 shows the HS2 service specification used to analyse the Warrington option. This connection could provide a service to Liverpool in 86 minutes (with a stop at Warrington). This would be 12 minutes quicker than the base case A test was undertaken with one train running fast across this new connection to Liverpool and a second Liverpool service each hour assumed to continue to join the conventional network at Lichfield, so that Stafford would continue to see the benefits of HS2 that would be delivered in Phase One. Notes: 1. Each line represents one train per hour. 2. Journey times are those assumed in the demand modelling. Figure 4.7 HS2 service specification: Warrington option Table 4.6 sets out the total HS2 boarding southbound rail demand from stations in the North West for the Warrington option compared to the base case and enhanced base case. The Warrington option increases demand on HS2 services by around 1,100 passengers when compared to the base case, with demand from Warrington station almost doubling (as would be expected). However, in comparison to the enhanced base case, the Warrington Option attracts 1,600 fewer passengers. 31
39 4 Liverpool and the Wider North West Table 4.6 HS2 boarding daily demand on Liverpool/ North West southbound services for the base case, enhanced base case and Warrington option Base case Enhanced base case Warrington option Liverpool HS2 6,806 6,634 7,135 Runcorn HS , Warrington - HS ,784 Crewe HS2 1,428 2,807 1,409 Stafford - HS2 2,237 3,972 2,233 Total 12,216 14,926 13, Load factors for the Warrington (fast) and Runcorn (slow) routing services in this base case are shown in Table 4.7. The load factor on the slow service is again high at 80%, suggesting a high degree of overcrowding and indicating the need to increase train capacity. Table 4.7 Average weekday 2043 southbound load factors on HS2 trains to London from Liverpool for the base case and Warrington option Base case Warrington option Southbound on HS2 Liverpool to London service (slow) (on departure from Stafford) 80% 80% Southbound on HS2 Liverpool to London service (fast) (on departure from Warrington) 43% 55% The improved journey times are reflected in the appraisal, with benefits of 340 million and an increase in revenue of 170 million compared to the base case. This compares unfavourably to 550 million and net revenues of 340 million for the enhanced base case Depending on the option considered, the cost of the Warrington option would be in the range of 390 million to 690 million, providing a BCR of between 1.5 and -1.5 on the base case. The test results highlight that a dedicated HS2-conventional rail connection for Liverpool near Warrington could have a marginally positive incremental business case if a construction cost at the lower end of the range could be achieved In principle, we would expect the case for the connection to be strengthened by a second train per hour running via HS2 to a connection at Warrington. However, these tests have highlighted the trade-off between serving Liverpool and serving the wider North West region. Capacity constraints on the main HS2 route into London will limit the scope for additional 32
40 4 Liverpool and the Wider North West services without taking services away from other areas. Re-routing the semi-fast service (via Stafford and Crewe) might have been an option; however, the loading on this train (around 80% on departure from Stafford) suggested the service was heavily used indeed, it suggested there might be a stronger case for providing additional capacity on these services than via a fast connection at Warrington In summary, the enhanced base case with two semi-fast services using the connection to the WCML at Lichfield would provide more benefits than a connection to the WCML at Warrington and would cost less. 4.8 Connection to WCML at Crewe The analysis so far demonstrated the importance of serving intermediate markets and showed that the use of the Lichfield connection for semi-fast Liverpool services generated higher benefits over a faster connection to Liverpool around Warrington An option was therefore developed which provided a connection between HS2 and the WCML immediately south of Crewe station. This option captures some of the benefits of providing a faster service to Liverpool, as well as enabling an improved level of service to some of the intermediate markets, since it allows services to be accelerated by remaining on the HS2 network until Crewe instead of Lichfield Figure 4.8 shows the HS2 service specification used to analyse the Crewe option. A test was undertaken with one Liverpool train running fast across this new connection to Crewe and a second Liverpool service each hour assumed to continue to join the conventional network at Lichfield so that Stafford would continue to see the benefits of HS2 that would be delivered in Phase One. 33

41 4 Liverpool and the Wider North West Notes: 1. Each line represents one train per hour. 2. Journey times are those assumed in the demand modelling. Figure 4.8 HS2 service specification: Crewe option Table 4.8 compares the results of the Crewe option with the enhanced base case and shows that total HS2 boarding southbound demand for the Crewe option is similar to the enhanced base case. Demand increases for Liverpool, Runcorn and Crewe, with the latter benefiting in particular from the greater frequency of services and the faster journey time. Stafford sees a reduction in demand, partly as some passengers around the north of the Stafford station catchment area switch to the improved services at Crewe, and partly as passengers are put off by crowding on this service. Table 4.8 HS2 boarding daily demand on Liverpool/North West southbound services for the enhanced base case and Crewe option Enhanced base case Crewe option Liverpool HS2 6,634 6,853 Runcorn HS2 1,513 1,642 Warrington - HS2 0 0 Crewe HS2 2,807 4,314 Stafford - HS2 3,972 1,792 Total 14,926 14,601 34
42 4 Liverpool and the Wider North West The effect of providing a faster connection at Crewe station is to increase the load factors on both Liverpool services, as shown in Table 4.9. Again, the provision of the additional service increases demand and load factors on the HS2 trains Although this crowding raises some concerns, additional capacity could be provided to Crewe in particular, since it is possible to run 400m trains as far as Crewe via HS2. We also believe that particular features of the assignment model used for this stage of the study may lead to an overallocation of demand to the slow service comparable to the second, faster, Liverpool service. Table 4.9 Average daily 2043 southbound load factors on HS2 trains to London from Liverpool for reference scenario and Crewe connection scenario Enhanced base case Crewe connection Southbound on HS2 Liverpool to London service (slow) (on departure from Stafford) 74% 83% Southbound on HS2 Liverpool to London service (slow/fast) (on departure from Stafford (enhanced base case) /Crewe (test)) 74% 64% A connection south of Crewe enables a faster service to Liverpool, with an overall journey time of 93 minutes. Accelerating one of the hourly Liverpool services and providing two trains per hour at both Crewe and Runcorn generates forecast net benefits of 560 million and net revenues of 300 million. Over the 60-year appraisal period, this level of revenue generation is more than sufficient to offset the anticipated capital cost of the Crewe connection A Crewe connection would enable a journey time (with intermediate calls at both Crewe and Runcorn on the fast service) that is only seven minutes slower than a fast service via a Warrington connection. Compared to a fast Warrington connection, the Crewe option would generate benefits of 220 million and around 130 million additional revenue In comparison with the Warrington Option, the Crewe connection would also be delivered at lower cost, and enable greater operational flexibility as 400m trains could now run as far as Crewe, providing extra capacity without affecting constraints on the main HS2 trunk route into London When comparing to the enhanced base case, the Crewe option offers similar levels of benefits, but generates slightly less revenue. However, with the service pattern tested above, the Crewe option has not undergone a service pattern optimisation. This means that it does not look at the most optimal way of providing services to support the use of the Crewe connection option. Further work to look at a more optimal service pattern (covered in Chapter 10) produced a service pattern which provides both better use of the Crewe option and a better level of capacity to the intermediate markets in the North West When this service pattern is tested and compared with the same service pattern all assuming they join the network at Lichfield, as in the enhanced base case we see benefits 35
43 4 Liverpool and the Wider North West of the Crewe option of 600 million and revenues of 160 million, which shows that when the service pattern is optimised, the benefits of the connection far outweigh the costs. 4.9 Summary The base case follows the service specification for Phase One, with Liverpool served by two trains per hour via a connection to the WCML at Lichfield. One train serves the intermediate markets of Stafford, Crewe, Runcorn and Liverpool; the second serves Warrington and Liverpool only To better serve the intermediate markets of Stafford, Crewe and Runcorn, we investigated the impact of having two stopping services to Liverpool connecting to the conventional network at Lichfield. This provided additional capacity to the intermediate markets, as well as maintaining two trains per hour to Liverpool. This enhanced base case generated substantially improved net benefits over the base case We then considered the provision of a fast connection to Liverpool via a connection to the WCML in the Warrington area. However, this highlighted the trade-off between serving Liverpool and serving the intermediate markets in the wider region. It became clear that there were trade-offs between serving Liverpool and capacity to serve the wider North West region, including Stafford, Crewe, Warrington and Runcorn A comparison of the results showed that serving intermediate markets with two semi-fast services using the connection to the WCML at Lichfield (the enhanced Base Case) would provide more benefits than a faster Warrington connection, and would be lower cost A compromise option was therefore developed with a connection to the WCML immediately south of Crewe station. This option provided some of the benefits of providing a faster service to Liverpool as well as enabling an improved level of service to some of the intermediate markets since it allows services to be accelerated by remaining on the HS2 network until Crewe instead of Lichfield The Crewe option provided greater benefits than the Warrington Option and similar total benefits to those generated by the enhanced base case. Revenue generation is also sufficient to offset the anticipated capital cost of the Crewe connection Further investigation of the Crewe option, with additional service pattern optimisation, suggested that it would easily cover its costs and provide benefits over a simple connection at Lichfield; therefore, it was adopted as the preferred option, as it offered a balance of fast services to Liverpool and services to intermediate markets. 36
44
. 5.2.3 Wigan is further north than Warrington.")
45 5 Joining the West Coast Mainline Figure 5.1 Joining the West Coast Main Line location map Warrington is a town in Cheshire, situated between Manchester and Liverpool. It has good highway links with the surrounding area. The unitary authority of Warrington has a population of 198,900 (2010 mid estimate) Wigan is further north than Warrington. The transport links, whilst reasonable to Manchester and Liverpool, are not as good as those in Warrington. The population of the borough of Wigan is 307,600 (2010 mid estimate) Preston is the most northerly of these towns and has a population of 135,100 (2010 mid estimate). It has good road connections to Blackpool, Blackburn and Burnley, as well as to Manchester. It also has rail connections to Blackpool and Lancaster The rail links from these towns are illustrated in Figure 5.2. It shows that Wigan has fewer opportunities for interchange than Warrington, which has direct services to North Wales, and Preston, which has connection to Lancaster, Blackpool and the Lake District and the North East. All three stations have direct rail services to many of the destinations served by HS2 including London (1tph), Birmingham (1tph), Edinburgh (1 train every 2 hours) and Glasgow (1 train every 2 hours). 38

 Wigan (two-way) Preston (two-way) London 1,200 700 1,600 Birmingham 200 100 200 Glasgow 200 100 300")
46 5 Joining the West Coast Mainline Figure 5.2 Existing long-distance services from the North West Table 5.1 shows numbers of daily weekday rail trips in 2010/11 to and from Warrington, Wigan and Preston and a number of key long-distance stations derived from the PFM. For all three towns, the largest rail flow is by far to and from London, with demand from Preston being the greatest, reflecting its high connectivity and larger catchment area. Table /11 Weekday Rail Trips to and from Warrington, Wigan and Preston Warrington (two-way) Wigan (two-way) Preston (two-way) London 1, ,600 Birmingham Glasgow Edinburgh Note: The daily trips are rounded to the nearest 100 trips if over 100 and the nearest 10 trips if less than 100. All trips come from PFM. 39
47 5 Joining the West Coast Mainline 5.3 Future Year Rail Services and Demand without HS Moving to the forecast year, without HS2, the long-distance 2043 pattern of services from Preston, Wigan and Warrington is expected to be broadly similar to that of today Looking now at passenger movements in 2043, Table 5.2 shows the number of forecast daily weekday rail trips to and from Warrington, Wigan and Preston and the same key longdistance stations shown in Table 5.1. As for 2010, rail demand has been taken from the PFM. Table Weekday rail trips to and from Warrington, Wigan and Preston Warrington (two-way) Wigan (two-way) Preston (two-way) NLondon o t Birmingham e : Glasgow NEdinburgh o 2, , , Note: The daily trips are rounded to the nearest 100 trips if over 100 and the nearest 10 trips if less than 100. All trips come from PFM Between the present day and 2043, all three stations show the largest absolute increase in rail demand to and from London: Warrington: from 1,200 to 2,000 (66%); Wigan: from 700 to 1,100 (57%); and Preston: from 1,600 to 3,000 (88%) The high growth to Preston highlights the importance of serving this market. 5.4 HS2 Options Although a range of options were identified for joining to the WCML in the North West, options south of Warrington (other than to provide services to Liverpool) were ruled out at an early stage due to engineering complexity and wider issues with the line of route. This left four broad options (although a number of variants of each option were considered in engineering and sustainability): 40


48 5 Joining the West Coast Mainline Option 1: Golborne Junction. This is a location to the south of Wigan and was the cheapest of the options; Option 2: Balshaw Lane. This is a location to the south of Preston; Option 3: Preston by-pass and interchange station with a connection to the north of Preston; and Option 4: Preston by-pass non-stopper. This has no interchange station and a connection to the north of Preston Modelling at this point could only consider the benefits of serving existing stations, since the enhanced model version was still in development. This presented some challenges for Option 3 in particular, since any station on this route would be a new station. Modelling for this option therefore attempted to provide a range of the potential benefits. In the best case, it was assumed that an interchange could be delivered with connectivity equivalent to that of the existing Preston station; in the worst case, it was assumed there was no station at all The service specifications for these tests are shown in Figure 5.3. Notes: 1. Each line represents one train per hour. 2. Journey times are those assumed in the demand modelling. Figure 5.3 HS2 service specification for options serving Scotland Table 5.3 shows the marginal benefits, revenues and costs for Options 2 to 4, compared to Option 1, which was identified as being the cheapest option. 41
49 5 Joining the West Coast Mainline Table 5.3 Benefits, revenues and costs of options NPV in 2009 values Benefits Revenues Costs BCR Option 1: Golborne Jct Option 2: Balshaw Lane Option 3: Preston bypass with station Option 4: Preston bypass, without station 1, , These results show that Option 2 provides the highest marginal BCR compared to Option 1. This reflects the fact that this option would serve the key rail market of Preston, but at a substantially lower cost than Option 3. Although Option 3 would generate much higher levels of benefits than Option 2, these benefits combining faster journeys to Scotland and the high value of serving the Preston catchment would come at a much higher cost and would be critically dependent on providing a station near Preston that could provide high levels of connectivity A further consideration is the level of potential benefits achieved by serving Wigan. Option 1 is the only one of the four options which includes a station stop at Wigan. Removing this stop will enable a quicker service to the larger Scotland and Preston markets without any cost and bring the London to Scotland time closer to Option 2. Modelling suggests that this would add around 300 million in benefits and 150million to 200 million in revenues from the additional time savings. If these benefits were added to the Golborne option, the marginal benefit to cost ratio for the Balshaw Lane option would fall below 1. However, the BCR for option 3 would remain high, although it should be noted that the estimated BCR for this particular test is likely to be over-estimated (see below). 5.5 Alternative Demand Scenarios In general, HS2 Ltd has not modelled differences in demand, since it is unlikely to change conclusions on the relative attractiveness of different options. If overall demand increases or decreases, then benefits and revenue for all options will be affected in the same way However, in the case of the WCML connection, the pattern of demand could have an impact on the performance of each of the options. In particular, potential changes in the WebTAG guidance in the Passenger Demand Forecasting Handbook (PDFH) 9 were identified as having a significant negative impact on future levels of demand growth to and from Scotland. This change would reduce the impact of the benefits of journey time savings to Scotland offered by the WCML connection. 9 This relates to a change from PDFH 4 to PDFH 5 for the distance element of the GDP elasticities. 42
50 5 Joining the West Coast Mainline We therefore carried out sensitivity tests which reduced demand between Scotland and London by one-third. This reduction was an initial estimate of the impact on demand of the proposed lower elasticities in the PDFH The results of these tests are shown in Table 5.4 below. The table shows that the case for any of the options becomes much more marginal with lower demand from Scotland. In particular, Option 4 (which bypasses Preston) has a negative net present value, as the loss of the Preston market in this test completely outweighs the time savings to the Scottish market. Table 5.4 Benefits, revenues and costs with lower demand assumptions for Scotland NPV, 2009 values Benefits Revenues Costs BCR Option 1: Golborne Jct Option 2: Balshaw Lane Option 3: Preston bypass with station Option 4: Preston bypass without station n/a 5.6 Summary The comparison between Option 1 and Options 3 and 4 does not present a clear preferred option from the point of view of demand. In particular, we know changes in WebTAG may reduce long-distance demand, reducing the benefits and the BCR, so in this case demand and appraisal findings are not conclusive. 43
51

52 6 East Midlands 6.2 Current Rail Services and Demand The East Midlands includes the counties of Nottinghamshire, Derbyshire, Leicestershire and Lincolnshire, as illustrated in Figure 6.1. The three main centres of population in this region are Nottingham, which has the largest population (306,700), followed by Leicester (304,800) and Derby (243,200). There are other important centres of population at Loughborough, Chesterfield and Lincoln. Figure 6.1 The East Midlands location map The current rail network around the East Midlands has the following long-distance connections: From Nottingham to London (2tph), Sheffield (2tph), Birmingham (2tph), Manchester (1tph), Liverpool (1tph), Cardiff (1tph) and East Anglia (1tph Norwich); From Derby to London (2tph), Sheffield (4tph), Birmingham (4tph), Leeds (1tph), York (2tph), the North East (2tph Newcastle) and Cardiff (1tph); and From Leicester to London (4tph), Sheffield (2tph), Birmingham (2tph) and East Anglia (no direct route) Table 6.1 shows numbers of daily weekday rail trips in 2010/11 to and from Nottingham, Leicester and Derby and a number of key long-distance stations derived from our model. It shows that for each East Midlands station, the largest demand flow is to and from London, with other significant flows to Birmingham and Sheffield. Rail demand to cities in the north of England such as Newcastle are lower, reflecting in part the current poor levels of rail services on these links. 45
53 6 East Midlands Table /11 Weekday rail trips to and from Nottingham, Leicester and Derby Nottingham (two-way) Leicester (two-way) Derby (two-way) London 2,600 3,200 1,700 Birmingham 1,000 2,000 1,900 Sheffield Manchester York Newcastle Note: The daily trips are rounded to the nearest 100 trips if over 100 and the nearest 10 trips if less than 100. All trips come from PFM Table 6.1 above gives an indication of the amount of existing demand in the region and where the key destinations are for long-distance travellers to and from the East Midlands. The main movements are to/from London, although Birmingham is also important More importantly, however, for the location of a HS2 station we need to understand the distribution of the ultimate origins and destinations of this demand for long-distance rail in the East Midlands. An analysis of the total demand for long-distance rail travel for business and leisure purposes from the East Midlands was undertaken and shown in Figure 6.2. The figure is based on National Rail Travel Survey (NRTS) data from 2004/05 and shows concentrations of high daily rail demand in Nottingham, Loughborough, Leicester and Derby with the most extensive concentration in Nottingham. Other lower concentrations of demand are evident between Derby and Nottingham and between Nottingham and Loughborough. 46

54 6 East Midlands Figure 6.2 Long-distance rail demand in the East Midlands (Source: NRTS) 6.3 Future Year Rail Services and Demand Without HS Moving to the forecast year, in 2043 the long-distance services from East Midlands are expected to be broadly similar to the current services, with one additional service between Leicester and Lincoln Looking at passenger demand in 2043, Table 6.2 shows the number of forecast weekday rail trips to and from Nottingham, Leicester and Derby and the same key long-distance stations shown in Tables 6.1. As for 2010, rail demand has been taken from the PFM. 47
55 6 East Midlands Table Weekday rail trips to and from Nottingham, Leicester and Derby Nottingham (two-way) Leicester (two-way) Derby (two-way) London 5,900 6,500 4,100 Birmingham 1,600 3,400 3,200 Sheffield 1, ,400 Manchester York Newcastle Note: The daily trips are rounded to the nearest 100 trips if over 100 and the nearest 10 trips if less than 100. All trips come from PFM Between the present day and 2043, Nottingham is predicted to see a significant growth in trips to: London: from 2,600 to 5,900 (125%); Birmingham: from 1,000 to 1,600 (60%); and Sheffield: from 800 to 1,300 (60%) Leicester experiences a significant growth in trips to: London: from 3,200 to 6,500 (100%); Birmingham: from 2,000 to 3,400 (70%); and Sheffield: from 400 to 600 (50%) Derby sees a significant growth in trips to: London: from 1,700 to 4,100 (140%); Birmingham: from 1,900 to 3,200 (70%); and Sheffield: from 800 to 1,400 (75%) The next section will look at how and from where people access each of the stations to help our understanding of how the model represents the travel patterns in the region in 2043 without HS2. An understanding of both this and the travel patterns above are important in order to locate an HS2 station in the region. 48
, compared to those accessing by car (1,700 daily passengers).")
56 6 East Midlands Figure 6.3 shows where the passengers accessing Derby by car come from, and Figure 6.4 shows where the passengers accessing Derby by public transport come from. The majority of Derby passengers access the station by public transport (3,900 daily passengers), compared to those accessing by car (1,700 daily passengers). Those accessing by car are generally in the immediate vicinity of Derby. Figure 6.3 Access to Derby Station by car (Source: PFM) Figure 6.4 Access to Derby Station by public transport (Source: PFM) 49
57 6 East Midlands Figure 6.5 and Figure 6.6 show where the passengers accessing Nottingham by car and public transport respectively come from. Again, the majority of Nottingham passengers access the station by public transport (7,200 daily), with those accessing by car (1,700) generally originating in the immediate vicinity of Nottingham. Those accessing by public transport are from further afield, particularly in the area southwest of the city centre, which is to be served by two lines of the Nottingham Express Transit Phase Two. The university is located in this area. Figure 6.5 Access to Nottingham Station by car (Source: PFM) Figure 6.6 Access to Nottingham Station by public transport (Source: PFM) 50
, with those accessing by car (1,900) generally originating in the immediate vicinity of Leicester city")
58 6 East Midlands Figure 6.7 and Figure 6.8 show where the passengers accessing Leicester by car and public transport come from. Again, the majority of Leicester passengers access the station by public transport (5,900 daily), with those accessing by car (1,900) generally originating in the immediate vicinity of Leicester city centre. Those accessing by public transport are generally from within the city itself, mainly to the south of the centre. There are also a number of trips accessing Leicester by public transport from Loughborough. Figure 6.7 Access to Leicester Station by car (Source: PFM) Figure 6.8 Access to Leicester Station by public transport (Source: PFM) 51
59 6 East Midlands The majority of passengers travelling long distance in the Derby/Nottingham corridor choose to access either Derby or Nottingham by public transport, with greatest demand in the immediate vicinity of the two cities. It is also to be expected that for these city-centre stations, the largest access is by public transport (including taxis), as there is limited space to park at either Derby station or Nottingham station (around 600 spaces at each). 6.4 Initial HS2 Option Assessment As with all sections of the route, early modelling analysis used an earlier version of the demand forecasting model. This was appropriate for looking at alternative ways to serve cities, but did not have the detailed station choice model required to look at specific station options outside the city centres and away from the existing stations The East Midlands area differs from other sections of the route, in that it contains three very significant areas of demand which could credibly be served by HS2. In order to support option evaluation, and enable shortlisting of route options, initial modelling focused on questions of which of the three cities was likely to offer the best economic case, particularly in terms of the largest market to London In each case, there were trade-offs between: the overall size of the rail market from a given city, with flows to/from London being particularly important; the cost of a route to that city; and the journey time on HS2, particularly between London and the East Midlands, and London and locations further north Within the East Midlands, the Nottingham area represents a significant market for rail. As a result when looking primarily at the East Midlands to London market Nottingham offered the greatest benefits of all of the East Midlands cities, with benefits around 1.6 billion greater than Leicester and 1.4 billion greater than Derby Although the Leicester market is also a significant market, the fact that Leicester already benefits from quicker journey times to London in comparison to Nottingham (by some 40 minutes) means that the provision of an HS2 station at Nottingham has more impact in terms of benefits than providing one at Leicester Comparisons of benefits and revenues between Leicester and Derby were more marginal. While Leicester represents a significantly bigger market, the scope for offering time savings is more limited, since Leicester already has relatively fast journey times to London. Modelling suggested that Leicester would have slightly higher benefits ( 300 million present value (PV)), but slightly lower revenues as a result of shorter distance and hence lower fares to and from London However, this modelling only considered relative impacts within the East Midlands. Given Leicester s location, routes to serve Leicester were longer, resulting in significantly higher costs and longer journey times between London and locations further north. Routes via Leicester added seven minutes to journeys between London and Leeds north of Leicester. 52
60 6 East Midlands Analysis of this test suggested that each minute of journey time north of Leicester was worth around 240 million in benefits and 150 million in terms of revenue Thus, while a Leicester station might deliver marginally higher benefits than a Derby station for the East Midlands, this would not offset the negative impacts of longer journey times to locations further north This suggests that a Leicester station would cost more and deliver lower benefits than either Derby or Nottingham stations. As a result, Leicester options were not progressed. 6.5 Options for Serving City Centres As a result of this initial analysis, the focus of option development was around how to serve Nottingham and Derby in terms of the significant London market. Options for conventional rail spurs and through services were considered to serve the city centres Loop options were not modelled. In the case of Nottingham this was due to the significant engineering complexity and sustainability impacts the route would have had. For Derby, an option for a through station in the city centre meant there was no need to further consider a Loop option The choice of through or spur usually represents a trade-off between the quality of service provided to a station against the impact on passengers travelling to other destinations and the costs of the scheme. This is clearly seen in considering city-centre stations in Nottingham: A through station maximises the journey time benefits to Nottingham. It would also improve the potential service frequency, as markets could be combined. However, the route would be substantially longer, increasing journey times for passengers travelling through the East Midlands and adding to construction costs; A spur in the case of Nottingham - has the benefit of being less costly and limits the impact on passengers travelling beyond the city. However, operationally, a spur can be limiting, as it is means the station cannot serve as an intermediate location. This is not a significant issue where there is a significant level of demand which can support a high frequency of services (i.e. there is enough demand for south-facing services and the economic case does not hinge on the existence of through services). In the case of Nottingham, a spur was only likely to support one train per hour to London and Birmingham (see Table 6.3 which shows daily demand for a Nottingham Spur to London and Birmingham) compared to 2-3 tph for a through station. 53
61 6 East Midlands Table Weekday rail trips to London and Birmingham from a spur serving Nottingham Nottingham to Daily passengers Average load on 400m train per hour London 2,300 13% Birmingham 1,800 10% Table 6.4 shows the results of modelling for a Nottingham through route, compared to a Spur. The through option generates significantly more benefits for passengers in the East Midlands as a result of the higher frequency of services on a through station. In benefit terms, this is more than enough to offset the 10-minute time penalty for passengers travelling through (not stopping in) the region. However, revenues would be slightly lower as the average fare for the East Midlands is lower (due to the shorter distance) than longerdistance passengers, of which there are now fewer due to the time disbenefit. This, combined with the additional cost, meant that a through route for Nottingham was unattractive. Table 6.4 Revenues and benefits for options serving Nottingham and Derby Incremental cost (million) Revenue (million) Benefits (million) NPV (million) Nottingham Through Compared a Nottingham Spur Derby Through Compared to a Derby Spur Present Value in (million) in 2009 Prices The same is not true for Derby. Through route options that were identified, which could serve the city centre, were relatively low cost and had limited impacts on journey times. This meant a Spur option was unattractive for Derby. The Through route was cheaper, would deliver a significantly better service (and so benefits) to Derby and the East Midlands, and was as fast as the Spur option for passengers travelling through the East Midlands. Table 6.4 shows the Through route is significantly more attractive than a Spur in the case of Derby Table 6.5 shows the comparison of the Derby Through against the Nottingham Conventional Spur. This comparison was undertaken as these are the two cheaper options from the analysis above and both had higher revenues and a higher NPV than the alternatives The Nottingham Spur is much more expensive to implement than the Derby Through, but has few additional benefits. The Derby Through station was therefore preferred in modelling terms to the Nottingham city centre options. Table 6.5 Revenues and Benefits for Derby Through versus Nottingham Spur 54
62 6 East Midlands Present Value in (million) in 2009 Prices Incremental Cost (million) Revenue (million) Benefits (million) NPV (million) Derby Through compared to a Nottingham Spur Options to Serve both Derby and Nottingham The analysis above showed that it would be desirable to serve both Derby and Nottingham if possible and led to consideration of an interchange station somewhere between the two. While interchange stations are less well connected to specific city centres, they can be accessible to a wider catchment spreading the benefits of high speed rail across the wider region The most obvious solution would be to incorporate an HS2 station within the existing East Midlands Parkway Station which is located relatively centrally to Derby, Nottingham and Leicester. However, East Midlands Parkway is located in the Green Belt and hence development around the station would not be supported. The planning restrictions led to a search for an alternative to East Midlands Parkway. An initial sift of options focused on engineering and sustainability, as well as more qualitative assessments of the relative accessibility of stations led to a short list of options around Toton, located between Nottingham and Derby and the existing East Midlands Parkway station The demand analysis showed that an interchange station should be connected to public transport to gain the most benefits. Heavy rail access was tested at Toton assuming the same level of passengers services as at East Midlands Parkway. For both tests the same HS2 service pattern was used. These tests showed that Toton provided the greatest benefits and revenues of the two options. As it was anticipated that the difference in costs for providing Conventional connections at these two locations would be negligible, Toton was taken forward to the final round of testing as the preferred interchange station location It should be noted that providing heavy rail access at Toton does require a significant reordering of the existing railway services and further work will be required to select the best option for serving Toton while minimising negative impacts on existing services. 6.7 Final Options Based on the analysis so far two options were taken forward to the final evaluation stage as follows: Interchange station at Toton; and Through service at Derby Journey times are very similar, with only a small (1 minute) longer journey for Toton reflecting a slightly longer route to the station and the constrained route through Long Eaton. However, the nature of the two options means they would each serve rather different 55
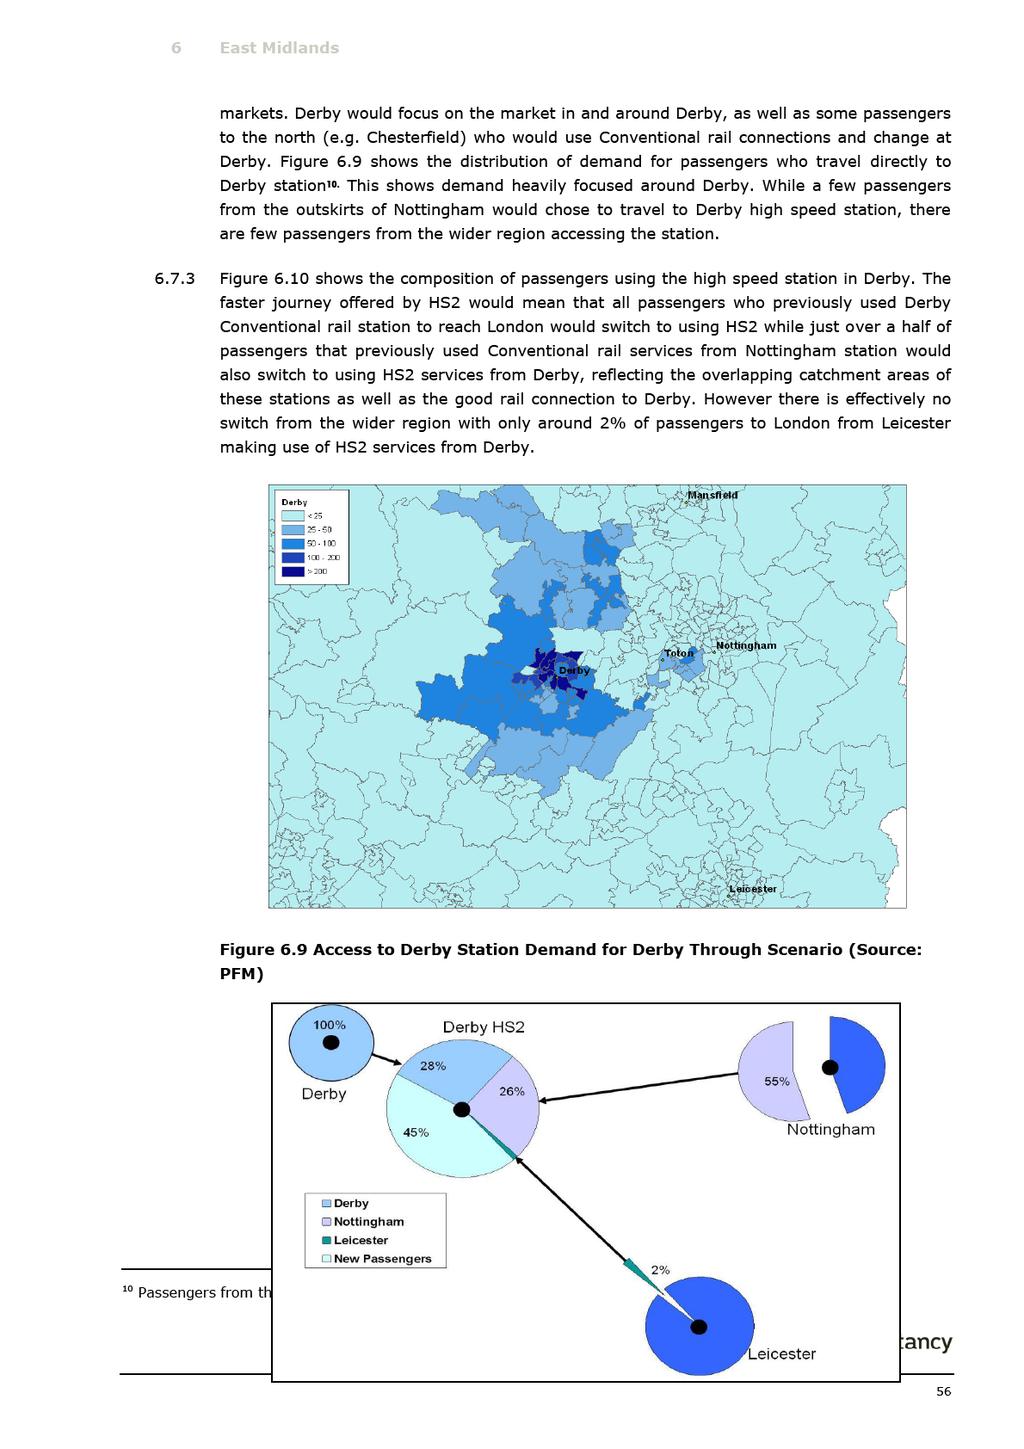
63


64 6 East Midlands Figure 6.10 Source of 2043 Demand for HS2 with a HS2 Station at Derby (Source: PFM) Toton serves both more people and a greater geographic swathe of the region. Figure 6.11 shows that passengers directly accessing Toton for travel to London would come from an area covering Nottingham and Derby, and extending southwards towards Loughborough and Leicester. Figure 6.12 shows that although under this option fewer Conventional rail passengers to London from Derby station would switch to HS2, there would be a greater shift from Nottingham and Leicester stations. Figure 6.11 Access to Toton Station Demand for Toton Scenario (Source: PFM) Figure 6.10 Source of 2043 Demand for HS2 with a HS2 Station at Toton (Source: PFM) 57

65 6 East Midlands Overall the wider geographical spread would attract more passengers to use Toton station, with around 16,900 passengers forecast to use this station each day travelling to all destinations. This compares to 14,600 using a Derby high speed station This in turn leads to higher overall benefits for a Toton station. The modelling suggests that Toton will deliver around 550m (PV, 2011 prices) more in benefits as a result of greater accessibility to the wider region and higher passenger numbers. It will also deliver additional revenues of 190m (PV, 2011 prices) compared to the Derby station. This is more than enough to offset the higher costs of construction for Toton (around 300m (PV, 2011 prices)) and therefore Toton was selected as the preferred option. 6.8 Enhancing the Toton Option using classic-compatible Services While the analysis above highlights the wider geographical catchment offered by Toton, it is also true that the station serves each market less well than a city centre station. There remain some passengers who would choose to continue to use Conventional rail services from Derby and Nottingham because they are easier to access We therefore considered whether classic-compatible services running to existing stations at Nottingham and Derby might offer an opportunity to provide additional benefits to the residual passengers using the classic-compatible stations. When we examined these, we looked at services in addition to those to the Toton station. classic-compatible Service to Derby Figure 6.13 shows this classic-compatible Service Scenario specification. With the classiccompatible Spur, the journey time from Derby to London has reduced from 97 minutes to 55 minutes. Notes: 1. Each line represents one train per hour 2. Journey times are those assumed in the demand modelling 58
. 6.8.")
66 6 East Midlands Figure 6.11 HS2 service specification: additional classic-compatible service scenario between Derby and London The operational expenditure for the additional classic-compatible service scenario is around 490 million (PV, 2011 prices) The additional service would capture more of the market from the area around Derby, offering benefits through improved accessibility for many of these passengers. Overall, this would increase the number of daily passengers on HS2 services from the East Midlands from 16,900 to 17,800. The number of passengers using Toton would fall by 1,900 as some passengers would choose to use the Derby service rather than travel to Toton The improved service levels and accessibility would deliver benefits of around 190 million and revenues of 130 million (PV, 2011 prices). However, this would be insufficient to cover the cost of the additional services. Classic-Compatible Services to Nottingham Classic-compatible services were also considered for Nottingham. As with Derby, a service to London was modelled. However, the potential benefits to Birmingham were also considered in this case (since existing services between Birmingham and Nottingham are somewhat poorer than Derby) Figure 6.14 shows this service specification. The journey time between London and Nottingham has reduced from 115 minutes to 56 minutes, and between Nottingham and Birmingham has reduced from 75 minutes to just 26 minutes. Notes: 1. Each line represents one train per hour. 2. Journey times are those assumed in the demand modelling. Figure 6.12 HS2 service specification: additional classic-compatible services scenario between Nottingham and London and Nottingham and Birmingham 59
67 6 East Midlands The operational expenditure for the additional classic-compatible service to London is 490m (PV, 2011 prices) and to Birmingham 150m (PV, 2011 prices) As with the Derby classic-compatible service, there is clear switching between stations in these tests. Overall, the number of passengers using East Midlands stations increases from 16,900 to 19,300. There are 5,100 fewer passengers using the Toton station as they choose to switch to the classic-compatible services These services would again deliver benefits around 190 million (PV, 2011 prices) for the London services and 180 million (PV, 2011 prices) for the Birmingham service. Although the benefits of the London service would not cover its operational cost, the Birmingham service would. However, as well as needing to cover the costs of operation, these services would also have to cover the capital cost of providing the connection to the conventional network. 6.9 Summary There are three large cities in the East Midlands that have the potential to be served by HS2: Nottingham, Derby and Leicester. Initial demand and appraisal work compared options for city-centre connections to these cities, either as a through station or via a spur line. It was identified that a Leicester station would cost more and deliver lower overall benefits than either Derby or Nottingham stations. As a result, Leicester options were not progressed Following the initial analysis, the focus of option development was on how to serve Nottingham and Derby city centre stations, with options for conventional rail spurs and through services considered. For Nottingham, a spur option generated more benefits than the through option, while for Derby the through option was found to deliver a significantly better service (and so greater benefits) to Derby and the East Midlands The Nottingham spur is much more expensive to implement than the Derby through, but has few additional benefits. The Derby through station was therefore preferred from a demand and appraisal perspective As it was difficult to serve both Nottingham and Derby directly, a compromise option for a station in between Derby and Nottingham was considered. The existing East Midlands Parkway station and a new interchange station at Toton were considered The demand analysis showed that as long as Toton is served by heavy rail, it provided the greatest benefits and revenues of the two options. In addition, East Midlands Parkway is located in the green belt and hence development around the station would not be supported As it was anticipated that the difference in costs for providing conventional rail connections at these two locations would be negligible, Toton was taken forward to the final round of testing as the preferred interchange station location Toton station attracted higher demands than Derby, leading to higher overall benefits, which were more than enough to offset the higher costs of construction for Toton Further work was then undertaken to enhance the Toton option by considering the effects of introducing additional classic-compatible services to Nottingham and/or Derby centres, although this would require additional infrastructure. 60
68 6 East Midlands For Derby it was found that the classic-compatible services could not cover the costs of the additional services. For Nottingham classic-compatible services to London and Birmingham were considered (since existing services between Birmingham and Nottingham are somewhat poorer than Derby). It was found that the London classic-compatible service to Nottingham could not cover the costs of the additional services, but an enhanced service to Birmingham service to Nottingham could. 61
69
70 7 South Yorkshire The analysis identified that although a city-centre station would provide Sheffield with greater benefits, these benefits would be more than cancelled out by the costs of slower journey times imposed on through passengers. Therefore we considered whether it were possible to enhance the Meadowhall option through the use of a low cost, classic-compatible Spur into the city centre in addition to a Meadowhall station Such a spur could provide additional connectivity and improved accessibility to HS2 across South Yorkshire. Services could be provided for a city-centre station in two ways: redirecting the service which terminated at Meadowhall to serve Sheffield Midland instead; or an additional service to serve the city centre The option of redirecting services away from Meadowhall into a city centre station initially seemed attractive. This would limit the costs of the scheme, while potentially enhancing the benefits through improving accessibility across Sheffield and the wider region. However, although adding the station stop improves the accessibility of HS2 stations, this is more than offset by the less frequent and slower services. Overall therefore, a replacement service was found to reduce benefits One way of overcoming the dis-benefits to passengers from redirecting services is to run an additional service. This means that service levels are maintained at Meadowhall, but provides additional choice for passengers. It allows passengers to take advantage of the greater accessibility of some areas to a city centre station, without dis-benefiting those who use Meadowhall However while this option will overcome the dis-benefits of redirecting services to Sheffield Midland, it also imposes greater operating costs. The analysis showed that little additional demand is generated in South Yorkshire and the average time saving per passenger is small. Hence both the additional economic benefits and additional revenue are small for this test, resulting in a low BCR. 7.2 Current Rail Services and Demand The largest area of demand in South Yorkshire is Sheffield, a city with a population of around 550,000. A number of local and long-distance train services currently serve Sheffield Midland Station. These local services extend to Manchester, Huddersfield, Leeds, Doncaster, Lincoln and Nottingham with a light rail system (Supertram) within Sheffield and extending out as far as the Meadowhall shopping centre and corresponding to the approximate location of the proposed HS2 interchange station. There are now committed proposals to develop a Bus Rapid Transit System between Sheffield and Rotherham, one route of which would also pass through Meadowhall. The area of interest is illustrated in Figure
, Birmingham (2tph), East Midlands (4tph to Derby), Manchester (2tph),")
71 7 South Yorkshire Figure 7.1 South Yorkshire location map Sheffield currently has direct train services to many of the destinations that will be served by HS2, including London (2tph), Birmingham (2tph), East Midlands (4tph to Derby), Manchester (2tph), Leeds (4tph) and East Coast Mainline stations in the northeast (York (2tph), Darlington (2tph) and Newcastle (2tph)) although not all destinations will be on direct HS2 services from Sheffield Table 7.1 shows the present day (2010/11) numbers of weekday rail trips to and from Sheffield and a number of key long-distance stations derived from the PFM. 64
72 7 South Yorkshire Table /11 Weekday rail trips to and from Sheffield Sheffield to: Weekday Rail Trips (Two-way) London 2,700 Birmingham 700 Nottingham 800 Liverpool 400 Manchester 2,600 Leeds 2,500 Newcastle 200 Note: The daily trips are rounded to the nearest 100 trips if over 100 and the nearest 10 trips if less than 100. All trips come from PFM The greatest long-distance demand to/from Sheffield is to London, Leeds and Manchester, with lower levels of demand to Nottingham, Birmingham and Liverpool. The level of demand is important for the overall case for HS2, but in considering the implications of different station options we must consider where that demand comes from and therefore how accessible a new station might be To inform the identification of the location of the new high speed rail station, we need to understand where people who may use the high speed rail service are travelling from and to. In doing so, we consider long-distance rail trips (defined as more than 50 miles) as this represents the main market for high speed rail, and business and leisure trips as these make up the vast majority of long-distance rail trips An analysis of the total demand for long-distance rail travel is shown in Figure 7.2. The figure is based on National Rail Travel Demand Survey (NRTS) data from 2004/5 and shows the most significant concentration of high rail demand is within Sheffield, particularly to the south and west of the city centre. There is a further concentration of high demand around Doncaster and an area of medium demand around Meadowhall to the north east of Sheffield. 65

73 7 South Yorkshire Figure 7.2 Long-distance rail demand in South Yorkshire (Source: NRTS) 7.3 Future-year rail services and demand without HS Moving to the forecast year, without HS2, the long-distance 2043 services from Sheffield are expected to be similar to the current services, with the same destinations served Looking now at passenger demand in 2043, Table 7.2 shows the number of forecast weekday rail trips to and from Sheffield and the same key long-distance stations shown in Table 7.1 taken from the PFM. 66
74 7 South Yorkshire Table Weekday rail trips to and from Sheffield Sheffield to: Weekday Rail Trips (Two-way) London 4,600 Birmingham 1,000 Nottingham 1,300 Liverpool 500 Manchester 3,800 Leeds 3,600 Newcastle 300 Note: The daily trips are rounded to the nearest 100 trips if over 100 and the nearest 10 trips if less than 100. All trips come from PFM Most noticeable is the significant growth in demand to and from London, Manchester and Leeds in 2043 compared with the present day. Sheffield to London, for example, increases from a daily two-way flow of 2,700 to 4,600, representing growth of 70%. Flows between Sheffield and Manchester and Leeds respectively register increases of 1,200 (45%) and 1,100 (45%) We now look at how and from where people access each of the stations to help our understanding of how the model represents the travel patterns in the region in 2043 without HS2. An understanding of both this and the travel patterns outlined above are important in order to locate an HS2 station in the region Figure 7.3 shows where passengers accessing Sheffield station by car come from, while Figure 7.4 shows the equivalent distribution for public transport. The majority of Sheffield Midland passengers access the station by public transport (12,000 passengers), with those accessing by car (1,900 passengers) generally originating to the south-west and in the immediate vicinity of Sheffield. Those accessing by public transport originate from a wider area, generally to the west of Sheffield, but also as far as Rotherham in the east. Access from the east is generally much lower, in part due to the proximity of Doncaster, which has a better range of long-distance services than Sheffield, particularly to London. 67
 Figure 7.")

75 7 South Yorkshire Figure 7.3 Access to Sheffield Midland station by car (Source: PFM) Figure 7.4 Access to Sheffield Midland station by public transport (Source: PFM) The majority of passengers using Sheffield Midland therefore choose to access the station by public transport, with greatest demand from the city centre and the corridor to the southwest of Sheffield. 68
76 7 South Yorkshire 7.4 Initial HS2 option assessment HS2 Ltd considered a wide variety of station options across South Yorkshire. Analysis rapidly focused on the area around Sheffield as this is the main economic centre in South Yorkshire and represents a significant centre of demand Our initial demand forecast analysis was constrained by the version of the model available at the time we therefore focused on the impact of alternative ways of serving Sheffield city centre. As the model developed, analysis of an option serving Meadowhall, on the outskirts of Sheffield, was also considered. Initial Analysis Sheffield City Centre A city centre station could be served either by a route through the city (a through route), a loop or a spur (with the mainline running to the east and north of the city). Each of these options represents a trade-off between the quality of service provided to Sheffield and South Yorkshire, the impact on passengers travelling to other destinations and the costs of the scheme. For the purposes of demand modelling, the key considerations were as follows: A through station would maximise journey time benefits to Sheffield by providing the most direct route. It would also improve the potential service frequency as markets could be combined. However the route would lead to a compromise on the speed of trains through Sheffield and as a result would add around six minutes to the journey times of passengers travelling to locations beyond Sheffield; this restriction would apply even to those services that did not stop at Sheffield. A loop station would provide similar benefits to a through, but would minimise the penalty on other passengers as trains that were not stopping in Sheffield could use the faster mainline. However the additional track would significantly increase costs; A spur has the benefit of being less costly than a loop (and in the case of Sheffield a through route) while still limiting the impact on passengers travelling beyond the city. However, operationally a spur can be limiting as it means the station cannot serve as an intermediate location. This is not a significant issue where the city served provides a significant level of demand (e.g. Birmingham, Manchester or Leeds) which can support a high frequency of services. If there is only limited demand, service frequency can suffer Analysis of demand in South Yorkshire suggested service frequency on a spur into Sheffield was likely to be a particular problem, particularly since the scope for additional trains along the main route between London and Birmingham was likely to be limited. Modelling suggested that demand from a Sheffield station on its own was unlikely to support much more than one train per hour. This compares with 2-3 trains per hour from through and loop stations (since demand from Leeds and other areas on the way to Sheffield could be combined). Table 7.3 below shows the demand from Sheffield to the main HS2 destinations. 69
77 7 South Yorkshire Table Weekday rail trips from Sheffield to main HS2 destinations South Yorkshire to: Weekday Rail Trips (Two-way) Average load on 400m train per hour London 5,200 30% Nottingham 2,000 11% Birmingham 2,400 14% Leeds 4,200 24% North East 1,300 7% Table 7.4 sets out the costs, benefits and revenue of the through, loop and spur options for an HS2 station at Sheffield Midland. Table 7.4 Costs and Benefits of Sheffield Midland through loop and spur options Present Value in (million) in 2009 Prices Incremental Cost (million) Benefits (million) Revenue (million) Comparative BCR Sheffield Midland Through vs. Sheffield Midland Spur 455m 9m - 275m 0.01 Sheffield Midland Loop vs. Sheffield Midland Spur 1,054m 777m 133m 0.84 Sheffield Midland Loop vs. Sheffield Midland Through 599m 768m 408m The analysis clearly shows that a through option is less favourable than either a spur or a loop. Compared to a spur, a through station in the city centre would cost more to construct due to the complexities of building through an urban area. A through station would offer benefits to Sheffield and the surrounding area because of the higher frequency of services. However this would largely be offset by the extra travel time of passengers travelling beyond Sheffield. Overall, a through route would also generate lower revenues, as passengers travelling through Sheffield will generally be travelling longer distances and paying higher fares. Penalising these passengers therefore has a bigger impact on revenues. Thus a through station would deliver similar benefits, but at substantially greater cost than a spur station A loop station would deliver similar benefits to Sheffield and the local area, but would not result in the same penalties for through passengers. Therefore, the loop option would deliver 70
78 7 South Yorkshire substantially more benefits than a through station. While the loop would cost more, the modelling suggests the BCR of this additional spending would be in excess of The assessment of costs and benefits for a spur compared to a loop is more balanced. A loop would deliver substantially higher benefits than a spur. These benefits would be enjoyed by people in Sheffield because the loop would allow more services to stop at Sheffield. However the costs of the loop would also be substantially higher than a spur As station options were refined two options were identified as the front runners if HS2 were to serve the city centre directly the existing Sheffield Midland station and an option at Sheffield Victoria located about 800m to the north of Midland station. There were subtle differences in journey times and accessibility of these stations. Sheffield Midland offers the best location in terms of demand as it is directly connected to conventional rail services serving a range of destinations in the Sheffield city region and beyond and therefore offers the best interchange opportunities. An HS2 station at Sheffield Victoria would require transferring rail passengers to make a tram trip between Sheffield Midland and Sheffield Victoria However, the extra cost of a loop serving Sheffield Victoria versus a spur was 500m, compared with 1,100m for a loop serving Sheffield Midland compared to a spur. Hence the loop at Sheffield Victoria is much cheaper and this option was taken forward. Wider station options Station options outside the city centre were assessed on the basis of engineering, sustainability and cost grounds, alongside a qualitative assessment of the accessibility of these stations Through this process, a station at Meadowhall was identified as a preferred location outside of Sheffield city centre. Located on one of the faster and cheaper routes through South Yorkshire, Meadowhall could be accessed by local and cross-country rail services and would enable higher frequency through services. As a result, Meadowhall was taken forward to the final stages of option evaluation. The station is away from the town centre, which has the biggest potential demand for HS2 services, but the relative size of the market is also important when considering journey times to locations further north. We estimate that around four-and-a-half times more passengers would travel on to places such as Leeds, York and Newcastle than would use the Meadowhall station. Conclusions of the initial analysis As mentioned earlier, initial modelling was based on a version of the model without the capability of looking at alternative station locations in detail. An updated version of the model was developed through 2011 to enable more detailed consideration of station options. This version of the model was used to undertake analysis for the final assessment of the following two options: interchange station at Meadowhall on the outskirts of Sheffield; and loop to Sheffield Victoria (with a 10-minute tram link to Sheffield Midland). 71

79 7 South Yorkshire 7.5 Meadowhall vs. Sheffield Victoria loop The stopping pattern used for these tests was the same as that assumed in the 2011 Economic Case for HS2 (Economic Case for HS2, The Y Network and London West Midlands, February 2011, DfT). The stopping patterns were the same for both stations, although journey times differed. Figure 7.5 shows the HS2 service specification we used to analyse the Meadowhall station scenario along with journey times to the HS2 destinations from South Yorkshire. Figure 7.6 shows the service specification and journey times for the Sheffield Victoria loop scenario. Services which start from or terminate at London are modelled as 400m trains, while services which start from or terminate at Birmingham are modelled as 200m trains. Notes: 1. Each line represents one train per hour 2. Journey times are those assumed in the demand modelling Figure 7.5 HS2 service specification: Meadowhall option 72

80 7 South Yorkshire Notes: 1. Each line represents one train per hour. 2. Journey times are those assumed in the demand modelling. Figure 7.6 HS2 service specification: Sheffield Victoria loop option Operating costs for the Meadowhall scenario and the Sheffield Victoria loop scenario are likely to be very similar, but the incremental cost of building the loop is estimated to be 900m PV. The analysis set out to identify whether there are sufficient benefits to make the additional cost value for money Meadowhall had the advantage of slightly faster journey times on HS2, and a lower overall cost, but it was also further away from the main centres of demand in central and south west Sheffield Figure 7.7 shows the composition of passengers using the station at Sheffield Victoria. The faster journey offered by HS2 would mean that all passengers who previously used Sheffield conventional services from Midland station to reach London would switch to using HS2, while 27% of passengers to London who previously used conventional rail services from Doncaster station would also switch to using HS2 services from Sheffield Figure 7.8 shows the comparable composition of passengers for a high speed rail station at Meadowhall. Due to this location being further from the centre of Sheffield, a proportion of passengers around 7% who previously used conventional services from Midland station to reach London would continue to do so, while a slightly higher proportion of Doncaster passengers would switch to HS2 services than with the Victoria option. This reflects the closer proximity of Meadowhall HS2 station to the Doncaster catchment area than Sheffield Victoria. 73
 7.5.")

81 7 South Yorkshire Figure 7.7 Source of 2043 rail demand for HS2 from South Yorkshire to London with an HS2 station at Meadowhall (Source: PFM) Figure 7.8 Source of 2043 rail demand for HS2 from South Yorkshire to London with an HS2 station at Sheffield Victoria (Source: PFM) There is greater demand overall for the Sheffield Victoria option, which is most noticeable for the main destinations served by HS2. For example, with HS2 through Meadowhall there are 900 passengers who travel to Birmingham Central and 1,700 who travel to Leeds, but with HS2 through Sheffield Victoria, this increases by 45% to Birmingham (1,300 passengers) and 75% to Leeds (3,000 passengers). Table 7.5 below shows the demand from Sheffield Victoria and Meadowhall to main HS2 destinations. 74
82 7 South Yorkshire Table Weekday rail trips from Sheffield Victoria and Meadowhall to main HS2 destinations South Yorkshire to: Sheffield Victoria Meadowhall London East Midlands HS 4,700 3, Birmingham 1, Leeds North East 3,000 1,700 1, However although it is clear that though a loop through Sheffield Victoria would provide more benefits particularly in the Sheffield area it is also a more expensive option. Our modelling suggests that the incremental economic benefits would be 480 million with an increase in revenue of 190 million. Even these increases in benefits and revenue are not enough to offset the additional substantial cost of the Sheffield city centre station option (currently estimated at 900 million PV), giving a benefit to cost ratio of The assessment therefore identified that Meadowhall offered the best overall value for money. 7.6 Classic-compatible spur to Sheffield Midland The analysis outlined above identified that although a city-centre station would provide Sheffield with more benefits, these benefits would be more than cancelled out by the higher construction costs. Therefore we considered the possibility of enhancing the Meadowhall option through the use of a low cost, classic-compatible spur into the city centre in addition to a Meadowhall station Such a spur could provide additional connectivity and improved accessibility to HS2 across South Yorkshire. Services could be provided for a city centre station in two ways: redirecting the service which terminated at Meadowhall to serve Sheffield Midland instead; or providing an additional service to serve the City Centre The analysis of these options is discussed in turn in the remainder of this section. Redirecting services from Meadowhall scenario The option of redirecting services away from Meadowhall into a city centre station initially seemed attractive. This would limit the costs of the scheme while aiming to enhance the benefits through improving accessibility across Sheffield and the wider region. 75

83 7 South Yorkshire We considered the HS2 services that would access South Yorkshire, before considering the expected demand. Figure 7.9 shows the replacement classic-compatible service scenario specification. With HS2, the journey time from Sheffield to London has reduced from 126 minutes to 72 minutes from Meadowhall and to 81 minutes from Sheffield Midland. It is forecast to take nine minutes longer from Sheffield Midland compared to Meadowhall due to the route. For this test, the train stopping at Sheffield Midland has been modelled as a 200m train due to the length of platforms available at Sheffield Midland station. Notes: 1. Each line represents one train per hour 2. Journey times are those assumed in the demand modelling Figure 7.9 HS2 service specification: Replacement classic-compatible services The expected infrastructure cost of allowing a classic-compatible service to use Sheffield Midland is 205 million. There will also be additional costs for the classic-compatible rolling stock Table 7.6 below shows the daily boardings on each of the London-destined services calling at South Yorkshire in this scenario. The HS2 demand in this scenario is considerably reduced on these services from the base scenario by around 1,700 trips. 76
84 7 South Yorkshire Table 7.6 Daily 2043 southbound weekday rail trips on trains to London from South Yorkshire for Meadowhall scenario and replacement classic-compatible services Services: Meadowhall Option Replacement classiccompatible Spur to City Centre Southbound on Meadowhall to London Train from South Yorkshire Southbound on Leeds to London Train from Meadowhall Southbound on City Centre to London Train from City Centre 3, ,200 1, ,500 Total 6,800 4, Although serving two stations means that accessibility to HS2 services is increased, the modelling suggests that total demand from Sheffield and South Yorkshire will fall. The demand for HS2 on southbound services from Meadowhall is 6,800 and from Sheffield Midland is 4,300, a reduction of around 2,500 HS2 passengers compared to Meadowhall on its own The reason for this reduction in demand is due to the changes in the frequency of services and journey times on HS2. By splitting services between the two destinations, passengers face a worse service proposition on HS2. From Meadowhall, frequency is reduced from two to one train per hour. At Sheffield Midland passengers only have one train per hour and a nine minute increase in journey time. Although adding the station improves the accessibility of HS2 stations, this is more than offset by the less frequent and slower services. Accessibility improves by 16 million, but frequency and time savings fall by 65 million in 2009 prices Overall therefore, a replacement service would reduce benefits by around 160 million NPV and revenue by 110 million NPV. Additional classic-compatible services One way of overcoming the dis-benefits to passengers from redirecting services is to run an additional service. This means that service levels are maintained at Meadowhall, but provides additional choice for passengers. It allows passengers to take advantage of the greater accessibility of some areas to a city centre station, without dis-benefiting those who use Meadowhall Figure 7.10 shows the additional classic-compatible service scenario specification. Again, with HS2, the journey time from Sheffield to London has reduced from 126 minutes to 72 minutes from Meadowhall and to 81 minutes from Sheffield Midland, and the train stopping 77

85 7 South Yorkshire at Sheffield Midland has been modelled as a 200m train due to the length of platforms available at Sheffield Midland station. Notes: 1. Each line represents one train per hour 2. Journey times are those assumed in the demand modelling Figure 7.10 HS2 service specification: additional classic-compatible services However while this option will overcome the dis-benefits of redirecting services to Sheffield Midland, it also imposes greater operating costs. An additional classic-compatible service from London to Sheffield Midland is estimated to cost 705m NPV. This is in addition to the 205m NPV cost of building the additional infrastructure Table 7.7 below shows the daily boardings on each of the London destined services calling at South Yorkshire in this scenario. The HS2 demand is still smaller than the base situation but only by around 400 trips. 78
86 7 South Yorkshire Table 7.7 Average daily 2043 southbound demand on trains to London from South Yorkshire for Meadowhall scenario and additional classic-compatible service scenario Services Meadowhall Option Additional classiccompatible Spur Service to City Centre Option Southbound on Meadowhall to London Train from South Yorkshire 3,200 1,700 Southbound on Leeds to London Train from Meadowhall 3,200 1,700 Southbound on City Centre to London Train from City Centre 0 2,600 Total 6,400 6, The improved accessibility means benefits for passengers overall, which is reflected in a slight increase in passengers across the Midland and Meadowhall stations (compared to Meadowhall alone). Demand at Meadowhall falls to 8,700 as passengers switch to Midland, with demand on HS2 services from Sheffield Midland being 2, The expected increase in benefits for the additional service relative to the Meadowhall scenario is 437 million NPV, with an expected increase in revenue of 187 million NPV, giving a BCR of 0.6. However, looking at the breakdown of benefits by region, half of these benefits are experienced by the passengers in the East Midlands due to the additional hourly service at Toton on the London to South Yorkshire classic-compatible service, and just 13% of the benefits accrue to Yorkshire and the Humber. Similarly, almost half (47%) of the revenue increase relates to East Midlands trips, with just 3% from Yorkshire and the Humber. These low benefits and revenues for South Yorkshire and the surrounding region are because, although there is significant switching to a city-centre station, little additional demand is generated in South Yorkshire and the average time saving per passenger who switches station is small. Hence both the additional economic benefits and additional revenue are small for this test. 7.7 Summary Initial analysis was focused on the impacts of serving Sheffield city centre due to limitations imposed by the version of the model available at the time. However, as the model developed, enhanced analysis of a lower-cost option for serving Meadowhall, on the outskirts of Sheffield, was also considered Through, spur and loop options to serve Sheffield were compared and the loop option was identified as the preferred option as it provided substantially higher benefits. This is because 79
87 7 South Yorkshire the loop would allow more services to stop at Sheffield while not penalising non-stopping services Two options were identified to serve the city centre directly the existing Sheffield Midland station and an option at Sheffield Victoria. While Sheffield Midland offered the best location in terms of demand, the loop at Sheffield Victoria was much cheaper and hence this option was taken forward Next, options for stations outside the city centre were assessed on the basis of engineering, sustainability and cost grounds, alongside a qualitative assessment of the accessibility of these stations. Through this process, a station at Meadowhall was identified as a preferred location outside of Sheffield city centre. However the station is away from the town centre, which has the biggest potential demand for HS2 services Two options were therefore taken forward from the initial analysis for more detailed assessment as follows: A loop to Sheffield; and, An interchange station at Meadowhall on the outskirts of Sheffield A comparison of the Meadowhall option and the Sheffield Victoria loop option showed that Meadowhall offered the best overall value for money The next step was to consider options for enhancing the Meadowhall option through the use of a low cost, classic-compatible spur into the city centre in addition to a Meadowhall station. Services could be provided for a city centre station in two ways: redirecting the service which terminated at Meadowhall to serve Sheffield Midland instead; or an additional service to the city centre The redirected service was found to reduce benefits while providing an additional service to the city centre only generated small economic benefits and additional revenue and hence gave a low BCR. Neither option was therefore recommended to be taken forward. 80
88
, London (2tph), Birmingham (1tph), Manchester (4tph),")
89 8 Leeds Figure 8.1 Leeds study area Leeds currently has direct rail services to many of the destinations served by HS2 including the East Midlands (1tph Derby and Nottingham), London (2tph), Birmingham (1tph), Manchester (4tph), Liverpool (1tph), York (5tph) and the North East / Scotland (2tph Newcastle, 1tph Edinburgh, 1tph Glasgow) Table 8.1 shows present day (2010/11) numbers of weekday rail trips to and from Leeds and a range of key long-distance stations derived from our model. 82
90 8 Leeds Table /11 Weekday rail trips to and from Leeds Leeds to: Weekday Rail Trips (Two-way) London 4,700 Birmingham 400 Nottingham 200 Sheffield 2,500 Manchester 3,300 Newcastle 800 Note: The daily trips are rounded to the nearest 100 trips if over 100 and the nearest 10 trips if less than 100. All trips come from PFM The greatest long-distance demand to/from Leeds is to London, with over 4,700 trips being made on average on each weekday. There are also high numbers of trips made to Manchester and Sheffield To inform the identification of the location of the high speed rail station, we need to understand where people who may use high speed rail are travelling from and to. In doing so, we consider long-distance rail trips (defined as more than 50 miles) as this represents the main market for high speed rail, and business and leisure trips as these make up the vast majority of long-distance rail trips An analysis of the total demand for long-distance rail travel is shown in Figure 8.2. The figure is based on National Rail Travel Demand Survey data from 2004/5 and shows a high concentration of high rail demand in central Leeds. There is also high demand from the wider city region, particularly to the north of the city centre and from Bradford. 83

91 8 Leeds Figure 8.2 Long-distance rail demand in Leeds (source: NRTS) The NRTS data also suggests that currently 19% of passengers boarding a train at Leeds accessed the station by rail, which is a relatively high proportion. This indicates that the HS2 station will need to be located close to the existing station in order to provide access to the wider West Yorkshire region for these interchanging passengers. 8.3 Future-year rail services and demand without HS Moving to the forecast year, without HS2, the long-distance 2043 services from Leeds are expected to be broadly unchanged from the current long-distance services Table 8.2 shows the number of forecast weekday rail trips to and from Leeds in 2043 and the same key long-distance stations shown in Table 8.1. The rail demand has again been taken from the PFM model. 84
92 8 Leeds Table weekday rail trips to and from Leeds Leeds to: Weekday Rail Trips (Two-way) London 9,200 Birmingham 700 Nottingham 300 Sheffield 3,600 Manchester 5,100 Newcastle 1,200 Note: The daily trips are rounded to the nearest 100 trips if over 100 and the nearest 10 trips if less than 100. All trips come from PFM Most noticeable is the significant growth in demand to and from London, Sheffield, and Manchester in 2043 compared to the present day. Leeds to London, for example, increases from a two-way flow of 4,700 to 9,200, representing an increase of 95%. Flows between Leeds and Sheffield and Manchester respectively register increases of 1,100 (44%) and 1,800 (60%) In order to demonstrate how our model represents travel patterns around Leeds, we now illustrate how and from where passengers are expected to access Leeds station Figure 8.3 shows where the passengers (residents and non-residents) accessing Leeds station (and making long-distance rail journeys) by car come from, and Figure 8.4 shows where the passengers accessing Leeds by public transport come from. The vast majority of Leeds passengers access the station by public transport (15,900 passengers), with those accessing by car (2,500 passengers) generally originating very close to Leeds city centre. Those accessing by public transport originate from a much wider area in all directions of the city centre, as far away as Harrogate and Skipton. The areas of high demand follow metropolitan railway lines into Leeds, for example, from Ilkley and Harrogate. It is worth noting that Wakefield has much easier road access and parking than Leeds so most passengers who use car to access rail prefer it. 85
 8.3.")

93 8 Leeds Figure 8.3 Access to Leeds station by car (Source: PFM) Figure 8.4 Access to Leeds station by public transport (Source: PFM) Demand to Leeds comes from the wider city region. There are few direct services from the areas around Leeds to long-distance destinations and so passengers from Bradford, Ilkley, Harrogate and Skipton travel to Leeds by train to access intercity services. 86
94 8 Leeds 8.4 HS2 options The geographical proximity of station options in Leeds was beyond the limits of robust analysis within the model. Even with the enhanced model, all of the options lay within two zones, which meant the model could not effectively distinguish between them However some strategic-level analysis was conducted using model results to help HS2 understand the approximate order of magnitude of different trade-offs when considering station options. The main trade-offs are: differences in journey time slightly longer for Leeds station North; differences in construction (and operating) costs lower for the Sovereign Street and New Lane options; and differences in walk time for city centre and interchange passengers lower for the Leeds Station North option Two types of tests were conducted: Tests that indicated the value of different journey times on the approach to Leeds. These showed that a one minute reduction in journey time provided benefits of around 200m; Similarly tests suggested that adding walk time from Leeds Central Station to a new high speed station would reduce benefits for interchange passengers. A five-minute walk between stations was estimated to reduce benefits by around 150m and revenues by 50m These results were used to extrapolate indicative results to compare some of the final station options. Tables 8.3 (Components of Benefits) and 8.4 (Total Benefits and Costs) below summarises analysis for the three final options. Table 8.3 Benefit components for the Leeds station options compared to Leeds Station North option Difference in Stations walk time equivalent to Leeds Station platforms Benefit for interchange passengers Estimated benefit for city centre passengers Journey time Journey time benefits (million) Leeds Station North hr 17 0 Sovereign - 180m to +4-6mins - 180m Street South - 260m 1hr m New Lane +3-5mins - 140m - 130m to - 220m 1hr m 87
95 8 Leeds Table 8.4 Total benefits components and costs for the Leeds station options compared to Leeds Station North option Station Total benefits Cost Net present value Leeds Station North Sovereign Street South - 160m to - 240m - 240m 0m to 80m New Lane - 70m to - 160m - 280m 120m to 200m Impacts on passengers walking to the station are based on data from the National Rail Travel Survey showing that 22% of passengers using Leeds Central station currently walk. It was assumed that all of these passengers would have an additional walk to reach the Sovereign Street and New Lane stations. This is almost certainly a conservative assumption since some passengers (walking from the south side of the city) would actually have shorter walk times to reach these locations. This does not change the conclusions of the optioneering exercise; indeed, taking account of this point is likely to strengthen the case for Sovereign Street and New Lane stations This analysis also does not take into account any potential benefits accruing to passengers accessing the HS2 station by car. Compared to the Leeds Station North option, both southern station locations (especially New Lane) offer greater opportunities to provide car parking facilities as well as faster access to the strategic highway network via the M These results are only indicative. They suggest that the benefits of faster journeys and the potential for cost savings for New Lane and Sovereign Street options are likely to offset the dis-benefits of poorer connections to the existing conventional rail station. 8.5 Summary Three station locations were considered for Leeds station: Leeds Station North, Sovereign Street South and New Lane The geographical proximity of station options in Leeds was beyond the limits of robust analysis within the model so the results are only indicative. However, the analysis suggested that the benefits of faster journeys and the potential for cost savings for New Lane and Sovereign Street options are likely to offset the dis-benefits of poorer connections to the existing conventional rail station This analysis did not take into account any potential benefits accruing to passengers accessing the HS2 station by car. Compared to the Leeds Station North option, both southern station locations (especially New Lane) offer greater opportunities to provide car parking facilities as well as faster access to the strategic highway network via the M
96

97 9 Joining the East Coast Mainline Option 4 comprised a connection north of York with an interchange station at Knaresborough. This option offered the potential for time savings to Darlington and Newcastle, while at the same time potentially offering improved accessibility to some passengers who would have chosen to use York station. Overall this option performs worse than Option 3 as while Knaresborough does improve accessibility, it does not make up for the loss of services to York nor does it add significant levels of demand. 9.2 Current rail services and demand The ECML runs from London to Edinburgh via Peterborough, Doncaster, York, Darlington and Newcastle. York, although a relatively small city with a population of 138,000, is a major tourist destination and has traditionally been a transport hub within the UK. Darlington is a market town with a population of 98,000, but provides access to the whole of Teeside (population 365,000), and while Newcastle has a population of 190,000, the entire Tyneside conurbation has a population of 880,000. All these provide a large potential set of markets that can benefit from HS2. Figure 9.1 illustrates the area of interest. Figure 9.1 Joining the East Coast Main Line: area of study York, Darlington and Newcastle currently have direct services to London (3tph from York and 2tph from Darlington and Newcastle) as well as other locations which HS2 will be serving, namely: Manchester Piccadilly (2tph); Sheffield (2tph); Leeds (5tph); and Birmingham (2tph) Table 9.1 shows present day number of weekday rail trips to and from Newcastle, Darlington and York and a number of key long-distance stations derived from the PFM model. For each of the three locations, demand is greatest to and from London, with much lower numbers of trips being made to the other long-distance locations. 90
98 9 Joining the East Coast Mainline Table /11 Weekday rail trips to and from Newcastle, Darlington and York Newcastle (Two-way) Darlington (Two-way) York (Two-way) London 2,900 1,100 3,300 Birmingham Nottingham Manchester ,000 Edinburgh 1, Note: The daily trips are rounded to the nearest 100 trips if over 100 and the nearest 10 trips if less than 100. All trips come from PFM. 9.3 Future-year rail services and demand without HS Moving to the forecast year, without HS2, the long-distance 2043 services from York, Darlington and Newcastle are expected to be broadly similar to the current services, with the same destinations served Table 9.2 shows the number of forecast weekday rail trips to and from Newcastle, Darlington and York in 2043 and the same key long-distance stations shown in Table 9.1. As for 2010, rail demand has been taken from the PFM model. Table Weekday Rail Trips to and from Newcastle, Darlington and York Newcastle (Two-way) Darlington (Two-way) York (Two-way) London 5,200 1,900 6,300 Birmingham Nottingham Manchester ,400 Edinburgh 2, Note: The daily trips are rounded to the nearest 100 trips if over 100 and the nearest 10 trips if less than 100. All trips come from PFM Between the present day and 2043, all three stations show the largest absolute increase in rail demand to and from London: Newcastle: from 2,900 to 5,200 (80%); 91
99 9 Joining the East Coast Mainline Darlington: from 1,100 to 1,900 (73%); and York: from 3,300 to 6,300 (90%). 9.4 HS2 options While a number of alternative route options and locations for the ECML connection were considered initially, for the purposes of modelling they can largely be categorised as whether they connect north or south of York (and thereby exclude York from HS2 services). We also investigated different locations for interchange stations, with a stop at or near Garforth modelled for an ECML connection south of York and a stop at or near Knaresborough for connections north of York The tests undertaken were: Base Option: Connection south of York; Option 1: Connection south of York with an interchange near Garforth; Option 2: Connection south of York with an interchange near Garforth, without stop at York; Option 3: Connection north of York; and Option 4: Connection north of York with a Knaresborough Interchange The next section starts by examining the base scenario and thereafter each of the options in turn. For all of our options, we have a service pattern of three train services running onto the ECML, comprising two services to/from London and a single service to/from Birmingham. For the purposes of these tests we have assumed the existing level of conventional rail provision to all stations We have also assumed a one train per hour direct HS2 service from Edinburgh to London via the West Coast route so that the analysis is not clouded by passengers from Edinburgh who may try to access HS2 services at Newcastle in the model. Base option For the base option all three services are assumed to run via a connection to the ECML to the south of York and stop at the existing York station Figure 9.2 shows the HS2 service specification for the base scenario along with journey times to London from the North East. Each vertical line represents one train per hour with the journey times between stops provided (allowing a two-minute stop at each station). Journey times from York to London have reduced from the current times of 124 minutes to 98 minutes, with journey times from Newcastle to London reducing from the current time of 180 minutes to 158 minutes. 92

100 9 Joining the East Coast Mainline Notes: 1. Each line represents one train per hour 2. Journey times are those assumed in the demand modelling Figure 9.2 HS2 service specification: base option Table 9.3 shows demand from York and Darlington to London. It shows that with the introduction of HS2 and hence the faster journey times there are significant increases in the number of trips. Table 9.3 Daily rail demand from the North East to London with and without HS2 in 2043 No HS2 With HS2 York HS2 0 3,900 York - Conventional 4,100 3,500 Darlington HS2 0 3,100 Darlington Conventional 1, Total 5,900 10,900 Option 1 vs. Base option: Connection south of York We now consider how demand changes when HS2 is connected to the ECML south of York, with an additional stop at a new high speed station at Garforth. Figure 9.3 shows the service specification and journey times for Option 1. With an additional stop at Garforth, there is an increase in journey time of five minutes from the North East to London. 93
 9.4.9 With Option 1, demand from York falls slightly as some passengers would find Garforth more accessible.")
101 9 Joining the East Coast Mainline Notes: 1. Each line represents one train per hour 2. Journey times are those assumed in the demand modelling Figure 9.3 HS2 service specification: option 1 (Garforth and York) With Option 1, demand from York falls slightly as some passengers would find Garforth more accessible. The station would also abstract passengers from the Wakefield area (many of whom would otherwise use the high speed station at Leeds). Hence while Garforth station would see around 4,000 passengers using high speed services, there would be very little increase in the total number of passengers on HS2 from the Yorkshire area While there are some benefits for passengers in the Yorkshire area from greater accessibility to HS2, the time penalty associated with serving the station leads to a reduction in benefits overall for passengers further north. This more than offsets any benefits from improved accessibility, meaning the Garforth station reduces benefits compared to the base option by 365m and reduces revenues by 440m. 94
, with an additional stop at Garforth. Figure 9.")
102 9 Joining the East Coast Mainline Option 2 vs. base option: Garforth no York We now consider how demand changes when HS2 is connected to the ECML south of York, (and the train services do not stop at York), with an additional stop at Garforth. Figure 9.4 shows the service specification and journey times for Option 2. For the modelling test it has been assumed that by removing the stop at York, journey times to Darlington and Newcastle are faster than in the base option by three minutes. However, it should be noted that the exact journey time reduction achieved by not stopping at York is dependent upon the exact HS2 track arrangements developed through the station. Notes: 1. Each line represents one train per hour 2. Journey times are those assumed in the demand modelling Figure 9.4 HS2 service specification: option 2 (Garforth, no York) With Option 2, the total HS2 demand from Garforth is expected to be 4,700; slightly higher than an option including the stop at York. However this increase is more than offset by the reduction in passengers at York. Indeed some 75% of passengers using York station would choose to continue to use conventional services if HS2 services did not stop at York Again, while this option reduced the impact of journey time penalties on Darlington and Newcastle, overall demand for HS2 services was lower than the base option, mainly due to the removal of the York market, leading to lower overall benefits. Indeed this option had lower benefits than Option 1 by 360m and lower revenues by 220m. Option 3 vs base option: connection north of York Options 1 and 2 are effectively low cost solutions, connecting to the ECML at relatively low cost, and then looking at whether an interchange station or alternative stopping patterns could improve the benefits. However alternative options were identified which connected to the ECML north of York. These could provide significant further journey time savings to passengers from Darlington and Newcastle stations, but are more expensive and would not 95
103 9 Joining the East Coast Mainline serve the existing York station. Figure 9.5 shows the service specification and journey times for Option 3. Through removing the stop at York and joining up the ECML north of York, there is a reduction in journey time of 14 minutes from Darlington and Newcastle to London. Notes: 1. Each line represents one train per hour 2. Journey times are those assumed in the demand modelling Figure 9.5 HS2 service specification: option 3 (York Bypass) The journey time saving generates a 15% increase in passenger numbers from Darlington and Newcastle stations compared to the Base Scenario. However, demand from Yorkshire falls since HS2 services would no longer call at York station. The 14-minute saving in journey time to connect to the ECML at Northallerton without any interchange stations delivers greater benefits than the loss of benefits relating to the reduction in passengers to York. Compared to the base option there is therefore expected to be an overall increase in benefits of around 700m PV However, in the case of the additional benefits generated from Newcastle and Darlington stations, it was recognised that potential changes in the WebTAG guidance as a result of changes in the Passenger Demand Forecasting Handbook (PDFH) 12 might have a significant negative impact on future levels of demand growth to and from these stations. This change would have the effect of reducing the impact of the benefits of the journey time savings this option offers the North East of England. It is therefore unclear whether the scale of these benefits may cover the cost of this option and as a result passive provision has been made for this possible expansion in the future. Base vs. option 4: connection north of York with a Knaresborough interchange An interchange station at Knaresborough has the potential to offer time savings to the markets of Darlington and Newcastle, while at the same time potentially offering improved 12 This relates to a changes from PDFH4 to PDFH5 for the distance element of the GDP elasticities 96
104 9 Joining the East Coast Mainline accessibility to some passengers who would have chosen to use York station. The question was whether the accessibility and connectivity would be good enough to attract these passengers Figure 9.6 shows the service specification and journey times for Option 4. Introducing a stop at Knaresborough interchange gives a reduction in journey time of seven minutes for services that stop there (in Option 4, it is envisaged that one service does not stop at Knaresborough Interchange, and so maintains the 14-minute journey time saving). Notes: 1. Each line represents one train per hour 2. Journey times are those assumed in the demand modelling Figure 9.6 HS2 service specification: option 4 (York Bypass with Knaresborough interchange station) A high speed station at Knaresborough is forecast to attract just over 1,000 passengers a day in 2043 on services to London. An analysis of the passengers using Knaresborough station in this option shows they would otherwise have used York or Leeds stations. However, this represents only a small proportion of the total demand from these stations. Knaresborough does improve accessibility, but it does not make up for the loss of services to York nor does it add significant levels of demand Overall this option performs worse than Option 3. While there may be some benefits to passengers using Knaresborough station, there would be a journey time penalty of up to seven minutes for passengers from Darlington and Newcastle (compared to Option 3 without Knaresborough). 97
105 9 Joining the East Coast Mainline 9.5 Summary For all the option tests, we assumed a service pattern of three train services running onto the ECML, comprising two services to/from London and a single service to/from Birmingham. For the purposes of these tests we have assumed the existing level of conventional rail provision to all stations For the base option all three services run via a connection to the ECML to the south of York and stop at the existing York station. Options 1 to 4 are compared in turn to the base option Option 1 comprised a connection to the ECML south of York, with an additional stop at a new high speed station at Garforth. While there are some benefits for passengers in the Yorkshire area from greater accessibility to HS2, the time penalty associated with serving Garforth station leads to a reduction in overall benefits that more than offsets any benefits from improved accessibility in Yorkshire Option 2 involves a connection to the ECML south of York, a stop at a new high speed station at Garforth but no stop at York. By removing the stop at York, the time penalty of stopping at Garforth station is reduced but this is more than offset by the reduction in passengers at York resulting in lower benefits than Option Option 3 involves connecting north of York with no stop at York. Compared to the base option there is expected to be an overall increase in benefits that may be sufficient to cover the additional costs. However it was recognised that potential changes in WebTAG might have a significant negative impact on future levels of demand growth to and from Darlington and which would have the effect of reducing the impact of the benefits of the journey time savings to the North East of England offered by this option. As a result, passive provision has been made for this possible expansion in the future Option 4 comprised a connection north of York with an interchange station at Knaresborough. Overall this option performs worse than Option 3 since while Knaresborough does improve accessibility, it does not make up for the loss of services to York nor does it add significant levels of demand. 98
106

. Figure 10.1: Base service pattern for West side services and average load factors 10.3.2 Figure 10.")
107 10 HS2 Service Pattern Optimisation 10.3 Optimising HS2 service patterns in the West Base service pattern for the West side The initial service pattern for trains from London is shown in Figure 10.1 below. We can see from this that there are high load factors on the London to Liverpool service (Trains 7 and 8) and on the Scotland service calling at Birmingham Interchange (Train 10). Figure 10.1: Base service pattern for West side services and average load factors Figure 10.2 shows the base service pattern from Birmingham on the west side along with load factors. 100


108 10 HS2 Service Pattern Optimisation Figure 10.2 Base service pattern and load factor for Birmingham trains to the North West Issues for the West side The main issues for the Western side are the high load factors on Trains 7, 8 and 10 and the following options were considered: balancing demands to Stafford and Preston; balancing the demands of the Liverpool/ Stafford/Crewe; serving Stoke and Preston; optimising the Preston market and whether it is worthwhile serving Blackpool or Lancaster; and the potential for additional stops on Birmingham to Scotland services to improve load factors. 101


109 10 HS2 Service Pattern Optimisation 10.4 Optimising HS2 Service Patterns in the East Base service pattern for the East side The base service pattern and average load factors for the east side of the HS2 network is shown in Figure In addition to 5tph to and from London, an additional 4tph are planned to start and finish at Birmingham. Figure 10.3 Base service pattern for East side services and average load factors Issues for the East side Looking across the services in this figure we can see that the main issues for the eastern side are: the load factors on Train 13 are particularly high to Toton; whether further benefits for the London to Leeds services could be provided; and, the services from Birmingham to the North East are lightly loaded In addition to these options, we know that there is capacity on the trunk of HS2 for one additional path, which has previously been allocated to the eastern leg. We considered the following options for this path: to have a fourth train to Leeds, potentially improving the frequency from London to East Midlands, South Yorkshire and/or Birmingham Interchange; and to have a London to York service potentially improving the frequency from London & York to East Midlands and/or South Yorkshire. 102
110 10 HS2 Service Pattern Optimisation Finally, in addition to the London services we also investigated whether there should be 1tph or 2tph between Birmingham Central and Newcastle Summary of proposed service pattern The final HS2 service pattern that was taken forward for the western side includes: 1tph (400m train) London to Birmingham Interchange which then splits so 1tph (200m train) goes to Birmingham Curzon St and 1tph goes to Liverpool calling at Stafford and Runcorn; 2tph London to Birmingham Curzon St including 1tph calling at Birmingham Interchange 400m trains; 3tph London to Manchester including 1tph calling at Birmingham Interchange 400m trains; 1tph London to Liverpool calling at Crewe and Runcorn 200m train 13 ; 1tph London to Preston calling at Crewe, Warrington and Wigan 200m train 14 ; 2tph (400m train) London to Carstairs which then splits so 2tph (200m train) go to Glasgow and 2tph (200m train) go to Edinburgh including 1tph (400m train) calling at Birmingham Interchange and 1tph (400m train) calling at Preston; 2tph Birmingham to Manchester 200m trains; 1 train every two hours Birmingham Curzon St to Glasgow calling at Wigan, Preston, Lancaster, Penrith, Carlisle and Lockerbie alternating with; 1 train every two hours Birmingham Curzon St to Edinburgh calling at Wigan, Preston, Oxenholme, Carlisle and Lockerbie The final HS2 service pattern that was taken forward for the eastern side includes: 3tph London to Leeds which includes 2tph calling at Toton, 2tph calling at Meadowhall and 1tph calling at Birmingham Interchange 400m trains; 1 tph London to York which calls at Toton (making 3tph in total London to Toton) - 200m train; 2tph London to Newcastle including 1tph calling at York (making 2tph in total London to York) and 1tph calling at Darlington 200m trains; 2tph Birmingham Curzon St to Leeds both calling at Toton and Meadowhall 200m trains; 1tph Birmingham Curzon St to Newcastle calling at Toton and Meadowhall (making 3tph in total between Birmingham Curzon St and Toton and Meadowhall), also calls at York, Durham and Darlington 200m trains. 13 Running 260m trains would be beneficial in improving crowding but the business case took a conservative view in running this service as a 200m train 14 Running 260m trains would be beneficial in improving crowding but the business case took a conservative view in running this service as a 200m train 103
111
112
113 11 HS2 and Released Capacity Service Specification 11.3 Initial specifications of conventional lines Initial investigations of the residual conventional services looked at various service groups for example those on the ECML, Midland Main Line (MML) and between Birmingham and Scotland We looked at a range of data from the model outputs including seating capacities, load factors on trains and origin-destination data. We used this data to identify where trains were heavily loaded, where conventional services could be rationalised or withdrawn and where we could optimise stopping patterns to better target demand From this work, we can draw together a number of high-level conclusions, all of which are made with reference to the demand represented in our model: On the ECML we identified that 1tph from London to each of Leeds, Newcastle and Edinburgh would be sufficient in light of the above criteria, freeing spare train paths south of Peterborough for commuter services into London and allowing an hourly, semi-fast London-Lincoln service; On the MML, identified that 1tph from London to each of Sheffield and Nottingham would be sufficient in light of the above criteria, with an additional 1tph semi-fast service to the new Toton station, freeing spare train paths south of Bedford for commuter services into London; and On the WCML, identified that the Birmingham-Scotland services could be replaced by a high speed service, with the residual conventional service maintained as a Birmingham-Preston service Proposals also put forward for consideration were: Different stopping patterns on the ECML, MML and XC services; and, Additional services from Peterborough and Bedford to London (Kings Cross and St Pancras respectively) based on the fastest semi-fast/stopping services in the current timetable Optimising the conventional service specification We undertook various tests on residual conventional service specifications in order to optimise the conventional service offering where the conventional services are impacted by Phase Two of HS2. This work is summarised below. Links into East Midlands High Speed Station at Toton In order to provide connectivity by conventional rail, Toton station will include a new conventional rail station with appropriate walk links to and from the high-speed station. Conventional rail services in the local area will then be provided to link the station with Derby, Nottingham, Loughborough and Leicester The analysis of the PFM indicated that it would be best to provide Derby/Nottingham with 2tph to Toton. We would provide this by: 106
114 11 HS2 and Released Capacity Service Specification 1 train per hour Liverpool-Sheffield-Nottingham-Norwich and return, including projecting any short workings from Nottingham onto Toton; and, 1 train per hour Nottingham-Derby-Matlock and return. These services would be in addition to the 1tph Derby-St Pancras and 1tph North East- South West XC service already defined to call at Toton These services would be in addition to the 1tph Derby-St Pancras and 1tph North East-South West XC service already defined to call at Toton. Replacing lost capacity between Nottingham and Leicester By rationalising MML services through the East Midlands there is a loss of one fast train per hour between Nottingham and Leicester. We have reinstated this fast link by extending Skegness/Boston to Nottingham services onwards to Leicester. These services call at East Midlands Parkway and Loughborough to maintain the faster journey time currently provided by the fast MML services between Nottingham, Leicester and St Pancras. Released capacity into Manchester The changes in the residual coding result in the freeing up of one train path per hour from both Crewe and Stoke-on-Trent to Manchester Piccadilly. We undertook various tests to investigate how to use these released train paths in South Manchester. The results of these tests suggested that the following should be included in the residual conventional line coding: 1tph semi-fast Crewe Manchester, calling at Sandbach, Wilmslow and Stockport; 1tph semi-fast Stoke-on-Trent Manchester, calling at Macclesfield, Poynton, Bramhall, Cheadle Hulme and Stockport; and Peak Chester-Stockport services extended through to Manchester Piccadilly. Released capacity into Leeds Following the introduction of HS2 and rationalisation of long-distance services on the ECML the Leeds-Doncaster service is reduced from three fast trains to one fast train per hour calling at Wakefield Westgate The results of tests to investigate how to use the released capacity suggest that providing an additional two semi-fast trains per hour would be the preferred option; this would maintain three fast or semi-fast trains between Leeds and Doncaster throughout the day. ECML north of Newcastle By rationalising EC and XC services on the ECML north of Newcastle, the conventional service falls from two trains per hour to one train per hour. However, there is strong demand from West Yorkshire to the North East and Scotland, which are disadvantaged with the restructuring of XC services following the introduction of HS2. We therefore undertook a number of tests looking at options for serving the Northern England to Scotland market. 107
115 11 HS2 and Released Capacity Service Specification The economic assessments of these options suggested that the best option north of Newcastle was to extend the TransPennine Manchester Airport Newcastle service to Edinburgh calling at Morpeth, Alnmouth, Berwick upon Tweed and Dunbar, with the East Coast London Edinburgh service calling at Alnmouth and Berwick-upon-Tweed. WCML north of Preston There is a restriction on the number of train paths available north of Preston. With the introduction of HS2 there is extensive use of this section of track from high speed services from both London and Birmingham to Scotland. As such, there needs to be a reduction in the conventional line services to Scotland. In addition, analysis of a conventional service to Scotland from Euston showed that it would be very lightly loaded Therefore, we investigated a number of alternative options for the conventional services on this line section. Withdrawing the London-Glasgow services and extending WC Manchester services north to Scotland provides the best option. This gives an alternate hour conventional service to Lancaster, Oxenholme and Penrith with both services calling at Preston and Carlisle. It also provides a cross-manchester service providing new links from Stoke-on-Trent and South Manchester north to Lancashire, Cumbria and Scotland. Best use of the Birmingham-Preston services In the without HS2 scenario, the Birmingham to Glasgow and Edinburgh services are modelled as being formed of nine-car Pendolino trains. With the introduction of HS2 services between Birmingham and Scotland, much of the long-distance traffic transfers onto the HS2 service, therefore we have cut back the service to operate as Birmingham to Preston initially operated by a Pendolino. Further analysis suggested that the trains would be lightly loaded throughout the day Several options were considered when looking at optimising this service. The best performing option was to operate the service with additional calls at Stafford, Winsford and Hartford. This provides additional capacity from Stafford into Birmingham; Winsford and Hartford benefit from an increased train frequency to Crewe and Birmingham and also from new rail links to Warrington, Wigan and Preston to the north. Refinements south of Birmingham Several refinements on the conventional network south of Birmingham were assessed. These looked at the stopping patterns of the proposed new semi-fast services from Peterborough to King s Cross and from Bedford to St Pancras. Consideration of demand data from the various stations helped to identify the main markets between Peterborough and London and Bedford and London and this resulted in the following recommended stopping patterns for these services: Peterborough, Huntingdon, Hitchin, Stevenage, Potter s Bar, Finsbury Park and London King s Cross; and Bedford, Luton, Harpenden, St Alban s City, Mill Hill Broadway and London St Pancras. 108
116 11 HS2 and Released Capacity Service Specification 11.5 Final released capacity specifications The optimisation process has recommended a number of changes are made to the initial released capacity specifications. The final specification is in Appendix A. Figures 11.1 to 11.3 show the changes in service as a result of the released capacity. 109
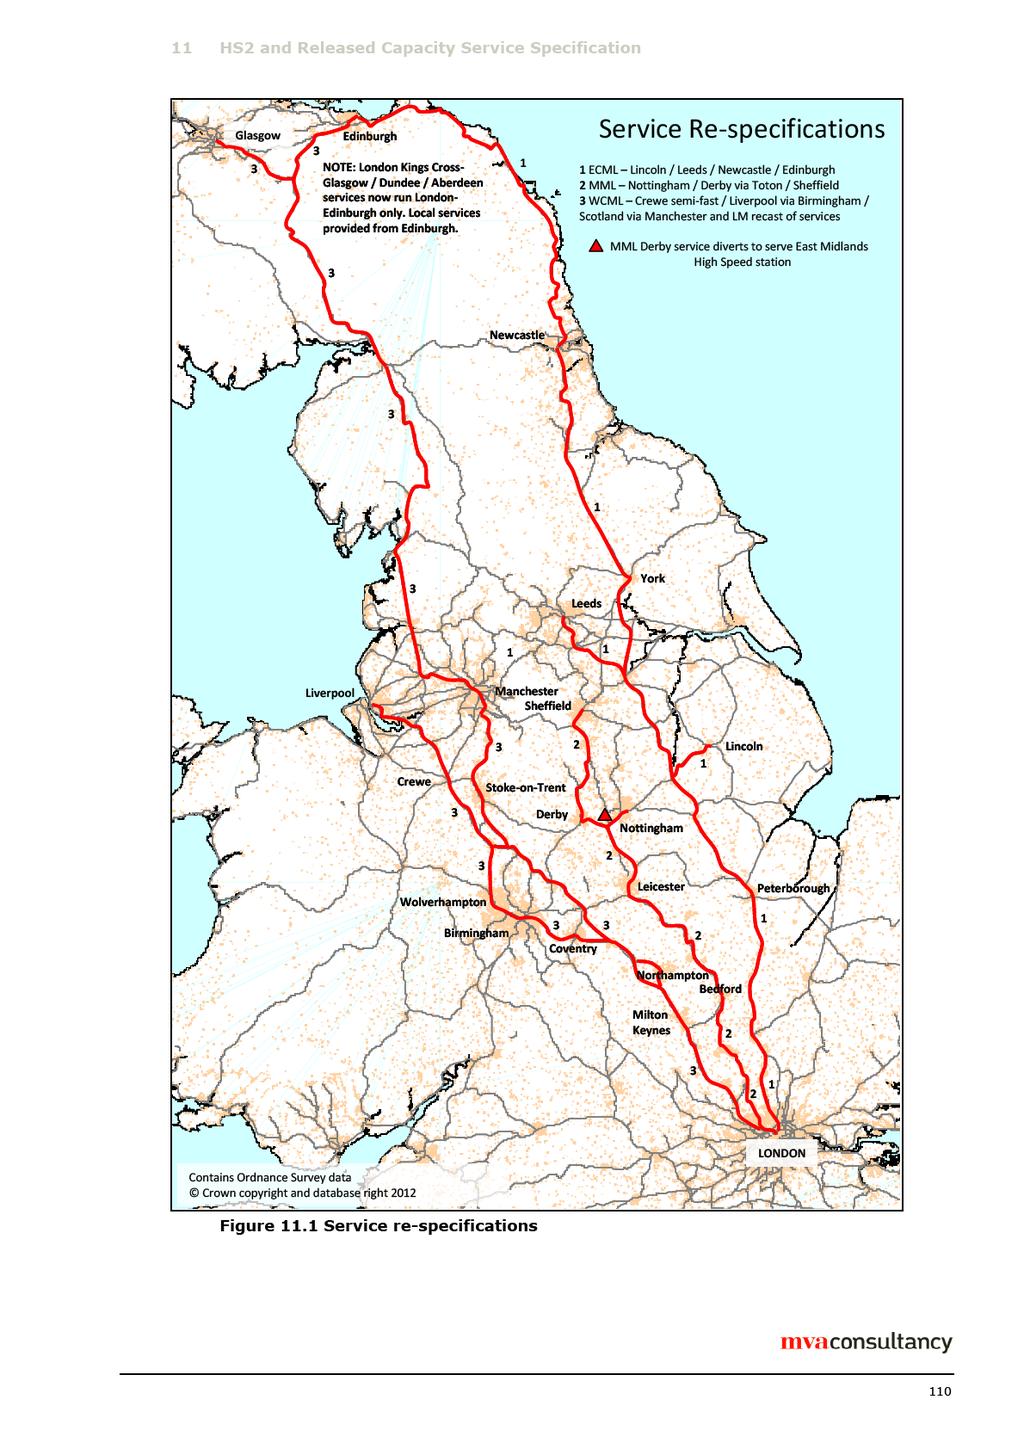
117
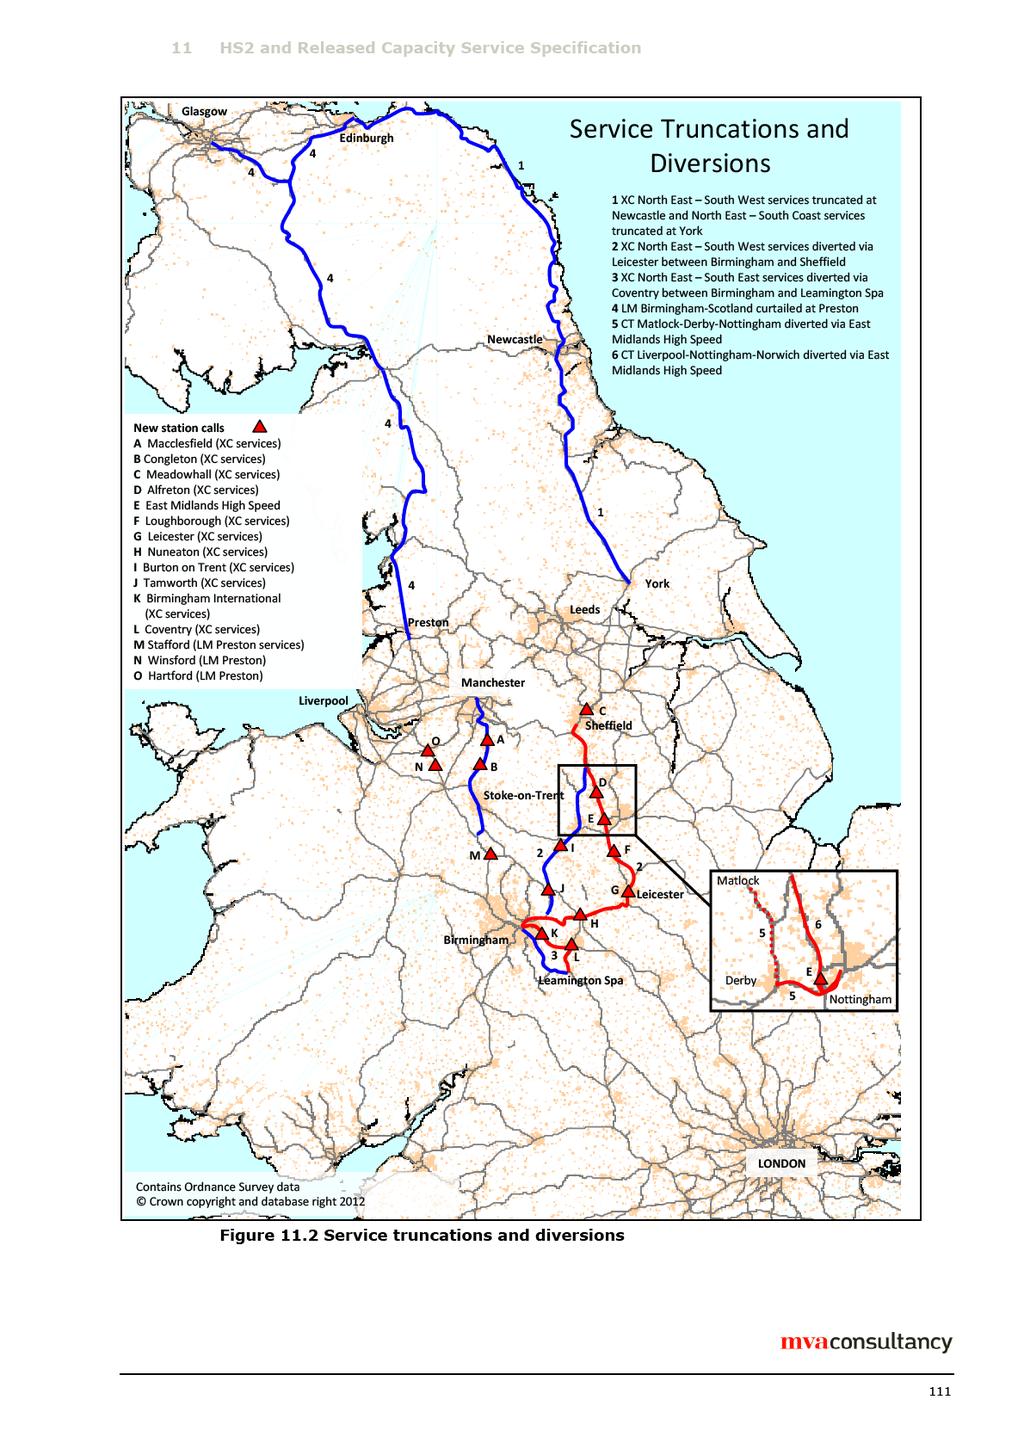
118
Demand and Appraisal Report
 Demand and Appraisal Report HS2 London - West Midlands Report for HS2 Ltd MVA Consultancy, In Association With Mott MacDonald and Atkins April 2012 Document Control Project Title: MVA Project Number: Document
Doncaster Chamber of Commerce. Andy Taylor Head of Public Affairs, HS2 Ltd
 Doncaster Chamber of Commerce Andy Taylor Head of Public Affairs, HS2 Ltd HS2 one railway, two phases 330 miles of new track 9 HS2 stations High speed trains running on HS2 and existing lines Up to 18
East Lancashire Highways and Transport Masterplan East Lancashire Rail Connectivity Study Conditional Output Statement (Appendix 'A' refers)
") Report to the Cabinet Member for Highways and Transport Report submitted by: Director of Corporate Commissioning Date: 1 June 2015 Part I Electoral Divisions affected: All East Lancashire Highways and
Report to the Cabinet Member for Highways and Transport Report submitted by: Director of Corporate Commissioning Date: 1 June 2015 Part I Electoral Divisions affected: All East Lancashire Highways and
Chapter 8. Capacity and Service Disbenefits. Prepared by Christopher Stokes
 Chapter 8 Capacity and Service Disbenefits Prepared by Christopher Stokes 8 CAPACITY AND SERVICE DISBENEFITS Prepared by Christopher Stokes 8.1 This chapter relates to the following questions listed by
Appendix 8. Capacity and Service Disbenefits. Prepared by Christopher Stokes
 Appendix 8 Capacity and Service Disbenefits Prepared by Christopher Stokes 8 CAPACITY AND SERVICE DISBENEFITS Prepared by Christopher Stokes Introduction 8.1 This appendix considers the following major
Christmas Engineering Works
 THE GREAT NORTH RAIL PROJECT COLLEAGUE UPDATE Christmas Engineering Works 2018 until 2019 Thursday 27 December Tuesday 01 January This past year has seen significant progress in Network Rail s Great North
THE STOPS ARE JUST THE START
 HS2 AND NORTHERN POWERHOUSE RAIL GROWTH STRATEGY THE STOPS ARE JUST THE START 1 2 This is an exciting time to be living, working, studying and investing in Greater Manchester. The region has always been
Agenda Item 5: Rail East Midlands Rail Franchise Consultation
 Strategic Transport Forum 15 th September 2017 Agenda Item 5: Rail East Midlands Rail Franchise Consultation Recommendation: It is recommended that the Forum agree (subject to any amendments agreed by
Jim Steer. Director Greengauge 21. HS2 and the North. Transport Times Conference. October October 2016 Transport Times, London 1
 Jim Steer Director Greengauge 21 HS2 and the North Transport Times Conference October 2016 October 2016 Transport Times, London 1 overview Bringing together HS2 and the northern powerhouse Getting beyond
CONNECTIVITY IMPROVEMENTS ACHIEVED BY HS2 AND HIGH SPEED UK FOR: (extract from HS2 High Speed to Nowhere)
") APPNDIX L2 CONNCTIVITY IMPROVMNTS ACHIVD BY HS2 AND HIGH SPD UK FOR: LICSTR (extract from HS2 High Speed to Nowhere) Appendix L2 : Leicester Page 262 Introduction & key results Page 263 Timeline of comparative
APPNDIX L2 CONNCTIVITY IMPROVMNTS ACHIVD BY HS2 AND HIGH SPD UK FOR: LICSTR (extract from HS2 High Speed to Nowhere) Appendix L2 : Leicester Page 262 Introduction & key results Page 263 Timeline of comparative
1.1 We note that the following WCML access applications have been made:
 David Wearing Track Access Executive Directorate of Railway Markets and Economics Office of Rail Regulation One Kemble Street London WC2B 4AN 5th Floor, Wellington House 39/41 Piccadilly, Manchester, M1
Re-opening of the Skipton to Colne Railway Executive Summary
 Re-opening of the to Colne Railway Executive Summary SELRAP SELRAP is the East Lancashire Rail Action Partnership. It was established with the objective of campaigning for the reinstatement of the railway
CONNECTIVITY IMPROVEMENTS ACHIEVED BY HS2 AND HIGH SPEED UK FOR: (extract from HS2 High Speed to Nowhere)
") APPNIX H2 CONNCTIVITY IMPROVMNTS ACHIV BY HS2 AN HIGH SP UK FOR: HURSFIL (extract from HS2 High Speed to Nowhere) Appendix H2 : Page 244 Introduction & key results Page 245 Timeline of comparative journey
APPNIX H2 CONNCTIVITY IMPROVMNTS ACHIV BY HS2 AN HIGH SP UK FOR: HURSFIL (extract from HS2 High Speed to Nowhere) Appendix H2 : Page 244 Introduction & key results Page 245 Timeline of comparative journey
Submission to the Airports Commission
 Submission to the Airports Commission Greengauge 21 February 2013 www.greengauge21.net 1 1. Introduction Greengauge 21 is a not for profit company established to promote the debate and interest in highspeed
CONNECTIVITY IMPROVEMENTS ACHIEVED BY HS2 AND HIGH SPEED UK FOR: MANCHESTER AIRPORT. (extract from HS2 High Speed to Nowhere)
") APPNDIX M2 CONNCIVIY IMPOVMNS ACHIVD BY HS2 AND HIGH SPD UK FO: MANCHS AIPO (extract from HS2 High Speed to Nowhere) Appendix M2 : Airport Page 292 Introduction & key results Page 293 imeline of comparative
APPNDIX M2 CONNCIVIY IMPOVMNS ACHIVD BY HS2 AND HIGH SPD UK FO: MANCHS AIPO (extract from HS2 High Speed to Nowhere) Appendix M2 : Airport Page 292 Introduction & key results Page 293 imeline of comparative
The Hybrid Bill and the journey to Royal Assent. Andy Taylor Head of Public Affairs, HS2 Ltd
 The Hybrid Bill and the journey to Royal Assent Andy Taylor Head of Public Affairs, HS2 Ltd HS2 one railway, two phases 330 miles of new track 9 HS2 stations High speed trains running on HS2 and existing
33 Horseferry Road HP20 1UA London SW1P 4DR. Tuesday 10 th October Dear Sir,
 East Midlands Rail Franchise Programme Office Consultation Co-ordinator c/o Buckinghamshire County Council Zone 2/21 County Hall Department for Transport Walton Street Great Minster House Aylesbury 33
An Introduction to HS2
 July 16 1 Overview HS2 is a vital part of the Government s long term economic plan, strongly supported by midland, northern English and Scottish cities. HS2 will not be a separate, standalone railway.
CONNECTIVITY IMPROVEMENTS ACHIEVED BY HS2 AND HIGH SPEED UK FOR: and Merseyside conurbation. (extract from HS2 High Speed to Nowhere)
") APPENDIX 3 CNNECTIVITY IMPRVEMENTS ACHIEVED BY HS2 AND HIGH SPEED UK FR: IVERP and Merseyside conurbation (extract from HS2 High Speed to Nowhere) Appendix 3 : iverpool Page 268 Introduction & key results
APPENDIX 3 CNNECTIVITY IMPRVEMENTS ACHIEVED BY HS2 AND HIGH SPEED UK FR: IVERP and Merseyside conurbation (extract from HS2 High Speed to Nowhere) Appendix 3 : iverpool Page 268 Introduction & key results
West Coast Main Line Track Access Applications Consultation:
 David Wearing, Track Access Executive, Directorate of Railway Markets and Economics, Office of Rail Regulation, One Kemble Street, London WC2B 4AN 17 December 2010 Dear Mr. Wearing, West Coast Main Line
East West Rail Consortium
 East West Rail Consortium EWR Wider Economic Case: Refresh 18 th November 2015 Rupert Dyer Rail Expertise Ltd Rail Expertise Ltd. Tel: 01543 493533 Email: info@railexpertise.co.uk 1 Introduction 1.1 The
BARNSLEY METROPOLITAN BOROUGH COUNCIL
 BARNSLEY METROPOLITAN BOROUGH COUNCIL This matter is a Key Decision within the Council s definition and has been included in the relevant Forward Plan REPORT OF THE EXECUTIVE DIRECTOR OF PLACE TO CABINET
Meeting the capacity challenge: The case for new lines
 Meeting the capacity challenge: The case for new lines NewLineStudy_v7.indd 1 21/08/2009 15:02:42 Meeting the capacity challenge Our railways are getting full. At some point, in the not too distant future,
Appendix 12. HS2/HS1 Connection. Prepared by Christopher Stokes
 Appendix 12 HS2/HS1 Connection Prepared by Christopher Stokes 12 HS2/HS1 CONNECTION Prepared by Christopher Stokes Introduction 12.1 This appendix examines the business case for through services to HS1,
Connecting HS2 to Scotland: the North of England Criteria
 Connecting HS to Scotland: the North of England Criteria Introduction The planning for the first two phases of High Speed is well underway. And, in October 1, the Secretary of State for Transport announced
Chapter 12. HS2/HS1 Connection. Prepared by Christopher Stokes
 Chapter 12 HS2/HS1 Connection Prepared by Christopher Stokes 12 HS2/HS1 CONNECTION Prepared by Christopher Stokes 12.1 This chapter relates to the following questions listed by the Committee: 3.1 Business
Leeds and Sheffield City Region Partners High Speed Rail to the Leeds and Sheffield City Regions Technical Report- Options Assessment and Wider
 Leeds and Sheffield City Region Partners High Speed Rail to the Leeds and Sheffield City Regions Technical Report- Options Assessment and Wider Economic Benefits Black Leeds and Sheffield City Region Partners
TfL Planning. 1. Question 1
 TfL Planning TfL response to questions from Zac Goldsmith MP, Chair of the All Party Parliamentary Group on Heathrow and the Wider Economy Heathrow airport expansion proposal - surface access February
Appendix 9. Impacts on Great Western Main Line. Prepared by Christopher Stokes
 Appendix 9 Impacts on Great Western Main Line Prepared by Christopher Stokes 9 IMPACTS ON GREAT WESTERN MAIN LINE Prepared by Christopher Stokes Introduction 9.1 This appendix evaluates the impact of
EAST WEST RAIL EASTERN SECTION. prospectus for growth
 EAST WEST RAIL EASTERN SECTION prospectus for growth September 2018 executive summary The East West Rail Consortium, a partnership of local authorities, rail operators and Network Rail, continues to promote
Open Report on behalf of Executive Director for Environment & Economy. Highways and Transport Scrutiny Committee
 Agenda Item 9 Policy and Scrutiny Open Report on behalf of Executive Director for Environment & Economy Report to: Date: 13 June 2016 Subject: Summary: Highways and Transport Scrutiny Committee Rail Update
Department for Transport (DfT) Response to the Recommendations of Passenger Focus for the New Cross Country Rail Franchise.
 Response to the Recommendations of Passenger Focus for the New Cross Country Rail Franchise.") Department for Transport (DfT) Response to the Recommendations of Passenger Focus for the New Cross Country Rail Franchise. Introduction We welcome your input to the New Cross Country (NCC) consultation
Department for Transport (DfT) Response to the Recommendations of Passenger Focus for the New Cross Country Rail Franchise. Introduction We welcome your input to the New Cross Country (NCC) consultation
HIGH SPEED RAIL: INVESTING IN BRITAIN S FUTURE
 HIGH SPEED RAIL: INVESTING IN BRITAIN S FUTURE Consultation on the route from the West Midlands to Manchester, Leeds and beyond Consultation summary July 2013 HIGH SPEED RAIL: INVESTING IN BRITAIN S FUTURE
The Rail Network in Wales
 The Rail Network in Wales The Case for Investment Summary Professor Mark Barry 12 July 2018 Mark Barry M&G Barry Consulting Ltd www.mgbarryconsulting.com Mae r ddogfen yma hefyd ar gael yn Gymraeg. This
Easter Improvement Works. London Euston Closed Friday 19 until Monday 22 April virgintrains.com/spanner nationalrail.co.
 Easter Improvement Works London Euston Closed Friday 19 until Monday 22 April 2019 virgintrains.com/spanner nationalrail.co.uk/westcoast @virgintrains virgintrains What's happening? We recommend that
Chapter 11. Links to Heathrow. Prepared by Christopher Stokes
 Chapter 11 Links to Heathrow Prepared by Christopher Stokes 11 LINKS TO HEATHROW Prepared by Christopher Stokes 11.1 This submission relates to the following questions listed by the Committee: 2.3 Implications
Inclusive Growth indicators: Core city and GM Local Authority comparisons
 Inclusive Growth indicators: Core city and GM Local Authority comparisons Dr. Anthony Rafferty (Senior Researcher IGAU, Senior Lecturer Alliance Manchester Business School) Prof. Ruth Lupton (Director,
Sheffield City Region, Leeds City Region High Speed Rail to Yorkshire Technical Report
 Sheffield City Region, Leeds City Region FINAL REPORT September 2010 Ove Arup & Partners Ltd Admiral House Rose Wharf 78 East Street Leeds LS9 8EE United Kingdom www.arup.com This report takes into account
ALL CHANGE NEW TRAIN TIMES FROM SUNDAY 20 MAY
 ALL CHANGE NEW TRAIN TIMES FROM SUNDAY 20 MAY From Sunday 20 May 2018 customers across the North of England and into Scotland are set to benefit from improved connectivity, new journey opportunities and
TRANSFORMING TRANSPENNINE
 TRANSFORMING TRANSPENNINE MAY 2018 TIMETABLE We are now at a key milestone for our franchise, with the timetable change that comes into effect on Sunday 20 May 2018 the biggest and most important since
Midlands Connect Objectives for Improved Transport Connectivity
 Objectives for Improved Transport Connectivity Midlands Connect Partnership December 2015 Notice This document and its contents have been prepared and are intended solely for the Midlands Connect Partnership
The future of the TransPennine Express and Northern rail franchises
 The future of the TransPennine Express and Northern rail franchises 1. Name: Friends of Eccles Station (FRECCLES) 2. Are you responding as an individual or on behalf of an organisation? Organisation 3.
2nd March, 2017 Corporate Report Format. Conisbrough Mexborough Sprotbrough
 2nd March, 2017 Corporate Report Format To the Chair and Members of the Full Council HIGH SPEED TWO PHASE 2B PROPERTY AND ROUTE REFINEMENT CONSULTATIONS Relevant Cabinet Member(s) Mayor Ros Jones Cllr
Delivering the High Speed Network the Nation Needs
 High Speed UK Connecting the Nation Delivering the High Speed Network the Nation Needs www.highspeeduk.co.uk High Speed UK (HSUK) is an alternative high speed rail network developed by professional railway
FAO: Sir Howard Davies, Chair, Airports Commission 21 Apr 2013
 FAO: Sir Howard Davies, Chair, Airports Commission 21 Apr 2013 The Midland Express Rail Link (MERLIN) a solution for integrating a new hub airport at Luton with Britain s developing High Speed Rail Network
REAUTHORISATION OF THE ALLIANCE BETWEEN AIR NEW ZEALAND AND CATHAY PACIFIC
 Chair Cabinet Economic Growth and Infrastructure Committee Office of the Minister of Transport REAUTHORISATION OF THE ALLIANCE BETWEEN AIR NEW ZEALAND AND CATHAY PACIFIC Proposal 1. I propose that the
Bridging the Northern Gap:
 Bridging the Northern Gap: Can construction pave the way? A report examining current trends in the northern construction market, how it compares to the UK and the South East, and its prospects for the
City employment: An overview from the Business Register & Employment Survey (BRES)
") employment September 2012 employment: An overview from the Business Register & Employment Survey (BRES) Rachel Smith, September 2012 On 28 September, the latest employment estimates for 2011, taken from
employment September 2012 employment: An overview from the Business Register & Employment Survey (BRES) Rachel Smith, September 2012 On 28 September, the latest employment estimates for 2011, taken from
Roundhouse Offices at South Rings
 Welcome to your new office Roundhouse Offices at South Rings South Rings Office Village, Bamber Bridge, Preston Commencing soon Phase 1 available March 2011 Adjacent to Sainsbury s / B&Q and J29 M6 / J9
FirstGroup plc TransPennine Express
 FirstGroup plc TransPennine Express Rail franchise award Wednesday 9 December 2015 TransPennine Express awarded to FirstGroup FirstGroup is delighted to be selected by the Department for Transport (DfT)
Northern Powerhouse Rail
 Northern Powerhouse Rail Our vision is of a thriving North of England where modern transport connections drive economic growth and support an excellent quality of life. About Northern Powerhouse Rail This
July 2016 Briefing pack: David Higgins South Yorkshire Report
 July 2016 Briefing pack: David Higgins South Yorkshire Report Overview On 7 July 2016, David Higgins, Chairman of HS2 Ltd, published a report making recommendations to Government on the station location
5 Rail demand in Western Sydney
 5 Rail demand in Western Sydney About this chapter To better understand where new or enhanced rail services are needed, this chapter presents an overview of the existing and future demand on the rail network
The Government s Aviation Strategy Transport for the North (TfN) response
 response") The Government s Aviation Strategy Transport for the North (TfN) response Transport for the North Background Good transport links are a crucial part of a strong economy supporting labour markets and delivering
The Government s Aviation Strategy Transport for the North (TfN) response Transport for the North Background Good transport links are a crucial part of a strong economy supporting labour markets and delivering
Written evidence from the Federation of Small Businesses (HSR 181)
") Written evidence from the Federation of Small Businesses (HSR 181) The Federation of Small Businesses (FSB) has taken a neutral approach nationally to the development of high speed rail. Small businesses
Written evidence from the Federation of Small Businesses (HSR 181) The Federation of Small Businesses (FSB) has taken a neutral approach nationally to the development of high speed rail. Small businesses
National Rail Passenger Survey: User Guidance Report. Autumn 2013 (wave 29)
") National Rail Passenger Survey: User Guidance Report Autumn 2013 (wave 29) Rebecca Joyner Research Director Tel: 020 7490 9148 rebecca.joyner@bdrc continental.com Contents Page No. 1. Background... 1 2.
National Rail Passenger Survey: User Guidance Report Autumn 2013 (wave 29) Rebecca Joyner Research Director Tel: 020 7490 9148 rebecca.joyner@bdrc continental.com Contents Page No. 1. Background... 1 2.
National Rail Passenger Survey: User Guidance Report
 National Rail Passenger Survey: User Guidance Report Autumn 2015 (Wave 33) Rebecca Joyner Director Tel: 020 7490 9148 rebecca.joyner@bdrc-continental.com Contents Page No. 1. Background... 1 2. Summary
LOGISTICS 175 TO LET M61/J4 BOLTON BL5 1BT. New build
 1/J4 BOLTON BL5 1BT 175 New build TO LET New 174,940 sq ft industrial/distribution unit Adjacent to junction 4, 1 Ready for immediate occupation LET TO Transforming Regenerating Revitalising wwwlogisticsnorthcom
NORTH GOWER STREET, LONDON NW1 A CENTRAL LONDON UNBROKEN RESIDENTIAL INVESTMENT OPPORTUNITY
 01 203-207 NORTH GOWER STREET, LONDON NW1 A CENTRAL LONDON UNBROKEN RESIDENTIAL INVESTMENT OPPORTUNITY 02 INVESTMENT SUMMARY Unbroken freehold block of 12 residential units in a Prime Central London location
Retail The UK retail hierarchy: Beyond the shopping centre pipeline
 Retail The UK retail hierarchy: Beyond the shopping centre pipeline Received (in revised form): 2 October 2006 Andrew Go odwin is a partner at Donaldsons; independent property consultants in the UK and
August Briefing. Why airport expansion is bad for regional economies
 August 2005 Briefing Why airport expansion is bad for regional economies 1 Summary The UK runs a massive economic deficit from air travel. Foreign visitors arriving by air spent nearly 11 billion in the
Tram Passenger Survey
 Key findings Autumn 2015 Foreword Jeff Halliwell Now in its third year, our Tram Passenger Survey has covered passengers views of their journey in six network areas in Britain. For the second time this
High Speed Two: From Crewe to Manchester, the West Midlands to Leeds and beyond
 High Speed Two: From Crewe to Manchester, the West Midlands to Leeds and beyond Moving Britain Ahead Cm9355 November 2016 High Speed Two: From Crewe to Manchester, the West Midlands to Leeds and
Census 2011: City snapshot
 Census Snapshot September 2012 Census 2011: snapshot Rachel Smith, September 2012 On 16 July 2012 the first outputs from the Census 2011 for England and Wales were released, followed on 19 September 2012
CABINET 1 MARCH 2016 DEVELOPMENT OF A RAIL STRATEGY FOR LEICESTER AND LEICESTERSHIRE REPORT OF THE DIRECTOR OF ENVIRONMENT AND TRANSPORT PART A
 21 Agenda Item 5 CABINET 1 MARCH 2016 DEVELOPMENT OF A RAIL STRATEGY FOR LEICESTER AND LEICESTERSHIRE REPORT OF THE DIRECTOR OF ENVIRONMENT AND TRANSPORT Purpose of the Report PART A 1. To present the
Emerging Strategy. Executive Summary November Midlands Connect Powering the Midlands Engine
 Emerging Strategy Executive Summary November 2016 Midlands Connect Powering the Midlands Engine Foreword Sir John Peace Chairman of Midlands Engine and Midlands Connect As we get closer to the finalisation
National Rail Passenger Survey: User Guidance Report
 National Rail Passenger Survey: User Guidance Report Spring 2015 (Wave 32) Rebecca Joyner Director Tel: 020 7490 9148 rebecca.joyner@bdrc continental.com Contents Page No. 1. Background... 1 2. Summary
Report of the Strategic Director (Place) to the meeting of Environment and Waste Management Overview & Scrutiny Committee to be held on 28 March 2017.
 to the meeting of Environment and Waste Management Overview & Scrutiny Committee to be held on 28 March 2017.") Report of the Strategic Director (Place) to the meeting of Environment and Waste Management Overview & Scrutiny Committee to be held on 28 March 2017. Subject: AE Bradford District Rail Update. Summary
Report of the Strategic Director (Place) to the meeting of Environment and Waste Management Overview & Scrutiny Committee to be held on 28 March 2017. Subject: AE Bradford District Rail Update. Summary
CAA Passenger Survey Report 2017
 Business Intelligence (CAA Strategy & Policy Department) CAA Passenger Survey Report 2017 A survey of passengers at Birmingham, East Midlands, Gatwick, Heathrow, Leeds Bradford, Liverpool, London City,
The New Northern Franchise
 The New Northern Franchise The? Shape of things to come This document is produced by Noel Henry for the Friends of Reddish South and Denton stations campaign group (FORSADS), to highlight the benefits
THIRTEENTH AIR NAVIGATION CONFERENCE
 International Civil Aviation Organization AN-Conf/13-WP/22 14/6/18 WORKING PAPER THIRTEENTH AIR NAVIGATION CONFERENCE Agenda Item 1: Air navigation global strategy 1.4: Air navigation business cases Montréal,
National Rail Passenger Survey: User Guidance Report. Spring 2014 (wave 30)
") National Rail Passenger Survey: User Guidance Report Spring 2014 (wave 30) Rebecca Joyner Director Tel: 020 7490 9148 rebecca.joyner@bdrc continental.com Contents Page No. 1. Background... 1 2. Summary
National Rail Passenger Survey: User Guidance Report Spring 2014 (wave 30) Rebecca Joyner Director Tel: 020 7490 9148 rebecca.joyner@bdrc continental.com Contents Page No. 1. Background... 1 2. Summary
STJOHNSHOUSE DESCRIPTION DESCRIPTION SPECIFICATION LOCATION SITUATION CURRENT AVAILABILITY FLOORPLANS TERMS/CONTACT
 BARRINGTON ROAD ALTRINCHAM SOUTH MANCHESTER WA1 1HB GRADE A AIR CONDITIONED 1ST FLOOR OFFICE SUITE, SQ FT WITH EXTENSIVE SECURE CAR PARKING SPACES IN THE HEART OF ALTRINCHAM TOWN CENTRE ENTER > St Johns
Buses. Saturday 29 December Normal Saturday service.
 Buses Please remember to plan ahead and check with your bus operator before you travel on any of the dates listed below. Buses will run a normal or modified weekday service, or Saturday service with additional
Rail Delivery Group. Consultation on the future of the East Midlands rail franchise
 Rail Delivery Group Response to: Department for Transport Consultation on the future of the East Midlands rail franchise Date: 11 October 2017 Rail Delivery Group Limited Registered Office, 2nd Floor,
BACKGROUND TO THE EAST COAST MAIN LINE AND INTERCITY EAST COAST FRANCHISE
 BACKGROUND TO THE EAST COAST MAIN LINE AND INTERCITY EAST COAST FRANCHISE 1 The East Coast Main Line 1.1 The East Coast Main Line (ECML) is one of two high-capacity north-south trunk routes that run between
High Speed UK. Regional Mapping covering the East and West Midlands
 High Speed UK Regional Mapping covering the East and West Midlands CC0 Potteries CC0 Trent Valley CC0 East Midlands CC0 West Midlands CC0 Rugby & Leicester Maps in reverse numerical order for enhanced
LOGISTICS 175 TO LET M61/J4 BOLTON BL5 1BT. New build
 1/J4 BOLTON BL5 1BT 175 New build TO LET New 175,212 sq ft industrial/distribution unit Adjacent to junction 4, 1 Ready for immediate occupation Transforming Regenerating Revitalising wwwlogisticsnorthcom
WHAT ARE THE LIKELY ECONOMIC AND SOCIETAL IMPACTS OF HS2?
 WHY WOULD HS2 BE GOOD FOR BRITAIN? Meeting of the Parliamentary and Scientific Committee on Tuesday 24th April WHAT ARE THE LIKELY ECONOMIC AND SOCIETAL IMPACTS OF HS2? Without a transport system an economy
Kilometres. Blacktown. Penrith. Parramatta. Liverpool Bankstown. Campbelltown
 0 5 10 15 20 Kilometres Penrith Blacktown Parramatta Liverpool Bankstown Campbelltown accessibility outcomes Legend Outcomes targeted in Western Sydney are: public transport that is accessible throughout
CAA Passenger Survey Report 2005
 Economic Regulation Group CAA Passenger Survey Report 2005 Survey of passengers at Aberdeen, Bournemouth, Durham Tees Valley, Edinburgh, Gatwick, Glasgow, Heathrow, Inverness, Leeds Bradford, Luton, Manchester,
Manufacturing/distribution opportunities 20, ,000 sq ft
 /J4 GREATER MANCHESTER BOLTON BL5 1BT Manufacturing/distribution opportunities 20,000-375,000 sq ft Speculative build Plots available Adjacent to junction 4 on 1.8 million sq ft completed or under construction
In your area. Stonebroom to Clay Cross LA09. June Introduction
 June 2018 www.hs2.org.uk In your area to Clay Cross LA09 Midland Main Line Shirland Tupton Clay Cross A61 Stretton Midland Main Line to Chesterfield and Sheffield Pilsley A6175 HS2 Phase 2b spur Morton
North West smart motorways 100 miles of extra lanes
 North West smart motorways 100 miles of extra lanes September 2018 North West smart motorways 100 miles of extra lanes At Highways England we believe in a connected country and our network makes these
SRA FUTURE FARES POLICY
 SRA FUTURE FARES POLICY This response has been prepared by PTEG on behalf of the 7 Passenger Transport Authorities and Executives in England and Scotland. We welcome the publication of the consultation
IATA ECONOMIC BRIEFING FEBRUARY 2007
 IATA ECONOMIC BRIEFING FEBRUARY 27 NEW AIRCRAFT ORDERS KEY POINTS New aircraft orders remained very high in 26. The total of 1,834 new orders for Boeing and Airbus commercial planes was down slightly from
Investing in Greater Manchester transport 2017/2018
 TRAFFIC Investing in Greater Manchester transport 2017/2018 INFORMATION www.greatermanchester-ca.gov.uk Transport is an important part of life for residents and businesses in Greater Manchester. It connects
Jernbaneverket Norwegian High Speed Railway Assessment Project
 Jernbaneverket Norwegian High Speed Railway Assessment Project Contract 5: Market Analysis Subject 1: Demand Forecasting Final Report 04/03/2011 (With additional information) /Market Analysis Demand Forecasting
Measure 67: Intermodality for people First page:
 Measure 67: Intermodality for people First page: Policy package: 5: Intermodal package Measure 69: Intermodality for people: the principle of subsidiarity notwithstanding, priority should be given in the
Saighton Camp, Chester. Technical Note: Impact of Boughton Heath S278 Works upon the operation of the Local Highway Network
 Technical Note: Impact of Boughton Heath S278 Works July 2013 SAIGHTON CAMP CHESTER COMMERCIAL ESTATES GROUP TECHNICAL NOTE: IMPACT OF BOUGHTON HEATH S278 WORKS UPON THE OPERATION OF THE LOCAL HIGHWAY
High Speed Rail London to the West Midlands and Beyond Supplementary Report. A report to Government by High Speed Two Limited
 High Speed Rail London to the West Midlands and Beyond Supplementary Report A report to Government by High Speed Two Limited September 2010 1 2 Contents Page Executive Summary Introduction 9 Chapter 1
Manufacturing/distribution opportunities 20, ,000 sq ft
 1/J4 GREATER MANCHESTER BOLTON BL5 1BT Manufacturing/distribution opportunities 20,000 375,000 sq ft Design and build Speculative build Plots available Immediately adjacent to junction 4 on 1 0 and within
20,676 SQ FT FULLY REFURBISHED HQ OFFICE BUILDING WITH AIR CONDITIONING & 100 ONSITE CAR PARKING SPACES
 20,676 SQ FT FULLY REFURBISHED HQ OFFICE BUILDING WITH AIR CONDITIONING & 100 ONSITE CAR PARKING SPACES SUMMARY ACCOMMODATION Atlantic House is a 3-storey HQ office building which is available as a whole
M6 CORRIDOR. Strategic Infrastructure Prospectus
 CORRIDOR Strategic Infrastructure Prospectus May 2017 IntRODuCtIOn cumbria has real potential. We have a strong economy with major capability in energy, advanced manufacturing, logistics, agri-food and
Consented 4 million sq ft scheme over 250 acres Manufacturing/distribution opportunities
 1/J4 BOLTON BL5 1BT Consented 4 million sq ft scheme over 250 acres Manufacturing/distribution opportunities Design and build Speculative build Plots available Adjacent to junction 4 on 1 Opportunities
In your area. Pinxton to Newton and Huthwaite LA08. June Introduction
 June 2018 www.hs2.org.uk In your area Pinxton to Newton and Huthwaite LA08 to Chesterfield and Sheffield Westhouses Blackwell Newton M1 South Normanton to Leeds Hilcote 28 Pinxton Huthwaite A38 HS2 Phase
Borders Railway: What is the impact two years on?
 STAR 2018 Borders Railway: What is the impact two years on? Rachel Thomas, Peter Brett Associates, Scott Leitham, Peter Brett Associates, and Rebecca Rossi, Transport Scotland 1 INTRODUCTION The Borders
Prospect ATCOs Branch & ATSS Branch response to CAP Terminal Air Navigation Services (TANS) contestability in the UK: Call for evidence
 contestability in the UK: Call for evidence") Prospect ATCOs Branch & ATSS Branch response to CAP 1605 Terminal Air Navigation Services (TANS) contestability in the UK: Call for evidence Introduction This document sets out the views of Prospect s
Prospect ATCOs Branch & ATSS Branch response to CAP 1605 Terminal Air Navigation Services (TANS) contestability in the UK: Call for evidence Introduction This document sets out the views of Prospect s
AIR TRANSPORT MANAGEMENT Universidade Lusofona January 2008
 AIR TRANSPORT MANAGEMENT Universidade Lusofona Introduction to airline network planning: John Strickland, Director JLS Consulting Contents 1. What kind of airlines? 2. Network Planning Data Generic / traditional
Submission to Infrastructure Victoria s Draft 30-Year Infrastructure Strategy
 Submission to Infrastructure Victoria s Draft 30-Year Infrastructure Strategy 1. Introduction This submission is a response to Infrastructure Victoria s assessment of the need to construct a heavy rail