ABBREVIATIONS ISSN
|
|
|
- Stanley West
- 5 years ago
- Views:
Transcription


1
2 ABBREVIATIONS COP DANE DEA DIRAN DNE DNP GME IGAC ICMP INCB IDB NNPS OAS PDA PCI RSS SIMCI UNODC USAID US$ mt Colombian Pesos National Department of Statistics US Drugs Enforcement Administration Colombian Anti-Narcotics Police National Narcotics Office National Planning Department Mobile Eradication Group Instituto Geografico Agustin Codazzi Illicit Crop Monitoring Programme International Narcotics Control Board Inter-American Development Bank National Natural Parks System Organization of American States Alternative Development Programme Presidential management against Illicit Crops Social Solidarity Net Integrated Illicit Crops Monitoring System United Nations Office on Drugs and Crime. United States Agency for International Development United States Dollars Metric tons Acknowledgements The following organizations and individuals contributed to the implementation of the 2008 coca cultivation survey in Colombia, and to the preparation of the present report: Government of Colombia: Ministry of Interior and Justice National Narcotics Office -DNE Anti-Narcotics Police -DIRAN Ministry of Defence Presidential Agency for Social Action and International Cooperation UNODC: Rodolfo Llinás, SIMCI Project Coordinator Orlando González, Digital Processing Expert Sandra Rodríguez, Digital Processing Expert Zully Sossa, Digital Processing Expert Maria Isabel Velandia, Digital Processing Expert Martha Paredes, Research and Analysis Expert Leonardo Correa, Field Engineer Juan Carlos Parra, Editing Engineer Martha Luz Gutierrez, Administrative Assistant Javier Espejo, Assistant Engineer Maria Ximena Gualdron, Assistant Engineer Aldo Lale-Demoz, Representative in Colombia Angela Me, Chief Statistics and Surveys Section-ICMP Coen Bussink, Remote Sensing and GIS Expert Statistics and Surveys Section - ICMP Martin Raithelhuber, Programme Officer -Statistics and Surveys Section- ICMP Javier Teran, Statistician, Statistics and Surveys Section ICMP Thomas Pietschmann, Research Officer, Statistics and Surveys Section-ICMP The implementation of UNODC's Illicit Crop Monitoring Programme, Colombia survey 2008 was made possible thanks to financial contributions from the Governments of Austria, Colombia, France and United Kingdom. Unless otherwise specified, all figures presented in this report come from the Government of Colombia in the context of national monitoring system supported by UNODC. Photo credits: UNODC-SIMCI unless otherwise specified. ISSN
3 PREFACE In 2008, there was a major decline in the amount of coca cultivation and cocaine production in Colombia. Cultivation dropped by 18% to 81,000 hectares, while production was down 28%, from 600 metric tons in 2007 to 430 mt in The dramatic year-on-year reductions represent a return to the levels of coca cultivation reported during the 2004 to 2006 period. In terms of potential production, the 2008 results are the lowest in a decade. Much of the decline is due to a remarkable 96,115 hectares of coca which was eradicated manually (an increase of 44%), in addition to 133,496 hectares of coca that was sprayed. The coca economy in Colombia is under threat. The greater reduction in tons compared to hectares shows that eradication successfully targeted regions of high yield. Furthermore, as a result of government pressure, coca fields are becoming more dispersed and smaller and, therefore, harder to tend, resulting in lower yields. The farm-gate value of coca leaf in Colombia is falling, making it less attractive for farmers. Indeed, 20,000 less households grew coca in 2008 compared with 2007 (a decrease of 26%). Trafficking is also being disrupted: in Colombia, 200 tons of cocaine was seized in 2008, a 57% increase over More than 3,200 labs were destroyed an increase of 36%. Consumers are starting to feel the effects. The significant decreases in cocaine seizures worldwide in combination with rising cocaine prices and falling cocaine purity in the main consumer markets are an indication of market contraction. Colombia is making tremendous efforts to contain its cocaine problem at the source. It would be helped if the biggest cocaine markets would pay as much attention to reducing demand. Antonio Maria Costa Executive Director United Nations Office on Drugs and Crime 3
4 TABLE OF CONTENT SUMMARY FACT SHEET 6 EXECUTIVE SUMMARY 7 1 INTRODUCTION 8 2 FINDINGS COCA CULTIVATION 10 National cultivation 10 Regional Analysis 21 Possible areas of new cultivation 2.2 COCA LEAF, COCA PASTE AND COCAINE BASE PRODUCTION Potential base and cocaine production COCA PRICES 50 Coca leaf, cocaine base and cocaine prices 50 Coca leaf prices 50 Coca paste prices 51 Cocaine base prices 53 Cocaine prices 53 Income per hectare 2.4 OPIUM POPPY CULTIVATION Opium Latex and Heroin Production 58 Opium Latex and Heroin Prices 2.5 RELATED STUDIES AND RESEARCH Economical structure of the agricultural production units in coca influence areas ILLICIT CROPS AND ALTERNATIVE DEVELOPMENT 64 Alternative development programmes 64 Coca cultivation and the Forest Warden Families Programme 67 Coca cultivation in coffee plantation areas 69 Armed groups and coca cultivation 2.7 SUPPLY REDUCTION Reported forced manual eradication 73 Reported aerial spraying 76 Plan Of Integral Consolidation 79 Reported seizures 82 3 METHODOLOGY COCA CULTIVATION 87 Accuracy assessment 96 Analysis of the dynamics of cultivation 98 Annex 1: Correction for cloud cover, gaps, aerial spraying and date of imagery in Annex 2: List of satellite images used for the colombia coca cultivation survey Annex 3: Coca cultivation in indigenous territories 104 4
5 INDEX OF MAPS Map 1: Coca cultivation density in Colombia, Map 2: Coca cultivation density changes in Colombia, Map 3: Coca cultivation density in Colombia, Map 4: Coca cultivation density in Colombia, Map 5: Changes in coca cultivation area in Colombia, Map 6: Coca cultivation density in the Andean Region, Map 7: National Parks and Coca cultivation in Colombia, Map 8: Coca Cultivation by Region in Colombia, Map 9: Coca cultivation density in the Pacific region, Map 10: Coca cultivation density in the Central region, Map 11: Coca cultivation density in the Putumayo-Caqueta region, Map 12: Coca cultivation density in the Meta-Guaviare region, Map 13: Coca cultivation density in the Orinoco region, Map 14: Coca density cultivation in the Amazonas region, Map 15: Coca density cultivation in the Sierra Nevada region, Map 16: Coca yield by region in Colombia, Map 17: Annual coca leaf production in Colombia, Map 18: Investment in Alternative Development and illicit crops in Colombia, Map 19: Agricultural land and forest warden families Programme in Colombia, Map 20: Coca cultivation in coffee plantation areas in Colombia, Map 21: Illegal armed groups and coca cultivation in Colombia, Map 22: Forced manual eradication and coca cultivation in Colombia, Map 23: Aerial spraying and coca cultivation in Colombia, Map 24: Coca cultivation density changes in PCIM area in Colombia, Map 25: Destruction of clandestine laboratories and coca cultivation in Colombia, Map 26: Drug seizures by department and by drug type in Colombia, Map 27: Satellite images used for the 2008 survey in Colombia 88 Map 28: Study area distributed by region and by Colombia coca cultivation 92 5
6 SUMMARY FACT SHEET COLOMBIA COCA SURVEY FOR Variation 2008 Net coca cultivation (rounded total) 99,000 hectares -18% 81,000 hectares Of which Pacific region 25,960 hectares +15% 29,920 hectares Putumayo-Caqueta region 21,130 hectares -34% 13,960 hectares Central region 20,950 hectares -11% 18,730 hectares Meta-Guaviare region 19,690 hectares -38% 12,150 hectares Elsewhere 11,270 hectares -45% 6,240 hectares Reported cumulative aerial spraying of coca bush 153,134 hectares -13% 133,496 hectares Reported manual eradication of coca bush 66,805 hectares +44% 96,115 hectares Average farm-gate price of coca paste US$ 943/kg +2% US$ 963/kg COP$ 1,959,000/kg -4% COP 1,878/kg Total farm-gate value of the production of coca leaf and its derivatives US$ 934 million -33% US$ 623 million in % of GDP 1 0.5% 0.3% in % of GDP of agricultural sector 5% 3% No. of households involved in coca cultivation 80,000 households -26% 59,328 households Annual household gross income from the production of coca leaf and its derivatives US$ 11,675-10% US$ 10,508 Production of cocaine 600 mt -28% 430 mt in % of world cocaine production 60% -15% 51% Average wholesale cocaine price US$ 2,198/kg 7% US$ 2,348/kg COL$ 4,567,000/kg 0% COP 4,580,000 /kg Reported opium poppy cultivation 714 hectares -45% 394 hectares Potential opium latex production 18 mt -43% 10.3mt Potential heroin production 2.3 mt -43% 1.3mt Average farm-gate price of opium latex US$ 286/kg +11% US$ 318 /kg Average heroin price US$ 10,780/kg -8% US$ 9,950/kg Reported seizure of cocaine 126,641 kg +57% 198,366 kg Reported seizure of heroin 537 kg +20% 646kg Reported destruction of clandestine laboratories 2 2, % 3,209 1 GDP of the respective year as reported by the Government. 2 Includes laboratories processing coca paste/cocaine base, cocaine hydrochloride, heroin, morphine, potassium permanganate, and non-specified. 6
7 EXECUTIVE SUMMARY Through its global Illicit Crop Monitoring Programme, UNODC has been assisting the Colombian Government in the implementation and refinement of a national coca monitoring system since Annual surveys have been produced since then and the present report provides the findings of the coca survey for The methodology design by the Project is based in the identification of the coca fields on medium resolution satellite images and field verification. With this verification, the office identification is edited and the estimation of the coca cultivation in areas without information (cloud covered, etc.) is added. The results of the survey showed that, at the end of December 2008, 81,000 hectares of coca were cultivated in 24 out of the 32 Colombian departments. This represents a decrease of 18,000 hectares or 18% compared to 2007 and a return to the levels of coca cultivation in the period. The most important decrease in 2008 took place in all the major coca cultivation regions: Meta- Guaviare (-38%), Putumayo-Caqueta (-34%), Orinoco (-61%) and Central (-11%). In fact, 78% of the 2008 cultivation took place in just eight departments, the same eight departments that also accounted for 89 % of 2007 total cultivation: Nariño, Putumayo, Meta, Antioquia, Guaviare, Vichada, Cauca and Caqueta. The assessment of the accuracy of the interpretation results is part of a quality control. In September 2004, the Institute of Surveying, Remote Sensing and Land Information of the University of Natural Resources and Applied Life Sciences, Vienna (BOKU, Austria), started an assessment of the accuracy of the interpretation still in process It was also noted that the average field size decreased from 0.82 hectares in 2007 to 0.66 hectares in 2008 (-22%). Between 2007 and 2008, the government reported the manual eradication of 96,115 hectares, a new record compared to previous levels of 43,051 hectares in 2006 and 66,805 hectares in In addition, aerial spraying continued to be intense and was above 130,000 hectares for the seventh consecutive year. In 2008, a total of 133,496 hectares were sprayed. The total of both types of activities (spraying and manual eradication) amounted to 230,000 hectares in UNODC/SIMCI has been conducting comprehensive research assessing the annual yield of the fresh coca leaf and identifying the agricultural practices associated with coca cultivation since The analysis of this years' collected data revealed that with respect to the yields estimated in 2005, there was a significant decline of the yields in the studied regions in 2008, a decline of 59% in the fresh coca leaf production was found in Meta-Guaviare and a decline of 33% in Putumayo-Caqueta, as estimated from the data collected from the interviews with farmers. A combination of lower yields and a decline of the area under coca cultivation produced a reduction of 28% in the cocaine production in 2008 as compared to In 2008, the production of cocaine HCL in Colombia amounted to 430 metric tons, a dramatic decrease by 28 per cent or 170 metric tons compared to As a consequence of this decrease and simultaneous production increases in Bolivia and Peru by 21 metric tons, Colombia's share of the world cocaine production continues with its down trend from 60 per cent in 2007 to 51per cent of the total world production in At the farm-gate level, the gross value of coca leaf and its derivatives amounted to US$ 517 million, equivalent to 0.3% of the Colombian 2008 GDP or 3% of the GDP of the agricultural sector. It should be noted, however, that this value does not take into account production costs like herbicides, pesticides, fertilizers and wages. The coca leaf yield survey also enabled to estimate the total number of households involved in coca farming at about 59,300 households (floating population is not included). The farm gate value thus represents an annual gross income per household of US$ 10,039, equivalent to an annual per capita gross income of US$ 2,000. By comparison, the GDP per capita in Colombia in 2008 was estimated by approximated US$ 5,000. 7
8 1 INTRODUCTION The objectives of UNODC s Illicit Crop Monitoring Programme (ICMP) are to establish methodologies for data collection and analysis, to increase the governments capacity to monitor illicit crops on their territories and to assist the international community in monitoring the extent and evolution of illicit crops in the context of the elimination strategy adopted by the Member States at the U.N. General Assembly Special Session on Drugs in June ICMP presently covers seven countries: Colombia, Bolivia and Peru for coca; Afghanistan, Lao PDR and Myanmar for opium and Morocco for cannabis. During the 1980 s and 1990 s, Colombia became the country with the largest illicit coca growing area and cocaine production in the world. Illicit coca cultivation in the country expanded steadily throughout this period, in particular in remote areas of the Amazon basin. Although coca cultivation started to decrease in 2001, Colombia remains the largest coca-growing country in the world. UNODC has supported the monitoring of illicit crops since 1999, and has produced ten annual surveys through a special satellite based analysis programme called SIMCI (from the Spanish initials). The initial surveys (1999 and 2000) did not cover the entire country but since the 2001 survey, SIMCI started to cover the entire territory to assure the monitoring of the possible expansion of illicit crops In October 2006, UNODC signed a new agreement with the Colombian government to continue and expand monitoring and analysis work. In this context, the SIMCI II project facilitates the implementation of additional tasks in the framework of an integrated approach to analyse the drug problem in Colombia. The project also supports the monitoring of related problems such as fragile ecosystems, natural parks, indigenous territories, the expansion of the agricultural frontier and deforestation. It provides Geographic Information System support to the government s alternative development projects and it s Forest Warden Families Programme. The new project foresees the creation of an Inter-Institutional Committee permanently assigned to the project in order to ensure the transfer of know-how to the national beneficiary institutions. SIMCI II is a joint project between UNODC and the Colombian government, represented by the Ministry of Interior and Justice and the International Cooperation Agency. The national counterpart is the Ministry of Interior and Justice, President of the National Board of Narcotics. The project is managed by a technical coordinator and composed of engineers and technicians: four digital image processing specialists, one field engineer, a cartographic engineer, a research and analysis specialist, two assistant engineers and a technician in logistic support and data base. In 2009, two experts in digital image processing and a statistician joined the team to carry out two estimations per year between the cut dates of the census and to establish trends in the coca cultivation at national level. The team cooperates with technicians from the Police Antinarcotics Division (DIRAN) and National Parks Administration. It supports several studies and investigations for government and private institutions, related to land use, environment, licit crops, etc. SIMCI provides to the above-mentioned institutions experts, access to its Spatial Information Data Bank, transfer of technology and guidance to achieve their goals. Organizations that benefited from SIMCI support include the National Directorate for Statistics (DANE), local governments, the National Federation of Coffee Growers, NGOs as well as other UN agencies and projects The project has developed technical agreements with several national and foreign Universities, to interchange and share knowledge, for training activities and joint projects. Among them are BOKU University in Austria, Zaragoza University in Spain, Universities of Harvard, Michigan and Maryland in USA, Los Andes, Antonio Nariño and other Universities in Colombia.. 8
9
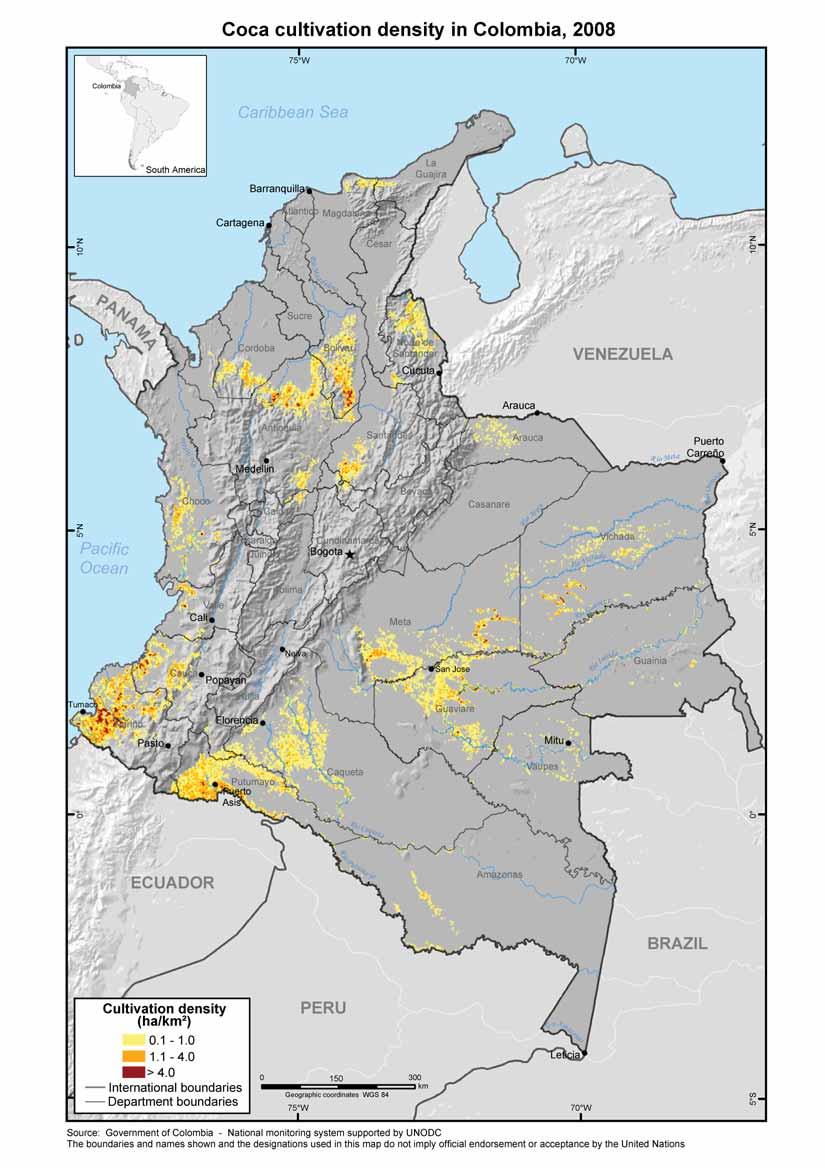
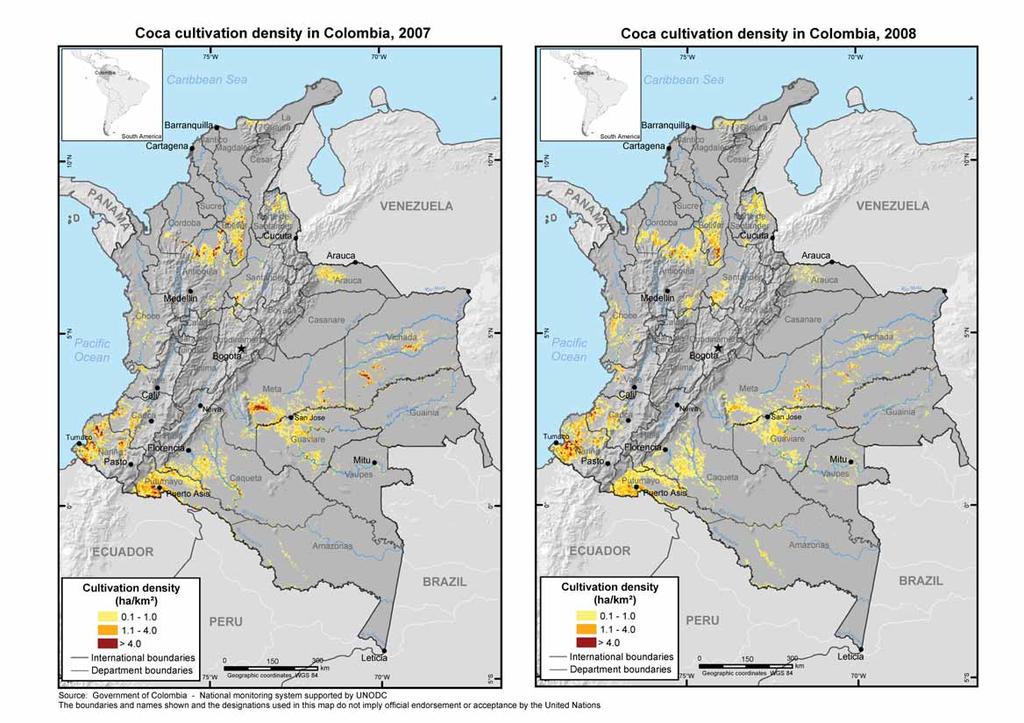
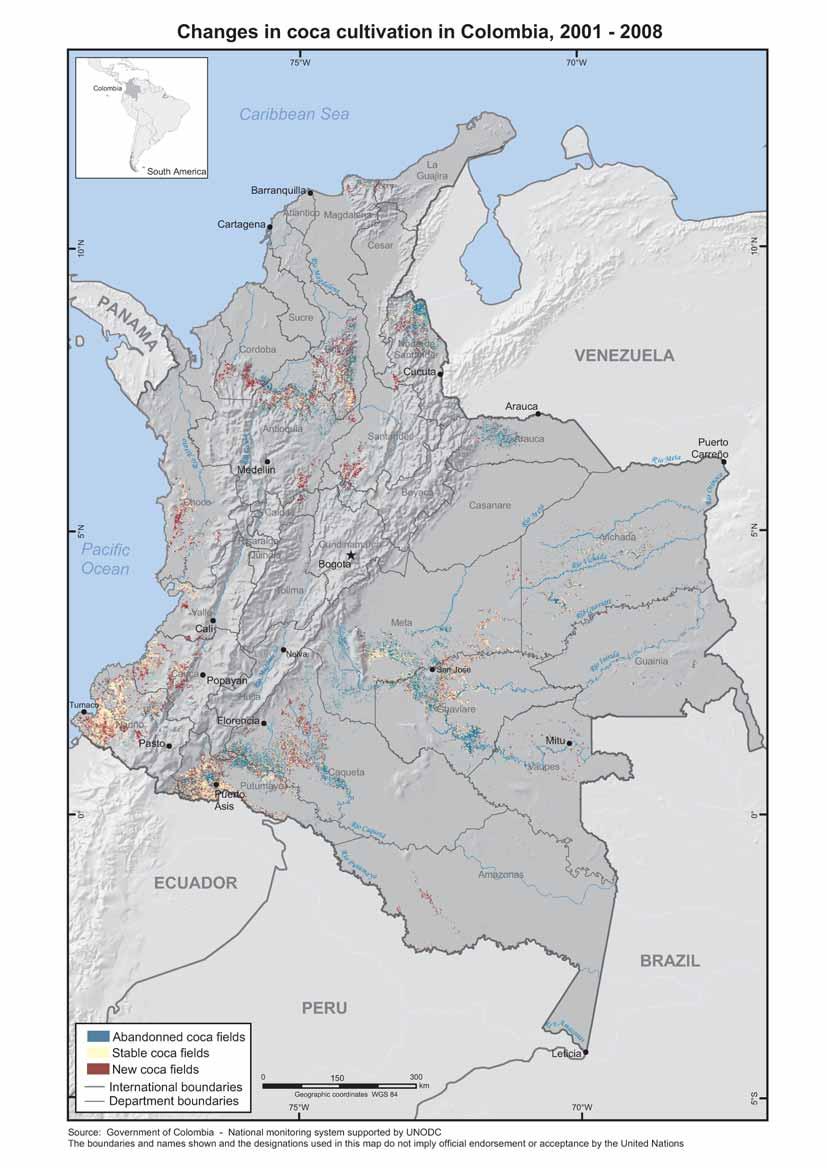
10 2 FINDINGS 2.1 Coca cultivation National cultivation In 2008, the total area under coca cultivation in Colombia was estimated at 81,000 hectares. This estimate represented a 18% decrease in area under the illicit crop as compared to 2007 estimate of 99,000 hectares. This estimation drove the coca cultivation back to the levels presented in the years Similarly to the previous nine surveys, the 2008 survey represents the situation as of the end of the year, in this case as of 31 December As was the case last year, the survey covered the whole territory and detected coca cultivation in 24 out of 32 departments, one more than in In 2008, the area under coca cultivation represents 1.6% of the total agricultural land in Colombia. Figure 1: Coca cultivation in Colombia, , , , ,000 Hectares 100,000 80,000 60,000 40,000 20, The decrease in coca cultivation between 2007 and 2008 correspond to the level of manual eradication which accounted up to 96,115 hectares and aerial spraying, which reached 133,496 hectares of coca cultivation. This level of manual eradication is 29,310 hectares higher than the previous year's record of 66,805 hectares. The aerial spraying of coca cultivation has remained above 130,000 hectares since Analysis of coca cultivation changes Coca cultivation is very dynamic in Colombia. A range of variables can be associated with increases and decreases of the cultivation area over time. Factors such as favourable prices, pressure exerted by illicit armed groups on farmers, the legal economy, and temporary crisis situations can all lead to an increase in the cultivated area. On the other hand, factors such as forced eradication, aerial spraying, improved security conditions, and plant diseases can contribute to reducing the cultivated area. This cultivation survey does not endeavour to assess how or in what extent these factors bring about change in the area under coca cultivation. Rather, it shows the situation on a given date of the year (31st of December). The multitemporal analysis of coca cultivation is done on imagery of 2007 and 2008 and therefore, concepts such as abandoned or new fields refer exclusively to this period. At the end of the 10
11 period, 25% of the area planted with coca was the same as identified at the beginning 2008, and can be considered as stable where as 15% of the area planted with coca replaced primary forest vegetation and therefore was newly planted during this period. The remaining 60% of the coca crops replaced other types of vegetation such as pastures or bare soil, of which 44% have been planted and then abandoned in previous years and 16% do not show coca crops since Table 1. Stable and new fields of coca bush in 2008 New area in 2008 Area (hectares) Stable area Primary forest in 2007 Other vegetation in 2008 Not detected with coca before 2008 Cultivated with coca before 2007 Total 20,138 12,356 35,178 13,281 80,953 Percentage 25% 15% 44% 16% 100% The multitemporal analysis of the last seven years showed that 41% of the coca fields identified in 2008 were cultivated with coca in one or more years during the reference period. The analysis of the data also showed that the average coca field size continued to decrease since 2001 where the average size was of 2.05 hectares, to 1.13 hectares in 2005 and to 0.66 hectares in A possible explanation could be that farmers reduced the size of their coca fields to avoid detection and manual eradication or aerial spraying. The ten municipalities listed below were ranked as the highest municipalities in terms of coca cultivation in Colombia, representing 35% of the national total coca cultivation and 35% of national potential cocaine production. The municipality of Tumaco in Pacific region has the largest coca cultivation area in Colombia (7.2% of the national total) and Cumaribo in the Orinoco region has the largest production of cocaine (11.2% of the national total). Table 2. The ten municipalities with the highest coca cultivation area and cocaine potential production in 2008 Coca Municipality Department (hectares) cultivated % of coca cultivation Pure cocaine area area in Colombia production (tm) Tumaco Nariño 5, % 16 Cumaribo Vichada 3, % 48 Barbacoas Nariño 3, % 7 Puerto Asis Putumayo 2, % 18 El Retorno Guaviare 2, % 15 Roberto Payan Nariño 2, % 7 Magui Nariño 2, % 7 El Charco Nariño 2, % 5 Mapiripan Meta 2, % 12 San Jose del Guaviare Guaviare 2, % 15 Total 28,216 35%
12
13 In absolute numbers, the most important decreases of coca cultivation between 2007 and 2008 were in the departments of Putumayo (-5,155 hectares) in the Southwest of the country, Meta (-4,861 hectares) and Antioquia (-3,830 hectares) in the Central region. The decrease in Putumayo which accounted for 35% of the area under coca cultivation in 2007 went from 14,800 hectares to 9,700 hectares. Coca cultivation in Putumayo was significant since 1999 varying between 58,300 and 47,000 hectares until In 2002 a significant reduction to 15,100 hectares was registered and the coca cultivation took a constant downtrend reaching a record of 4,400 hectares in Since then, the coca area was increasing constantly until 2007 to decrease again in Only small but locally significant increases of coca crops took place in the departments of Choco (+1,714 hectares), Valle del Cauca (+1,636 hectares) and Cauca (+1,254 hectares). The department of Choco, at the Pacific Ocean coast, which had a small coca cultivation area in 2003 with less than 500 hectares, increased its coca area almost six times (2,794 hectares) in Nariño and Putumayo, despite a combined decrease of 5,800 hectares remain as the first two top departments in terms of coca cultivation, together accounting for 36% of the total area under coca cultivation in the country. In fact 44% of the 2008 cultivation took place in just three departments Nariño, Putumayo and Guaviare, the same three departments that accounted for 45% of total cultivation in Table 3. Coca cultivation by department, (hectares) Department Dec Dec Dec Dec Dec Dec % change % of total 2008 Nariño 17,628 14,154 13,875 15,606 20,259 19,612-3% 24% Putumayo 7,559 4,386 8,963 12,254 14,813 9,658-35% 12% Guaviare 16,163 9,769 8,658 9,477 9,299 6,629-29% 8% Antioquia 4,273 5,168 6,414 6,157 9,926 6,096-38% 8% Bolivar 4,470 3,402 3,670 2,382 5,632 5,847 4% 7% Meta 12,814 18,740 17,305 11,063 10,386 5,525-47% 7% Cauca 1,443 1,266 2,705 2,104 4,168 5, % 7% Caqueta 7,230 6,500 4,988 4,967 6,318 4,303-32% 5% Vichada 3,818 4,692 7,826 5,523 7,218 3,174-56% 4% N, de Santander 4,471 3, ,946 2,886 48% 4% Choco , ,080 2, % 3% Valle del Cauca , % 3% Santander 632 1, ,325 1, % 2% Cordoba 838 1,536 3,136 1,216 1,858 1,710-8% 2% Amazonas % 1% Guainia % 0.8% Vaupes 1,157 1, % 0.7% Arauca 539 1,552 1,883 1,306 2, % 0.6% Magdalena % 0.5% Boyaca % 0.2% Caldas % 0.2% La Guajira % 0.2% Cundinamarca % 0% Cesar n.a 0% TOTAL 86,340 80,350 85,750 77,870 98,899 80,953-18% 100% Rounded Total 86,000 80,000 86,000 78,000 99,000 81,000-18% Departments affected
14
15

 0.1-1.0 1.1-4.")


16 80 W Coca cultivation density in the Andean Region, W Colombia 60 W Caribbean Sea Peru 10 N PANAMÁ Catatumbo Bolivia South America 10 N COLOMBIA Norte de Antioquia Atrato Magdalena ^ Bogota Meta Vichada Guaviare VENEZUELA GUYANA 0 Nariño Esmeraldas Daule Esmeraldas Sucumbios Quito^ Coca ECUADOR Pastaza Curaray Napo Caqueta Putumayo Putumayo - Caqueta Meta - Guaviare 0 Zamora Amazonas BRAZIL Marañon Huallaga Alto Huallaga Ucayali 10 S 20 S PERU Pacific Ocean 80 W Lima ^ Cultivation density 2 (ha/km ) > 4.0 International boundaries Department boundaries Ene Apurímac Ene Urubamba Purus La Convencion and Lares Apurimac Geographic coordinates WGS 84 km Titicaca 70 W Lake Madre de Dios CHILE Beni ^ La Paz Yungas Mamore Guapare Chapare Pilcomayo ARGENTINA BOLIVIA PARAGUAY 60 W 10 S 20 S Sources: National monitoring systems supported by UNODC - Governments of Bolivia, Colombia and Peru The boundaries and names shown and the designations used on this map do not imply official endorsement or acceptance by the United Nations
17 In 2008, coca cultivation in Colombia represented 48% of the world coca cultivation, while Peru and Bolivia represented respectively 33% and 18%. Figure 2: Coca cultivation in the Andean Region (in hectares) 250, ,000 Hectares 150, ,000 50, Bolivia Colombia Peru Table 4. Coca cultivation in the Andean region (in hectares) % Change Bolivia 38,000 21,800 14,600 19,900 21,600 23,600 27,700 25,400 27,500 28,900 30,500 +6% Peru 51,000 38,700 43,400 46,200 46,700 44,200 50,300 48,200 51,400 53,700 56,100 +4% Colombia 102, , , , ,000 86,000 80,000 86,000 78,000 99,000 81,000-18% Total 191, , , , , , , , , , ,600-8% Sources United States Department of State National Monitoring System Supported by UNODC 17
18
19 Coca cultivation in national parks The presence of illicit crops in both Natural Parks and Indigenous Territories has been monitored by SIMCI since the 2001 coca cultivation survey, and the data have been delivered to the competent authorities to enable them to identify actions and projects to be applied for the preservation of its social and environmental characteristics with minimum of harm. The boundaries of National Parks and Indigenous territories have been provided by the official institutions in charge of their management. In 2005 the limits of National Parks were edited by the monitoring project in cooperation with technicians from the National Parks Administrative Unit. The editing improved the match between SIMCI cartographic material and the official boundaries of the Parks. National Parks boundaries are not always precise and therefore coca cultivation estimated in each of them depends on the accuracy of their delimitation. Coca cultivation in 2008 was found in 14 of the 54 National Parks in Colombia. With 3,445 hectares in 2008, coca cultivation represented 0.02% of the total area covered by National Parks, and coca cultivation in National Parks represented 4% of the total level of coca cultivation in Coca cultivation in National Parks showed a slight decrease of 9% in the period 2007 and The significant reduction of the area under coca cultivation in the National Parks of Sierra La Macarena (-677 hectares) and Nukak (-337 hectares) contrasts with the increase in the National Park of Catatumbo-Bari (+432 hectares). The detailed results by indigenous territories are presented in Annex 3. Table 5. Coca cultivation in National Parks, National Parks % Change Nukak ,370 1,033-24% Sierra La Macarena 3,354 1,689 1, % Catatumbo-Bari ,155% Paramillo % La Paya % Sierra Nevada % Munchique % Puinawai % Utria % Tinigua % Sanquianga % El Tuparro % Yariguies Alto Fragua % Los Picachos El Cocuy % Selva de Florencia Farallones TOTAL 6,110 3,556 3,770 3,445-9% Rounded Total 6,100 3,600 3,800 3,400 19
20
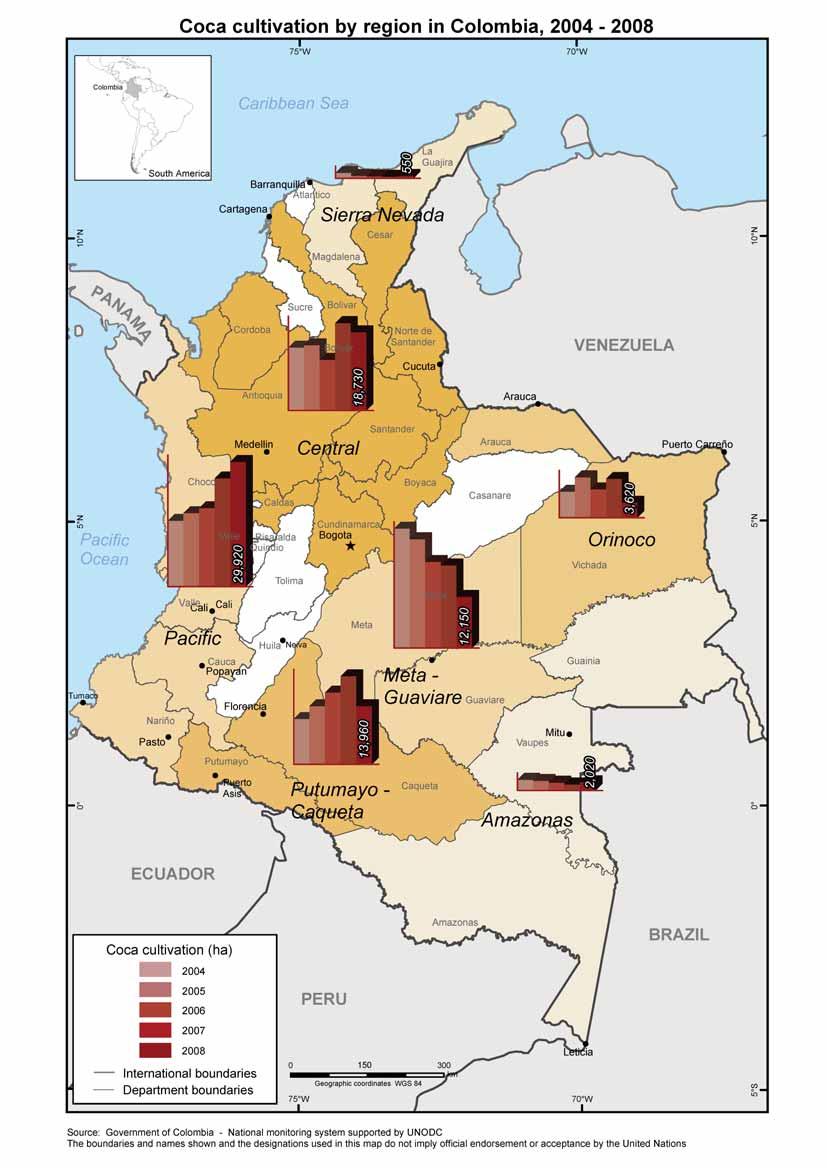
21 Regional Analysis In 2008, 77% of coca cultivation in Colombia took place in the coca-growing regions of Pacific, Central and Putumayo-Caqueta. The largest reductions took place in the Meta-Guaviare region (- 7,531 hectares), in Putumayo-Caqueta (-7,170 hectares), and in Orinoco (-5,713 hectares) in the eastern part of the country bordering Venezuela. The major increase took place in the corridor between the Western range of mountains and the Pacific Ocean coastal (+ 3,957 hectares, +15%). Table 6. Coca cultivation by region (hectares) Region % of Change % of Total 2008 Pacific 19,561 15,789 17,633 18,807 25,960 29,917 15% 37% Central 15,389 15,081 15,632 12,131 20,953 18,731-11% 23% Putumayo Caqueta 14,789 10,888 13,951 17,221 21,131 13,961-34% 17% Meta-Guaviare 28,977 28,507 25,963 20,540 19,685 12,154-38% 15% Orinoco 4,357 6,250 9,709 6,829 9,334 3,621-61% 4% Amazonas 2,508 2,588 2,320 1,905 1,471 2,018 37% 3% Sierra Nevada 759 1, % 1% Rounded Total 86,000 80,000 86,000 78,000 99,000 81,000-18% 100% Figure 3: Coca crops by region, ,000 30,000 25,000 Hectares 20,000 15,000 10,000 5,000 0 Pacfic Central Putumayo- Caqueta Meta- Guaviare Orinoco Amazonas Sierra Nevada
22
 Department 2004 2005 2006 2007 2008 % Change 2007-2008 Nariño 14,154 13,875 15,606 20,259 19,612-3% Cauca 1,266 2,705 2,104 4,168 5,422")
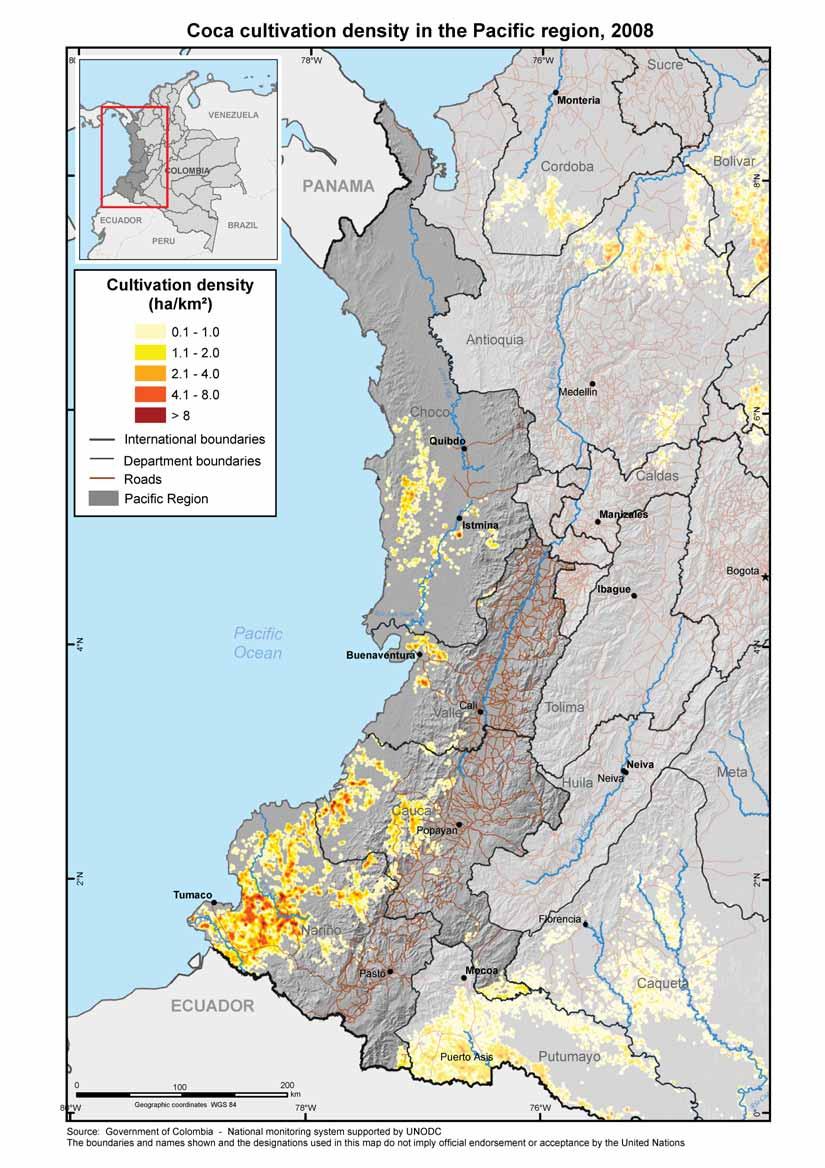
23 Pacific region Nariño is located in the South-western part of the country, at the border with Ecuador. The geographic features of the region include high altitudes, as well as coastline. Table 7. Coca cultivation in the Pacific Region, (hectares) Department % Change Nariño 14,154 13,875 15,606 20,259 19,612-3% Cauca 1,266 2,705 2,104 4,168 5, % Choco 323 1, ,080 2, % Valle del Cauca , % Total 15,788 17,633 18,807 25,960 29, % Annual trend -19% +12% +7% +38% +15% Coca cultivation in Nariño became significant in 2002, when coca cultivation decreased in the neighbouring departments of Putumayo and Caqueta. Between 2001 and 2002, coca cultivation decreased by 40,000 hectares in Caqueta and Putumayo, while increasing by 7,600 hectares in Nariño. Aerial spraying in Nariño department reached 54,000 hectares. In addition, 7,985 hectares of manual eradication were reported in In the period , coca cultivation decreased 647 hectares. In 2008, coca cultivation was found in 25 municipalities out of 64. With a total of 19,612 hectares of coca cultivation, Nariño has the highest amount of land under illicit cultivation with 24% of the total coca cultivation in the country. Nariño accounted for 34% of all the fields of less than ¼ hectare found in the country in 2008, indicating the small scale of the coca cultivation. Like neighbouring Nariño department, Cauca has a long coastline, high mountain ranges and a mainly rural economy. Following a period of continuous decrease between 1999 and 2006 interrupted in 2005, the increase in the period to double of the area, took place when the manual eradication increased from 1,884 hectares in 2007 to 1,919 hectares in Although its capital, Cali, was an important centre for narco-trafficking in the nineties, the department of Valle del Cauca always recorded less than 300 hectares under coca cultivation, but it showed an increase in the period (750%) from 28 hectares in 2005 to 2,089 hectares in The Choco department also shows an increase in the period from 1,080 hectares to 2,794 hectares. Although, because of the almost constant cloud coverage it might be due fields newly detected this year. This increase also may be due to the facts that the Choco department is an important gate for cocaine exportation and also to the weather and topographic difficulties for aerial aspersion and manual eradication. In fact no aerial aspersion took place in 2008 and only 677 hectares were eradicated in 2008 Coca fields in Nariño department 23
24
 Department 2004 2005 2006 2007 2008 % change 2007-2008 Antioquia 5,168 6,414 6,157 9,926 6,096-38% Bolivar 3,402 3,670 2,382 5,632 5,847")
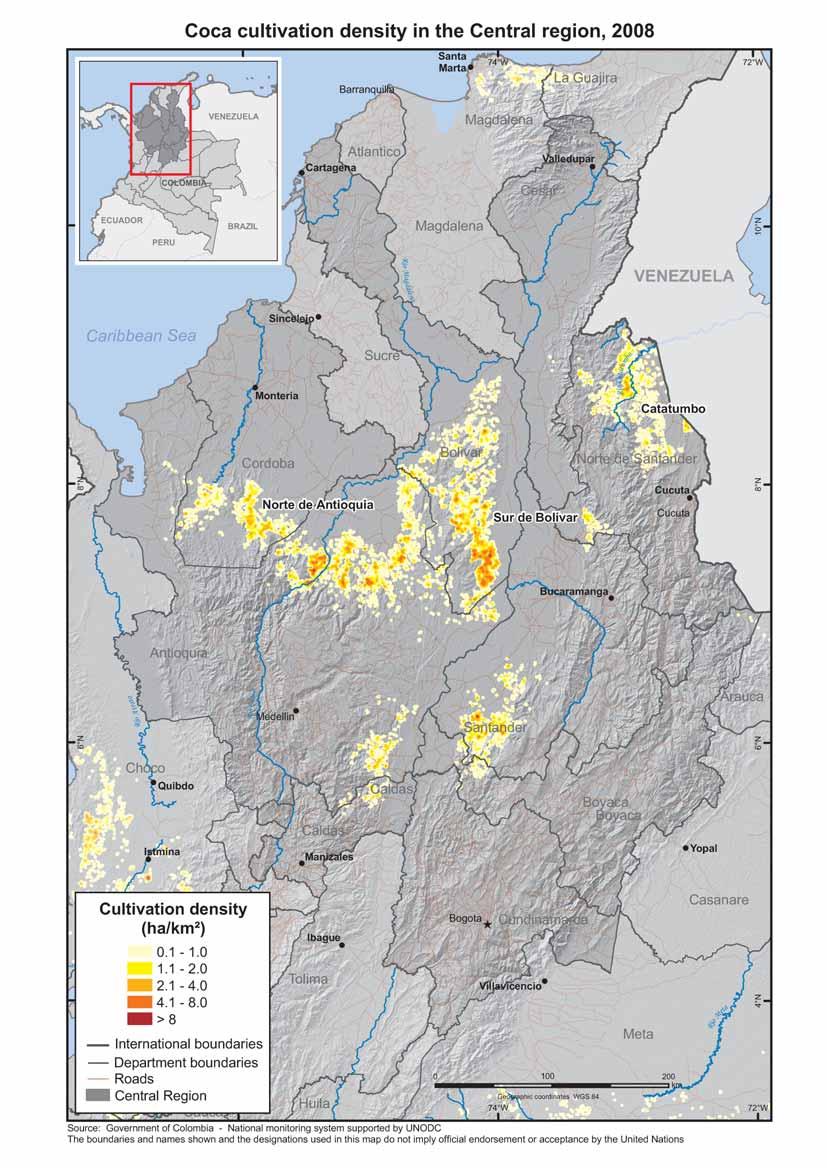
25 Central region Table 8. Coca cultivation in the Central Region, (hectares) Department % change Antioquia 5,168 6,414 6,157 9,926 6,096-38% Bolivar 3,402 3,670 2,382 5,632 5,847 +4% Norte de Santander 3, ,946 2, % Santander 1, ,325 1, % Córdoba 1,536 3,136 1,216 1,858 1,710-8% Caldas % Boyaca % Cundinamarca % Cesar n.a Total 15,073 15,632 12,131 20,953 18,731-11% Annual trend -2% +4% -22% +73% -11% Since 2002, coca cultivation remained stable at around 15,000 hectares in the Central region of Colombia. In 2007 the region showed a significant increase of 8,822 hectares (+73%) with respect to 2006 but a decrease to 18,731 hectares (-11%) in At the end of the nineties, Norte de Santander department was one of the most important centres of coca cultivation in the country, accounting for 10% of the country total in Between 1999 and 2006, the Government has been able to drastically reduce coca cultivation in this department and in 2006 dropped it to less than 500 hectares. In 2008, coca cultivation showed a very important increase of 2,378 hectares (six times more than the amount accounted in 2006 of 488 hectares). In the department of Bolivar, coca cultivation is concentrated in the South, in an area known as South of Bolivar. Coca cultivation in the department remained relatively stable, accounting for 3% to 8% of the country total in the period In 2008 coca cultivation increased by 245% in the amount of 3,465 hectares with respect to 2006, the highest in the last eight years. The manual eradication increased considerably from 514 hectares in 2007 to 3,773 (+740%) hectares in 2008 whereas the aerial spraying in this department decreased in the considerable amount of 4,836 hectares (-69%). In Antioquia, coca cultivation averaged 3,000 hectares between 1999 and Coca cultivation has been increasing since 2002, from 3,030 hectares to 9,926 hectares in 2007 but it showed a significant decrease of 3,830 hectares in This decrease in the last year responds to a significant increase in manual eradication from 6,166 hectares in 2007 to 18,300 hectares in 2008 along with a reduction of aerial spraying, from 27,000 hectares to 10,000 hectares. In the department of Caldas, the most important coffee growing area in Colombia, coca cultivation was detected for the first time in 2003 (54 ha). Coca cultivation reached a peak in 2006 with 461 hectares and went back to the 2003 level but increased again to 187 hectares in The manual eradication decreased from 424 hectares to 285 hectares while no aerial spraying took place in The department of Cordoba showed a minor decrease of 148 hectares in 2008 (-8%). The manual eradication reported in 2008 amounts to 7,310 hectares with respect to 2007 (+43%) and the aerial spraying presented a significant decrease from 6,300 hectares in 2007 to 3,561 hectares in 2008 (-44%). The departments of Norte de Santander, Antioquia and Santander received the largest support in alternative development in Colombia (65% in 2006 and 58% in 2007) of the national total investment. Coca field in Catatumbo Region 25
26
 Department 2004 2005 2006 2007 2008 % Change 2007-2008 Putumayo 4,386 8,963 12,254 14,813 9,658-35% Caqueta 6,500 4,988 4,967")

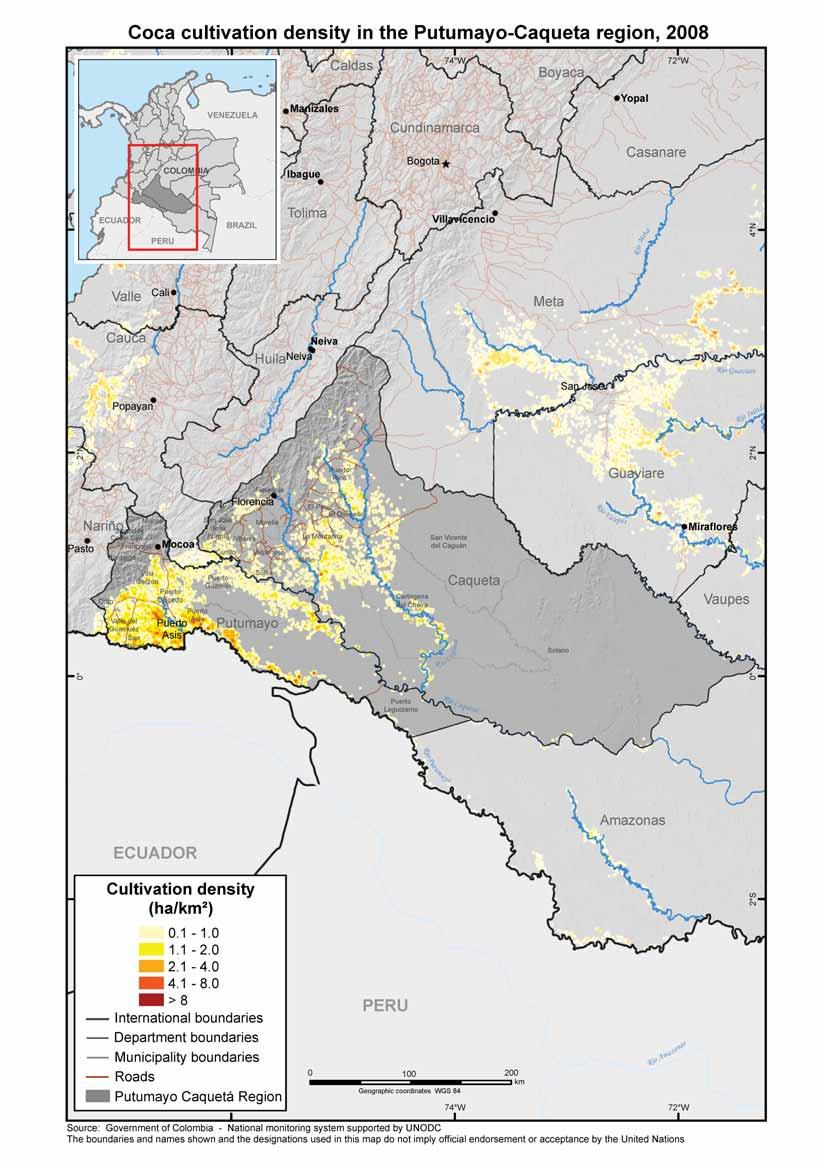
27 Putumayo-Caqueta region Table 9.Coca cultivation in the Putumayo-Caqueta Region, (hectares) Department % Change Putumayo 4,386 8,963 12,254 14,813 9,658-35% Caqueta 6,500 4,988 4,967 6,318 4,303-32% Total 10,886 13,951 17,221 21,131 13,961-34% Annual trend -26% +28% +23% +23% -34% In 2000, coca cultivation peaked in Putumayo department at 66,000 hectares, representing 40% of the national total. Following four years of consecutive decreases, coca cultivation in Putumayo was estimated at only 4,400 hectares or 5% of the national total in 2004, but this trend was later reversed. Between 2005 and 2007, coca cultivation soared by 105% in 2005 and by 37% in 2006 and by 21% in 2007 and went back in 2008 to 2005 levels, although maintaining this department on the second place of coca cultivation in the country. At the same time, 29,284 hectares were manually eradicated which represents an increase of almost five times more over 2006, while the aerial spraying decreased to 11,900 hectares. The Government s Plan Colombia to fight against illicit drugs was implemented in 2002 in this department, combining actions of interdiction, aerial spraying, manual eradication and important alternative development projects with good results in the period 2002 to % of the 2008 budget of ongoing alternative development projects went to Putumayo, whereas this used to be 35% in the period. Many of the new coca fields were re-established on the fields cultivated at the beginning of this decade. The spraying activities in 2008 decreased in 28% in this region, but the manual eradication compensated this with an increase of 26%. In Caqueta department, coca cultivation peaked at 26,000 hectares in 2000 or 16% of the country total. Following intense aerial spraying that started in 1996; coca cultivation decreased to levels around 6,000 hectares in the period In 2008, coca cultivation shows its lowest level at 4,303 hectares, while the aerial spraying which remained around 5,000 hectares since 2005, but shows an increase to 11,000 hectares in Cocal fields in Putumayo-Caqueta region 27
28
 Department 2004 2005 2006 2007 2008 % Change 2007-2008 Guaviare 9,769 8,658 9,477 9,299 6,629-29% Meta 18,740 17,305 11,063 10,386 5,525-47%")
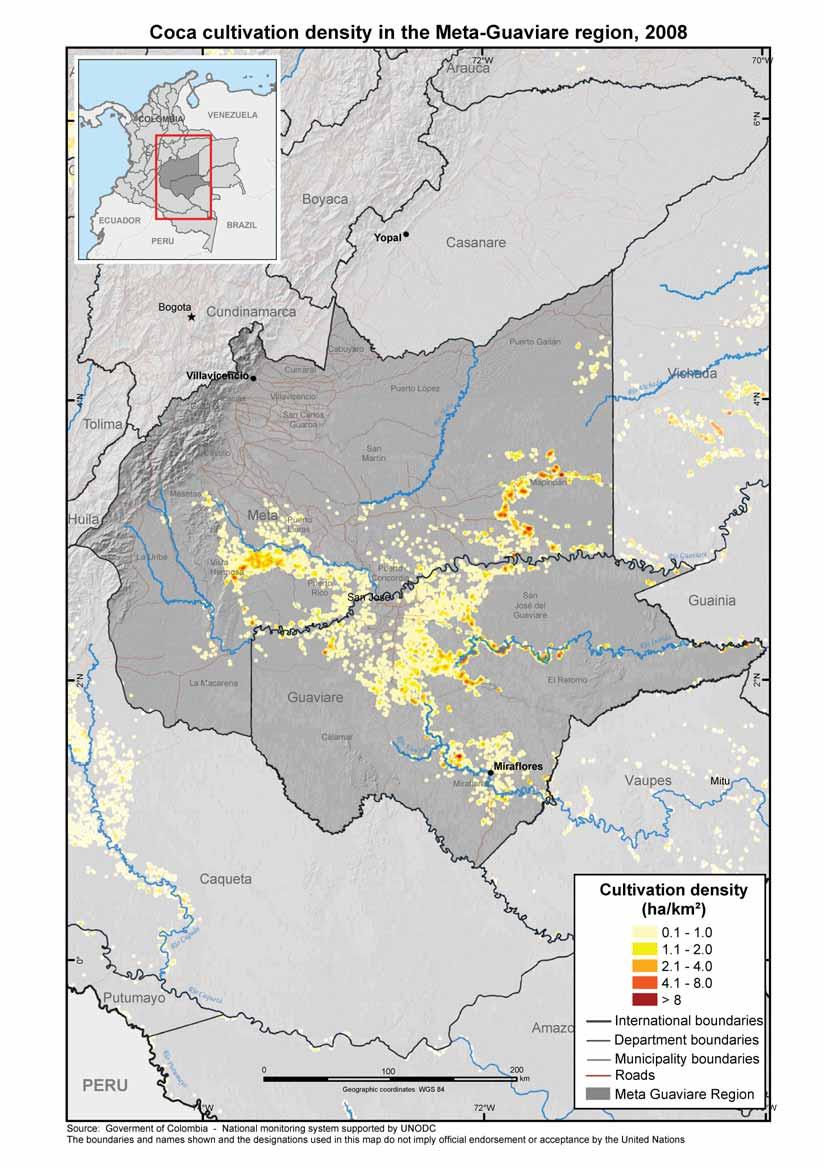
29 Meta-Guaviare region Table 10. Coca cultivation in Meta-Guaviare, (hectares) Department % Change Guaviare 9,769 8,658 9,477 9,299 6,629-29% Meta 18,740 17,305 11,063 10,386 5,525-47% Total 28,509 25,970 20,540 19,685 12,154-38% Annual trend -2% -9% -21% -4% -38% The Meta-Guaviare region was traditionally the largest coca-producing region; however, the notorious increase of coca cultivation in the Pacific, Putumayo-Caqueta and Central regions and the decreasing trend since 2005, dropped this region to the fourth place in 2007 and At the same time, the region has received very little support with alternative development programmes. In 2004 and 2005, the department of Meta was the department with the highest level of coca cultivation, but dropped to the sixth place in 2008, because of a continuous decrease of 36% in , 6% in and a dramatic 47% in The department of Meta included 7% of the national coca cultivation area. The sprayed area of coca cultivation decreased from 15,527 in 2007 to 9,057 hectares in 2008 and 7,972 hectares were eradicated manually against 3,768 hectares in Guaviare was the department where coca cultivation first appeared in Colombia at the end of the seventies. Since then, coca cultivation remained important in the department. Though a significant decrease was noted in the past few years, this trend was reversed in 2007 when 9,299 hectares were detected and went back in 2008 with a notorious reduction of 2,670 hectares (-29%) reaching its lowest level ever measured (6,629 hectares). At the same time, aerial spraying increased from 11,000 hectares in 2007 to 13,000 hectares (+18%) while no manual eradication took place in Guaviare accounted for 8% of the national total. The simultaneous lack of the eradication activities along with the important reduction of coca cultivated area, might be explained by the implementation in the Meta-Guaviare region of the government s Consolidation Plan in 2007 lead to strengthen the presence of the state, to recover the population safety and to promote the investments of the private and international sector in licit agricultural production. Among the fifteen national parks surveyed, the National Park of Nukak, located within Guaviare department, had the largest level of coca cultivation within a protected area in 2008 (1,033 hectares). This represented a decrease of 337 hectares (-24%) compared with This Park replaced the National Park Sierra La Macarena as the protected area with the largest area cultivated with coca. Coca fields in Meta Guaviare region. 29
30
 Department 2004 2005 2006 2007 2008 % Change 2007-2008 Vichada 4,692 7,826 5,523 7,218 3,174-56% Arauca 1,552 1,883 1,306 2,116 447-79%")

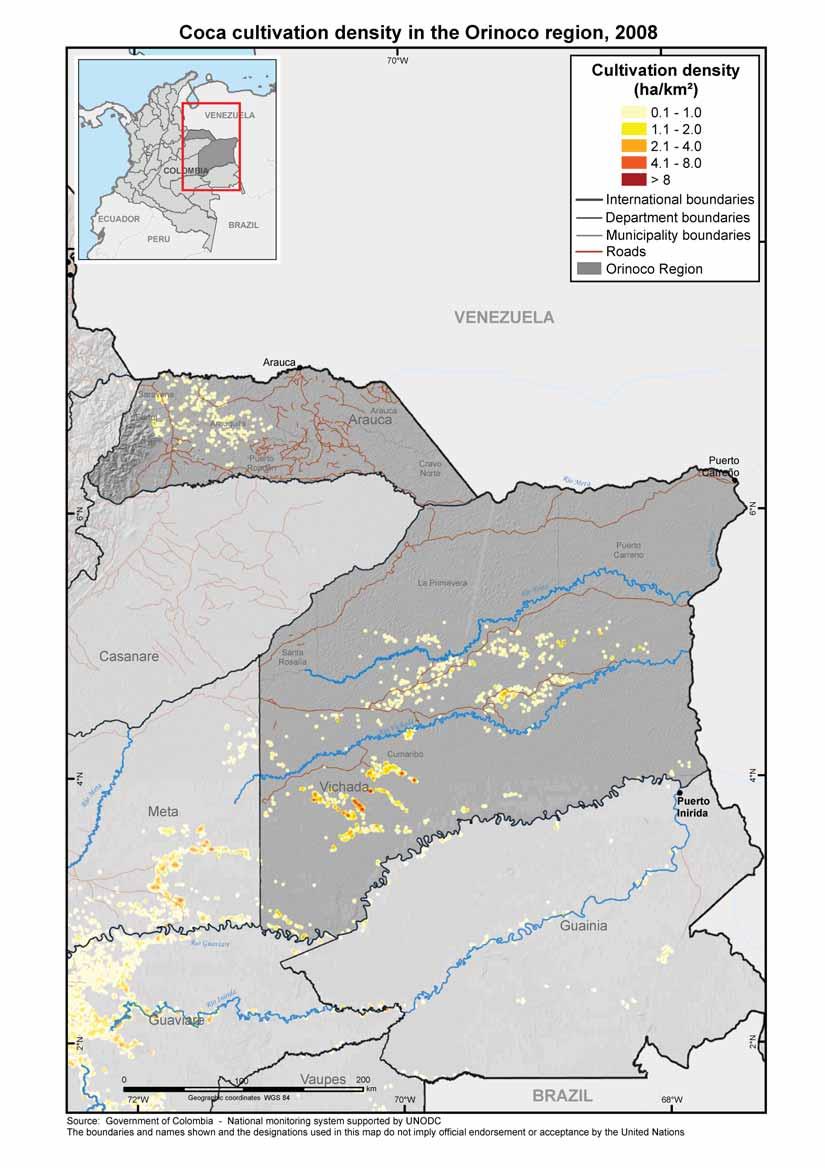
31 Orinoco region Table 11. Coca cultivation in the Orinoco region, (hectares) Department % Change Vichada 4,692 7,826 5,523 7,218 3,174-56% Arauca 1,552 1,883 1,306 2, % Total 6,244 9,709 6,829 9,334 3,621-61% Annual trend +43% +56% -30% +37% -61% In Vichada department, near the Venezuelan border, coca cultivation peaked at 9,200 hectares in 2001 decreasing to 5,523 hectares in 2006, increasing again to 7,218 hectares in 2007 and decreasing again to the level in 2003 with 3,174 hectares in In Vichada, the most important concentration of coca cultivation was found between the Tuparro and Vichada rivers in the centre of the department. The dispersion of coca cultivation in remote parts of the department increases the time flight and cost of aerial spraying. However, after a record of 7,193 hectares of aerial spraying in 2007 it decreased to 5,900 hectares in 2008 but a considerable amount of 7,242 hectares were manually eradicated in 2008 against only 590 hectares reported in Coca cultivation in Arauca was detected for the first time in 2000 with about 1,000 hectares. It went over 2,000 hectares in 2001 and after a decrease in , it went back over 2,000 hectares in 2007 and showed its lowest record of 447 hectares in In 2003, aerial spraying amounted to 12,000 hectares and coca cultivation dropped to 500 hectares in December of that year. However, the coca cultivation increased in the period to 2,116 hectares and decreased again to 447 hectares in 2008 against a decrease of manual eradication from 660 hectares to 106 hectares and aerial spraying from 2,695 hectares to 2,296 hectares. Coca fields in the Orinoco region. 31
32
 Department 2004 2005 2006 2007 2008 % Change 2007-2008 Guainia 721 752 753 623 625 0% Amazonas 783 897 692 541 836 +55% Vaupes 1,084 671")
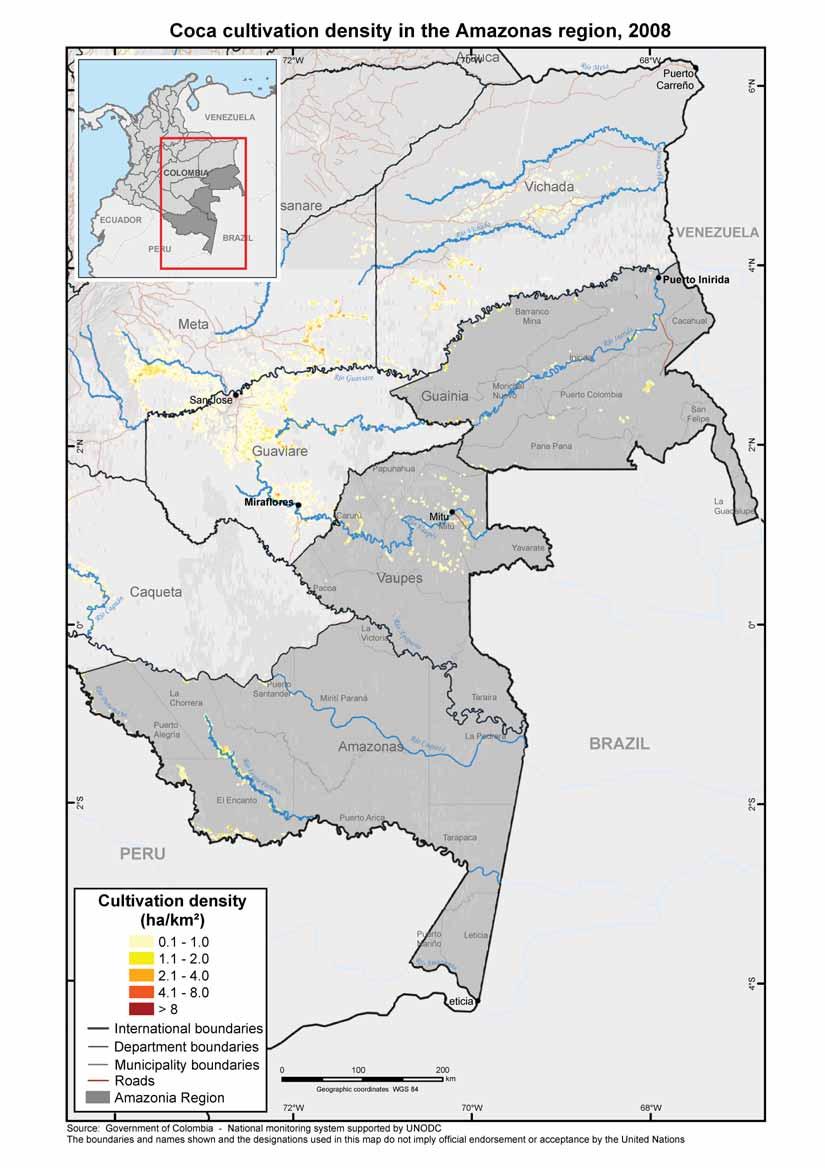
33 Amazonas region Table 12. Coca cultivation in the Amazonas Region, (hectares) Department % Change Guainia % Amazonas % Vaupes 1, % Total 2,588 2,320 1,905 1,471 2, % Annual trend +3% -10% -18% -23% +37% Like the Putumayo-Caqueta region, the departments of Vaupes, Amazonas and Guainia belong to the Amazon basin. Although sharing important similarity with Putumayo and Caqueta, these three departments, referred to as Amazon region, have never been important centres of coca cultivation. This is due to the remoteness of the area, as well as to the lack of airport and road infrastructure linking this region to the rest of the country. Consequently, no aerial spraying of coca cultivation was carried out in 2008 but for the first time, 310 hectares of coca were manually eradicated by the Army and the National Police in the department of Amazonas. Coca cultivation continues the trend of slow decrease since coca cultivation was first observed in Coca field in Amazonas Department 33
34
 Department 2004 2005 2006 2007 2008 % Change 2007-2008 Magdalena 706 213 271 278 391 +41% Guajira 556 329 166 87 160 +84% Total")
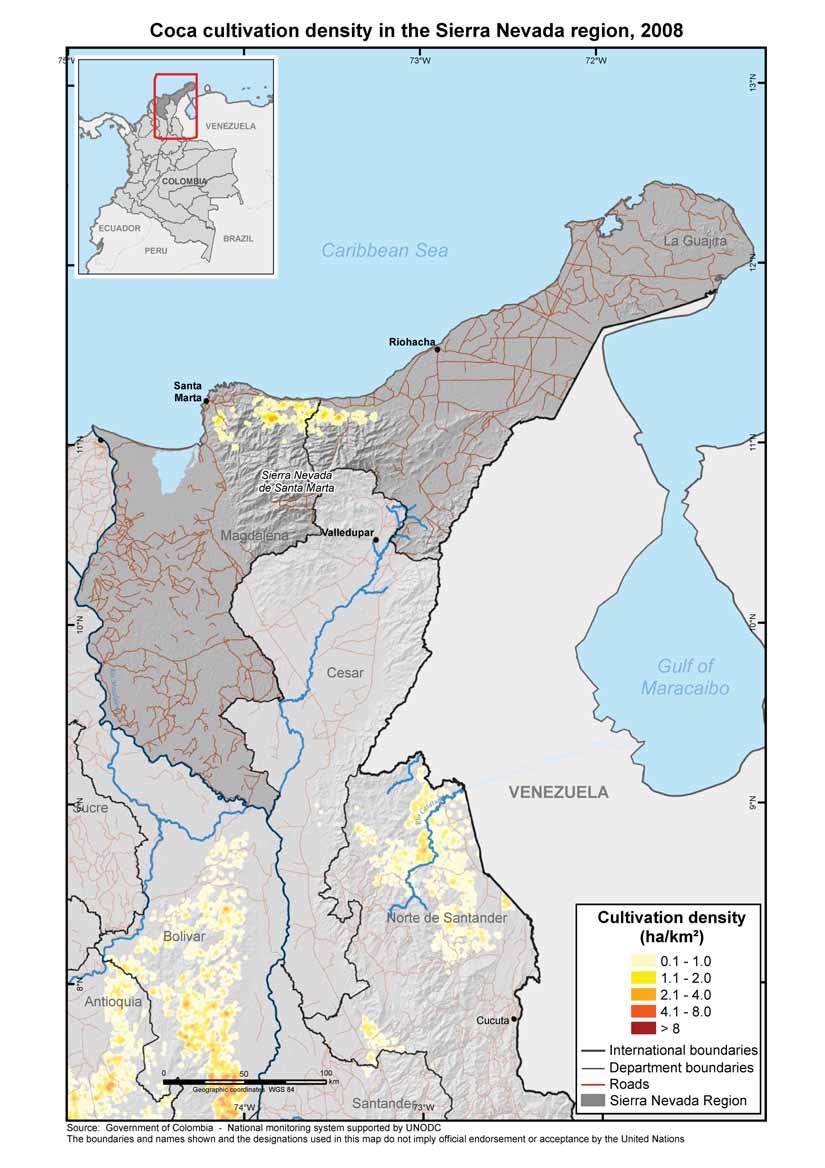
35 Sierra Nevada region Table 13. Coca cultivation in the Sierra Nevada region, (hectares) Department % Change Magdalena % Guajira % Total 1, % Annual trend +66% -57% -19% -16% +51% The Sierra Nevada region, with the departments of Magdalena and Guajira, has never been an important centre of coca cultivation in Colombia. Coca cultivation remained between 500 and 1,300 hectares over the last eight years and started a decreasing trend to reach the lowest level with only 365 hectares in 2007 and increasing to 551 hectares in Coca cultivation remained located mainly in the fringe of lowlands between the high mountains of the Sierra Nevada and the seashore. No aerial spraying activities took place in the region and at the same time manual eradication reached 1,026 hectares in 2008 for an increase of 249 hectares with respect to However, the region is an important area for narco-trafficking activities, in particular for the shipping of drugs to the Caribbean Islands and the United States. For a few years already, the Sierra Nevada region benefited from important aid for alternative development, mainly due to the Sierra Nevada National Park. The region is also an important tourism centre and hosts the Sierra Nevada National Park. The National Park is one of the most important ecological reserves in Latin America, known for its biodiversity and presence of several ancient indigenous cultures. In 2008, coca cultivation amounted to 170 hectares in the Sierra Nevada National Park, an important increase of 81% compared to Coca field in Sierra Nevada region 35

36 Possible areas of new cultivation The survey covered and interpreted 100% of the national territory, including areas previously not known as being coca-growing regions. In doing so it serves as an early warning system to detect and prevent the spread of coca into new areas. In 2008, potential small coca fields have been detected in remote areas outside the established agricultural areas of the departments of the Orinoco and Amazon River basins. Field verification has not been carried out in these areas because the verification of small and isolated patches of coca cultivation was considered too time consuming and too costly. Therefore, the estimate for coca cultivation in these areas is presented as indicative and was not included in the final estimate. The 2008 survey analyzed 14 Landsat images for vegetation having characteristics similar to coca fields. A total of 564 hectares were assessed as possible coca cultivation in new areas. Table 14. Possible coca cultivation in new area, 2008 Department Area (ha) Vaupes 246 Amazonas 172 Boyaca 14 Magdalena 58 Guainia 48 Cesar 23 Vichada 2 Caqueta 1 Total 564 New coca fields in Vaupes department. 36
37
38 2.2 Coca leaf, coca paste and cocaine base production In December 2008 and April 2009, SIMCI with the support of the UNODC and the Colombian Directorate of Narcotics (DNE) conducted a new comprehensive piece of research toward assessing the current annual yield of the fresh coca leaf, identifying the latest agricultural practices associated with coca cultivation, such as extent of the use of pesticides, fertilizers and herbicides as well as estimating conversion rates from fresh coca leaf into cocaine base. Unfortunately, high survey costs and security conditions prevailing in the areas around coca fields (including the presence of illegal armed groups) prevented SIMCI from monitoring the yield every year in all the coca cultivation regions in Colombia. This round of coca leaf survey was carried out in Putumayo-Caqueta 3 and Meta-Guaviare 4. The surveys were composed of two components; the first component involving the harvesting of fresh coca leaf, where fresh coca leaves were harvesting by stripping them from the branches of all plants in each of the random selected plots and their fresh weights on each plot were recorded. The second component was composed of interviews by questionnaire with coca farmers. The survey relied on 210 face to face interviews and 70 actual harvest tests in Putumayo-Caqueta, and 300 face to face interviews and 100 actual harvest tests in Meta-Guaviare. The figures presented herein derive from the field work carried out during the survey, and correspond to the averages found in the questionnaire data collected from the coca farmers and extrapolated to the whole sampling frame under a statistical sampling design 5. The analysis of the collected data in the field by these surveys revealed that with respect to the yields estimated in , there was a significant decline of the amount of coca that could be harvested from the fields in UNODC/SIMCI was able to confirm that with respect to 2005, there was a decrease of 59% in the fresh coca leaf production in Meta-Guaviare and 33% in Putumayo-Caqueta as estimated from the data collected from the interviews with farmers. The estimated annual coca leaf yield in Meta-Guaviare went down from 8,200 kilograms per cultivated hectare/year to 5,100 kilogram per annual cultivated hectare in The estimated annual coca leaf yield in Putumayo-Caqueta changed from 4,600 kilograms per cultivated hectare/year in 2005 to 4,100 kg/ha/year in Table 15. Changes in coca leaf yield Meta-Guaviare and Putumayo-Caqueta, 2008 Region Area (Ha) Number of harvest Number of harvest Coca leaf yield (Tm/ha/year) Coca leaf yield (Tm/ha/year) Meta-Guaviare 12, Putumayo-Caqueta 13, In 2005 and 2008, biomass data from harvesting fresh coca leaf and from interviews was collected. The comparison of interviews data in the region showed a decrease of 8,200 kg/ha/year in 2005 to 5,100 kg/ha/year in The comparison of harvesting data showed a decrease of 9,900 kg/ha/year 3 The survey field work was subcontracted by DNE to Empresa Gestion Rural Consultants, an agricultural research consultant based in Bogota, Colombia. 4 The survey field work was subcontracted by SIMCI to Agricultural Assessments International Company (AAIC), an agricultural research consultant with extensive experience in agricultural surveys in Latin America and South Asia which has been working with UNODC/SIMCI since the beginning of the coca leaf yield surveys in The survey to assess the coca leaf yield in Colombia was conducted using a stratified multistage area frame sampling design. The sampling frame was constructed based on those coca fields identified using satellite images covering the entire country in 2007 and

39 to 5,700 kg/ha/year. The interviews data was used for the calculation of the coca leaf production in Coca cultivation like any other agricultural activity is not exempt of the effects of the environment. However, not only the climate, pest, and diseases could have affected coca leaf yields this year but also the coca bush in Meta-Guaviare faced the challenge of aerial spraying and manual eradication. In Meta-Guaviare, 22,118 hectares cultivated with coca were sprayed in 2008 and 7,982 hectares were eradicated manually against 4,810 hectares in Farmers declared the use of several herbicides, fertilizers and pesticides in order to keep their crops free of a wide variety of competitive plants (including grass and perennial weeds) and pest, as well as to increase the productivity of their crops. Survey data provide evidence that with respect to the 2005 survey in the region under study, there was a significant reduction in the amount of agricultural inputs used by coca farmers to manage the coca fields in From the collected data, it was estimated that in Meta-Guaviare, coca farmers decrease in average as much as 73% the amount of solid fertilizers, pesticides and herbicides and as much as 40% the amount of liquid agricultural inputs. In the northern regions, the use of these agricultural inputs has also been reduced in an average of 60% in its solid form and of 5% in its liquid form. Weeding coca field Figure 4: Use of fertilizers, pesticides and herbicides in liquid and solid form in Meta- Guaviare, ,000 2,500 16,000 2,000 Litters 12,000 8,000 Kilograms 1,500 1,000 4, Fertilizers per ha Pesticides per 1,000 ha Herbicides per 1,000 ha - Fertilizers per ha Pesticides per 1,000 ha Herbicides per 1,000 ha
40 In relation with the age of the plant, it was observed that in 2005, 44% of the coca fields were planted with plants with age between two and four year old, which according to coca farmers, it is the time when plants give its maximum yields. In 2008, 59% of the coca fields were planted with coca bushes older than five years old, which according to coca farmer is the time when there is a steady decline of the leaf production. Table 16. Plant age in Meta-Guaviare, Age %fields Yield 05 Tm/ha/year Less than 1 year % fields Yield 08 Tm/ha/year From 1 to < 2 years From 2 to < 3 years From 3 to < 4 years From 4 to < 5 years Five years and more In terms of coca variety, the survey did not find any significant change in the coca variety used in Meta-Guaviare by the farmers. Most of the farmers used one type (Dulce that could be Erytroxilum coca Lam Var Ipadu) and it is planted alone without some association with licit cultivation or other varieties. During the time of the survey farmers in Meta-Guaviare were asked whether or not they have experienced any loss of a full harvest or of part of it. In 2005, 56% of the coca farmers did not have any loss. The most significant causes of loss of harvest among the affected farmers, was pest and diseases. In the same context, in 2008 it was found that 68% of the coca farmers experienced a loss of a full harvest or of part of it. Table 17. Fields with of loss or reduction of harvest for different reasons in Meta-Guaviare (from interviews), Aspects # fields Percentage #fields Percentage Fields with losses or reduction of harvests 9,978 44% 7,451 68% Fields without losses 12,535 56% 3,487 32% Figure 5: Causes of loss or reduction of harvest, Meta-Guaviare Weather, 18% 2008 Others, 13% Pest and diseases, 53% Others, 4% Weather, 44% Aerial spraying, 25% Pest and diseases, 6% Aerial spraying, 37% 40
41 Coca fields can be harvested several times during the year. The number of times a coca field is harvested may depend on several factors such as weather, agricultural management (change in use/amount of herbicides, pesticides and fertilizers), aerial spraying, manual eradication, and coca variety grown. Furthermore, in some cases, the frequency of harvests is also determined by the coca trade market rather than crop maturity. At the time of the field work, coca farmers in Meta-Guaviare were asked how often they harvest their fields. Based on the interview data, it was estimated that in average the number of days between each harvest was increased from 55 days in 2005 to 67 days in This represents a decrease in the annual number of harvest from 6.6 harvests in 2005 to 5.4 harvest in For the Putumayo-Caqueta region the number of harvests went from 3.9 in 2005 to 4.3 in Table 18. Number of harvest by region, Region /2008 Meta-Guaviare Sur de Bolivar Putumayo-Caqueta Orinoco Pacific Catatumbo Amazonas Sierra Nevada Table 19. Regional coca leaf yields in Colombia, Region Annual coca leaf yield kg/ha/year Lower limit 95% confidence interval (kg/ha/year) Upper limit 95% confidence intervals (kg/ha/year) Meta-Guaviare 1 5,100 4,700 5,600 Putumayo-Caqueta 1 4,100 3,200 5,000 Sur de Bolivar 2 5,700 5,200 6,100 Pacific 3 2,600 2,300 2,900 Orinoco 3 7,100 6,400 7,900 Amazonas 1 4,100 3,200 5,000 Catatumbo 2 4,200 3,900 4,600 Sierra Nevada 2 2,900 2,600 3,100 National average yield 4,200 3,300 5, The coca leaf yield corresponds to the average found in the questionnaire data collected from the coca farmers in The coca leaf yield corresponds to the average found in the questionnaire data collected from the coca farmers in The coca leaf yield corresponds to the average found in the questionnaire data collected from the biomass in

42 Figure 6: Regional average annual number of harvest, framed within their confidence intervals in ,500 8,500 Kg/Hectares/year 7,500 6,500 5,500 4,500 3,500 2,500 5,100 4,100 5,700 2,600 7,100 4,100 4,200 2,900 1, Meta- Guaviare Putumayo- Caqueta Sur de Bolivar Pacific Orinoco Amazonas Catatumbo Sierra Nevada Traditional use of the coca leaf is marginal in Colombia and virtually all coca leaf production is destined for cocaine production. There are various ways to produce cocaine: The typical process is that leaves are processed into coca paste, then into cocaine base, then into cocaine hydrochloride. The farmers can either sell the coca leaves, or process these leaves into coca paste or base. In Catatumbo and Sierra Nevada, for instance, most of the coca farmers sell the coca. The last step, the processing of the cocaine base into cocaine hydrochloride is not carried out by farmers but in clandestine laboratories. Coca paste is the first product obtained in the process of alkaloid extraction from coca leaves using sulphuric acid and combustibles. Therefore, it becomes a cocaine sulphate with a high content of organic remnants, pigments, tannin, and other chemical substances. Cocaine base is obtained by dissolving the cocaine sulphate in an acid and adding an oxidant agent, potassium permanganate being the oxidant most often used and then adding a base. The resulting substance is precipitated and filtered. The coca leaf yield survey in Catatumbo and Sierra Nevada regions revealed that most of the farmers sell directly the coca leaves (86% and 91% respectively), while in Meta-Guaviare, almost 8 out of 10 farmers process the leaf into coca paste without getting involved in any further process with the leaf. This could be explained because of the high prices of the coca leaf in the regions. On the other hand, two thirds of the farmers in South of Bolivar region process by themselves the coca leaf. At the national level the division of labour among coca farmers is as follows: 39% of the farmers sell directly the coca leaves without any process most of the times at the farm; 24% of the farmers process the coca leaf into coca paste; whereas the rest of farmers, 37%, process their leaves into cocaine base. As it can be seen in the table below, about 61% of the farmers in Colombia opt to get involved in the transformation process in order to improve their profits. Manual labour in coca field 42
43 Table 20. Division of labour among coca producers, 2008 % of farmers % of farmers directly selling processing coca Region fresh coca leaves into coca leaves paste % of farmers processing coca leaves into cocaine base Sierra Nevada 91% 4% 5% Catatumbo 86% 13% 1% Pacific 68% 31% 1% Putumayo-Caqueta 32% 1% 66% Sur de Bolivar 31% 5% 64% Orinoco 15% - 85% Meta Guaviare 22% 78% - All regions 39% 24% 37% Production of leaf 131,600 79, ,043 During the survey, the farmers who processed their coca leaves were asked about the amount of coca leaves and ingredients used, and the amount of final product obtained. The distinction between paste and base is not easy to draw because the terms are often misused by the farmers themselves. In order to distinguish between these two products, it was decided to refer to cocaine base when the farmers reported the use of permanganate potassium for processing their leaves, and coca paste when the farmers did not report the use of these products. Figure 7: Proportion of farmers processing and not processing coca leaves in % 90% 80% 70% 60% 50% 40% 30% 20% 10% 0% Sierra Nevada Catatumbo Pacific Putumayo- Caqueta Sur de Bolivar Orinoco Meta Guaviare % of farmers not producing paste or base % farmers producing paste % farmers producing base 43


44 Table 21. Average kg of coca paste or base obtained from one metric ton of coca leaf, Avg kg of coca paste per Avg kg of cocaine base per Region metric tons of coca leaf metric tons of coca leaf Putumayo-Caqueta Sur de Bolivar Pacific Meta -Guaviare Sierra Nevada Catatumbo Orinoco According to the questionnaire interviews, the cocaine extraction process is relatively similar in all regions. Producers prefer to use chemical substances which are accessible in public markets, albeit with some variations depending on the region. Gasoline is reported as the chemical product most used in the production process of coca paste or cocaine base. Based on the data captured during the surveys, it is estimated that the amount of fuel used to process the cocaine base in 2008 amounted to approx. 71 million of gallons taking into account the recycling. Processing of coca leaves to coca paste 7 The Orinoco farmers process only cocaine base. 44
45
46 Figure 8: Regional average of coca paste and cocaine base obtained from one metric ton of fresh coca leave, Kg Putumayo- Caqueta Sur de Bolivar Pacific Meta -Guaviare Sierra Nevada Catatumbo Orinoco 0 Avg Kg of cocaine paste per ton of coca leaf Avg Kg of cocaine base per ton of coca leaf Combining all the responses from the questionnaires, it is estimated that one arroba 8 of fresh coca leaf could produce up to 18 to 20 grams of cocaine base. Thus, one metric ton of fresh coca leaf is equivalent in average to 1.5 kg of coca paste and 1.4 kg of cocaine base. Putumayo-Caqueta continues being the region with the highest efficiency in the extraction process, whereas Sierra Nevada and Catatumbo show the lowest performance in the extraction process. Potential base and cocaine production The latest coca leaf yield surveys carried between 2005 and 2008 have focused on obtaining data not only on the yield of the fresh coca leaf but also on the transformation process from fresh coca leaf to coca paste or cocaine base. The data on annual coca leaf yield and the conversion rates of coca leaves into coca paste and cocaine base were combined with the average area area under coca cultivation estimates to determine the total productions of coca leaf, coca paste and cocaine base. The production of coca leaf in Putumayo-Caqueta and Meta-Guaviare was calculated by applying the 2008 findings; the production of fresh coca leaf in Sur de Bolivar, Catatumbo and Sierra Nevada was calculated by using the 2007 survey findings, while the production of fresh coca leaf in Pacific and Orinoco 9 was calculated by the 2005 survey findings. The potential production of fresh coca leaf was estimated at 389,571 metric tons. Assuming 57% moisture content, this was equivalent to a total production of 167,516 metric tons of sun-dried coca leaf. 8 The word arroba has its origin in Arabic, which means the fourth part (of a quintal). Arroba is widely used in Colombia, Peru and other countries as weight unit. Arroba was a Spanish and Portuguese unit of weight, mass or volume. In weight it is equal to about 25 pounds, or 12.5 kilograms in Colombia. 9 A new survey is foreseen to be carried out this fall to update coca leaf yields in Pacific and Orinoco regions. 46
47 Table 22. Regional coca leaf yields and production in Colombia, 2008 Region Annual coca leaf yield kg/ha/year Coca leaf production metric tons Meta-Guaviare 5,100 81,200 Putumayo-Caqueta 4,100 71,900 Sur de Bolivar 5,700 99,300 Pacific 2,600 72,600 Orinoco 7,100 46,000 Amazonas 4,100 7,200 Catatumbo 4,200 10,100 Sierra Nevada 2,900 1,300 Total coca leaf production 4, ,571 Out of the total production of 389,571 mt of coca leaf in 2008, about 93,052 metric tons were processed into coca paste. Using the conversion rate of coca paste for each region, the total coca paste production from farmers was estimated at 125 mt. The rest of the farmers either processed directly into cocaine base, or sell their production as leaf, corresponding to a total of 296,519 mt. Assuming that the production of coca leaf sell directly by the farmers was processed outside the farm into cocaine base at the same rate as within the farm, the total amount of cocaine base was estimated at 429 mt. Overall, either produced from coca paste or directly from coca leaves, the total production of cocaine base in Colombia in 2008 was estimated at 554 metric tons. To determine conversion rates from cocaine base to cocaine hydrochloride, UNODC relied on external sources. So far, UNODC did not collect any data to estimate the efficiency of these clandestine laboratories nor on the quantity of cocaine hydrochloride that can be produced from coca paste or cocaine base. In addition to the technical difficulties to obtain these data, this kind of survey is also complicated by the existence of several techniques to produce cocaine hydrochloride, and various purity level of the end-product. Therefore, the UNODC calculation for cocaine production in 2008 relied on its own estimates of cocaine base and on data obtained by the United States Operation Breakthrough regarding the conversion rates from cocaine base to cocaine hydrochloride and the resulting purity level of cocaine hydrochloride for conversion into equivalent of pure cocaine production. US Operation Breakthrough mentioned a 1:1 conversion rate from cocaine base to cocaine hydrochloride. However, this was obtained from laboratories especially set up for this kind of survey, and thus this conversion rate is likely to correspond to ideal circumstances not always obtained in reality. The same source also communicated to UNODC that cocaine base contained about 75% of pure cocaine alkaloid and the cocaine hydrochloride contained about 85% of pure cocaine alkaloid. From this data, UNODC derived a 1:0.91 ratio to convert cocaine base to cocaine hydrochloride. This ratio was deemed to apply better to the cocaine base production which corresponded to cocaine base obtained from farmers not working in ideal conditions. Based on this data, the 554 metric tons of cocaine base were equivalent to 506 metric tons of cocaine hydrochloride and 430 of pure cocaine. 47
48 Table 23. Regional cocaine base, cocaine hydrochloride and pure cocaine production in Colombia, Region Cocaine base (mt) Cocaine hydrochloride (mt) Pure Cocaine (mt)* Meta-Guaviare Putumayo-Caqueta Sur de Bolivar Orinoco Pacific Amazonas Catatumbo Sierra Nevada Total Figure 9: Cocaine production in Colombia, (metric tons) Metric ton Production Note: Cocaine production estimates for 2004 and later is not directly comparable with previous years. In 2008, at the global level, the cocaine production in Colombia represented 51% of the potential cocaine production estimated in 845 metric tons. 48
49 Figure 10: Global cocaine production (in metric tons) 1,200 1,000 Metric ton Source: WDR Table 24. Global potential cocaine production, in metric tons % Change % of 2007 Bolivia % 13% Peru % 36% Colombia % 51% Total % 100% Source: World Drug Report Bolivia Colombia Peru 49
50 2.3 COCA PRICES Coca leaf, cocaine base and cocaine prices Over the past four years coca leaf prices and coca paste prices remained without significant changes in Colombia. In 2008, in local currency (Colombian peso, COP), coca leaf prices remained at an average of COP 2,270/kg whereas coca paste prices remained at an average of COP 1,878,000/kg. In US dollar equivalent, coca leaf price remained at US$/kg 1.10 and coca paste price remained at $963 US/kg. Cocaine prices 10 in US dollars have increased by 7% from an average of US$2,198/kg to US$2,348/kg in 2008; in local currency, cocaine prices remained unchanged at COP 4.6 million pesos. The changes in prices and purity of drugs are important indicators for the availability of drugs in the market. In 2005, UNODC/SIMCI started the periodic and systematic collection of price data in the first production stages (coca leaf, coca paste and cocaine base). This information is completed with data from the Presidential management against Illicit Crops (PCI). The prices of cocaine, cocaine base, morphine and heroin were provided by DIRAN and were collected by intelligence services in different cities across the country. Most of peasants sell coca paste, which they have produced in small kitchen located in the farm. The processing does not require vast know-how and high level of technology, therefore, in 85% of the cases the peasant does the processing by himself, and only the remaining proportion of farmers hire a cook or chemist to do the processing. The technical know-how was brought to the farmers during the 90 s by drug-traffickers to facilitate and to increase the commercialization of cocaine. The prices of coca in different processing stages (coca leaves and coca paste) are influenced by the aerial spraying and manual eradication, interdiction and the intervention of illegal armed groups, who often impose their prices and conditions on the farmers. In general, it was observed that repressive interventions of the national army have a significant decreasing impact on the prices due to the poor availability of sellers and buyers affect production. On the other hand, extensive aerial spraying or problems due to adverse climate, pests and diseases could have an increasing impact on the prices. Table 25. Average prices of coca leaf and its derivatives, Product US$/kg* 000 COL$/kg US$/kg* 000 COL$/k g US$/kg* 000 COL$/k g US$/kg* 000 COL$/kg Cocaine 1,860 4,315 1,762 4,155 2,198 4,567 2,348 4,580 Cocaine base 1,090 2,532 1,038 2,447 1,326 2,752 1,450 2,825 Coca paste 910 2, , , ,878 Coca leaf Source: SIMCI, PCI, DIRAN * It must be noticed that the Colombian peso increased its value against the US dollar in the period Coca leaf prices In Colombia, coca leaf is traded as fresh, whereas in Peru and Bolivia, coca leaf is traded as sundried. Converted in equivalent sun-dried coca leaf (assuming a moisture loss of 57% from fresh coca leaf to sun-dried coca leaf, as established from the 2004 UNODC survey on coca leaf yield in Peru), coca leaf price in Colombia in 2008 was estimated at $2,50 US/kg, which is about the price of sundried coca leaf in Peru ($ 3,40 US/kg) and lower that the prices registered this year in Bolivia ($ 5,50 US/kg). 10 Cocaine prices are collected by DIRAN at the wholesale brokers in the country's major cities (U.S. $ 2,348). In comparison, the latest available data on the price of cocaine on the streets of Europe had an average of $ 96,000/kg and United States of $ 120,000/kg in
51 Figure 11: Prices of sun-dried coca leaf in Andean region 8,0 7,0 6,0 5,0 US$/Kg 4,0 3,0 2,0 1,0 0,0 Ene-06 Abr-06 Jul-06 Oct-06 Ene-07 Abr-07 Jul-07 Oct-07 Ene-08 Abr-08 Jul-08 Oct Source: SIMCI/UNODC Peru, Bolivia and Colombia Bolivia (Chapare region) Peru (National) Colombia (National) Fresh coca leaf prices between 2005 and 2008 remained relatively stable at an average of $1,10 US/kg dollars or COP 2,350/kg, At regional level, prices are higher in Pacific (Nariño) and Putumayo, Caqueta, with averages of COP 2,690/kg ($ 1,40 US/kg) and COP 2,344/kg ($ 1,20 US/kg) respectively. The high price in these regions where the coca leaf is trade may be due to the effect of the manual eradication and the impact of the pyramid money scam. Coca leaf and coca paste is traded on the same farmer premises, although in some regions the police presence of the police force farmers to transport the merchandise to the nearest trading town. Coca paste prices In Colombia and Peru, the coca paste prices have been relatively stable in recent years. However, between 2004 and 2008, the coca paste price in Colombia has been consistently higher than in Peru. In 2008 the average price in Colombia was $963 US/kg and in Colombia of $ 732US/kg. Figure 12: Coca paste price in Colombia and Peru, US$ Jan04 May-04 Sep-04 Jan05 May-05 Sep-05 Jan 06 May-06 Sep-06 Jan07 May-07 Sep-07 Jan 08 May-08 Sep-08 Colombia (US$/kg) Peru (US$/kg) Source: SIMCI Colombia-Peru 51
52 The coca paste is produced by the farmers in Colombia. Therefore it is a good indicator to measure the fluctuations in the market. However, prices are set by illegal armed groups as well as payment conditions. Coca paste prices have been varying between 2005 and 2008 at an average of $ 2 million Colombian pesos (equivalent to US$ 924 /kg). In 2008, prices fell by 4% over the previous year, from COP 1,960,000/kg in 2007 to COP 1,878,000/kg in 2008, In US dollars, the price increased by 2%, from US$ 943 /kg in 2007 to US$ 963 /kg in At regional level, the trend was steady during the calendar year as shown in the table below, with a broken point in July attributed to the presence of security forces which affects the markets. Table 26. Average monthly coca paste price in Colombia (en '000 COL$/kg) per region,2008 Weighted national Putumayo- Month Central Pacific Meta-Guaviare average Caqueta January 2,033 2,050 2,300 1,781 2,000 February 1,968 2,080 2,000 1,740 2,050 March 1,923 2,060 1,775 1,808 2,050 April 1,852 2,127 1,400 1,831 2,050 May 1,868 2,120 1,400 1,850 2,100 June 1,789-1,425 1,830 2,113 July 1,522-1,200 1,667 1,700 August 1,987 2,200 1,800-1,960 September 1,813 1,765 1,625 1,900 1,960 October 1,888 2,050 1,750 1,886 1,867 November 1,910-1,800 1,931 2,000 December 1,982-2,100 1,929 1,900 Average COP 1,878 2,057 1,715 1,832 1,979 Average US$ 963 1, ,020 Source: UNODC/SIMCI y PCI Figure 13: Average monthly coca paste prices in Colombia, August 1999 March 2009 ( 000COL$) 2,600 2,400 2,200 2,000 1,800 1,600 1,400 1,200 Aug-99 Jan-01 May-02 Oct-03 Feb-05 Jul-06 Nov-07 Mar-09 52
53 Cocaine base prices The collection of prices data and their analysis is complicated by the absence of standard in naming the products, and in the absence of indications on the quality of the products. This is the case for cocaine base and coca paste, which can easily be confused. However, the data on cocaine base, albeit less frequently reported than the data on coca paste, confirmed that cocaine base is a more refined product than coca paste, and that both products can be traded. There is a difference in price between coca paste and cocaine base due to the complexity and the chemicals added in the production of the latter. The average price of cocaine base in 2008 was $2,825,000/kg (US$ 1,438/kg an increase of 9% with respect to last year). The highest prices were recorded in the Central region and Pacific. Figure 14: Comparison of coca paste prices and cocaine base by region (COP/Kg), ,500,000 3,000,000 2,500,000 COP$/Kg 2,000,000 1,500,000 1,000, ,000 1,877,855 2,824,700 2,056,500 2,764,918 1,714,583 3,070,741 2,568,750 1,979,097 2,467,857 1,832,036 - Average Central Pacific Orinoco Meta-Guaviare Putumayo- Caqueta Coca paste Cocaine base *Orinoco does not have information on coca paste because the coca is immediately processed into cocaine base. In 2007, cocaine base prices for Putumayo-Caqueta were not available. Cocaine prices Because of the criminal nature of the trade, cocaine prices are less easily collected than prices of coca paste or coca leaf. In Colombia, prices of cocaine hydrochloride are collected by DIRAN (the Anti-Narcotics Police), and refer to wholesale prices in the main cities. Prices may be affected by factors such as supply, anti-drug control measures and purity levels. In connection with the supply, cocaine production has decreased by 28% this year as compared to The estimated potential cocaine production in 2008 is 430 metric tons after five years of relatively stable production. Although a significant impact on prices is not yet visible; in terms of seizures, after the all-time high recorded in 2004 and 2005 with 149 and 173 tons respectively, seizures in the 2008 increase to 198 metric tons. The purity level was not investigated yet in this report; the information comes from the seizures of the US Government who estimates the purity of the Colombian cocaine in 85% (2007). The table below presents the annual averages of cocaine prices since The prices are presented both in Colombian Pesos (COP) and US$ dollars. 53
54 Table 27. Cocaine HCl price in Colombia Year '000 COP/kg US$/kg Potential production of cocaine mt Seizures of cocaine mt , ,020 1, ,377 1, ,488 1, ,232 1, ,762 1, ,769 1, ,101 1, ,800 1, ,100 1, ,599 1, ,389 1, ,500 1, ,600 1, ,315 1, ,155 1, ,567 2, ,580 2, Source: DIRAN for all prices, SIMCI cocaine production and DNE for seizures of cocaine, The graphic below presents the annual averages of cocaine prices since 1991 as constant price to correct for the inflation. Figure 15: Constant prices of cocaine in Colombia (2008=100), ,000 2,800 COP$ 7,000 6,000 5,000 4,000 3,000 2,000 1,000 2,600 2,400 2,200 2,000 1,800 1,600 1,400 1,200 US$ ,000 Constant prices(2008=100, COP/kg) Constant prices (2008=100, US$/kg) 54
55 Income per hectare The data from the monthly survey on prices in Colombia combined with the data from the coca leaf yield survey and cost of production survey, enabled UNODC/SIMCI to calculate a theoretical income from the sale of coca leaf, coca paste and cocaine base. The differences between these incomes give an indication of the value-added if farmers produce coca paste and cocaine base. The table below shows a definite increase in the value added at each step of the processing. The valueadded of cocaine base (95%), as final product that can be produced by the farmers explains why 37% of the coca leaf production was transformed into cocaine base by the farmers, However, the 2007 survey revealed that in some regions such as Catatumbo, Sierra Nevada and Pacific) some farmers sell directly coca leaf without any further process. Table 28. Potential annual gross income per hectare of coca cultivation for different derivatives of coca leaf in 2008 Average annual Annual income Value-added Annual yield Derivatives price in from coca leaf kg/ha US$/kg US$/hectare % Coca leaf 4,200 1,1 4,620 - Coca paste ,360 38% Cocaine base 6.2 1,450 8,990 95% Based on the total production of each item sold by the farmers and the respective prices in 2008, the total farm-gate income value resulting from coca cultivation was estimated at about US$ 623 million. This value does not take into account the farmers production costs, such as cost of herbicides, pesticides, fertilizers and labour wages. Table 29. Value of the production of coca leaf and its derivatives at farm-gate level, 2008 Product Kg US$/kg US$ value Coca leaf 140,589, ,648,000 Coca paste 142, ,746,000 Cocaine base 229,000 1, ,050,000 Rounded total farm-gate value 623,444,000 The total farm-gate value of production of coca leaf and its derivatives corresponded to 0.3% of the 2008 GDP in Colombia of US$ 242 billion according to DANE (provisional data). In 2008, the total farm-gate value of coca cultivation also represented 3% of the agricultural GDP in Colombia. The coca leaf yield survey also enabled UNODC to collect data on the average area of coca cultivated per family. It was found that on average, a household cultivates about 1.2 hectares of coca bush for a total area under coca cultivation of 80,953 hectares in The number of family involved in coca cultivation was estimated at 59,300 or 236,000 persons without floating population. 55
56 Figure 16: Cost of coca leaf derivatives for one kilogram of cocaine, , , , , ,000 96,000 90,000 80,000 US$ 70,000 60,000 55,958 50,000 40,000 31,000 30,000 20,000 10, ,525 2,348 - Coca leaf in Colombia Cocaine base in Colombia Cocaine in Colombia Cocaine in USA Cocaine in Europe Cocaine USA Streets Cocaine Europe Streets Source: SIMCI, DIRAN, World drug report and DEA Table 30. Number of families involved in coca cultivation in Colombia in 2008 Coca Persons Hectares Number of Region cultivation per family per family families (hectares) Number of people Meta-Guaviare* 12, ,021 42,088 Sur de Bolivar* 15, ,937 31,177 Putumayo-Caqueta 13, ,348 27,555 Orinoco 3, ,500 11,000 Pacific 29, , ,160 Amazonas 2, ,100 7,875 Catatumbo* 2, ,968 7,472 Sierra Nevada* ,020 All regions 80, , ,347 * Includes households and people who live out of the farm. In this way, US$623 million evenly distributed among 59,328 families represented an annual gross income per family of US$ 10,508. For a total of 238,347 people in these families, this was equivalent to an annual per capita gross income of US$ 2,616 while the national per capita gross income is approximately US$ 5,000. The gross income value does not take into account the production costs, such as cost of herbicides, pesticides, fertilizers and labour wages. 56
57 2.4 OPIUM POPPY CULTIVATION Opium poppy in Colombia is mainly being cultivated on mountain sides in the south-west, especially in the departments of Cauca, Nariño, Huila and Tolima and in minor extensions in Cesar, Caqueta and Guajira. Farmers cultivate opium poppy at an altitude ranging between 1,700 to 3,000 meters, in small fields, interspersed with licit crops. According with the Colombian Anti-Narcotics Police - DIRAN- (UNODC does not monitor opium poppy cultivation in Colombia), the opium poppy cultivation is being reducing its extension, and after a short boom of to 7,500 hectares in 1993, is showing in 2008 its minimum record of 394 hectares. Table 31. Opium poppy cultivation by department in Colombia, (hectares) Department % Change % 2008 total Cauca Nariño Tolima 1,359 1, Huila 636 1, Cesar Caqueta La Guajira Caldas Total 4,026 3,950 1,950 1, % Source: DIRAN (by aerial reconnaissance) Figure 17: Opium poppy cultivation by department in Colombia, ,500 1,200 Hectares Cauca Nariño Tolima Huila Cesar Caqueta La Guajira
58 Table 32. Global opium poppy cultivation, (hectares) Afghanistan 82,171 7,606 74,100 80, , , , , ,000 Myanmar 108, ,000 81,400 62,200 44,200 32,800 21,500 27,700 28,500 Laos 19,052 17,255 14,000 12,000 6,600 1,800 2,500 1,500 1,600 Pakistan ,500 2,438 1,545 1,701 1,909 Colombia 6,500 4,300 4,153 4,126 3,950 1,950 1, México 1,900 4,400 2,700 4,800 3,500 3,300 5,000 6,900 n.a. Others n.a. Total 222, , , , , , , , ,403 Source: UNDOC, WDR, 2008 Figure 18: Global opium poppy cultivation, (hectares) 250, , Hectares 150, , , The extent of opium poppy cultivation in 2008 represented a 45% decrease as compared to the opium poppy cultivation in Opium poppy cultivation in Colombia represents only 0.2% of the world opium poppy cultivation in 2008 and 0.1% of the production of latex. For the sixth consecutive year, most of the opium poppy cultivation takes place in Afghanistan, accounting for 83% of the global area under opium poppy cultivation and accounting for 94% of the world opium production. Opium Latex and Heroin Production Afganistan Myanmar Colombia Others In Colombia, opium is harvested in the form of latex. In Asia instead opium is harvested as a denser gum. In Colombia, opium poppy cultivation is confined to the mountainous areas because it requires low temperatures at some stages in the growth cycle. Opium poppy is therefore not found in association with coca cultivation, which is located in low lands. According to the US studies, opium poppy fields yield an average of 24 kilograms of opium latex (equivalent to 8 kilograms of dried opium) are required to produce 1 kg. of pure heroine. Colombia has two harvests per year, with the exception of Nariño with only one harvest per year. The yields of the main opium poppy regions are: Nariño: 24.6 kg/ha/harvest Serranía de Perija: 18.4 kg/ha/ harvest Cauca Oriental: 12.3 kg/ha/ harvest Huila Occidental: 13.1 kg/ha/ harvest. 58
59 The total potential heroin production in Colombia would amount to about 10.3 mt of dried opium which produces 1.3 metric tons of heroin in 2008 representing 0.1% of the world total production. Opium Latex and Heroin Prices Table 33. Monthly opium latex, morphine and heroin prices, 2008 ('000 COP/kg) Opium latex Morphine Heroin Month US$/kg 000 COP/kg US$/kg COP/kg COP/kg US$/kg January ,292 7,719 20,656 10,427 February ,125 7,948 19,544 10,270 March ,982 7,029 20,370 11,029 April ,500 5,290 11,500 6,403 May ,500 5,906 13,500 7,593 June ,542 8,494 18,307 10,693 July ,500 10,937 23,666 13,273 August ,000 8,134 19,500 10,575 September ,021 6,303 18,900 9,148 October ,133 7,485 22,856 9,985 November ,208 6,530 22,055 9,470 December ,000 6,658 23,750 10,542 Annual Average ,400 7,369 19,550 9,950 Source: SIMCI and PCI for latex, DIRAN for morphine and heroine. Despite of the decline in opium poppy cultivation in Colombia, prices of opium latex remain relatively stable at around 318 US$ per kilogram, just +11% as compared to 2007; whereas prices of heroin went down from an average price of 10,780 US$ per kilogram in 2007 to 9,950 US$ per kilogram in 2008 (-8%). Table 34. Annual average prices of opium latex, morphine and heroin % Change Product 000 US$/k US$/k US$/kg US$/kg US$/kg COP/k g COP/kg COP/kg COP/kg COP/kg g g Opium latex Morphine 6,204 14,401 8,045 18,969 8,022 16,630 7,369 14, Heroin 9,070 21,051 9,992 23,562 10,780 22,294 9,950 19, Source: DIRAN, SIMCI and PCI for latex 59
60 Figure 19: Opium latex prices in Colombia, by month ('000 COP/kg and US$/kg) 1, '000COL$/Kg US$/Kg Jan-02 Jul-02 Jan-03 Jul-03 Jan-04 Jul-04 Jan-05 Jul-05 Jan-06 Jul-06 Jan-07 Jul-07 Jan-08 Jul-08 - COP$/Kg US$/Kg 60

61 2.5 RELATED STUDIES AND RESEARCH Economical structure of the agricultural production units in coca influence areas. The study has been conducted by the SIMCI Project in coordination with PCI-Accion Social-, to identify the reasons for which peasants cultivate coca bush. The first survey was carried out in 2008, on the northern region. A second survey is expected to cover the rest of the country in Even though coca cultivation is very dynamic, the regions where coca is cultivated remain relatively stable. From a group of peasants living under similar social, political, cultural and environmental conditions, there are some that grow coca (UPAC) 11 next to other that do not grow it (UPA) 12. The survey consisted in440 interviews to coca growers and non-growers, to find out about their living conditions; i.e. land tenancy and land use and distribution, sources of income, costs, expenses and profitability of the production units-upa and UPAC-. The main findings of the survey are: The costs associated to accessibility in the coca region are higher than those in the licit agriculture regions. The environmental offer in the coca region is underused and there are no incentives for licit agriculture. The vegetation in the Production Units shows 67% of grass lands and small shrubs, 19% of forest and only 7% of licit crops. A low percentage of peasants grow coca at an average of 1.3 hectares per production unit. Coca region landscape Different studies coincide in that the high income generated by coca cultivation produces stability in the coca region; the current study is emphatic showing that the net income is not significantly higher for coca growers. The Productive Unit that sells coca leaves receives daily net income per capita of approx US$ 1. Other agricultural products may reach relatively similar profits or even higher. Rather, the net income of those coca growers who process coca leaf into coca paste or cocaine base is higher. Despite the increase of the production costs, the prices of coca leaf per kilogram (US$ 1) and that of paste (US$ 900/kg) have remained stable in the last four years. Table 35. Annual net income for coca leaf selling Chemical Gross Region Unit substances income costs South Bolivar Northwest of Labour costs Transportation costs Net income COP$ 8,208,000 1,223,000 1,668,500 60,000 5,256,500 US$ 4, ,628 COP$ 8,005,200 2,577,500 2,585, ,400 2,640,300 US$ 4,000 1,289 1, , UPAC: Agricultural Production Unit with coca crops 12 UPA: Agricultural Production Unit without coca crops though in a coca region 61

62 Table 36. Annual net income with coca leaf processing Region Unit Gross income South of Bolivar Northwest Chemical substances costs Net income COP$ 17,236,800 5,047,600 9,237,700 US$ 8,618 2,524 4,619 COP$ 15,403,248 2,251,780 7,786,633 US$ 7,700 1,126 3,893 The most common products cultivated by peasants in the area under study are bitter banana and yucca. Peasants mostly live out of day-wages, including that derived from coca cropping. The reasons behind farmers decide to plant coca is not necessarily profits. Coca cultivation has comparative advantages include better information on market and price and accepted marketing rules including the purchase directly at the Production Units. Bitter banana Crops 62
63
64 2.6 ILLICIT CROPS AND ALTERNATIVE DEVELOPMENT Alternative development programmes In 1985, alternative development projects started in Colombia with the aim to substitute illicit crops and to complement spraying and eradication activities. The first department was Cauca followed by Guaviare, Caqueta and Putumayo in The Productive Projects Programme is run by Social Action-PCI- and looks forward through the encouragement and support for agricultural and forestry activities that the coca growers abandon illicit activities. Investments come from the Colombian Government and international cooperation resources. The reported data for 2008 refers only to the investments from Accion Social and PCI. USAID investments were included in 2007 Coca Survey and are presently been carrying out. The investment shown in this table corresponds to Table 37. Coca and opium poppy cultivation, aerial spraying and alternative development budget Department Coca Opium poppy Budget cultivation cultivation 2008 ongoing 2008 (hectares) COP (hectares) Nariño 19, ,173,614,257 Putumayo 9, ,497,400 Guaviare 6, ,000,000 Antioquia 6,096-3,037,371,130 Bolivar 5,847-1,380,827,490 Boyaca ,948,160 Cauca 5, ,800,000 Caqueta 4, ,948,000 Vichada 3, Norte de Santander 2,886-1,729,337,810 Choco 2,794-1,583,797,079 Valle del Cauca 2, Santander 1,791-1,029,865,165 Cordoba 1, ,998,000 Amazonas Guainia Vaupes Arauca Magdalena Caldas La Guajira Cundinamarca ,348,160 Meta 5, ,429,935 Cesar Huila Tolima ,789,981 Total 80, ,555,572,567 Sources: PCI- Social Action, USAID, SIMCI for coca area and DIRAN for opium poppy area. The overall budget of ongoing productive projects in 2008 has reached an amount of COP 17,500 million from national contributions: Accion Social-PCI. The northern region of the country (Norte de Santander, Antioquia, Santander, Bolivar and Cordoba departments) obtained about 45% of the 64


65 total budget of ongoing projects, though the coca cultivated area increased in 2008 to 23% of the national total. In the Pacific Region the investment represented 30% of national budget having 37% of the coca cultivated while 7% was invested in the Putumayo-Caqueta Region who shows 17% of total coca cultivation. The overall investment is mainly lead to finance cocoa, rubber tree, coffee, palm and forestry projects. These five items represent 88% of total national investment. Figure 20: Ongoing projects,2008 Cocoa 41% Others 12% Coffee 14% Palm 5% Forestry 10% Rubber tree 18% Women working in Iraca palm handcraft 65
66
67 Coca cultivation and the Forest Warden Families Programme Starting in 2003 UNODC monitors the Forest Warden Families Programme (FWFP), a component of Presidential management against illicit crops (PCI) of the Presidency of the Republic of Colombia. UNODC verifies the coca cultivation and other illicit crop free status of selected districts. The main objectives of the programme are: i) to motivate farmers to keep their land free of illicit crops, ii) to establish productive projects socially acceptable, economically feasible and environmentally sustainable, iii) to recover the forest in areas that are environmentally and socially vulnerable, and iv) to produce socio-territorial cohesion and identity through the legal tenancy of their land property. The FWFP has four main components: The first one is the preservation of the environment with technical support of expert entities in the training of families for the establishment of productive and sustainable projects. The second component deals with the increase of the social capital, by a permanent training of families in community savings, leadership, project managements among others. The economic component consists in a temporary financial aid to the beneficiary families. The institutional component is focused to strengthening the inter-institutional. The government and the families sign a contract with payments of a bimonthly salary COP 600,000 (approximately US$ 305) per family for a three years period. The programmes started in 2003 and 88,488 families have participated so far. In December 2008, the Programme was available in 89 municipalities of 19 departments. 66,000 individual contracts were running to whom approximately COP 611,000 million (approximately US$ 311) were paid. SIMCI supports the monitoring activities of the programme by providing thematic cartography, satellite images and annual classification of vegetation coverage in the selected areas. The UNODC monitoring project shows that 9,036 hectares of secondary forest and 53,477 hectares of high shrubs have been recovered as well as 2,987,000 hectares in the selected areas are free of illicit crops. Table 38. Consolidated contracts of the Forest Warden Families Programme by department,2008 Department Active individual Contracts Payments ( 000 COP) % of Payments Antioquia 11,780 83,469,341, Nariño 9,753 76,730,060, Putumayo 3,184 67,124,360, Tolima 3,595 56,049,704, Huila 0 45,468,580, Choco 5,951 44,926,704, Bolivar 1,709 43,223,406, Cauca 1,240 27,645,792, Santander 4,741 21,607,512, Norte De Santander 1,183 21,404,808, Caqueta 2,447 21,247,560, Magdalena 0 18,854,168, Cordoba 1,702 15,830,064, Boyaca 1,572 12,379,344, Meta 1,996 11,862,144, Caldas 6,587 10,255,896, Guaviare 0 8,638,207, Arauca 0 7,486,200, Amazonas 1,739 5,539,824, Cundinamarca 4,440 5,450,880, Vaupes 1,157 2,202,384, La Guajira 734 1,797,648, Cesar 490 1,588,344, Total COP 66, ,782,931, % Total US$ 310,831,008 Source: PCI,Accion Social, UNODC 67
68
 with the subsequent impact on the agricultural economy of Colombia.")
69 Coca cultivation in coffee plantation areas In Colombia, coffee cultivation is the most important agricultural product and there is a national concern about the possible penetration of illicit coca crops in territories ecologically suitable for coffee cultivation (ecotopos) with the subsequent impact on the agricultural economy of Colombia. Though the amount of coca cultivation in coffee lands reaches in 2008 only 1.1% of total coca crops (906 hectares), the increase of 33 hectares (3.8%) with respect to 2007 represents an early alert to intensify the implementation of prevention and forced or voluntary eradication projects. Table 39. Coca cultivation in coffee plantation areas, 2008 Department Potential coffee cultivation area (hectares) 2006 Coca cultivation area (hectares) 2007 Coca cultivation area (hectares) 2008 Coca cultivation area (hectares) Antioquia 1,205, Boyaca 324, Caldas 257, Caqueta 196, Cauca 668, La Guajira 118, Magdalena 157, Nariño 154, Norte de Santander 475, Santander 624, Valle del Cauca 594, Total 4,776, Source: National Federation of Coffee Growers for Ecotopos 122 Coca cultivation mixed with coffee cultivation 69
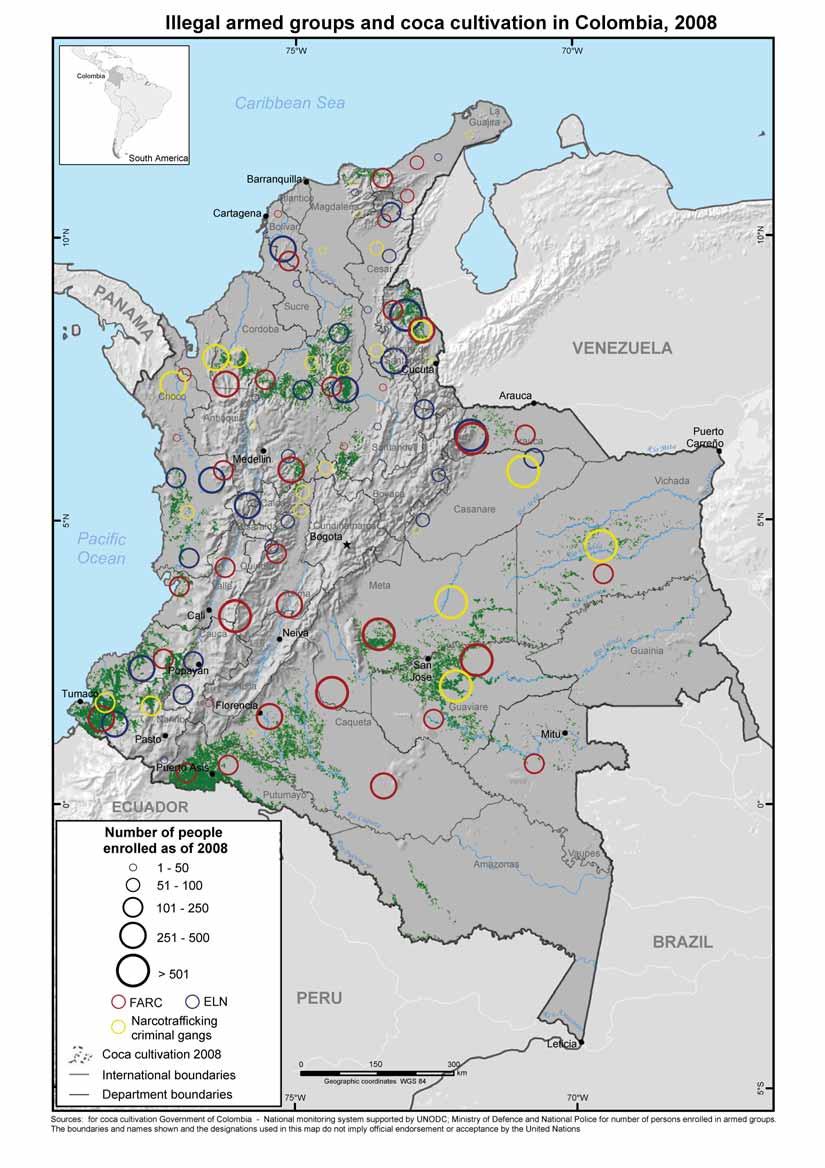
70
71 Armed groups and coca cultivation Although not directly involved in coca cultivation per se, illegal armed groups controlled the business and prices of coca leaf and their derivates offered to the coca farmers. The Ministry of Defense reports the presence of illegal armed groups in 411 municipalities (163 of which with coca crops). In some of them the presence of two or three groups has been reported. It is extremely difficult to know which of the links in the chain of the cocaine business of production and sale are managed by these groups, but it is well known that the illegal armed groups guarantee territorial control. According to Government sources, in 2007, there were around 13,200 people enrolled in illegal armed groups (Revolutionary Armed Forces of Colombia- FARC- and National Liberation Army- ELN-).The FARC group is present in 195 of these municipalities (93 of them have illicit coca crops) and the ELN is present in 219 municipalities (69 with coca crops). The United Auto-Defense of Colombia-AUC- started a process of demobilization in 2003 that included 31,689 enlisted people, but the OAS and the security agencies of Colombia reported the emergence of new groups or emerging gangs not demobilized or regrouping of demobilized people in criminal gangs that control some communities and the illicit economy. The National Police estimated about 4,800 illegal armed people in 115 municipalities (52 of them with coca crops) especially in the departments of Antioquia, Cordoba, Nariño, Choco, Meta, Guaviare Casanare and Vichada. OAS points out the geographic correlation between the illicit crops areas and the strategic corridors for drug trafficking with the presence of illegal armed structures or emergent gangs particularly in the Uraba gulf and South of Bolivar, Pacific and Putumayo-Caqueta regions. Figure 21: Number of municipalities with presence of illicit armed groups Municipalities with coca crops: Without illegal armed groups presence With illegal armed groups presence Municipalities without coca crops: With illegal armed groups presence Without illegal armed groups presence Source: Ministry of Defense 71
72
73 2.7 SUPPLY REDUCTION Reported forced manual eradication For the third consecutive year, forced manual eradication increased again in 2008 and summed up to 95,731 hectares. This was an increase of 43% compared to 2007 (66,805 hectares). The eradication activities have been extended to 27 departments (same as 2007). Half of the total eradicated area is located in two departments: Antioquia (18,285 hectares) and Putumayo (29,284 hectares). The manual forced eradication of opium poppy accounts for 361 hectares in 9 departments with most of the area in Cauca (45%). Forced manual eradication is the responsibility of the Presidential Agency for Social Action, and is executed by Mobile Eradication Groups-GME- with the help of the Anti Narcotics Police (DIRAN) and the Army. In addition, the national police and the Army carry on manual eradication programmes all over the country. Since 2007, UNODC has monitored and verified the manually eradicated fields on a 100% base. Table 40. Reported forced manual eradication of coca areas, by department, 2008 Coca Cultivation Opium poppy Cultivation DEPARTAMENT Eradicated Area (has) % of total Eradicated Area (has)) % of total Putumayo 29, Antioquia 18, Meta 7, Nariño 7, Cordoba 7, Vichada 7, Nte. Santander 4, Bolivar 3, Caqueta 2, Cauca 1, Santander 1, Magdalena Choco Boyaca Cesar Amazonas Caldas Valle Cundinamarca Arauca Guainia Guajira Risaralda Huila Guaviare Tolima Casanare Total Sources: UNODC. PCI- Social Action. National Police 73
74 Manual eradication has a major impact on coca production since the bushes are completely uprooted. Replanting means significant costs for the farmer since it takes about 8 months between planting and the first harvest, moreover with low productivity in the initial stage. However in some eradicated areas, replanting and new coca plantations have been observed and UNODC recommends in its eradication report 13 to accompany eradication with alternative production projects. UNODC assessed the replanting of coca fields in the four phases of the eradication activities during 2008 by verifying the replanting of the eradication of each phase three months after the end of the correspondent activities. The interpretation for the assessment used satellite images obtained in March 2008 through May In Phase I (first trimester of 2008) 12,900 hectares were eradicated in seven departments, out of which 26% were replanted. In Phase II (second trimester) 16,600 hectares were eradicated in ten departments, out of which 35% were replanted. In Phase III (third trimester) 27,600 hectares were eradicated in 15 departments, out of which 22% were replanted and in Phase IV (last trimester) 18.5% of the 26,900 hectares eradicated were replanted. This methodology permits to identify the replanting of the fields in the middle months of the year that can not be detected in the yearly Report. The Table below shows the accumulative total replanting identified including the replanting occurred four months after the end of Phase IV (December 31st of 2008). Table 41. Analysis of replanting in forced manual eradicated coca areas by GME Without Reported Replanted Without info. Regions Replanting Eradication Has % Has % Has % Putumayo - Caqueta 31,374 10, , , Central 30,883 8, , , Pacific 9,160 2, , , Orinoco 6,801 2, , Meta-Guaviare 5,994 2, , , Sierra Nevada Amazonas TOTAL 84,428 26, , , Source: PCI, UNODC The behavior of the replanting activities of coca farmers in forced eradicated areas was measured by the overlay of coca cultivation and GME reported coordinates on eradication, considering the dates of image acquisition and eradication. This comparison showed that 82% of the total eradicated area (69,193 hectares) was useful to perform the assessment of replanting; and 18% (15,235 hectares) were covered by clouds or gaps, The analysis showed that 26,195 hectares (31 %) were replanted in the same field whereas 42,998 hectares (51%) have no evidence of being replanted, However, 928 hectares (1%) of this last group were eradicated a few months before the date of acquisition of the images, which causes some uncertainty about the replanting, In absolute numbers the regions with the most replanted areas are Putumayo-Caqueta and Central, representing 61% of the national total replanted. 13 Report on monitoring and assessment of the manual eradication conducted in 2007 (GME) 74
75
76 Reported aerial spraying The Colombian anti-drugs strategy includes several measures of control, ranging from aerial spraying, to force or voluntary manual eradication; this measures often times include alternative development and crops substitution programmes. UNODC does not participate in or supervise the spraying activities; all data were received directly from the Antinarcotics Police (DIRAN). The spraying programme carried out by DIRAN is done through aerial spraying with a mixture of products of the commercial substances of the herbicide glyphosate, a surfactant named Cosmoflux and water. In late 2002, the National Narcotics Council approved an herbicide concentration of 2.5 litres per hectare for opium poppy and 10.4 litres per hectare for coca, with a view to increasing the spraying effectiveness rate, which was estimated as being 91% in The chemical mixture has effect over the leaves and not over the roots or the soil, and therefore the bush can be subject of a prune operation at about one feet over the ground to obtain a renewal of the bush in about six months. In 2008, the spraying effectiveness rate was estimated as being 91 %. As shown in the table below, the largest spraying operations in the period has been conducted in Nariño, Putumayo and Guaviare departments; these regions are where most of the area under coca cultivation can be found in Colombia. In 2008, DIRAN reported a total of 133,496 hectares of coca fields sprayed, this represented a decrease of 13% compared with The departments of Nariño, Putumayo, Guaviare and Antioquia presented the highest levels of spraying in this year. Figure 22: Comparison of coca cultivation and cumulative sprayed and manually eradicated areas (hectares), , , ,000 Hectares 90,000 60,000 30, Coca cultivation Aerial spraying Forced manual eradication Source: DIRAN for spraying, PCI for eradication, SIMCI for coca cultivation. The cumulative sprayed area is the sum of areas during a calendar year (calculated by multiplying the length of flight lines by their width), and it differs from the effective sprayed area, which disregards the overlap between adjacent sprayed bands and areas sprayed several times in the same calendar year. 76
77 Table 42. Reported aerial spraying of coca cultivation by department and year Department Nariño 6,442 8,216 17,962 36,910 31,307 57,630 59,865 36,275 54,050 Antioquia 6,259-3,321 9,835 11,048 16,833 18,022 27,058 10,028 Putumayo 13,508 32,506 71,891 8,342 17,524 11,763 26,491 26,766 11,898 Meta 1,345 3,251 1,496 6,973 3,888 14,453 25,915 15,527 9,057 Guaviare 8,241 7,477 7,207 37,493 30,892 11,865 14,714 10,950 13,061 Vichada - 2, ,446-5,485 7,193 5,901 Bolivar - 11,581-4,783 6,456 6,409 2,662 7,050 2,214 Cordoba ,767 5,588 6,259 3,561 Caqueta 9,172 17,252 18,567 1,059 16,276 5,452 4,575 5,084 11,085 Cauca 2, ,308 1,811 3,292 1,536 3,557 6,891 Arauca ,734 5,336 2,584 1,400 2,695 2,296 Norte Santander 9,584 10,308 9,186 13,822 5, ,687 2,683 2,864 Santander ,855 2,042 2,146 1, Caldas ,090 1, Choco Valle La Guajira Magdalena , Vaupes Boyaca Cundinamarca Aerial Spraying 58,073 94, , , , , , , ,496 Net Cultivation hectares) 163, , ,000 86,000 80,000 86,000 78,000 99,000 81,000 Source: DIRAN Once coca fields are sprayed, it takes approximately six to eight months to recover productive crops when the bushes are pruned or replanted. However, when heavy rain occurs or bushes are washed by the farmers immediately after the spraying, the loss in coca leaf can be reduced and the crop recovers quickly. The sustainability of the eradication efforts depends to a large extent on the real alternatives open to the farmers and to the displacement of the cultivation into new and more remote areas of the country (balloon effect). The aerial spraying may cause the loss of one or more harvests, the reduction of productivity or the total loss of crops but it has become clear that the impact varies considerably from one region to another and that it is not the only cause for reduction or loss of coca crops. In order to neutralize or reduce the impact of the aerial spraying, several actions are taken by the farmers such as: to plant coca bushes interspersed with other plants, to apply protective substances on leaves, to wash the leaves, to reduce the size of the fields, to rotate coca crops with other licit crops in the same field, etc. These factors together with the reductions or losses due to the climate, plagues or diseases help to explain why the coca cultivated area is not stable along the year and suffers constant increases by replanting and decreases by eradication, marketing difficulties, violence, etc. 77
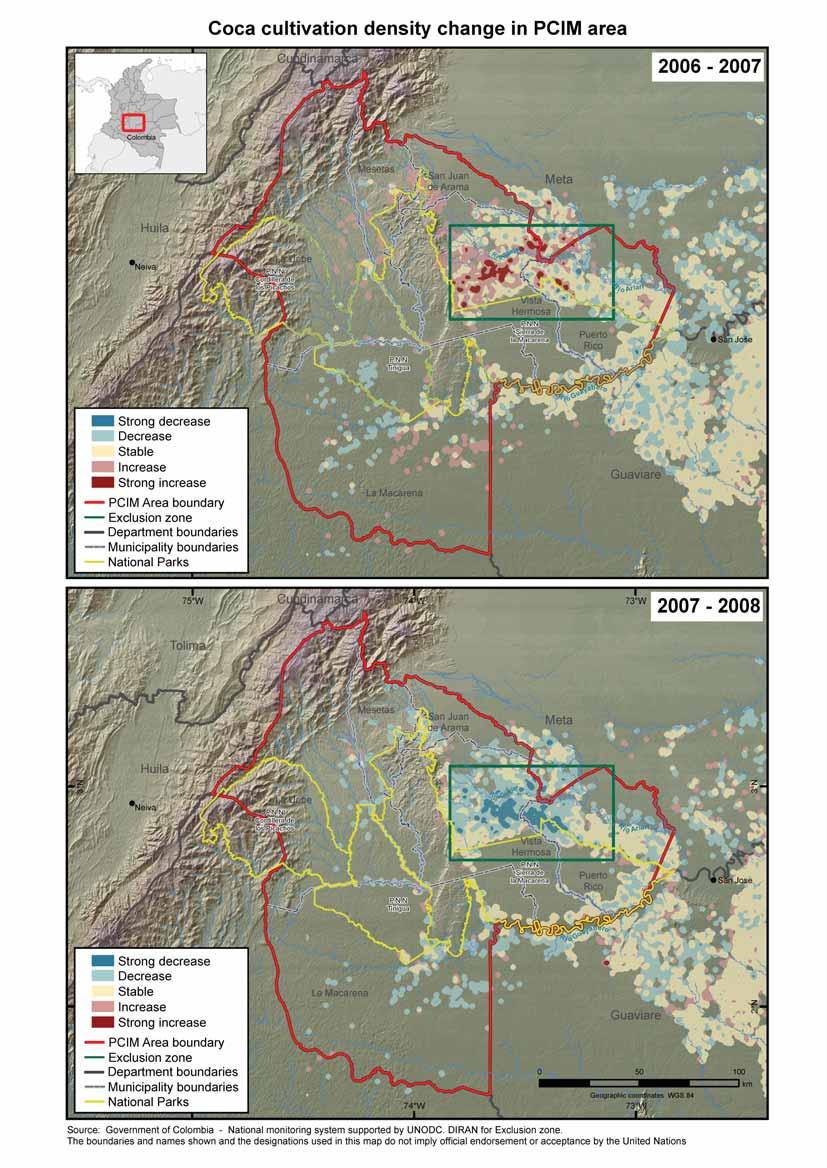
78
79 Plan of Integral Consolidation The main objective of this plan PECIM- carried out by the Government of Colombia, aims to recover the institutional control of the territory and to establish the necessary conditions for the full exercise of the citizen s rights. This area has an environmental importance considering the existence of three National Parks in their territory: La Macarena, Picachos and Tinigua. One of the main objectives of the PECIM aims to the final elimination of illicit crops in the region. For this purpose, an eradication strategy focused in the conditions that determine the replanting of the illicit crops and the progressive consolidation as a territory free of coca. The most important fact is the coordination of the Government efforts in territorial security, eradication and assistance for the economical, social and institutional development of the population. The investments in the area reached COP 132 billion (US $67 million). Most of the investment has been implemented in the municipalities of Vista Hermosa and Puerto Rico, which formed part in 2007 of the ten municipalities with the most area cultivated with coca in the country. The mentioned investments are aimed to: Infrastructure and connectivity, Social Development, Territorial planning, Economical development, Protection to citizens and Transition activities (livelihood). Figure 23: Investments in PCIM Territorial planning 17% Protection citizens 2% Transition activities 1% Infraestructur and conectivity 46% Ecnomical development 9% Institutional development 1% Social development 24% Source: Center of integral coordination. Office of the President. In the PCIM area 2,233 hectares were sprayed and 5,735 hectares were eradicated in Into the PCIM area, a polygon of 387,000 hectares was selected and called Exclusion Zone where no spraying activities can be realized with the purpose of implement the eradication strategy through the control of the territorial security and assistance for their transition to licit cultivation. In this area, agreements with the farmers to forced and voluntary eradication involved more than 1,500 families. At the end of 2008 into the Exclusion Zone where most of the coca of the department was cultivated, some coca fields estimated in 1,524 hectares were still present in the zone Coca cultivation in Meta department shows an increasing trend since 2001 and reached the record of the most coca cultivated area in the country in 2004 and Meta shows an important decrease in 2008 dropping to the sixth place in 2008 (5,525 hectares) after the third place occupied in
80 (10,386 hectares) in On the other hand, the coca cultivation in the six municipalities of the PECIM decreased 63% in 2008 with respect to 2007 going from 7,248 hectares to 2,697 hectares cultivated in In the Exclusion Zone where the eradication strategy is applied, the reduction reached 75% in Table 43. Coca cultivation in Meta department and in PCIM area (hectares), AREA %Change Exclusion Zone 1,777 2,546 2,718 8,705 9,530 3,574 5,333 1, PCIM 8,949 6,527 5,858 12,200 12,597 6,498 7,248 2, Meta departament 11,425 9,222 12,814 18,740 17,305 11,063 10,386 5, Source: UNODC The productivity of coca cultivation decreased in the PCIM area from 6,6 harvests per year and a coca leaf yield of 8,2 mt/ha/year in 2005, to 5,4 harvests per year and a yield of 5,1 mt/ha/year in The potential production of cocaine decreased from 120 mt of pure cocaine (19% of national total) in 2005 to 30 mt (7% of national total) in
81
82 Reported seizures UNODC is not involved in the collection of data on seizures and destruction of laboratories. However the data provided by the Colombian government are presented here in order to show the existence of possible trafficking corridors and allow for a better understanding of the dynamics that surrounds the drug business. According to DNE, a total of 3,209 clandestine laboratories were destroyed in Out of these, a total of 2,942 corresponded to laboratories processing coca paste or cocaine base, 267 corresponded to laboratories processing cocaine hydrochloride. Compared to 2007, it represented an increase 36% in the number of illegal laboratories dismantled. Figure 24: Number of clandestine laboratories destroyed and coca cultivation, ,000 3,500 Coca cultivation Ha. 160, , , ,000 80,000 60,000 40,000 20,000 3,000 2,500 2,000 1,500 1, No. of labs destroyed Coca cultivation Labs destroyed In Antioquia, Nariño, Cauca, Putumayo and Norte de Santander, 64% of the illegal laboratories were detected and destroyed and 61% of the self called kitchens to process coca pasta or cocaine base were also detected and destroyed in en Putumayo, Nariño, Cauca, Antioquia and Meta. 82
83 Table 44. Table: Illegal laboratories destroyed by department and by drug type, 2008 Department Cocaine Cocaine Coca paste base laboratories destroyed laboratories destroyed destroyed kitchens TOTAL kitchens Amazonas Antioquia Arauca Atlantico Bolivar Boyaca Caldas Caqueta Cauca Cesar Choco Cordoba Cundinamarca Guainia Guaviare La Guajira Magdalena Meta Nariño Norte Santander Putumayo Risaralda Santander Sucre Tolima Valle Vichada Total Source: DNE Data provided by the National Narcotics Office (DNE) shows an increase between 2007 and 2008 in terms of cocaine seizures (from 127 mt in 2007 to 198 mt in 2008). 58% of cocaine seizures took place in the Pacific Region (departments of Choco, Valle, Nariño and a 31% in the departments of Atlantico, Guajira, Cordoba, Bolivar and Antioquia. In connection with heroin seizures, it showed an increase of 20% over the previous year, going from 537 to 646 kilograms (50% of the potential production of heroin), which were seized mostly in the departments of Cundinamarca, Nariño, Norte de Santander, Valle and Choco (79%). It is noticeable the significant increase (+78%) of seizures of cannabis in 2008 with respect to
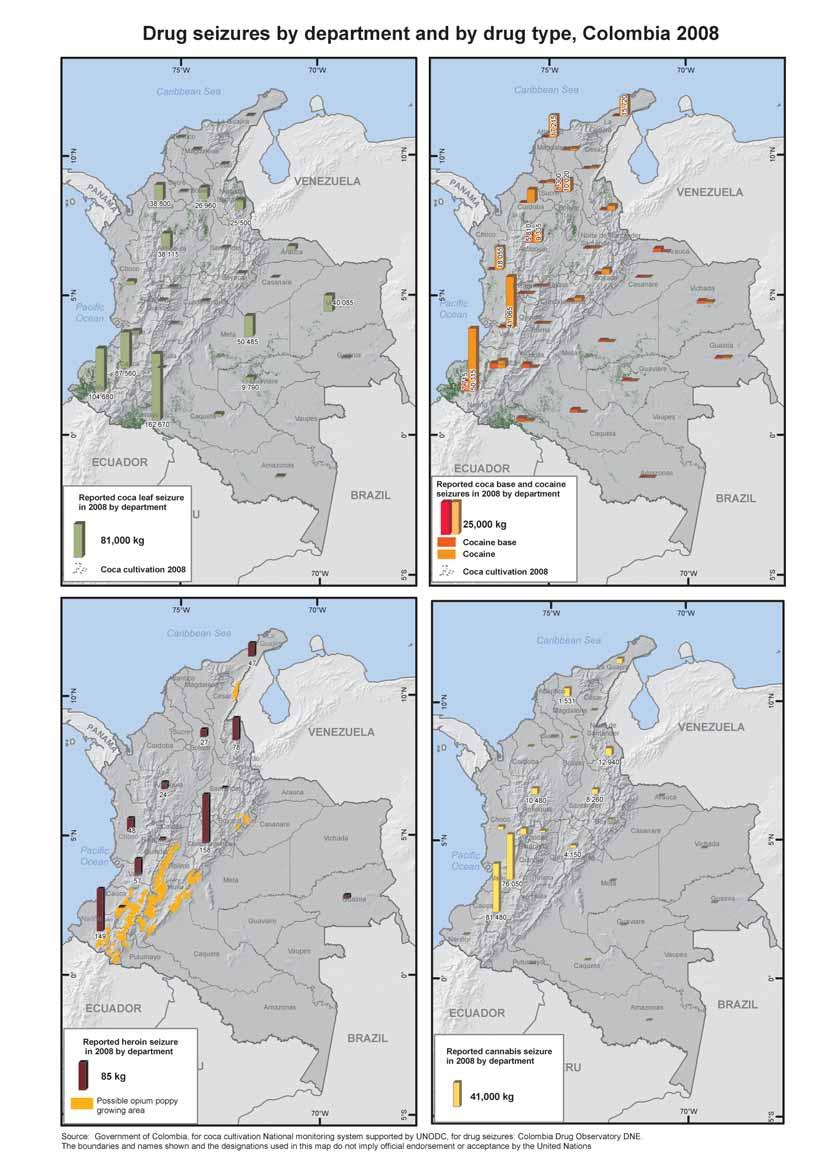
84
85 Table 45. Reported seizures of illicit drugs, Drug Unit Coca leaves Kg. 638, , , , ,544 1,064, ,353 Coca Paste Kg ,368 1,218 2,651 5, ,001 Cocaine base Kg. 22,615 27,103 37, ,491 42,708 33,882 49,663 Cocaine Kg. 95, , , , , , ,366 Opium Latex Kg , Morphine Kg Heroine Kg Cannabis Kg. 76, , , ,795 93, , ,685 Sintetic Drugs unit 175,382 5,042 19, ,724 7,888 1,968,857 5,597 Source: DNE Table 46. Reported seizures of cocaine on the Pacific and Atlantic routes, % seizures on sea Pacific 43,435 47,137 46,128 61,042 61,758 61,423 64,487 86% Atlantic 16,065 23,157 30,928 35,856 14,150 9,235 10,157 14% Total seized by sea 59,500 70,294 77,056 96,898 75,908 70,658 74, % Total seizures (land and 95, , , , , , ,366 sea) % of seizures on sea 62% 62% 62% 52% 56% 60% 38% Note: Seizures by the Maritime Agreement reached 24.7 tm Source: Colombian Navy, Intelligence Division From a total seizure of 198 metric tons of cocaine, 74.6 tons were seized on the high seas (43%) and maritime ports mostly in the Pacific Ocean. It is noticeable the seizure of 29.5 mt on board of semisubmersibles in the Pacific Ocean. Most of the seizures were registered along the Choco-Cordoba- Uraba corridor due to its condition as the most commonly used route for drug transport. Figure 25: Reported seizures of cocaine in the Pacific and Atlantic routes and into the country , , , , , , , , ,000 95, ,000 50, Pacific Atlantic Into the country Source: Colombian Navy, Intelligence Division 85
86 Table 47. Drug seizures by department and by drug type, 2008 Department Coca leaf Cocaine paste Cocaine base Cocaine Latex Heroin Cannabis Amphetamines Extasis Flunitrazepam Kg Kg Kg Kg Kg Kg Kg Unit Unit Unit Amazonas Antioquia Arauca Atlantico Bolivar Boyaca Caldas Caqueta Casanare Cauca Cesar Choco Cordoba Cundinamarca Guainia Guaviare Huila La Guajira Magdalena Meta Nariño Norte Santander Putumayo Quindio Risaralda San Andres Santander Sucre Tolima Valle Del Cauca Vaupes Vichada Total Source: DNE 86
87 3 METHODOLOGY 3.1 Coca cultivation The monitoring of coca cultivation in Colombia is based on the interpretation of various types of satellite images. For the 2008 census, the project analyzed a total of 86 LANDSAT images, 9 SPOT- 4 images and 3 ALOS images, acquired between August 2008 and March The images cover the whole national territory (excluding the islands of San Andres and Providence) equivalent to 1,142,000 square km. In September 2005, the Institute of Surveying, Remote Sensing and Land Information of the University of Natural Resources and Applied Life Sciences, Vienna (BOKU, Austria), conducted a technical evaluation of the methodology developed for the assessment of coca cultivation. The Institute concluded that the methodology is appropriate and commended the work of the remote sensing team performing the interpretation of the satellite images. The Institute also made some recommendations in particular the use of aerial photography for quality control which was initiated in 2008 in two test areas located in the departments of Meta and Antioquia. The project staff continues working in the development and updating of a decision tree for the interpretation of coca crops in satellite images with the support of the BOKU University. The identification of the different factors that determine the interpretation of the coca fields in the regions (Meta-Guaviare, Putumayo-Caqueta and Cauca-Nariño) as well as the decision tree with the data obtained is already finished. Figure 26: Part of the decision tree designed for the interpretation key study THE SIZE OF THE FIELD BELONGS TO THE CATEGORY OF. SMALL OR MEDIUM LOWER THAN 3 HECTARES (90%) TO VERIFY PREVIOUS RESPONSE FROM THE ORIGINAL IMAGE OF PREVIOUS CENSUS. CLOUDS, GAPS BARE SOIL OR COCA PASTURES, SHRUBS, SECUNDARY FOREST PREVIOUS OR SUBSEQUENT TO THE DATE OF IMAGE YES COCA FIELD SPRAYING LINES TO APPLY TO THE LAST CENSUS NO THE FIELD WAS NOT PROBABLY IDENTIFIED THE PREVIOUS YEAR FOR CLOUDS OR GAP BLOCKAGE. IT CAN BE A COCA FIELD AND MUST BE FIELD IDENTIFIED. YES YES SPRAYING DATES SPRAYING LINES TO APPLY TO THE LAST CENSUS NO NO THE FIELD WAS ERASED BY FIELD VERIFICATION COULD BE A RECOVERED COCA FIELD. HAS TO BE VERIFIED BY AERIAL RECONAISSANCE COCA FIELD 87
88
89 The estimation of the total area under coca cultivation in Colombia in 2008 is the result of the following steps: 1) Identification and acquisition of satellite images The survey relied mostly on LANDSAT 7 ETM+ images and to a lesser extent on SPOT- 4 and ALOS images. Table 48. Table: Satellite images used for the 2008 survey in Colombia Sensores LandSat 7 ETM+ % 2001 % 2002 % 2003 % 2004 % 2005 % 2006 % 2007 % SPOT 4 and ALOS ASTER IRS6 LISS III Total One of the major difficulties in data acquisition is the frequent cloud cover over the Colombian territory. Therefore, satellite with a frequent view and a continuous recording of the area were favoured. The free cost of LANDSAT 7 ETM+ contributed to their larger selection than SPOT or ALOS images. LANDSAT 7 ETM+ data are collected in 6 spectral bands of 30 meter spatial resolution, a thermal band with 60 meters spatial resolution and an additional panchromatic band of 15 meter spatial resolution. The satellite has a 16-day repeat cycle, which enhances the chance for cloud free images. The swath width of 185 km is appropriate for regional studies. The project identified suitable images by consulting frequently the on-line catalogue of available LANDSAT 7 images at the US Geological Survey. As of May 2003, the Scan Line Corrector (SLC) of the LANDSAT 7 ETM+ instrument failed. This malfunction is leading to gaps in the image, gradually diminishing towards the centre of a scene. The assessment of coca cultivation under these gaps (without information) is described in the below section on correction. To obtain information on gaps areas, Landsat images of different date or others sensors are used. SPOT 4 has a spatial resolution of 20 meter with a swath width of 60 km. About 500 SPOT images would be necessary to cover the entire country. The images of the spectral sensor AVNIR-2 on board of the Advanced Land Observing Satellite (ALOS) have four bands and a spatial resolution of 10 meters with a swath width of 70 km. They are comparable in spectral resolution with CBERS and the first four bands of LANDSAT. 89
90 Figure 27: Spectral comparison between bands SPOT, ASTER, IRS, LSIIII, LANDSAT, ALOS and CBERS 2) Spatial Information Data Base -BIE- ( The BIE is an infrastructure of spatial data that aims to guarantee the knowledge and access of anyone to the spatial information gathered by SIMCI, framed into the recommendations of the United Nations Seventh Regional Cartographic Conference for the Americas, held in New York in September The BIE is divided into five sections: Satellite Data, Thematic Cartography, Altimetry Cartography, Illicit Crops Spatial Data and Documents. It may be consulted at the web page of UNODC Colombia shown in the last page of this report. 3) Image pre-processing 3.1) Geo-referencing In order to use image datasets in conjunction with other spatial data available (e.g. digital elevation model), it is necessary to align the image data to the same map coordinate system. The satellite images are geo-referenced on the basis of mosaics built with geo-referenced images with the less cloud coverage used in previous census. The Digital Terrain Model DTM- from the Space Shuttle Radar Mission was used for spatial enhancements. In order to improve the quality and accuracy of the coca fields coordinates, the Geographical Institute of Colombia orthorectified the mosaics to provide official coordinates to the shp. file. 90
91 3.2) Radiometric and spatial enhancements To improve the visual and supervised interpretation process, various radiometric enhancements (colour or spectral) are applied to enhance the contrast of the image. Example of radiometric enhancement To enhance the spatial characteristics of an image various filters that modified the value of a pixel using the values of surrounding pixels, were used. 3.3) Band combinations To allow an easy interpretation of the displayed image, it is possible to assign which band is displayed using a different primary color (RGB) for each band 91
92


93 4) Digital land cover classification of land use and vegetation One of the difficulties for an automatic or supervised classification of vegetation in Colombia is the absence of well defined crop calendar. Most crops, including coca, are cultivated throughout the year. This makes it difficult to separate coca from other crops based on phenological differences. The automatic land cover classification is not used to detect coca cultivation, but rather to study broadly the various land cover present on an image. The project performed a supervised classification, where training areas represent the features to be mapped in advance and class signatures are calculated. Each pixel is then assigned to a land cover class depending on an algorithm. In this case, based on the maximum likelihood algorithm, 17 land cover classes are classified within each image: primary forest and rainforest, secondary forest, grassland and small shrubs, water bodies, sand banks, clouds and shadows, roads, urban and populated areas, inundated areas, rock outcrops, bare soils, crops, high shrubs,artificial water bodies, runways other. SPOT Scene with the land use interpretation 5) Visual interpretation of the coca fields The classification of coca fields relies on the visual interpretation of satellite images. The detection is based on the spectral characteristics, texture, patterns and the surroundings of the fields. The class coca can be considered to be composed of bare soils and small rows of bushes. No distinction is made between the different phenological stages of coca bushes. The interpreter verifies the coca crops based on spectral characteristics, texture, shape, size of the fields and contextual information, like information from previous surveys and geographic information on spraying and manual eradication. Coca fields are digitized on screen in two ways: with the help of semi-automatic software tools (e.g. pixel seeding). This means that pixels are grouped together automatically by the software if their spectral value are similar. The similarity threshold for grouping pixels is determined by the interpreter. The second way consists in the unit selection of pixels to configure the fields. Small polygons of less than 2 pixels are deleted because the interpretation is not reliable enough due to the coarse spatial resolution of the sensor. In addition, aerial photos taken by the Antinarcotics Police (DIRAN) and SIMCI, recording of aerial spraying path, manual eradication and Forest Warden Families reports and coca polygons interpreted for the census of previous years are also used to facilitate the interpretation, as well as the information supplied by different government and UN agencies. 93


94 The interpretation process relies on the profound knowledge of the area by the interpreter. This knowledge is gained through many years of experience analysing satellite images and frequent overflights. Interpreters have several years of experience with the project. Coca fields visually interpreted (outlined in yellow) in ALOS - AVNIR 2 satellite image 6) Verification flights Verification flights are required for editing and improving the initial interpretation. The verification is based on direct visual inspection of the ground from a plane. Paper maps are used for orientation and as a data base for verification. In addition to visual inspection from the aircraft, a video camera and a digital camera combined with GPS and a video camera were used for documentation. The preliminary interpretation results are edited and corrected with the verification findings. 7) Corrections Following the interpretation process, a number of corrections are applied to account for the effects of spraying activities before or after image acquisition, for missing image information due to clouds or gaps (SLC-off) and for differences in acquisition date of the images with respect to the census cut of date of 31 December. These corrections are necessary to improve the final statistics. 7.1) Correction for manual eradication As part of the illicit crop eradication activities, coca fields are pulled out by hand and their coordinates are registered and reported to UNODC. Corrections are then performed depending on the date of image acquisition and on the date of eradication. Reported eradicated coca fields are ignored in images acquired after manual eradication and deleted from the interpretation when the eradication takes place after the date of the image. The manual eradication happened in the first months of the year after the census year, is used to replace corrections by clouds or gaps and to verify the interpretation of those fields that should be present in the census. These eradicated fields are then added to the statistics. 94


95 Manual eradication polygons (occurred after the date of the image) in white 7.2) Correction for spraying Another activity aimed to destroy coca fields consists in spraying them from aircraft. The spraying lines are automatically recorded. After transforming the coordinates into the coordinate system of the satellite images, a buffer is calculated depending on the type of the plane and the recorded spraying line. The buffer is placed over the coca interpretation. Corrections are then performed depending on the date of image acquisition and on the date of spraying. Coca areas that were identified in the satellite images are excluded if the images were acquired before spraying, except for an estimated survival rate of 9% for 2008 certified by DIRAN. Coca fields with the aerial spraying lines in yellow 95
96 7.3) Corrections for cloud cover and gaps in LANDSAT 7 images (SLC-off) Clouds and shadows are delineated during the land cover classification process. In a first step, buffers of one kilometre width around the clouds are calculated. The coca cultivation area within this buffer is measured. By comparison with the previous survey, trends for coca cultivation are calculated for the buffer area. This trend is used to estimate recent area under the clouds from corresponding area in the previous survey. Old coca fields under clouds or gaps are preserved in position and size, when trends indicate an increase in the surroundings areas. In the 2008 survey, the corrections for the gaps of the LANDSAT 7 scenes were treated like clouds. The only difference is in a buffer of 300 meter instead of 1000 meter for the clouds. The definition of the buffer is based on experience in both cases. 7.4) Corrections for differences in acquisition dates of images The satellite image only reflects the cultivation at their acquisition date. A correction factor should be applied to get the estimates at the cut-off date of 31 st December. A monthly coca rate of increase or decrease is calculated from the difference in coca cultivation between images acquired over the same area at different dates. This rate is then applied to the initial interpretation for the number of months separating the acquisition date and the cut off date of 31 December. Table 49. Corrections applied Area (hectares) % of initial result Initial results 67, % Correction for cloud cover and gaps 9, % Correction for spraying 3, % Correction for difference in dates % Final results 80, % Accuracy assessment The assessment of the accuracy of the interpretation results is part of a quality control. The accuracy assessment has two aspects: a geometric accuracy which is the accuracy of the interpreted boundaries (or size) of land cover units and a thematic accuracy which measures the reliability of the identification of land cover classes. The images are presently geo-referenced on the basis of the mosaics built by the project. In this case, for LANDSAT 7 ETM+ images a maximum positional deviation of the order of 1/10 of elevation difference can occur. During its revision of the methodology, the Institute of Natural Resources and Applied Life Sciences of Vienna (Austria) recommended to ortho-rectify the images with detailed Digital Elevation Model to increase the geometric accuracy to below 1.5 pixels. Thematic accuracy is usually specified in terms of error matrix, giving frequency (probability) of misclassification between different classes. The compilation of the error matrix must be based on a representative, unbiased sample of reference data. The collection of reference data is difficult where access to the ground is not possible due to security reasons. Although the thematic accuracy is a good indicator of the quality of the interpretation, it does not provide for a range of the results, and therefore it cannot be used to correct the results. Following the recommendations of the Institute of Natural Resources and Applied Life Sciences of Vienna (Austria), the project is currently developing an accuracy assessment method relying on aerial photography as surrogate ground data that might provide for such a bias-correction factor. The project obtained medium scale true colour aerial photography taken by a private company contracted in January 2008 over the surroundings of the Vista Hermosa-Meta and Caceres-Antioquia municipalities to compare the results of the interpretation of coca fields in the aerial photography with the results of the interpretation in the LANDSAT and ALOS images taken around the same date and used in the 2007 coca survey. The results of the Meta and Antioquia test areas are been analyzed by Institute of Natural Resources and Applied Life Sciences of Vienna (Austria). 96

97 The results of this study are a first approximation to the proposed measurement of the interpretation accuracy of coca cultivation using high-resolution aerial photography interpretation as reference for accuracy assessment of the interpretation of satellite imagery and will be continued with an appropriate statistical design. Comparison of coca fields in aerial photography with LANDSAT image 97
GLOBAL ILLICIT CULTIVATION OF COCA BUSH AND PRODUCTION OF COCA LEAF AND COCAINE, CULTIVATION (a) OF COCA BUSH IN HECTARES
 OF COCA BUSH IN HECTARES") 3.1. Production: Opium/heroin 3.2. Coca/ Cocaine GLOBAL ILLICIT CULTIVATION OF COCA BUSH AND PRODUCTION OF COCA LEAF AND COCAINE, 1990-2005 1990 1991 1992 1993 1994 1995 1996 1997 1998 1999 2000 2001 2002
3.1. Production: Opium/heroin 3.2. Coca/ Cocaine GLOBAL ILLICIT CULTIVATION OF COCA BUSH AND PRODUCTION OF COCA LEAF AND COCAINE, 1990-2005 1990 1991 1992 1993 1994 1995 1996 1997 1998 1999 2000 2001 2002
GLOBAL ILLICIT CULTIVATION OF COCA BUSH AND PRODUCTION OF COCA LEAF AND COCAINE, CULTIVATION (a) OF COCA BUSH IN HECTARES
 OF COCA BUSH IN HECTARES") 5.2 Production: Coca/Cocaine 5.2. Coca/ Cocaine GLOBAL ILLICIT CULTIVATION OF COCA BUSH AND PRODUCTION OF COCA LEAF AND COCAINE, 1990-2004 1990 1991 1992 1993 1994 1995 1996 1997 1998 1999 2000 2001 2002
5.2 Production: Coca/Cocaine 5.2. Coca/ Cocaine GLOBAL ILLICIT CULTIVATION OF COCA BUSH AND PRODUCTION OF COCA LEAF AND COCAINE, 1990-2004 1990 1991 1992 1993 1994 1995 1996 1997 1998 1999 2000 2001 2002
June 2006 COCA CULTIVATION IN THE ANDEAN REGION. A survey of Bolivia, Colombia and Peru. Government of Peru. Government of Colombia
 COCA CULTIVATION IN THE ANDEAN REGION A survey of Bolivia, Colombia and Peru June 2006 Government of Bolivia Government of Colombia Government of Peru UNODC's Illicit Crop Monitoring Programme (ICMP) promotes
Government of Colombia. Colombia. Coca Cultivation Survey
 Government of Colombia Colombia Coca Cultivation Survey June 2007 Censo de cultivos de coca 2006 1 ABBREVIATIONS COP DANE DEA DIRAN DNE DNP GME ICMP INCB IDB NNPS OAS PDA PCI RSS SIMCI UNODC USAID US$
ONDCP August Cocaine. Smuggling
 ONDCP-01-07 August 2007 Cocaine Smuggling in 2006 Produced by the Office of National Drug Control Policy Cocaine Smuggling in 2006 The counterdrug community estimates that between 530 and 710 metric tons
June 2006 COCA CULTIVATION IN THE ANDEAN REGION. A survey of Bolivia, Colombia and Peru. Government of Peru. Government of Colombia
 COCA CULTIVATION IN THE ANDEAN REGION A survey of Bolivia, Colombia and Peru June 2006 Government of Bolivia Government of Colombia Government of Peru UNODC's Illicit Crop Monitoring Programme (ICMP) promotes
PART 4. COLOMBIA COCA CULTIVATION SURVEY
 PART 4. COLOMBIA COCA CULTIVATION SURVEY SUMMARY FACTS SHEET 2004 Variation on 2004 2005 Net coca cultivation (rounded total) 80,000 hectares + 8% 86,000 hectares Of which Meta-Guaviare region 28,500
Why Colombia Investment Environment & Business Opportunities
 Why Colombia Investment Environment & Business Opportunities Tobias Meurer Mai 2017 Table of Content 1. Recent Macroeconomic Developments 2. Investment Environment 3. Export Platform 4. Wood processing
Flag of Columbia - A Brief History
 Part of the History of National Flags Series from Flagmakers Flag of Columbia - A Brief History Where In The World Trivia The current flag is similar to the historical flag of Gran Colombia. Technical
COUNTRY BRIEF - COLOMBIA
 SSI RM Security & Risk Management Consultancy 'Safe in our hands' International House, George Curl Way, Southampton, SO18 2RZ w: www.ssi-ltd.com e: management@ssi-ltd.com t: +44 (0)20 3141 2100 COUNTRY
Implementation Status & Results Colombia Colombian National Protected Areas Conservation Trust Fund (P091932)
") Public Disclosure Authorized Public Disclosure Authorized The World Bank Implementation Status & Results Colombia Colombian National Protected Areas Conservation Trust Fund (P091932) Operation Name: Colombian
Public Disclosure Authorized Public Disclosure Authorized The World Bank Implementation Status & Results Colombia Colombian National Protected Areas Conservation Trust Fund (P091932) Operation Name: Colombian
Annual Coca Cultivation Survey 2001
 PERU UNDCP Annual Coca Cultivation Survey 2001 Illicit Crop Monitoring System Peru Country Office Peru March 2002 I. SUMMARY Illegal coca cultivation in Peru has registered significant changes in its dynamic
Implementation Status & Results Colombia Colombian National Protected Areas Conservation Trust Fund (P091932)
") Public Disclosure Authorized Public Disclosure Authorized The World Bank Implementation Status & Results Colombia Colombian National Protected Areas Conservation Trust Fund (P091932) Operation Name: Colombian
Public Disclosure Authorized Public Disclosure Authorized The World Bank Implementation Status & Results Colombia Colombian National Protected Areas Conservation Trust Fund (P091932) Operation Name: Colombian
Haga clic para cambiar el estilo tulo
 de tít Haga clic para modificar el estilo de texto del patrón Segundo nivel It developes processes, programs and strategies directed to the integral prevention of the differents forms and efects of psychoactive
Implementation Status & Results Colombia Colombian National Protected Areas Conservation Trust Fund (P091932)
") Public Disclosure Authorized Public Disclosure Authorized The World Bank Implementation Status & Results Colombia Colombian National Protected Areas Conservation Trust Fund (P091932) Operation Name: Colombian
Public Disclosure Authorized Public Disclosure Authorized The World Bank Implementation Status & Results Colombia Colombian National Protected Areas Conservation Trust Fund (P091932) Operation Name: Colombian
COLUMBIA RISK ASSESSMENT
 City & Country Bogota, Columbia Prepared by Sussex Abroad office Dates of travel July 2015 to August 2016 Updated January 2016 Students affected Study abroad students going to Universidad de Los Andes
COLOMBIAN NATIONAL POLICE CRIME REPORT
 COLOMBIAN NATIONAL POLICE CRIME REPORT 1 INDEX Presentation 3 Page Social Impact Offenses 4 I. Murders 5 II. Traffic fatalities 9 III. Personal injuries 12 IV. Traffic injuries 15 V. Thefts 17 VI. Motor-vehicle
COLOMBIAN NATIONAL POLICE CRIME REPORT
 Crime Report COLOMBIAN NATIONAL POLICE CRIME REPORT 1 Crime Report INDEX Presentation 3 Page Social Impact Offenses 4 I. Homicides 5 II. Traffic fatalities 9 III. Personal injuries 12 IV. Traffic injuries
Implementation Status & Results Colombia Colombian National Protected Areas Conservation Trust Fund (P091932)
") Public Disclosure Authorized Public Disclosure Authorized The World Bank Implementation Status & Results Colombia Colombian National Protected Areas Conservation Trust Fund (P091932) Operation Name: Colombian
Public Disclosure Authorized Public Disclosure Authorized The World Bank Implementation Status & Results Colombia Colombian National Protected Areas Conservation Trust Fund (P091932) Operation Name: Colombian
INVESTMENT IN COCOA, CHOCOLATE AND THE CONFECTIONERY INDUSTRY
 Libertad Ord en y Colombian cocoa was declared as fine or flavored cocoa, a category that covers only 5% of beans traded worldwide. (International Cocoa Organization ICCO, 2011). INVESTMENT IN COCOA, CHOCOLATE
COLOMBIAN SPACE COMMISSION: AN STRATEGY FOR THE SUSTAINABLE DEVELOPMENT OF COLOMBIA
 UN Committee on the Peaceful Uses of Outer Space: 2011 - Fifty-fourth fourth session COLOMBIAN SPACE COMMISSION: AN STRATEGY FOR THE SUSTAINABLE DEVELOPMENT OF COLOMBIA Iván n Darío o Gómez G Guzmán General
International economic context and regional impact
 Contents I. GDP growth trends in Latin America and the Caribbean in 2012 II. Regional performance in 2012: Inflation, employment and wages External sector Policies: Fiscal and Monetary III. Conclusions
Implementation Status & Results Colombia Colombian National Protected Areas Conservation Trust Fund (P091932)
") Public Disclosure Authorized Public Disclosure Authorized The World Bank Implementation Status & Results Colombia Colombian National Protected Areas Conservation Trust Fund (P091932) Operation Name: Colombian
Public Disclosure Authorized Public Disclosure Authorized The World Bank Implementation Status & Results Colombia Colombian National Protected Areas Conservation Trust Fund (P091932) Operation Name: Colombian
COLOMBIAN: RECENT DEVELOPMENTS
 COLOMBIAN: RECENT DEVELOPMENTS Why do business in Colombia? Strategic geographic location: easy access to the North American, European, Asian and Latin American markets. Macroeconomic stability: economic
REVISIONS IN THE SPANISH INTERNATIONAL VISITORS ARRIVALS STATISTICS
 Revisions in the Spanish International Visitor Arrivals Statistics REVISIONS IN THE SPANISH INTERNATIONAL VISITORS ARRIVALS STATISTICS Carlos Romero Dexeus 1 Abstract: This article concerns the revision
Investment Environment and Business Opportunities in Colombia. February 2012
 Investment Environment and Business Opportunities in Colombia February 2012 About Proexport Proexport is Colombia s entity in charge of the promotion of International Tourism, Foreign Direct Investment,
EUROPEAN COMMISSION DIRECTORATE-GENERAL HUMANITARIAN AID AND CIVIL PROTECTION - ECHO
 EUROPEAN COMMISSION DIRECTORATE-GENERAL HUMANITARIAN AID AND CIVIL PROTECTION - ECHO Monthly report number 2013/10 Month OCTOBER Country South America (except Colombia for HA) Date of submission 08/11/13
UNEARMARKED FUNDS TO REPAY DREF ARE ENCOURAGED.
 COLOMBIA: FLOODS 18 November 2005 The Federation s mission is to improve the lives of vulnerable people by mobilizing the power of humanity. It is the world s largest humanitarian organization and its
Good quality WATER and healthy ENVIRONMENT, Fundamental rights
 7 Good quality WATER and healthy ENVIRONMENT, Fundamental rights Life, physical integrity, health, balanced foods and a healthy environment all are children and adolescents' rights. Public services are
THE STATUS OF THE COLOMBIAN EXPANDED INMUNIZATION PROGRAM (PAI)
") THE STATUS OF THE COLOMBIAN EXPANDED INMUNIZATION PROGRAM (PAI) Dra. Marcela Fama Pereira PEDIATRICIAN President of Colombian Society of Pediatrics - SCP Panama, October 19, 2018 PURPOSE Assessment Follow-up
THE STATUS OF THE COLOMBIAN EXPANDED INMUNIZATION PROGRAM (PAI) Dra. Marcela Fama Pereira PEDIATRICIAN President of Colombian Society of Pediatrics - SCP Panama, October 19, 2018 PURPOSE Assessment Follow-up
COCA CULTIVATION IN THE ANDEAN REGION
 Government of Bolivia Government of Colombia Government of Peru COCA CULTIVATION IN THE ANDEAN REGION A survey of Bolivia, Colombia and Peru June 2008 UNODC's Illicit Crop Monitoring Programme (ICMP) promotes
Benchmarking Travel & Tourism in United Arab Emirates
 Benchmarking Travel & Tourism in United Arab Emirates How does Travel & Tourism compare to other sectors? Summary of Findings, November 2013 Sponsored by: Outline Introduction... 3 UAE summary...... 8
THE INTERNATIONAL GROWTH OF SPANISH HOLIDAY HOTEL CHAINS FROM A GLOBAL PERSPECTIVE: A CASE STUDY
 Cuadernos de Turismo, nº 25, (2010); pp. 263-267 ISSN: 1139-7861 Universidad de Murcia THE INTERNATIONAL GROWTH OF SPANISH HOLIDAY HOTEL CHAINS FROM A GLOBAL PERSPECTIVE: A CASE STUDY Begoña Fuster García,
Geographic Qualities of South America
 Geographic Qualities of South America 1. South America is the fourth largest continent in area. It is located in the Western Hemisphere, lying southwest of North America. Most of South America lies in
UNITED NATIONS EDUCATIONAL, SCIENTIFIC AND CULTURAL ORGANIZATION CONVENTION CONCERNING THE PROTECTION OF THE WORLD CULTURAL AND NATURAL HERITAGE
 World Heritage Distribution limited 27 COM WHC-03/27.COM/INF.13 Paris, 23 June 2003 Original : English/French UNITED NATIONS EDUCATIONAL, SCIENTIFIC AND CULTURAL ORGANIZATION CONVENTION CONCERNING THE
COLOMBIA IN THE WORLD
 Libertad Orden y GROWTH, CONFIDENCE AND OPPORTUNITIES TO INVEST OIL GOODS AND SERVICES COLOMBIA IN THE WORLD Colombia is one of the top twenty oil-producing countries, with a production of over a million
Benchmarking Travel & Tourism in Russia
 Benchmarking Travel & Tourism in Russia How does Travel & Tourism compare to other sectors? Sponsored by: Summary of Findings, November 2013 Outline Introduction... 3 Russia summary..... 8 Data sources
Aviation Competitiveness. James Wiltshire Head of Policy Analysis
 Aviation Competitiveness James Wiltshire Head of Policy Analysis 1 Air Connectivity and Competitiveness Aviation is a major enabler of economic activity and social cohesion Air Connectivity drives economic
Annex Multilateral Conventions 1. SUBJECT Where and When Signed Multilateral Organization Vienna Convention on Vienna, April 24, 1963
 Annex 3 MULTILATERAL AND BILATERAL JUDICIAL COOPERATION INSTRUMENTS SIGNED BY COLOMBIA (Special Reference to Latin American Countries, Spain and Portugal) 1. Multilateral Conventions 1 SUBJECT Where and
WORLD TRADE ORGANIZATION
 WORLD TRADE ORGANIZATION Working Party on State Trading Enterprises G/STR/N/10/COL 8 June 2007 (07-2374) Original: Spanish STATE TRADING New and Full Notification Pursuant to Article XVII.4(a) of the GATT
Coverage of Mangrove Ecosystem along Three Coastal Zones of Puerto Rico using IKONOS Sensor
 Coverage of Mangrove Ecosystem along Three Coastal Zones of Puerto Rico using IKONOS Sensor Jennifer Toledo Rivera Geology Department, University of Puerto Rico, Mayagüez Campus P.O. Box 9017 Mayagüez,
A. P. Moller Maersk Trade Report
 A.P. MOLLER MAERSK INFORME DE COMERCIO / Q4 2017 / COLOMBIA A. P. Moller Maersk Trade Report Q4 2017 COLOMBIA A.P. MOLLER MAERSK TRADE REPORT / T4 2017 / COLOMBIA CONTAINERIZED EXPORTS, PROTAGONISTS OF
GROWTH, CONFIDENCE AND OPPORTUNITIES TO INVEST
 GROWTH, CONFIDENCE AND OPPORTUNITIES TO INVEST HOTEL & TOURISM INFRASTRUCTURE ATTRACTIVE INCENTIVES FOR INVESTMENT IN THE HOTEL INDUSTRY Exemption from income taxes for a period of 30 years: the exemption
Appendix A. Technical Description of the Survey
 Appendix A. Technical Description of the Survey The University of Pittsburgh, by demand of USAID (Colombia) performed a thorough research of Colombia s main public opinion and market research companies.
5th NAMIBIA TOURISM SATELLITE ACCOUNT. Edition
 5th NAMIBIA TOURISM SATELLITE ACCOUNT Edition PREFACE I am pleased to present to you the 5 th edition of the Tourism Satellite Account (TSA). TSA is an accounting framework and economic statistical tool
I m not poor because I live with my five senses and the four spiritual energies
 I m not poor because I live with my five senses and the four spiritual energies Alberto Manqueriapa Bitente Chief of Santa Rosa de Huacaria Community The Technical Mission team was received by the community
ECORREGIONAL ASSESSMENT: EASTERN CORDILLERA REAL ORIENTAL PARAMOS AND MONTANE FORESTS
 ECORREGIONAL ASSESSMENT: EASTERN CORDILLERA REAL ORIENTAL PARAMOS AND MONTANE FORESTS The Nature Conservancy, EcoCiencia y Fundación AGUA. 2005. Evaluación Ecorregional de los Páramos y Bosques Montanos
United Kingdom. How does Travel & Tourism compare to other sectors? GDP. Size. Share. UK GDP Impact by Industry. UK GDP Impact by Industry
 United Kingdom Stonehenge in Wiltshire Agriculture Automotive Banking Chemicals Communications Education Financial Mining Other Service Manufacturing Manufacturing Services Exports Retail (without wholesale)
Benchmarking Travel & Tourism in Colombia
 Benchmarking Travel & Tourism in Colombia How does Travel & Tourism compare to other sectors? Summary of Findings, November 2013 Sponsored by: Outline Introduction... 3 Colombia summary..... 8 Data sources
INTEGRATION AND TRADE IN THE AMERICAS
 INTER-AMERICAN DEVELOPMENT BANK Department of Integration and Regional Programs Division of Integration, Trade and Hemispheric Issues Institute for the Integration of Latin America and the Caribbean Statistics
RESEARCH & FORECAST REPORT
 Q4 211 OFFICES BOGOTA COLOMBIA RESEARCH & FORECAST REPORT Economic Overview According to the DANE (National Administrative Department of Statistics), in the third quarter of 211, the economy grew 7.7%
NOVEMBER YEAR III LATIN AMERICA&CARIBBEAN MID-MARKETS: OPPORTUNITIES IN THE REGION
 NOVEMBER 2011 - YEAR III MARKETWATCH LATIN AMERICA&CARIBBEAN MID-MARKETS: OPPORTUNITIES IN THE REGION THE REGION IN PERSPECTIVE LAC in Perspective - 2011 Facts % of the world 595 mi people 9,3 $ 5,8 tri
The UNODC-WCO-INTERPOL Airport Communication Project (AIRCOP)
") The UNODC-WCO-INTERPOL Airport Communication Project (AIRCOP) Bo Shakira Harris Project Specialist UNODC Regional Programme Office for the Caribbean in Barbados ICAO TRIP: Making the Air Travel more Secure
The UNODC-WCO-INTERPOL Airport Communication Project (AIRCOP) Bo Shakira Harris Project Specialist UNODC Regional Programme Office for the Caribbean in Barbados ICAO TRIP: Making the Air Travel more Secure
Mexico. How does Travel & Tourism compare to other sectors? GDP. Size. Share. Mexico GDP Impact by Industry. Mexico GDP Impact by Industry
 Mexico Chapultepec Castle in Mexico City Agriculture Automotive Manufacturing Banking Chemicals Manufacturing Communications Education Financial Services Mining Other Service Exports Retail (without wholesale)
Benchmarking Travel & Tourism in Australia
 Benchmarking Travel & Tourism in Australia How does Travel & Tourism compare to other sectors? Sponsored by: Summary of Findings, November 2013 Outline Introduction... 3 Australia summary..... 8 Data sources
MAY The Naya: the disputed drug trafficking route
 MAY 2018 The Naya: the disputed drug trafficking route The Naya is a rural sub-region between the departments of Valle del Cauca and Cauca that is home to coca crops, cocaine production laboratories, and
Mikaela Weisse Scott Kloeck-Jenson Fellowship report Travel Award (2014) Lima, Peru
 Lima, Peru") Mikaela Weisse Scott Kloeck-Jenson Fellowship report Travel Award (2014) Lima, Peru I received a Scott Kloeck-Jenson fellowship to complete an international internship during the summer of 2014. I spent
Mikaela Weisse Scott Kloeck-Jenson Fellowship report Travel Award (2014) Lima, Peru I received a Scott Kloeck-Jenson fellowship to complete an international internship during the summer of 2014. I spent
Colombia. Ministry of Foreign Affairs
 Colombia Ministry of Foreign Affairs With coastlines on both the Pacific and Atlantic oceans, Colombia is an important platform for the region Colombia Visits of President Juan Manuel Santos Calderón to
MULTILATERALISM AND REGIONALISM: THE NEW INTERFACE. Chapter XI: Regional Cooperation Agreement and Competition Policy - the Case of Andean Community
 UNCTAD/DITC/TNCD/2004/7 UNITED NATIONS CONFERENCE ON TRADE AND DEVELOPMENT Geneva MULTILATERALISM AND REGIONALISM: THE NEW INTERFACE Chapter XI: Regional Cooperation Agreement and Competition Policy -
Sugar Cane production in both Haiti and the DR are down. New markets could restore production to historic levels.
 Sugar Cane production in both Haiti and the DR are down. New markets could restore production to historic levels. Sugar Cane Production in Haiti and the DR Dominican Republic 25 Haiti 2 15 1 Hectares Harvested
Month June 2011 South America (except Colombia for HA) Date of submission 01/07/11 MONTHLY REPORT
 Date of submission 01/07/11 MONTHLY REPORT") ANNEX IV-3 EUROPEAN COMMISSION HUMANITARIAN AID OFFICE (ECHO) Monthly report number 2011/6 Month June 2011 Country South America (except Colombia for HA) Date of submission 01/07/11 Author ECHO Quito MONTHLY
ANNEX IV-3 EUROPEAN COMMISSION HUMANITARIAN AID OFFICE (ECHO) Monthly report number 2011/6 Month June 2011 Country South America (except Colombia for HA) Date of submission 01/07/11 Author ECHO Quito MONTHLY
Daniel Titelman Director Economic Development Division
 Daniel Titelman Director Economic Development Division Economic trends in the region continue to be marked by: Uncertainty and risk in the global economy: External demand remains sluggish, which reflects
COUNTRY CASE STUDIES: OVERVIEW
 APPENDIX C: COUNTRY CASE STUDIES: OVERVIEW The countries selected as cases for this evaluation include some of the Bank Group s oldest (Brazil and India) and largest clients in terms of both territory
Colombia. Tourism in the economy. Tourism governance and funding
 Colombia Tourism in the economy Tourism contributed COP 14.1 billion to the Colombia economy in 2014, equivalent to 2.7% of total GDP. It is the country s biggest service export and the third largest sector
Broadband as an opportunity for Development
 Broadband as an opportunity for Development December 2013 Antonio García Zaballos http://www.iadb.org The Inter-American Development Bank Discussion Papers and Presentations are documents prepared by both
Call Center Industry in Colombia
 Call Center Industry in Colombia 2008 1 Colombia was chosen by DIRECTV as one of the options to centralize its Call Center operations, mainly because of the high level of commitment and service attitude
ASSEMBLY 35TH SESSION
 1 27/9/04 ASSEMBLY 35TH SESSION ECONOMIC COMMISSION Agenda Item 27: Regulation of international air transport services, and outcome of the fifth Worldwide Air Transport Conference RIGHTS AND OBLIGATIONS
Tourism as an Economic Pillar. Mary Vrolijk 25 September 2015
 Tourism as an Economic Pillar Mary Vrolijk 25 September 2015 Tourism Trends. Tourism: a key role player in economies. Spinoff effects: Job creation, New small and medium enterprises(sme s), Country competiveness,
Netherlands. Tourism in the economy. Tourism governance and funding
 Netherlands Tourism in the economy The importance of domestic and inbound tourism for the Dutch economy is increasing, with tourism growth exceeding the growth of the total economy in the last five years.
LATIN AMERICAN DRUGS I: LOSING THE FIGHT. Latin America Report N March 2008
 LATIN AMERICAN DRUGS I: LOSING THE FIGHT Latin America Report N 25 14 March 2008 TABLE OF CONTENTS EXECUTIVE SUMMARY AND RECOMMENDATIONS... i I. INTRODUCTION... 2 II. DRUG CROPS AND COCAINE PRODUCTION:
TECHNICAL SEMINAR ON TOURISM INVESTMENTS IN THE AMERICAS Asuncion, Paraguay. May 17-18, 2011
 TECHNICAL SEMINAR ON TOURISM INVESTMENTS IN THE AMERICAS Asuncion, Paraguay May 17-18, 2011 STRUCTURE OF PRESENTATION CONTEXT TOURISM IN THE AMERICAS ROLES OF INSTITUTIONS FOCUS ON OAS AS A MULTILATERAL
Impact vs Census (%) Venezuela Vichada. Guainía. Brazil. Sources: OCHA, SIMCI, IMMAP, DGR, DANE
 Venezuela Vichada. Guainía. Brazil. Sources: OCHA, SIMCI, IMMAP, DGR, DANE") Colombia Floods Situation Report #13 11/1/2011 This report was compiled by OCHA Colombia from official and secondary sources, UN agencies and INGOs. It covers the period from 29/12/2010 to 6/1/2011. The
Colombia Floods Situation Report #13 11/1/2011 This report was compiled by OCHA Colombia from official and secondary sources, UN agencies and INGOs. It covers the period from 29/12/2010 to 6/1/2011. The
Analysing the performance of New Zealand universities in the 2010 Academic Ranking of World Universities. Tertiary education occasional paper 2010/07
 Analysing the performance of New Zealand universities in the 2010 Academic Ranking of World Universities Tertiary education occasional paper 2010/07 The Tertiary Education Occasional Papers provide short
Andean Competitiveness
 Background 1. Poor countries, high income inequality 2. Failure of ISI brought inflation, deep economic crisis and political crisis in the 70s 3. Market oriented economic reforms in the 80s and 90s 4.
SYNOPSIS OF INFORMATION FROM CENSUS BLOCKS AND COMMUNITY QUESTIONNAIRE FOR TONOPAH, NEVADA
 TECHNICAL REPORT UCED 93-04 SYNOPSIS OF INFORMATION FROM CENSUS BLOCKS AND COMMUNITY QUESTIONNAIRE FOR TONOPAH, NEVADA UNIVERSITY OF NEVADA, RENO i Synopsis of Information from Census Blocks and Community
Regional Director Latin America and Caribbean
 U.S. GRAINS COUNCIL Around the world; Around the clock Kurt Shultz Regional Director Latin America and Caribbean Leveraged Funding Non-Cash $7.8 Million Member Cash $5.2 Million FAS Funds $14.8 Million
Regional Activities. 25 June Carlos Vogeler Director Executive Secretary for Members Relations and Regional Director for the Americas UNWTO
 Regional Activities 25 June 214 Carlos Vogeler Director Executive Secretary for Members Relations and Regional Director for the Americas UNWTO UNWTO documents distributed 1. UNWTO Tourism Highlights (214
Colombia Humanitarian Situation. Synopsis July December 2012
 Colombia Humanitarian Situation Synopsis July December 212 Internal Displacement Explosive Devices Natural Disasters Homicides HSRI Explosive Devices 29-212 Victims (212) APM-ERW Source: Programa Presidencial
Economic climate in Latin America improved slightly, despite worsening in Brazil
 August 13 th APRIL/2015 Ifo/FGV Economic Climate Index for Latin America 71 74 JULY/2015 Economic climate in Latin America improved slightly, despite worsening in Brazil The Ifo/FGV Economic Climate Index
VIII MEETING OF NATIONAL COORDINATORS. Pilot Project Program Border Crossings Summary and Conclusions. Jorge H. Kogan
 VIII MEETING OF NATIONAL COORDINATORS Pilot Project Program Border Crossings Summary and Conclusions Jorge H. Kogan Infrastructure Vice-Presidency - DAPS Andean Development Corporation Buenos Aires, June
Contents of the Economic Survey 2012
 Contents of the Economic Survey 2012 I. Macroeconomic trends in Latin America and the Caribbean in 2012 II. Reactions of the countries of the region to the adversities of the global economy III. Savings
Chile. Tourism in the economy. Tourism governance and funding
 Chile Tourism in the economy Tourism in Chile has experienced a sustained rise in recent years and has become one of the sectors delivering the fastest growth and employment generation. It has been estimated
CHAPTER Latin America. Regional Atlas Study Guide. 2 Chapter A. As You Read. B. Reviewing Vocabulary
 CHAPTER 28 9 Many Th ew inventions new Regional Atlas Study Guide Latin America Directions: As you work through the Regional Atlas, complete the chart below by writing two details about each Latin American
Latin America and the Caribbean: Fact Sheet on Economic and Social Indicators
 Latin America and the Caribbean: Fact Sheet on Economic and Social Indicators Dindi R. Robinson Barbara Salazar Torreon May 30, 2013 CRS Report for Congress Prepared for Members and Committees of Congress
Economic Climate Index - Latin America
 Oct-08 Jan-09 Apr-09 Jul-09 Oct-09 Jan-10 Apr-10 Jul-10 Oct-10 Jan-11 Apr-11 Jul-11 Oct-11 Jan-12 Apr-12 Jul-12 Oct-12 Jan-13 Apr-13 Jul-13 Oct-13 Jan-14 Apr-14 Jul-14 Oct-14 Jan-15 Apr-15 Jul-15 Oct-15
Tourism and Wetlands
 CONVENTION ON WETLANDS (Ramsar, Iran, 1971) 43 rd Meeting of the Standing Committee Gland, Switzerland, 31 October 4 November 2011 DOC. SC43-27 Tourism and Wetlands Action requested. The Standing Committee
The Economic Contributions of Agritourism in New Jersey
 The Economic Contributions of Agritourism in New Jersey Bulletin E333 Cooperative Extension Brian J. Schilling, Extension Specialist in Agricultural Policy Kevin P. Sullivan, Institutional Research Analyst
Textile Per Capita Consumption
 January 2018 Textile Per Capita Consumption 2005-2022 Part 2: Upper middle income countries - - CHF500.- Table of Contents Preface... 4 Sources... 5 Definitions... 6 Charts... 7 Executive Summary... 10
Birth Register and Statistics. A big challenge for the Pan American Health Organization (PAHO) Dr Fatima Marinho, HDM/HA Coordinator
 Dr Fatima Marinho, HDM/HA Coordinator") Birth Register and Statistics. A big challenge for the Pan American Health Organization (PAHO) Dr Fatima Marinho, HDM/HA Coordinator Congreso Mundial de Epidemiología. Porto Alegre, Brasil, September 21-25,
Birth Register and Statistics. A big challenge for the Pan American Health Organization (PAHO) Dr Fatima Marinho, HDM/HA Coordinator Congreso Mundial de Epidemiología. Porto Alegre, Brasil, September 21-25,
Latin America s Physical Geography. EQ: What are characteristics of Latin America s physical features?
 Latin America s Physical Geography EQ: What are characteristics of Latin America s physical features? Your Task: We are going to participate in a Museum Walk! You will travel around the room with a partner
MEETING CONCLUSIONS. Andean South America Regional Meeting Lima, Peru 5-7 March ECOTOURISM PLANNING
 MEETING CONCLUSIONS Andean South America Regional Meeting Lima, Peru 5-7 March 2002 1.0 ECOTOURISM PLANNING 1.1 Protected Areas Ecotourism in Protected Areas is part of an integrated vision of tourism
En Terreno. WCS Colombia Newsletter November No
 En Terreno WCS Colombia Newsletter November 2016- No. 10 Quebrada Yanacué - (Cantagallo, Bolívar) another landscape of the serranía de San Lucas. Photo: Luz Dary Acevedo - WCS Colombia Green iguana (Iguana
PAHO Regional Perspective: Strengthening CR-VS in the Americas
 PAHO Regional Perspective: Strengthening CR-VS in the Americas Alejandro Giusti. Regional Advisor in Vital and Health Statistics s (PAHO) Strengthening Civil Registration World Bank, Washington, June 9,
UN-GGIM:Americas. UN-GGIM Expanded Bureau Meeting 7-9 December 2016, UN Headquarters New York. Rolando Ocampo President of UN-GGIM:Americas
 UN-GGIM:Americas UN-GGIM Expanded Bureau Meeting 7-9 December 2016, UN Headquarters New York Rolando Ocampo President of UN-GGIM:Americas Antigua and Barbuda 38 Member States Argentina Bahamas Belize Bolivia
State of the States October 2017 State & territory economic performance report. Executive Summary
 State of the States October 2017 State & territory economic performance report. Executive Summary NSW ON TOP; VICTORIA CLOSES IN How are Australia s states and territories performing? Each quarter CommSec
Colombia: An Upcoming Emerging Market for International Investors April 2012
 Colombia: An Upcoming Emerging Market for International Investors April 2012 Proexport is the organization within the Colombian Government responsible for the promotion of International Tourism, Foreign
Mrs. Reifsnyder World Geography. Unit 8: Latin America Study Guide SOLs Addressed: WG. 1c, 2b, 3c, 4, 10b/c
 Mrs. Reifsnyder World Geography Unit 8: Latin America Study Guide SOLs Addressed: WG. 1c, 2b, 3c, 4, 10b/c Essential Questions: - In what ways do physical, economic, and cultural characteristics influence
WORLDWIDE AIR TRANSPORT CONFERENCE (ATCONF) SIXTH MEETING. Montréal, 18 to 22 March 2013
 SIXTH MEETING. Montréal, 18 to 22 March 2013") ATConf/6-IP/13 7/3/13 WORLDWIDE AIR TRANSPORT CONFERENCE (ATCONF) SIXTH MEETING Montréal, 18 to 22 March 2013 Agenda Item 2: Examination of key issues and related regulatory framework Agenda Item 2.1 :
ATConf/6-IP/13 7/3/13 WORLDWIDE AIR TRANSPORT CONFERENCE (ATCONF) SIXTH MEETING Montréal, 18 to 22 March 2013 Agenda Item 2: Examination of key issues and related regulatory framework Agenda Item 2.1 :
Latin America: Outlook and Challenges Alejandro Werner Director Western Hemisphere Department
 International Monetary Fund Washington, DC. May, 3 Latin America: Outlook and Challenges Alejandro Werner Director Western Hemisphere Department Developments and Outlook Policy Challenges and Priorities
A practical approach to SMS implementation Colombian Civil Aviation Authority
 A practical approach to SMS implementation Colombian Civil Aviation Authority Colonel (r) Miguel Camacho Martinez Chief, Safety Management Systems Regional Aviation Safety Group Pan America (RASG-PA) Workshop