Investor Presentation. Please find attached a presentation which will be provided at a Transurban investor day today.
|
|
|
- Kelly Mosley
- 5 years ago
- Views:
Transcription
1 asx release 28 March 2011 Investor Presentation Please find attached a presentation which will be provided at a Transurban investor day today. A recording of this presentation will be uploaded to the Transurban website following completion of the presentation. Amanda Street Company Secretary Investor & media enquiries Wesley Ballantine +61 (0) General Manager, Investor Relations, Media and Government Classification Transurban Group Transurban International Limited ARBN Transurban Holdings Limited ABN Transurban Holding Trust ABN ARSN @transurban.com.au Records Management Document F RMGR 8FA7HJ Level Little Collins Street Melbourne Victoria 3000 Australia Telephone Facsimile Level 5 50 Pitt Street Sydney NSW 2000 Australia Telephone Facsimile

2 TRANSURBAN 2011 INVESTOR DAY 28 MARCH 2011
3 DISCLAIMER This publication is prepared by the Transurban Group comprising Transurban Holdings Limited (ACN ), Transurban Holding Trust (ARSN ) and Transurban International Limited (ARBN ). The responsible entity of Transurban Holding Trust is Transurban Infrastructure Management Limited (ACN ) (AFSL ). No representation or warranty is made as to the accuracy, completeness or correctness of the information contained in this publication. To the maximum extent permitted by law, none of the Transurban Group, its directors, employees or agents or any other person, accept liability for loss arising from or in connection with this publication including without limitation, any liability arising from fault or negligence. The information in this publication does not take into account individual investment and financial circumstances and is not intended in any way to influence a person dealing with a financial product, nor provide financial advice. It does not constitute an offer to subscribe for securities in the Transurban Group. Any person intending to deal in Transurban Group securities is recommended to obtain professional advice. United States These materials do not constitute an offer of securities for sale in the United States, and the securities referred to in these materials have not been and will not be registered under the United States Securities Act of 1933, as amended, and may not be offered or sold in the United States absent registration or an exemption from registration. Copyright Transurban Limited ABN All rights reserved. No part of this publication may be reproduced, stored in a retrieval system, or transmitted in any form or by any means, electronic, mechanical, photocopying, recording or otherwise, without the written permission of the Transurban Group. 1
4 INTRODUCTION WESLEY BALLANTINE GM INVESTOR RELATIONS, MEDIA AND GOVERNMENT
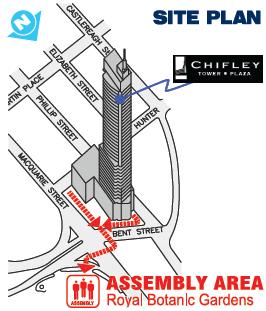

5 EVACUATION PLAN 3
6 AGENDA TIME PRESENTATION SPEAKER 9:30am Introduction, safety and logistics Wesley Ballantine GM Investor Relations, Media and Government 9:35am Strategy and corporate overview Chris Lynch Chief Executive Officer 10:00am 10:45am 11:00am 11:45am 12noon Victorian market update Break NSW market update US market update Capital Beltway Elizabeth Mildwater Group GM, Victoria Andrew Head Group GM, NSW Michael Kulper President, North America Ken Daley President, International Development 12:45pm Conclusion Chris Lynch 1:00pm 1:45pm Lunch break Road Tour 4
7 STRATEGY AND CORPORATE OVERVIEW CHRIS LYNCH CHIEF EXECUTIVE OFFICER

8 STRATEGY NO CHANGE FOCUS ON IMPLEMENTATION Diagrammatic depiction rather than actual depiction of incremental value / cash flow benefits 6
9 TCL INVESTMENT PROPOSITION Strong free cash growth Premium ASX defensive exposure Track record of distribution growth Strong growth pipeline in place Proven VOLUME GROWTH PRICE INCREASES at CPI or better COST BASE that can be leveraged EBITDA CAGR of 10.8% over last 3 years Robust balance sheet of 2.7x interest cover ratio Fully cash backed distributions Distribution guidance of at least 26 cents confirmed for FY11 $4.5 billion capex at work Remain open to value accretive opportunities 7
10 ASSET SNAPSHOT STRONG EBITDA GAINS ACROSS PORTFOLIO CityLink delivers double digit growth on all measures CityLink, M1 ED and M7 deliver double digit toll revenue growth CityLink, M1 ED and Pocahontas deliver double digit EBITDA growth HALF ENDED 31 DECEMBER 2010 % OF PROP TOLL REVENUE TRAFFIC GROWTH (%) TOLL REVENUE GROWTH (%) EBITDA GROWTH (%) 48.8% CityLink 11.4% 15.4% 14.4% 16.6% Hills M2 1.9% 3.5% 6.3% 5.2% Lane Cove Tunnel 6.0% N/A N/A 7.9% M1 Eastern Distributor 3.0% 12.9% 22.2% 10.8% Westlink M7 7.0% 10.3% 9.0% 9.5% M5 1.6% 3.2% (1.3%) 1.3% Pocahontas (USD) 2.9% 1.5% 178.7% Total Transurban Group N/A 15.4% 17.0% 1 1. EBITDA growth calculated on underlying proportional EBITDA from the continuing portfolio. 8
 securities on issue 13.1 12.5 4.")
11 FREE CASH FLOW 16.6% INCREASE, DISTRIBUTION GUIDANCE CONFIRMED DISTRIBUTION FREE CASH FLOW 31 DEC 10 ($M) 31 DEC 09 ($M) % change Free cash Free cash per security (cents) securities on issue Distribution guidance for FY11 confirmed to be at least 26 cents per security Board policy - distributions aligned with free cash 9


12 ORGANISATIONAL STRUCTURE Chris Lynch Chief Executive Officer Samantha Hogg Group GM, Corporate Services Elizabeth Mildwater Group GM, VIC Tom Honan Chief Financial Officer Ken Daley President, International Development Andrew Head Group GM, NSW Michael Kulper President, North America 10

13 DELIVERING Growth pipeline delivering FY2011 benefits are being realised M2 Upgrade construction has commenced Capital Beltway construction progressing well M5 widening discussions ongoing * Proportional toll revenue excluding the M4 11
14 VICTORIA MARKET UPDATE ELIZABETH MILDWATER, GROUP GENERAL MANAGER VICTORIA
15 AGENDA 1. Safety 2. CityLink Overview 3. Performance 4. M1 Upgrade 5. Ongoing activities 13

16 LAST SATURDAY.. 14

17 SAFETY FIRST M1 Upgrade - 1,000,000 man hours of construction work completed with ZERO LTIs On Southern Link outbound, the monthly accident rate has decreased 64% post construction Safety improvements have come from Congestion reduction Lane use management signs Ramp metering Dynamic control New Freeway Management System improving safety across Southern Link 15

18 CITYLINK OVERVIEW KEY INFRASTRUCTURE FOR MELBOURNE 22km motorway 2 state-of-the-art tunnels each with 3 lanes Fully opened December 2000 Concession until % electronically tolled Key facts Over 250 million transactions annually with highest daily of 936,000 reached recently 1.5 million e-tags 900,000 + customer accounts 34,000 + casual motorists a week Less than 4% No arrangements 16
19 VICTORIA P&L RESULTS 1 st HALF 2011 RESULTS HIGHLIGHTS P&L AND TRAFFIC HIGHLIGHTS PROFIT AND LOSS 31 DEC DEC 10 ($M) 31 DEC 09 ($M) % CHANGE Traffic Revenue Traffic Growth (Half Year) 11.4% 1 Traffic Growth (Quarter) 12.8% 1 Toll revenue Toll Revenue Growth (Half Year) 15.4% 2 EBITDA EBITDA Growth (Half Year) 14.4% Strong performance across CityLink CityLink Upgrade benefits evident Value Framework Initiatives delivering Toll Revenue % Fee and other revenue % Total revenue % Total Cost (50.8) (47.9) 6.1% EBITDA % EBITDA Margin 86.0% 85% Depreciation and amortisation (87.6) (77.5) 13.0% Net Finance costs (39.4) (45.3) (13.0%) Profit before tax % Income tax benefit (Expense) (3.7) 16.3 (122.7%) Net profit (1.0%) 1. Prior comparative period (2009) impacted by construction activity 2. Excluding the impact of the revenue protection provision in the prior comparative period. Including the provision, toll revenue increased 12.6% 17
20 VICTORIA P&L RESULTS 1 st HALF 2011 RESULTS HIGHLIGHTS P&L AND TRAFFIC CITYLINK TOLL REVENUE GROWTH ANALYSIS CITYLINK TRAFFIC GROWTH 18% 16% 14% 12% 10% 11.4% 4.5% (0.6%) (0.0%) 0.0% 15.4% ADT GROWTH 1 ST HALF FY11 VERSUS FY10 % increase Western Link inbound 6.4% Western Link outbound 8.5% 8% Domain tunnel 16.4% 6% Burnley tunnel 14.7% 4% Southern Link inbound (excl Domain Tunnel) 12.7% 2% Southern Link outbound (excl Burnley Tunnel) 16.2% 0% Traffic growth Toll escalation Trip mix Class mix Revenue recovery Toll revenue growth 18
21 M1 UPGRADE OVERVIEW - RECAP BENEFITS OF THE UPGRADE Capacity improvement Traffic volumes Revenue Investor value Travel times Safety 19

22 M1 UPGRADE OVERVIEW SCOPE AND COMPLETION DATES Westgate Freeway Complete Westgate Freeway Upgrade incl additional ramps and lane redesign Southern Link Upgrade Outbound Complete 14 Dec 2009 Burnley Tunnel 3 rd Lane entry opened 26 Aug 2010 Inbound Complete 3rd Oct 2010 Southern Link Upgrade Additional Lane, strengthening works, better use of tunnel capacity Westgate Bridge Upgrade - additional lane Westgate Bridge Due Mid 2011 Freeway Management System In place Monash Upgrade Complete Monash Upgrade Additional lane to and from Heatherton Rd BENEFITS OF THE UPGRADE Capacity improvement Traffic volumes Revenue Investor value Travel times Safety Freeway Management System Lane Usage controls, Ramp Metering, optimised traffic flow, across road network 20

23 M1 UPGRADE WEST GATE FREEWAY AND CITYLINK TUNNELS 1. Exit off Bolte Bridge to West Gate Freeway and Burnley Tunnel 2. West Gate Freeway 3. Burnley Tunnel entrance Domain tunnel to West Gate Freeway 21

24 M1 UPGRADE BOLTE BRIDGE WEST GATE FREEWAY INTERCHANGE Three dedicated lanes exit Bolte Bridge: West Gate Freeway Westbound Burnley Tunnel Kings Way and city centre Removed need for weaving Traffic growth on Western Link impacting traffic on Bolte Bridge 22

25 M1 UPGRADE WEST GATE FREEWAY Weaving reduced along West Gate Freeway Dedicated lanes allowing free flow traffic 23

26 M1 UPGRADE CITYLINK TUNNELS A B Three lanes now enter Burnley Tunnel from the West Gate Freeway (previously 2) Burnley Tunnel entrance from the CBD moved from A to B above Ramp metering on Kings Way entrance monitors traffic flow in tunnels Westbound traffic has dedicated lanes exiting the tunnels towards the West Gate Bridge 24

27 M1 UPGRADE SOUTHERN LINK UPGRADE DOMAIN TUNNEL ENTRANCE BURNLEY TUNNEL EXIT Four lanes in each direction east of the CityLink Tunnels 25


28 M1 UPGRADE FREEWAY MANAGEMENT SYSTEM 26
29 Jul-07 Aug-07 Sep-07 Oct-07 Nov-07 Dec-07 Jan-08 Feb-08 Mar-08 Apr-08 May-08 Jun-08 Jul-08 Aug-08 Sep-08 Oct-08 Nov-08 Dec-08 Jan-09 Feb-09 Mar-09 Apr-09 May-09 Jun-09 Jul-09 Aug-09 Sep-09 Oct-09 Nov-09 Dec-09 Jan-10 Feb-10 Mar-10 Apr-10 May-10 Jun-10 Jul-10 Aug-10 Sep-10 Oct-10 Nov-10 Dec-10 Jan-11 Travel Time (mm:ss) M1 UPGRADE BENEFITS EVIDENT - TRAVEL TIME SAVINGS 25:00 SOUTHERN SouthernLink/West LINK / WEST GATE Gate Westbound WESTBOUND PM Peak PM PEAK - Travel Time TRAVEL TIME 22:30 20:00 17:30 15:00 12:30 10:00 7:30 5:00 2:30 0:00 SouthernLink Inbound Domain Tunnel to Bolte Bridge 27
30 Jul Dec M1 UPGRADE BENEFITS DELIVERING AS EXPECTED Actual traffic growth 16% 14% 12% 10% 8% 6% 4% 2% Growth strong over past 12 months, in line with expectations Reaffirms expected 7% uplift by 2016 Moving to a sustainable growth profile 0% (2%) (4%) FY03 FY04 FY05 FY06 FY07 FY08 FY09 FY10 ADT Growth (Qtrly) Monthly ADT growth WITH PROJECT ADT 7% uplift in 2016; 5 years after completion NO PROJECT ADT Forecast uplift from Monash-CityLink-West Gate Upgrade project 28


31 M1 UPGRADE - SOUTHERN LINK ADDITIONAL WORKS CONTINUE THE FINAL PIECES Works associated with Southern Link original scope are complete Under road strengthening works are ongoing with no impact on traffic. Final asphalting works to be undertaken - to fit around peak periods using the Freeway Management System for managing lane diversions 29

32 MELBOURNE BROADER GOVERNMENT PLANS 30
33 CONCLUSION M1 Upgrade works are substantially complete Benefits are delivering as expected moving towards sustainable growth profile Freeway Management System (FMS) improving Congestion Safety Driver experience Travel times Next steps consideration of Western Link improvements including potential implementation of FMS 31

34 NSW MARKET UPDATE ANDREW HEAD, GROUP GENERAL MANAGER NSW
35 AGENDA 1. Safety 2. NSW overview 3. Performance 4. M2 Upgrade 5. LCT Integration 6. M5 Widening 7. Future development of the Sydney orbital network 33
 Hills M2 will reach 5 years LTI free in April 2011")
36 SAFETY Constructors on the M2 Upgrade project have reached 80,000 man hours with no Lost Time Injuries (LTI) Hills M2 will reach 5 years LTI free in April
 Westlink M7 (50%) M5 (50%) Ownership and operation of two tolling brands Roam Roam Express Mixture of fully electronic tolling and combined electronic")
37 NSW OVERVIEW MANAGING THE SYDNEY ORBITAL Ownership interest in 5 toll road assets Hills M2 (100%) Lane Cove Tunnel (100%) M1 Eastern Distributor (75.1%) Westlink M7 (50%) M5 (50%) Ownership and operation of two tolling brands Roam Roam Express Mixture of fully electronic tolling and combined electronic and cash 35
38 NSW P&L RESULTS 1 st HALF 2011 RESULTS HIGHLIGHTS P&L AND TRAFFIC TRAFFIC AND REVENUE GROWTH PROFIT AND LOSS 31 DEC 10 Traffic and revenue growth TRAFFIC GROWTH (%) REVENUE GROWTH (%) Hills M2 1.9% 3.5% Lane Cove Tunnel 6.0% N/A M1 Eastern Distributor 3.0% 12.9% Westlink M7 7.0% 10.3% M5 1.6% 3.2% Strong revenue growth Lane Cove integrated well Developing existing assets is the focus Revenue 31 DEC 10 ($M) 31 DEC 09 ($M) % CHANGE Toll Revenue % Fee and other revenue % Total revenue % Total Cost (58.5) (53.0) 10.4% EBITDA % EBITDA Margin 81.7% 82.9% Depreciation and amortisation (101.7) (107.7) (5.6%) Net Finance costs (85.4) (77.5) 10.2% Profit before tax (4.7) (5.7) (17.5%) Income tax benefit (Expense) (8.8) (22.2) (60.4%) Net profit (13.4) (27.9) (52.0%) NSW P&L data represents the results for the NSW segment and includes the contribution of Hills M2, Lane Cove Tunnel, M1 Eastern Distributor, M4 (comparative period only), M5, M7, Roam and Tollaust proportional to Transurban ownership. 36

39 M2 UPGRADE CONSTRUCTION COMMENCED SCOPE OF WORKS M2 UPGRADE SCOPE OF WORKS Herring Rd / Christie Rd Ramps IPA AWARD Western Zone Central Zone Eastern Zone Tunnel Zone Windsor Rd Ramps 37
40 Traffic (AADT -all toll points) M2 UPGRADE FORECAST UPLIFT M2 Upgrade commenced construction January 2011 Disruption to revenue during construction allowed for in business case and partially offset by additional revenue from early opening of new ramps Contractor incentives to minimise disruption No Project With Project (including new toll ramps) 16.1% Traffic uplift (AADT) of 16.1% by 2016 Construction impact similar to CityLink Upgrade Year Note: Toll rates vary at each toll point Chart is indicative only. 38
41 FY11 Q3 FY11 Q4 FY12 Q1 FY12 Q2 FY12 Q3 FY12 Q4 FY13 Q1 FY13 Q2 FY13 Q3 Q3 FY11 Q4 FY11 Q1 FY12 Q2 FY12 Q3 FY12 Q4 FY12 Q1 FY13 Q2 FY13 Q3 FY13 M2 UPGRADE TIMING AND IMPACT OF WORKS WORKS (INDICATIVE TIMING) Windsor Rd Ramps FY11 H2 FY12 H1 FY12 H2 Open FY13 H1 FY13 H2 Disruption to revenue during construction allowed for in business case Herring Rd /Christie Rd Ramps Open Other Zones Open INDICATIVE TIMING OF TRAFFIC IMPACT 0.0% (1.0%) (2.0%) (3.0%) (4.0%) (5.0%) (6.0%) (7.0%) (8.0%) 6.0% 4.0% 2.0% 0.0% (2.0%) (4.0%) (6.0%) (8.0%) (10.0%) Impact Existing New Ramps Net impact 6.0% 4.0% 2.0% 0.0% (2.0%) (4.0%) (6.0%) (8.0%) (10.0%) 39

 consolidation of back office tolling systems (subject to further consideration and RTA")
42 LCT INTEGRATION EBITDA MARGIN DELIVERED Transurban reduced the cost base of Lane Cove Tunnel CHANGE IN LANE COVE TUNNEL EBITDA MARGIN Reduction in salary costs Review of maintenance capital expenditure Reduction in administration costs Renegotiation of operations and maintenance contract Further opportunities to save alignment of O&M contracts (M2 and LCT) unlikely before M2 Upgrade construction completion amalgamation of control rooms (subject to further consideration and RTA approval) consolidation of back office tolling systems (subject to further consideration and RTA approval) 40
43 LCT INTEGRATION STRONG TRAFFIC GROWTH LCT/MRE HISTORICAL AADT FY08 Q1 52,250 Q2 56,422 Q3 57,643 Q4 59,641 FY09 Q1 59,847 Q2 60,661 Q3 60,471 Q4 62,408 FY10 Q1 65,097 Q2 66,066 Q3 65,803 Q4 66,694 FY11 Q1 69,281 Q2 70,017 Strong growth continued at both toll points since TCL acquired asset Traffic impact expected on LCT from M2 Upgrade construction No works occurring at motorway interface Discussions ongoing in relation to Lane Cove Road east facing ramp 41
44 M2 LCT CORRIDOR TRAFFIC FLOW EASTBOUND 34% WM7 66% M2 M2 M2 Toll Plaza 30% WM7 70% M2 Lane Cove Tunnel Legend Traffic Originating From: WM7 M2 Lane Cove 24% WM7 36% M2 40% Lane Cove 42
 went on public exhibition in September 2010 Widening business case supportable independent of any future potential M5 East tunnel")
45 M5 WIDENING FOCUS ON UPGRADE Interlink Roads (ILR) has submitted two proposals to the RTA Pre Commitment Agreement (PCA) signed with RTA in August 2010 includes provision of development cost reimbursement Environmental Assessment (EA) went on public exhibition in September 2010 Widening business case supportable independent of any future potential M5 East tunnel duplication 43

46 M5 WIDENING FOCUS ON UPGRADE Commitment from incoming Coalition Government to complete negotiations and fast track the project M5 widening part of Coalition s Contract with NSW people 44

47 WESTLINK M7 STRONG DEMOGRAPHIC GROWTH August NSW Government to rezone 800 hectares within the Western Sydney Employment Area (WSEA) capacity for up to 16,500 jobs Expected to eventually accommodate ~ 40,000 workers Strong take up of vacant land continues along M7 corridor Erskine Park Link Road will link new employment areas to WM7 construction to commence within six months Westlink M7 Erskine Park Link Rd M4 45

48 SYDNEY FUTURE DEVELOPMENT OF SYDNEY ORBITAL NETWORK F3-M2 M4 East M5 East Duplication A NSW Liberals & Nationals Government will commence one of Sydney s major missing road links in our first term of Government with the appropriate project to be identified by Infrastructure NSW Source: NSW Liberals & Nationals Congestion Busting Plan for Reducing Travel Times 46
49 CONCLUSION M2 Upgrade currently the focus of development works Progressing well M5 widening business case is strong, discussions with new State Government now required Lane Cove Tunnel an integral part of the network Further network opportunities possible Strong half year result despite LCT being included for less than 5 months 47
50 US MARKET UPDATE MICHAEL KULPER, PRESIDENT NORTH AMERICA
51 POCAHONTAS UPDATE 49
 178.7% * Compared to the comparative six month period ended 31 Dec 2009 Peak pricing toll increased 7 Feb 2011 $0.25 car increase peak hours (6-9am, 3-6pm ) $0.")
52 POCAHONTAS 895 FOCUSSED ON COST REDUCTION AND REVENUE ENHANCEMENT SNAPSHOT OF FINANCIAL RESULTS 31 DEC 10 (1 st Half FY2011) GROWTH (%) * Traffic growth 2.9% Revenue growth (USD) 1.5% EBITDA growth (USD) 178.7% * Compared to the comparative six month period ended 31 Dec 2009 Peak pricing toll increased 7 Feb 2011 $0.25 car increase peak hours (6-9am, 3-6pm ) $0.25 increase for 3+ axle vehicles (all times) Economic climate in the Richmond area difficult but improving Longer term asset performance dependent on regional development 50

53 ASSET ENHANCEMENTS RICHMOND AIRPORT CONNECTOR 1.6 miles long, 4 lane project Opened 2 months early 6% under budget Outstanding safety record 668 days without a lost time incident Financed with concessional TIFIA loan Adding Value to travellers Trip to the airport shortened by up to 10 minutes and offering a congestion-free route 51
54 I-95 PROJECT UPDATE 52
55 PROJECT TIMELINE I-95 HISTORY Fluor TCL preferred developer Interim (Development) Agreement Signed Environment Review Process Started January - Environmental Clearance Achieved August - Lawsuit filed challenging validity of Environmental Process February - New scope and enviro. process announced Virginia Legislature approves transport funding package Arlington withdraws lawsuit March - Local jurisdictions approve project inclusion into regional plans

56 PROJECT RATIONALE Second leg of Northern Virginia HOT Lane network links directly into Capital Beltway HOT Lanes Solves problems that commuters will pay for Congestion relief Access to activity centres Attractive corridor characteristics Lack of alternate routes Favourable demographics / land use development Large influx of military jobs Negotiated transaction
57 PROJECT SCOPE CONTINUING OUR US FOOTPRINT
58 PROJECT SCOPE CONTINUING OUR US FOOTPRINT Existing HOV service; 30-miles, 2 reversible lanes
59 PROJECT SCOPE CONTINUING OUR US FOOTPRINT Existing HOV service; 30-miles, 2 reversible lanes Add 3 rd lane for 14 miles and improve existing HOV lanes
60 PROJECT SCOPE CONTINUING OUR US FOOTPRINT Existing HOV service; 30-miles, 2 reversible lanes Improve existing HOV lanes; 6 miles Add 3 rd lane for 14 miles and improve existing HOV lanes
61 PROJECT SCOPE CONTINUING OUR US FOOTPRINT Existing HOV service; 30-miles, 2 reversible lanes Improve existing HOV lanes; 6 miles Construct 9 mile extension; 2 reversible lanes Add 3 rd lane for 14 miles and improve existing HOV lanes

62 PROJECT SCOPE CONTINUING OUR US FOOTPRINT 8 new access points Existing HOV service; 30-miles, 2 reversible lanes Improve existing HOV lanes; 6 miles Construct 9 mile extension; 2 reversible lanes Add 3 rd lane for 14 miles and improve existing HOV lanes
63 OUTLOOK Governor, Transportation Secretary on record supporting project and public funding requirement A meaningful public funding contribution will be required Regulatory process now in train VDOT has indicated a desire to commence construction in 2012 Negotiation of contract terms and financial arrangements unlikely to be finalised until regulatory processes complete (timing uncertain)

64 CAPITAL BELTWAY HOT LANES PROJECT UPDATE KEN DALEY, PRESIDENT INTERNATIONAL DEVELOPMENT


65 SAFETY FOCUS ORANGE CONES NO PHONES Award-winning Transurban safety campaign aimed at curbing distracted driving in construction work zone, addressing top safety issue Partnership with AAA, law enforcement and other key stakeholders 2011 Employer Challenge recruited more than 100 top employers, directly reached 100,000 Beltway commuters SIGNAGE On-road signage reaches Beltway drivers in the construction zone. GOVERNMENT SUPPORT American Association of State Highway and Transportation Officials rolling out program nationwide Virginia Secretary of Transportation Sean T. Connaughton supports program, challenges region s employers. 63

66 CAPITAL BELTWAY THE PROJECT Construction of 14 miles of electronically tolled HOT lanes between the Springfield Interchange and north of the Dulles Toll Road Two new lanes in each direction, increasing the number of lanes to 12 Upgrades to 11 interchanges involving 53 bridges and a fifth level to the Springfield Mixing Bowl Dynamic toll pricing to manage traffic and maintain free-flow conditions 64

67 CAPITAL BELTWAY THE PROJECT 65

68 CAPITAL BELTWAY THE PROJECT Transurban is the supplier of the tolling and traffic management system as a subcontractor Multi lane free flow tolling similar to Melbourne CityLink architecture Advanced traffic monitoring and incident management All vehicles required to have a tag Toll prices are not regulated tolls will be dynamically set to maintain free flow conditions in HOT Lanes Tolling and traffic management system is based on a working platform Fully electronic tolling on the HOT Lanes will allow customers to pay tolls with E- ZPass eliminating the need to stop or slow down at toll booths. 66
69 CAPITAL BELTWAY THE PROJECT Major construction on a route carrying 200,000 vehicles per day Market research provides a guide to acceptance of the project Two-thirds (66%) of Beltway Drivers have a positive image of HOT Lanes Almost two-thirds (64%) say they see a personal benefit from HOT Lanes 79% surveyed see a benefit for the DC region Response to the question Which one of the following issues do you view as the biggest problem you face living in the Greater Washington, DC area? Source: Greater Washington 2050 Coalition, February
70 CAPITAL BELTWAY HOT LANES REGIONAL ECONOMICS 68


71 CAPITAL BELTWAY LOCATION The Capital Beltway was constructed in 1964, widened in 1977 The Beltway provides a vital link in the region s surface transportation network Daily traffic on the Northern Virginia segment of the Beltway has tripled since it was expanded in 1977 Severe congestion is projected to become worse due to anticipated regional population and economic growth 69

72 WASHINGTON REGIONAL STATUS POPULATION AND EMPLOYMENT Washington population (2010) was 6.6 million providing employment for 3.9 million WASHINGTON DC AND SURROUNDING COUNTIES MWCOG 2010 forecasts show strong growth over the planning horizon MILLIONS Population Employment Households MWCOG Metropolitan Washington Council of Governments 70
 behind San Francisco Washington is the fifth largest regional")
73 WASHINGTON REGIONAL STATUS WEALTH Average annual Gross Regional Product (GRP) growth of 5.3% since GRP of $443billion which has doubled in the last 12 years Second highest GRP per capita in the US ($71,323 in 2009) behind San Francisco Washington is the fifth largest regional economy in the US Counties in the Washington Region make up 4 of the top 10 US counties per household income 71
74 WASHINGTON REGIONAL STATUS CONGESTION - WORST IN THE US Urban Area Yearly Delay per Auto Commuter Travel Time Index Excess Fuel per Auto Commuter Hours Rank Value Rank Gallons Rank Dollar s Very Large Average (15 areas) ,166 Congestion Cost per Auto Commuter Washington DC-VA-MD ,555 2 Chicago IL-IN ,738 1 Los Angeles-Long Beach-Santa Ana CA ,464 3 Houston TX ,322 4 San Francisco-Oakland CA ,112 6 Dallas-Fort Worth-Arlington TX ,077 8 Boston MA-NH-RI ,112 6 Atlanta GA , Seattle WA , New York-Newark NY-NJ-CT Miami FL Philadelphia PA-NJ-DE-MD San Diego CA Phoenix AZ Detroit MI Rank 72

75 Unemployment Rate (%) FAIRFAX COUNTY SPECIFIC DEMOGRAPHICS Fairfax County: has a population of over 1 million people and the County budget is larger than that of 8 States is home to 4,000 technology companies and 22,000 businesses including five Fortune 500 companies 12 HOUSEHOLD WEALTH United States United States $50, 221 $50, 221 Fairfax $102,499 Fairfax Rank: 2 $102,499 Rank: 2 Source: American 2009 Source: American Community Survey 2009 ANNUAL UNEMPLOYMENT RATES is one of the largest suburban office markets in the US 95 million square feet of office space has the second highest household income in the US behind the adjacent county (Loudoun) has one of the lowest unemployment rates in the US National Fairfax County, VA 73
76 12 AM 2 AM 4 AM 6 AM 8 AM 10 AM 12 PM 2 PM 4 PM 6 PM 8 PM 10 PM Traffic (vehicles) 12 AM 2 AM 4 AM 6 AM 8 AM 10 AM 12 PM 2 PM 4 PM 6 PM 8 PM 10 PM Speed (mph) TRAFFIC PROFILE NORTH OF DULLES TOLL ROAD - SB Average speeds have declined over recent years Speeds during the peak periods regularly drop to or below mph Average traffic volumes have remained unchanged despite the impact of major construction works Traffic levels within the peak periods remain at or above the capacity of the facility 9,000 8,000 7,000 6,000 5,000 4,000 3,000 2,000 1,000 0 Hour Beginning 74
77 Springfield Interchange Braddock Rd SR 236 Gallows Rd SR 50 I-66 SR 7 SR 123 Dulles Toll Road SR 193 GW Pkwy Miles per Hour TRAFFIC PROFILE High traffic volumes result in low speeds, slow travel, and significant delays in peak periods Significant delays are experienced for 2-3 hours in peak periods each weekday Fringe periods exhibit significant variance in travel times, which leads to uncertainty in trip duration Speeds regularly drop below 20 miles/hour for over half the length of the project; resulting in moving queues over 7 miles in length NORTHBOUND TRAVEL TIMES (2004) Distance (Miles) 6:21 AM 7:03 AM 8:03 AM 9:05 AM Small differences in departure time often result in significant variations in travel time; making travel inconsistent and unreliable 75
78 TRAFFIC & REVENUE UPDATE Traffic and revenue study completed prior to Financial Close in 2007 / Original study completed by Stantec (managed by Transurban) and audited by Arup MWCOG released updated regional land use forecasts in late 2010 these inputs are being used to complete an updated traffic and revenue study (taking into account US recession) Other specific updated assumptions include Local land use (Northern Virginia) Network planning updates Update to be completed towards end of financial year 76
79 CAPITAL BELTWAY HOT LANES CONSTRUCTION PROGRESS UPDATE 77
80 CONSTRUCTION UPDATE Design Build Contractor and Independent Engineer forecasting on time & on budget completion. DB contract now more than 60% complete. There are no Design Builder claims against the Project company All design is complete and approved for construction drawings issued All Right of Way has been acquired Services relocation is proceeding to schedule HOT Lanes Operation Centre development on time & budget 78

81 CONSTRUCTION UPDATE The 2010 Construction season was a big year One lost time injury the second on the project in over 4.5 million man hours worked Over 35,000 cubic m of concrete 250,000 tons of asphalt 4,200 tons of steel erected 42,000 square m of retaining walls 10,000 linear m of sound walls More than 28% of overall DB contract completed 79


82 THE PROJECT VIEW 80


83 THE PROJECT VIEW 81

84 SR91 EXPRESS CASE STUDY 82

85 SR91 EXPRESS LANES The SR91 facility links the counties of Riverside and Orange in California SR91 Express The SR91 is a 10 mile HOT lane system that has 2 tolled lanes in each direction The HOT Lanes were opened to the public in December 1995 Free flow tolling approaches are used to eliminate toll booths Toll rates are fixed via schedules for each hour and day of the week While SR91 applies simpler tolling than Capital Beltway will, it represents the closest match in terms of scale and operations Note SR91 is not a directly comparable tolling asset to Capital Beltway however has been used for comparative illustrative purposes. 83
86 Unemployment Rate (%) SR91 CATCHMENT DEMOGRAPHICS The SR91 is predominantly seen as a commuter route between Riverside and Orange counties Household Wealth United States $50, $50, Annual Unemployment Rates A comparison between the SR91 catchment and Fairfax (the key County for the Capital Beltway) demonstrates the relative strength of the CB catchment Household wealth is significantly greater than SR91 and national values Riverside Riverside $55,352 $55,352 Rank: 220 Rank: 220 Orange $71,865 Rank: Fairfax Fairfax $102,499 $102,499 Rank: 2 Rank: 2 Source: American Community Survey Riverside County, CA Orange County, CA Unemployment rates are substantially below the SR91 catchment and national averages National Fairfax County, VA Source: Bureau of Labor Statistics 84
87 Annual Growth Annual Operating Revenue (Millions) Annual Trips (millions) SR91 TRAFFIC AND REVENUE GROWTH $60 16 The SR91 has shown strong and sustained growth in both trips and revenue throughout $50 $40 $ Through the great recession of 2008 and 2009 trips and revenues declined moderately, but are showing signs of recovery $20 $10 $0 Total Operating Revenue (millions) Total Vehicle Volume (millions) Despite the recent recession growth rates (post ramp up) have averaged 7.4% per annum (1999 to 2010) 30% 20% 10% 0% -10% -20% 85
88 Annual Growth Average Revenues per Vehicle SR91 TOLL RATE GROWTH Average revenue per vehicle has generally continued to climb since the SR91 opened, with only brief periods of flat or minor negative growth Average toll per vehicle has also continued to grow, and at a rates exceeding CPI Average Revenue per Vehicle $4.00 $3.50 $3.00 $2.50 $2.00 $1.50 $1.00 $0.50 $ Average Revenue per Vehicle 7.5% Average Toll per Vehicle 2.5% % Average Toll per Vehicle Growth US-CPI Source: SR91 weekly traffic and revenue results 86
89 CONCLUSION Construction Construction progressing well more than 60% complete No regulatory or permit requirements outstanding to complete build Key subcontracts tolling technology and Operations Centre on time and budget Demographics Region has shown resilience through economic downturn main catchment area still leading nation for key criteria Traffic and revenue update on schedule Next steps Continue to execute the design build contract to achieve on time, on budget completion at the end of 2012

90 Click to edit Master text styles Second level > Third level 88
For personal use only
 asx release 21 October 2015 Presentation to Morgans Queensland Conference Please find attached the presentation that Transurban CEO Scott Charlton will be delivering at today s Morgans Queensland Conference.
PUBLIC TRANSPORTATION INTRODUCTION
 PUBLIC TRANSPORTATION INTRODUCTION 1 OUTLINE Current Status and Recent Trends Significant Influences A Critical Assessment Arguments Supporting Public Transport Future Influences Ingredients for Future
For personal use only
 11 October 2018 September Quarter Update 2018 Transurban today released its September quarter 2018 update. During the period, Average Daily Traffic (ADT) increased by 3.3%, with growth across all markets.
SUSTAINABILITY HIGHLIGHTS 2014
 SUSTAINABILITY HIGHLIGHTS VISIT OUR ONLINE REPORT TRANSURBAN.COM/SR14 FY14 sustainability highlights PROPORTIONAL EBITDA* GROWTH 12.8% AWARDED CONTRACTS TO SMALL, WOMEN & MINORITY-OWNED BUSINESSES IN THE
TRANSURBAN QUEENSLAND S $512M LOGAN ENHANCEMENT PROJECT APPROVED
 asx release 23 November 2016 TRANSURBAN QUEENSLAND S $512M LOGAN ENHANCEMENT PROJECT APPROVED Transurban announces that the Queensland Government has approved its $512 million Logan Enhancement Project.
SUSTAINABILITY HIGHLIGHTS 2015
 SUSTAINABILITY HIGHLIGHTS 2015 FY15 sustainability highlights RECORDABLE EMPLOYEE INJURIES 0 PROPORTIONAL EBITDA 1 GROWTH 38% COMMUNITY INVESTMENT CUSTOMERS $701,320 >5M TOLL ROADS ADDED TO PORTFOLIO 6
2007/08 Full Year Results Investor Briefing
 2007/08 Full Year Results Investor Briefing Highlights of Result Profit before tax up 46% to $1,408 million Up 36% on the reported result Margin improvement $3 billion of Sustainable Future Benefits achieved
Management Presentation. November 2011
 Management Presentation November 2011 Forward looking statements This presentation as well as oral statements made by officers or directors of Allegiant Travel Company, its advisors and affiliates (collectively
Investor Briefings First-Half FY2016 Financial Results
 Cedar Woods Properties Limited Investor Briefings First-Half FY2016 Financial Results 26 February 2016 Cedar Woods Presentation 2 Snapshot of Achievements in FY2016 Extensive portfolio of residential estates
Management Presentation. May 2013
 Management Presentation May 2013 Forward looking statements This presentation as well as oral statements made by officers or directors of Allegiant Travel Company, its advisors and affiliates (collectively
Our Panelists SPEAKERS MODERATOR
 SPEAKERS Our Panelists Jennifer Aument, Transurban Gary Garczynski, Commonwealth Transportation Board Russ Gestl, Buchanan Partners, LLC Robert Shue, JLL MODERATOR David Birtwistle, Northern Virginia Transportation
The Housing Market and the Macroeconomy
 The Housing Market and the Macroeconomy New England Mortgage Bankers Association October 2, 2009 1 The World is in a Deep Recession In the U.S. EMPLOYMENT: Job losses in August, 2009: -216,000 Job losses
BAA (SP) Limited Results for six months ended 30 June July 2011
 Limited Results for six months ended 30 June July 2011") BAA (SP) Limited Results for six months ended 30 June 2011 July 2011 Record Q2 Heathrow traffic Good overall service standards Strong financial results Successful dollar and sterling financings H1 2011
BAA (SP) Limited Results for six months ended 30 June 2011 July 2011 Record Q2 Heathrow traffic Good overall service standards Strong financial results Successful dollar and sterling financings H1 2011
DISTRICT EXPRESS LANES ANNUAL REPORT FISCAL YEAR 2017 JULY 1, 2016 JUNE 30, FloridaExpressLanes.com
 DISTRICT EXPRESS LANES ANNUAL REPORT FISCAL YEAR 2017 JULY 1, 2016 JUNE 30, 2017 FloridaExpressLanes.com This page intentionally left blank. TABLE OF CONTENTS List of Figures... ii List of Tables.... ii
Analysts and Investors conference call. Q results. 15 May 2013
 Analysts and Investors conference call Q1 2013 results 15 May 2013 Management summary Key messages of Q1 2013 +6% +9% +3.3%p. Q1 2013 operational KPIs are in line with 109.7 116.2 6.5 7.1 82.3 85.6 expectations,
KERRIE MATHER MANAGING DIRECTOR AND CHIEF EXECUTIVE OFFICER. Macquarie Conference 4 MAY 2016
 KERRIE MATHER MANAGING DIRECTOR AND CHIEF EXECUTIVE OFFICER Macquarie Conference 4 MAY 2016 Disclaimer General securities warning This presentation has been prepared by Sydney Airport Limited (ACN 165
BLACK KNIGHT HPI REPORT
 CONTENTS 1 OVERVIEW 2 NATIONAL OVERVIEW 3 LARGEST STATES AND METROS 4 FEBRUARY S BIGGEST MOVERS 5 20 LARGEST STATES 6 40 LARGEST METROS 7 ADDITIONAL INFORMATION OVERVIEW Each month, the Data & Analytics
Highway & Bridge Construction Market Update Southern Region
 Highway & Bridge Construction Market Update Southern Region Alison Premo Black, PhD ARTBA Senior VP & Chief Economist November 26, 2016 2016 ARTBA. All rights reserved. No part of this document may be
Management Presentation. September 2011
 Management Presentation September 2011 Forward looking statements This presentation as well as oral statements made by officers or directors of Allegiant Travel Company, its advisors and affiliates (collectively
RAMSAY HEALTH CARE ANNUAL GENERAL MEETING 24 November 2009 CHRISTOPHER REX MANAGING DIRECTOR
 RAMSAY HEALTH CARE ANNUAL GENERAL MEETING 24 November 2009 CHRISTOPHER REX MANAGING DIRECTOR OVERVIEW 1. Recap FY 2009 results 2. About Ramsay Health Care 3. The Ramsay Way 4. Operating environment - Australia
Air Berlin PLC AGM 06 June 2013 London
 Air Berlin PLC AGM 06 June 2013 London airberlin a strong European carrier Market position as of 31 December 2012 No. 2 in core market: Germany / Austria / Switzerland No. 7 in Europe with 33.3 m guests
23 February The Manager Market Announcements Australian Securities Exchange Limited 20 Bridge Street SYDNEY NSW 2000.
 Level 1 157 Grenfell Street Adelaide SA 5000 GPO Box 2155 Adelaide SA 5001 Adelaide Brighton Ltd ACN 007 596 018 Telephone (08) 8223 8000 International +618 8223 8000 Facsimile (08) 8215 0030 www.adbri.com.au
Virgin Australia Holdings Limited (ASX: VAH) H1 FY18 Results 1
 H1 FY18 Results 1") Virgin Australia Holdings Limited (ASX: VAH) H1 FY18 Results 1 Summary of H1 FY18 Group Outcomes 2 Group Underlying Profit Before Tax of $102.5 million up 142.3% Group Statutory Profit After Tax of $4.4
Virgin Australia Holdings Limited (ASX: VAH) H1 FY18 Results 1 Summary of H1 FY18 Group Outcomes 2 Group Underlying Profit Before Tax of $102.5 million up 142.3% Group Statutory Profit After Tax of $4.4
Arlington County Board Meeting Project Briefing. October 20, 2015
 Arlington County Board Meeting Project Briefing October 20, 2015 Project Map 2 Project Context Only Interstate in the Country limited to HOV only traffic during rush hours Stoplight at the end of I-66
CROWN ANNOUNCES 2018 HALF YEAR RESULTS
 ASX / MEDIA RELEASE FOR IMMEDIATE RELEASE 22 February 2018 CROWN ANNOUNCES 2018 HALF YEAR RESULTS MELBOURNE: Crown Resorts Limited (ASX: CWN) ( Crown ) today announced its results for the half year ended
Crown Resorts Limited
 Crown Resorts Limited 2015 Full Year Results Presentation 13 August 2015 1 Crown Resorts Limited Results Overview Crown Resorts Limited (Crown) performance: Overall, the results for Crown s portfolio of
Tabcorp 2011 full year results
 16 August 2011 Tabcorp 2011 full year results Highlights including demerged Casinos business Reported Net Profit After Tax (NPAT) $534.8 million, up 13.9% (includes oneoff demerger impacts) Normalised
Interim Report 6m 2014
 August 11, 2014 Interim Report 6m 2014 Investors and Analysts Conference Call on August 11, 2014 Joachim Müller, CFO Latest ad-hoc release (August 4, 2014) Reduction of forecast, primarily due to a further
26 October 2017 Icelandair Group Interim Report NET PROFIT USD 101 MILLION IN THIRD QUARTER
 NET PROFIT USD 101 MILLION IN THIRD QUARTER Total income in Q3 up by 10% between years, to USD 536.0 million Passenger revenue higher than expected EBITDA unchanged year on year, at USD 161.1 million Passenger
Heathrow (SP) Limited
 Limited") Draft v2.0 10 Feb Heathrow (SP) Limited Results for year ended 31 December 2013 24 February 2014 Strong operational and financial performance in 2013 Passenger satisfaction at record high and over 72 million
Draft v2.0 10 Feb Heathrow (SP) Limited Results for year ended 31 December 2013 24 February 2014 Strong operational and financial performance in 2013 Passenger satisfaction at record high and over 72 million
WH Smith PLC Acquisition of InMotion providing access to the world s largest travel retail market 30 October 2018
 WH Smith PLC Acquisition of InMotion providing access to the world s largest travel retail market 30 October 2018 Transaction highlights WH Smith announces acquisition of InMotion for $198m ( 155 million)
For personal use only
 ASX / MEDIA RELEASE FOR IMMEDIATE RELEASE 25 February 2016 CROWN ANNOUNCES 2016 HALF YEAR RESULTS MELBOURNE: Crown Resorts Limited (ASX: CWN) today announced its results for the half year ended 31 December
McLean Citizens Association Transportation Committee Project Briefing
 McLean Citizens Association Transportation Committee Project Briefing November 10, 2015 Project Map 2 Project Context Only Interstate in the Country limited to HOV only traffic during rush hours Stoplight
Euroz Rottnest Investor Briefing
 Cedar Woods Properties Limited Euroz Rottnest Investor Briefing 15 March 2016 Cedar Woods Presentation 2 Snapshot of Achievements in FY2016 Extensive portfolio of residential estates in Perth and WA regions,
MACQUARIE AIRPORTS FULL YEAR & FOURTH QUARTER 2008 RESULTS FOR SYDNEY AIRPORT
 Macquarie Airports Management Limited ABN 85 075 295 760 AFS Licence No. 236875 A Member of the Macquarie Group of Companies No. 1 Martin Place SYDNEY NSW 2000 GPO Box 4294 SYDNEY NSW 1164 AUSTRALIA Telephone
Hotel Industry Performance Overview Washington Lodging Convention
 Hotel Industry Performance Overview Washington Lodging Convention Valerie Woods Director of Business Development, Hotels vwoods@str.com Valerie_STR 2016 STR, Inc. All Rights Reserved. Any reprint, use
Metropolitan Washington Airports Authority (MWAA)
") RONALD REAGAN WASHINGTON NATIONAL DULLES TOLL ROAD DULLES METRORAIL WASHINGTON DULLES INTERNATIONAL Metropolitan Washington Airports Authority (MWAA) Andrew Rountree Chief Financial Officer & Vice President
RONALD REAGAN WASHINGTON NATIONAL DULLES TOLL ROAD DULLES METRORAIL WASHINGTON DULLES INTERNATIONAL Metropolitan Washington Airports Authority (MWAA) Andrew Rountree Chief Financial Officer & Vice President
Management Presentation. August 2012
 Management Presentation August 2012 Forward looking statements This presentation as well as oral statements made by officers or directors of Allegiant Travel Company, its advisors and affiliates (collectively
Half Year F1 Results. November 4, 2015
 Half Year F1 Results November 4, 2015 F17 Q1 Results 20 JULY 2016 Q1 BUSINESS HIGHLIGHTS Passenger growth of 18% to 5.8m pax on 17% seat growth Record underlying profit of 38.6m (+14%) despite Easter effect
Dulles Toll Road Rate Setting Process
 Dulles Toll Road Rate Setting Process Public Hearings Slides FOR HNTB June 22, 2018 Dulles Toll Road Operations The Dulles Toll Road is a critical transportation link to the region s infrastructure. On
Dulles Corridor Metrorail Project Update Dulles Area Transportation Association August 25, 2009
 Dulles Corridor Metrorail Project Update Dulles Area Transportation Association August 25, 2009 Patty Nicoson President Dulles Corridor Rail Association Proposed Toll Rate Increase on Dulles Toll Road
VCTC Transit Ridership and Performance Measures Quarterly Report
 VCTC Transit Ridership and Performance Measures Quarterly Report Overview Quarter 2 Fiscal Year 2018-2019 This report provides performance measures for VCTC Intercity Bus Service covering the FY 2018-19
QUARTERLY UPDATE 31 MARCH 2017
 AUSTRALIAN PROPERTY OPPORTUNITIES FUND QUARTERLY UPDATE 31 MARCH 2017 The Australian Property Opportunities Fund (APOF I or the Fund) is pleased to provide this update for the March quarter 2017 (Q1 2017)
AUSTRALIAN TRAVEL TIME METRIC 2017 EDITION
 AUSTRALIAN TRAVEL TIME METRIC 217 EDITION For more information please contact: Brendan Lyon Chief Executive Officer Infrastructure Partnerships Australia Suite 3.3, Level 3, 9 Pitt Street Sydney NSW 2
TRANSPORT AFFORDABILITY INDEX
 TRANSPORT AFFORDABILITY INDEX Report - March 2018 AAA 1 AAA 2 Table of contents Foreword 4 Section One Overview 6 Section Two Summary of Results 8 Section Three Detailed Results 14 Section Four State by
Working Draft: Time-share Revenue Recognition Implementation Issue. Financial Reporting Center Revenue Recognition
 March 1, 2017 Financial Reporting Center Revenue Recognition Working Draft: Time-share Revenue Recognition Implementation Issue Issue #16-6: Recognition of Revenue Management Fees Expected Overall Level
Crown Resorts Limited
 Crown Resorts Limited Annual General Meeting 20 October 2016 1 Presentation Outline F16 Year in Review 2 Crown Resorts Limited Group Result F16 Normalised $m F15 Normalised $m Variance F/(U) F16 Actual
M2 Group Ltd 2014 Interim Results
 M2 Group Ltd 2014 Interim Results 24 February 2014 Geoff Horth, CEO Presentation Content Record Financial Performance Strong Organic Growth FY14 Priorities and Guidance Slide 2, 24 February 2014 Record
AUGUST 2008 MONTHLY PASSENGER AND CARGO STATISTICS
 Inter-Office Memo Reno-Tahoe Airport Authority Date: October 2, 2008 To: Statistics Recipients From: Tom Medland, Director Air Service Business Development Subject: RENO-TAHOE INTERNATIONAL AIRPORT PASSENGER
AIR CANADA REPORTS THIRD QUARTER RESULTS
 AIR CANADA REPORTS THIRD QUARTER RESULTS THIRD QUARTER OVERVIEW Operating income of $112 million compared to operating income of $351 million in the third quarter of 2007. Fuel expense increased 49 per
Arlington County Board Work Session Eastbound Widening January 17, Amanda Baxter, VDOT Special Projects Development Manager
 Arlington County Board Work Session Eastbound Widening January 17, 2017 Amanda Baxter, VDOT Special Projects Development Manager Program Area Map 2 Program Scope Tolling during weekdays, peak hours, peak
Quarter 3 Interim management Statement
 Quarter 3 Interim management Statement 3 months to 30 th June 2012 25 th July 2012 1 1 Strong Q3 performance - in a difficult market Revenue growth in line with expectations Constant currency RPS growth
I-66 Inside the Beltway Feasibility Study
 I-66 Inside the Beltway Feasibility Study Feasibility Study Study Process Context Sensitive Dialogues Corridor Assessments / Data Collection Problem Statement Refinement Concept Development Concept Evaluation
USD thousand Q Q Change % Change 12M 2015
 EBITDA POSITIVE IN FIRST-QUARTER EBITDA positive by USD 1.1 million, as compared to a negative outcome of USD 2.3 million last year Positive impact of low fuel prices on performance 21% increase in passenger
1Q 2017 EARNINGS PRESENTATION APRIL 25, 2017
 1 1Q 2017 EARNINGS PRESENTATION APRIL 25, 2017 SAFE HARBOR This presentation contains forward-looking statements within the meaning of the Private Securities Litigation Reform Act of 1995, Section 27A
I-95/395 HOV/Bus/HOT Lanes Project Overview
 I-95/395 HOV/Bus/HOT Lanes Project Overview 2 I-95/395 HOV/Bus/HOT Lanes Meetings Agenda 7 p.m. to 9 p.m. Open House Information Stations and Q&A With Project Staff 7:30 p.m. and 8:30 p.m. Project Overview
Ramsay Health Care Limited Results Briefing Half Year ended 31 December 2018
 Ramsay Health Care Limited Results Briefing Half Year ended 31 December 2018 Craig McNally, Group Managing Director & Bruce Soden, Group Finance Director 28 February 2019 ramsayhealth.com Agenda Group
Analyst and Investor Conference Call Q Ulrik Svensson, CFO and Member of the Executive Board
 Analyst and Investor Conference Call Q2 2017 Ulrik Svensson, CFO and Member of the Executive Board Frankfurt, 2 August 2017 Disclaimer The information herein is based on publicly available information.
CROWN ANNOUNCES 2019 HALF YEAR RESULTS
 ASX / MEDIA RELEASE FOR IMMEDIATE RELEASE 20 February 2019 CROWN ANNOUNCES 2019 HALF YEAR RESULTS MELBOURNE: Crown Resorts Limited (ASX: CWN) ( Crown ) today announced its results for the half year ended
San Mateo County Transportation Authority Board Meeting November 2, 2017 Item #10 1
 San Mateo County Transportation Authority Board Meeting November 2, 2017 Item #10 1 OVERVIEW Brief recap from October Traffic Analysis Findings Draft Environmental Document Summarized Outcomes Questions
Fairfax County Transportation Advisory Commission (TAC)
") Fairfax County Transportation Advisory Commission (TAC) January 17, 2017 Susan Shaw, P.E., Megaprojects Director Virginia Department of Transportation Amanda Baxter, Special Projects Development Manager
Fairfax County Transportation Advisory Commission (TAC) January 17, 2017 Susan Shaw, P.E., Megaprojects Director Virginia Department of Transportation Amanda Baxter, Special Projects Development Manager
Dulles Corridor Improvements. Drive to Ride
 Dulles Corridor Improvements Dulles Corridor Improvements Status Update v Condition assessment of Toll Road facilities is complete v Dulles Airport Access Highway/I-495 Interchange Safety Improvements
Fourth Quarter and Full Year 2009
 Investor and analyst meeting: Fourth Quarter and Full Year 29 25 th February 21 2 The views expressed here contain some information derived from publicly available sources that have not been independently
Public Information Meetings. October 5, 6, 7, and 15, 2015
 Public Information Meetings October 5, 6, 7, and 15, 2015 Project Map 2 Project Context Only Interstate in the Country limited to HOV only traffic during rush hours Stoplight at the end of I-66 eastbound
Finding Rationality in an Irrational World: The Economics of Successful Hotel Negotiations
 Finding Rationality in an Irrational World: The Economics of Successful Hotel Negotiations Isaac Collazo, Vice President, Performance Strategy & Planning, InterContinental Hotels Group (IHG) Maria Lowry,
Update of MDX Open Road Tolling
 Update of MDX Open Road Tolling Citizens Transportation Advisory Committee September 11, 2013 About MDX MDX is an agency of the state created by the State Legislature and the County Commission to assure
RIDERSHIP TRENDS. October 2017
 RIDERSHIP TRENDS October 2017 Prepared by the Division of Strategic Capital Planning December 2017 Table of Contents Executive Summary...1 Ridership...3 Estimated Passenger Trips by Line...3 Estimated
security holder review
 security holder review Enquiries and information Enquiries about your Transurban stapled securities The Stapled Securities Register is maintained by Computershare Investor Services Pty Limited. If you
CROWN ANNOUNCES 2010 FULL YEAR RESULTS
 ASX / MEDIA RELEASE FOR IMMEDIATE RELEASE 26 August 2010 CROWN ANNOUNCES 2010 FULL YEAR RESULTS MELBOURNE: Crown Limited (ASX: CWN) today announced its results for the full year ended 30 June 2010: Normalised
Sunshine Coast Residential Market
 Sunshine Coast Residential Market Warwick Temby HIA Executive Director, QLD HOUSING INDUSTRY ASSOCIATION April 2010 Overview Look at international, national and local events that are shaping the outlook
AIR CANADA REPORTS 2010 THIRD QUARTER RESULTS; Operating Income improved $259 million or 381 per cent from previous year s quarter
 AIR CANADA REPORTS 2010 THIRD QUARTER RESULTS; Operating Income improved $259 million or 381 per cent from previous year s quarter MONTRÉAL, November 4, 2010 Air Canada today reported operating income
Q3 FY18 Business Highlights
 Q3 FY18 RESULTS Q3 FY18 Business Highlights 1 2 3 4 5 6 7 Record passengers 7.1m, record revenues 423m Investing in growth 24% passenger growth in Q3 Disciplined cost management flat ex-fuel CASK Largest
JET AIRWAYS (I) LTD. Presentation on Financial Results Q July 24, 2009
 LTD. Presentation on Financial Results Q July 24, 2009") JET AIRWAYS (I) LTD Presentation on Financial Results Q1 2010 July 24, 2009 1 1 1 Agenda Domestic operating environment Jet Airways performance highlights JetLite performance highlights Outlook 2 2 2 Domestic
JET AIRWAYS (I) LTD Presentation on Financial Results Q1 2010 July 24, 2009 1 1 1 Agenda Domestic operating environment Jet Airways performance highlights JetLite performance highlights Outlook 2 2 2 Domestic
Quarter Interim Management Statement. 28 July 2010
 Quarter 3 2010 Interim Management Statement 28 July 2010 Week 4 priorities and initial impressions Priorities: Engage with staff, shareholders, customers and key suppliers Mitigation plan for recent operational
Impact of Advance Purchase and Length-of-Stay on Average Ticket Prices in Top Business Destinations
 Impact of Advance Purchase and Length-of-Stay on Average Ticket Prices in Top Business Destinations Research Summary Average ticket prices continue to trend downward in 2016, but since 2014 there have
Report to the Dulles Corridor Advisory Committee
 Report to the Dulles Corridor Advisory Committee Information Report on Dulles Toll Road Toll Rate Adjustment Process and Tentative Schedule and Overview of Traffic and Revenue Study Update May 2018 Purpose
For personal use only
 Sydney Airport Holdings Limited ABN 85 075 295 760 AFSL 236875 Central Terrace Building 10 Arrivals Court Sydney International Airport New South Wales 2020 T 1800 181 895 or +61 2 9667 9871 F +61 2 9667
RIDERSHIP TRENDS. January 2018
 RIDERSHIP TRENDS January 2018 Prepared by the Division of Strategic Capital Planning March 2018 Table of Contents Executive Summary...1 Ridership...3 Estimated Passenger Trips by Line...3 Estimated Passenger
State of the States October 2017 State & territory economic performance report. Executive Summary
 State of the States October 2017 State & territory economic performance report. Executive Summary NSW ON TOP; VICTORIA CLOSES IN How are Australia s states and territories performing? Each quarter CommSec
For personal use only
 HELLOWORLD TRAVEL LIMITED RESULTS ANNOUNCEMENT Highlights for the year ended 30 June 2018 Total Transaction Value (TTV) growth of 3.5% to $6.1 billion, underpinned by strong air ticket sales volume growth.
Peer Performance Measurement February 2019 Prepared by the Division of Planning & Market Development
 2017 Regional Peer Review Peer Performance Measurement February 2019 Prepared by the Division of Planning & Market Development CONTENTS EXECUTIVE SUMMARY... 3 SNAPSHOT... 5 PEER SELECTION... 6 NOTES/METHODOLOGY...
GATWICK AIRPORT JOINS VINCI AIRPORTS December 2018
 GATWICK AIRPORT JOINS VINCI AIRPORTS December 2018 Asset presentation Gatwick is the 2 nd largest airport in the UK and the 8 th busiest in Europe with 46 mpax Key features 46 mpaxin FY18, in the wealthiest
Heathrow (SP) Limited
 Limited") 28 April 2014 Heathrow (SP) Limited Results for three months ended 31 March 2014 Strong operational and financial performance at the outset of the new regulatory period Highest ever passenger satisfaction
28 April 2014 Heathrow (SP) Limited Results for three months ended 31 March 2014 Strong operational and financial performance at the outset of the new regulatory period Highest ever passenger satisfaction
U.S. Hotel Industry Performance. Brad Garner Chief Operating Officer
 U.S. Hotel Industry Performance Brad Garner Chief Operating Officer 1 Agenda Total US Review Scale Review Segmentation Markets Supply Pipeline 2013 / 2014 Forecast 2 www.hotelnewsnow.com Click on Hotel
NATIONAL TOLL FACILITIES USAGE ANALYSIS RECORD-BREAKING YEAR FOR TOLL FACILITIES ACROSS THE U.S.
 NATIONAL TOLL FACILITIES USAGE ANALYSIS RECORD-BREAKING YEAR FOR TOLL FACILITIES ACROSS THE U.S. INTRODUCTION KEY FACTS FROM THE NATIONAL TOLL FACILITIES USAGE ANALYSIS 31 TOLL AUTHORITIES from across
A COMPARISON OF THE MILWAUKEE METROPOLITAN AREA TO ITS PEERS
 KRY/WJS/EDL #222377 (PDF: #223479) 1/30/15 PRELIMINARY DRAFT Memorandum Report A COMPARISON OF THE MILWAUKEE METROPOLITAN AREA TO ITS PEERS EXECUTIVE SUMMARY This memorandum report provides a statistical
December 2018 Quarterly Production Report
 31 January 2019 December 2018 Quarterly Production Report Fortescue Metals Group Limited (ASX: FMG, Fortescue) Fortescue has released its December 2018 quarterly production results, reporting total shipments
Sitting on the Runway: Current Aircraft Taxi Times Now Exceed Pre-9/11 Experience
 U.S. Department of Transportation Research and Innovative Technology Administration SR-8 Bureau of Transportation Statistics Special Report May 8 Sitting on the Runway: Current Aircraft Taxi Times Now
Helloworld Travel Limited results announcement Half year ended 31 December 2017
 Helloworld Travel Limited results announcement Half year ended 31 December 2017 HIGHLIGHTS FOR THE HALF YEAR ENDED 31 DECEMBER 2017 Total Transaction Value (TTV) growth of 2.7% to $2.968 billion. Earnings
Qantas Airways Limited
 Qantas Airways Limited Macquarie Australia Conference 8 May 2014 Qantas Guiding Strategic Principles Safety is always our first priority The first choice for customers in every market we serve Maintaining
Sydney Airport. Investment Highlights
 Sydney Airport Investment Highlights Disclaimer General Securities Warning This presentation has been prepared by Sydney Airport Holdings Limited (ACN 075 295 760 / AFSL 236875). This presentation is not
EXECUTIVE SUMMARY. hospitality compensation as a share of total compensation at. Page 1
 EXECUTIVE SUMMARY Applied Analysis was retained by the Las Vegas Convention and Visitors Authority (the LVCVA ) to review and analyze the economic impacts associated with its various operations and southern
Managing through disruption
 28 July 2016 Third quarter results for the three months ended 30 June 2016 Managing through disruption 3 months ended Like-for-like (ii) m (unless otherwise stated) Change 30 June 2016 30 June 2015 change
VERY GOOD RESULTS IN OUR MOST IMPORTANT QUARTER
 VERY GOOD RESULTS IN OUR MOST IMPORTANT QUARTER Q3 EBITDA USD 161.8 million, as compared to USD 155.6 million in the corresponding quarter last year 19% increase in passenger numbers on international flights
Management Presentation. May 2012
 Management Presentation May 2012 Forward looking statements This presentation as well as oral statements made by officers or directors of Allegiant Travel Company, its advisors and affiliates (collectively
Lodging Industry Overview. 14 December Bobby Bowers Smith Travel Research / STR Global
 Lodging Industry Overview 14 December 2011 Bobby Bowers Smith Travel Research / STR Global Global / U.S. Overview Key U.S. Markets Construction Pipeline Forecast Takeaways Today s Agenda RevPar Growth
JP Morgan Aviation, Transportation and Industrials Conference MARCH 15, 2017
 JP Morgan Aviation, Transportation and Industrials Conference MARCH 15, 2017 1 1 SAFE HARBOR This presentation contains forward-looking statements within the meaning of the Private Securities Litigation
TravelClick: Business Intelligence Lodging Outlook. Sara Duggan. Regional Vice President, Business Intelligence TravelClick 03/23/18
 TravelClick: Business Intelligence 2018 Lodging Outlook Sara Duggan Regional Vice President, Business Intelligence TravelClick 03/23/18 25,000+ Partners 25 283 Million $49 Billion 365 North America Markets
IAG results presentation. Quarter One th May 2018
 IAG results presentation Quarter One 2018 4 th May 2018 Highlights Willie Walsh, Chief Executive Officer Highlights Another strong quarter performance with an operating profit of 280m (5.6% margin, +2.3pts)
RENO-TAHOE INTERNATIONAL AIRPORT APRIL 2008 PASSENGER STATISTICS
 Inter-Office Memo Reno-Tahoe Airport Authority Date: June 5, 2008 To: Statistics Recipients From: Tom Medland, Director Air Service Business Development Subject: RENO-TAHOE INTERNATIONAL AIRPORT PASSENGER