DRAFT. Airport Master Plan Update Sensitivity Analysis
|
|
|
- Frederick Perkins
- 5 years ago
- Views:
Transcription
1 Dallas Love Field Sensitivity Analysis PREPARED FOR: The City of Dallas Department of Aviation PREPARED BY: RICONDO & ASSOCIATES, INC. August 201 Ricondo & Associates, Inc. (R&A) prepared this document for the stated purposes as expressly set forth herein and for the sole use of the City of Dallas Department of Aviation and its intended recipients. The techniques and methodologies used in preparing this document are consistent with industry practices at the time of preparation.
2 Table of Contents 1. Introduction Forecast Baseline Forecast Design Day Flight Schedule Baseline Forecast Design Day Flight Schedule Development Baseline Forecast Design Day Flight Schedule Summary Aviation Activity Forecasts SOUTHWEST AIRLINES OTHER AIRLINES Landside Facilities Airport Parking Facility Requirements ON-AIRPORT PUBLIC PARKING ON-AIRPORT EMPLOYEE PARKING Airport Access Requirements FORECASTS ON-AIRPORT ROADWAYS ON-AIRPORT INTERSECTION LEVEL-OF-SERVICE ANALYSIS OFF-AIRPORT ROADWAYS CURBSIDE DATA AND GROWTH CURBSIDES ANALYSIS Rental Car METHODOLOGY CUSTOMER SERVICE AREA RENTAL CAR READY/RETURN AREA AND ONSITE VEHICLE STORAGE AREA SERVICE SITES FACILITY REQUIREMENTS SUMMARY Terminal Facilities Planning Activity Levels DESIGN DAY FLIGHT SCHEDULE Planning Basis PASSENGER PROCESSING SEQUENCE PASSENGER ATTRIBUTES LEVEL OF SERVICE STANDARDS OPERATING PARAMETERS Sensitivity Analysis [i]
3 Table of Contents (continued) 4.3 Analysis CHECK-IN PASSENGER SECURITY SCREENING CHECKPOINT HOLDROOMS OUTBOUND BAGGAGE MAKEUP BAG CLAIM Airfield Facilities Data Collection and Existing Conditions Documentation Operational Analysis of the Existing Airside Facilities AIRFIELD CAPACITY QUALITATIVE ANALYSIS AIRFIELD CAPACITY QUANTITATIVE ANALYSIS QUALITATIVE AND QUANTITATIVE ANALYSES FINDINGS Alternative Development and Alternatives Workshop ALTERNATIVES DEVELOPMENT ALTERNATIVES WORKSHOP AND PREFERRED AIRFIELD ALTERNATIVE Conclusion Forecast Overview Landside Facilities Overview AIRPORT PARKING FACILITY REQUIREMENTS AIRPORT ACCESS CURBSIDE RENTAL CAR Terminal Facilities Overview CHECK-IN PASSENGER SECURITY SCREENING CHECKPOINT HOLDROOMS OUTBOUND BAGGAGE MAKEUP BAG CLAIM Airfield Facilities Overview Sensitivity Analysis [ii]
4 Sensitivity Analysis List of Tables Table 2-1: Baseline Forecast Design Day Flight Schedule Ratios and Targets Passenger Airlines Table 2-2: Baseline Forecast Design Day Flight Schedule Summary Passenger Airlines 1/, 2/ Table 2-3: Baseline Forecast Design Day Flight Schedule Fleet Mix Passenger Airlines 1/ Table 2-4: Operating Statistics for Airlines Serving the Airport: High Growth Scenario Table 2-5: Operating Statistics for Airlines Serving the Airport: Low Growth Scenario Table 2-6: Historical and Forecast Enplaned Passengers: High Growth and Low Growth Scenarios Table 2-: Historical and Forecast Operations: High Growth Scenario Table 2-8: Historical and Forecast Operations: Low Growth Scenario Table 2-9: Forecast Comparison Enplaned Passengers Table 2-10: Forecast Comparison Total Airport Aircraft Operations Table 3-1: 2012 On-Airport Public Parking Space Demand Table 3-2: Estimated On-Airport Public Parking Space Requirements Table 3-3: 2012 On-Airport Employee Parking Space Demand Table 3-4: Estimated On-Airport Employee Parking Space Requirements Table 3-5: Peak Hour Passenger and Growth Rates for Landside Table 3-6: Terminal Area Roadway Demand/Capacity Analysis Table 3-: Estimated Intersection Level of Service Analysis Table 3-8: Off-Airport Roadway Intersection Level of Service Analysis Table 3-9: Vehicle Classification Summary Table 3-10: Total Enplaned Passengers at Dallas Love Field by Month Table 3-11: Peak Hour O & D Passenger, Vehicles, and Curbside Demand Growth Table 3-12: Level of Service and Utilization Ranges for Curbsides with Multiple-Lane Passenger Loading/Unloading Table 3-13: Level of Service and Utilization Ranges for Curbsides with Single-Lane Passenger Loading/Unloading Table 3-14: Sensitivity Analysis Curbside Allocations (a.m. Peak Hour) Table 3-15: Sensitivity Analysis Curbside Allocations (p.m. Peak Hour) Table 3-16: Curbside Bypass Lane Roadway Volume/Capacity and Level of Service Table 3-1: Customer Service Counter Requirements Table 3-18: Rental Car Ready/Return Space Requirements [iii]
5 List of Tables (continued) Table 3-19: Rental Car Onsite Vehicle Storage Space Requirements Table 3-20: Exit Booth Requirements Table 3-21: Fueling Position Requirements Table 3-22: Wash Bay Requirements Table 3-23: Light Maintenance Bay, Employee Administrative Area, and Employee Parking Requirements Table 3-24: Vehicle Stacking/Staging Space Requirements Table 3-25: Rental Car Facility Requirements Summary Table 3-26: Requirements Surplus/(Deficiency) Summary Table 3-2: Rental Car Facility Requirements Table 4-1: Design Day Flight Schedule Metrics Table 4-2: Passenger Group Size Table 4-3: Checked Bags per Originating Passenger Table 4-4: International Air Transport Association Level-of-Service Space-Time Framework Table 4-5: Check-In Wait Times and Transaction Times Table 4-6: Passenger Security Screening Checkpoint Screening Rates Table 4-: Holdroom Planning Criteria Table 4-8: Outbound Baggage Makeup Planning Criteria Table 4-9: Domestic Bag Claim Planning Criteria Table 4-10: Check-In Requirements Table 4-11: Security Screening Checkpoint Requirements Table 4-12: Holdroom Requirements Table 4-13: Baggage Makeup Requirements Table 4-14: Bag Claim Requirements Table 5-1: Benchmark of Existing Runway Capacity Table 6-1: Forecast Variance Enplaned Passengers Table 6-2: Forecast Parking Requirements Table 6-3: Intersection Level of Service Comparison Table (MPU vs Baseline Sensitivity Forecast) Table 6-4: Curbside Allocations Comparison Table Sensitivity Analysis [iv]
6 Sensitivity Analysis List of Exhibits Exhibit 2-1: Baseline Forecast Rolling Hour Deplaned Passengers Passenger Airlines 1/ Exhibit 2-2: Baseline Forecast Rolling Hour Enplaned Passengers Passenger Airlines 1/ Exhibit 2-3: Baseline Forecast Rolling Hour Aircraft Arrivals Passenger Airlines 1/ Exhibit 2-4: Baseline Forecast Rolling Hour Aircraft Departures Passenger Airlines 1/ Exhibit 2-5: Forecast Comparison Enplaned Passengers Exhibit 2-6: Forecast Comparison Total Airport Aircraft Operations Exhibit 3-1: On-Airport Parking Facilities and Capacities Exhibit 3-2: On-Airport Public Parking Transactions and Revenue Exhibit 3-3: On-Airport Parking Revenue Control System Transactions by Duration Exhibit 3-4: On-Airport Public Parking Overnight Occupancy Exhibit 3-5: Forecast Enplaned Passenger Activity Exhibit 3-6: Estimated Public Parking Requirements (Baseline Forecast) Exhibit 3-: Estimated Public Parking Requirements (High Growth Scenario Forecast) Exhibit 3-8: Forecast Aircraft Operations Exhibit 3-9: Forecast Employee Parking Requirements (Baseline Forecast) Exhibit 3-10: Forecast Employee Parking Requirements (High Growth Scenario Forecast) Exhibit 3-11: Baseline Growth versus High Growth Scenario Total Passengers at Curbside (2024 and 2032) 3-1 Exhibit 3-12: Departures and Arrivals Passengers at Curbside (2013/2015/2024/2032) Exhibit 3-13: Roadway Link Capacities Exhibit 3-14: Roadway Network Link Designations Exhibit 3-15: Turning Movement Counts and Intersection Level of Service: Existing(February 2015) a.m. Peak Hour Exhibit 3-16: Turning Movement Counts and Intersection Level of Service: Existing(February 2015) p.m. Peak Hour Exhibit 3-1: Intersection Volumes and Level of Service: 2015 a.m. Peak Hour Exhibit 3-18: Intersection Volumes and Level of Service: 2015 p.m. Peak Hour Exhibit 3-19: Intersection Volumes and Level of Service: 2024 a.m. Peak Hour Exhibit 3-20: Intersection Volumes and Level of Service: 2024 p.m. Peak Hour Exhibit 3-21: Intersection Volumes and Level of Service: 2032 a.m. Peak Hour Exhibit 3-22: Intersection Volumes and Level of Service: 2032 p.m. Peak Hour [v]
7 List of Exhibits (continued) Exhibit 3-23: Curbside Allocations Exhibit 3-24: Peak Rental Car Day Rentals and Returns by Hour Exhibit 4-1: Diurnal Originating Passenger Activity Levels Exhibit 4-2: Originating Passengers Flows Exhibit 4-3: Destination Passengers Flows Exhibit 4-4: Passenger Show-Up Profiles Exhibit 4-5: Check-In Channel Preferences Exhibit 5-1: Existing Conditions (2020) Basemap Exhibit 5-2: Taxiway Flow Patterns with 13R-31L Closed South Flow Exhibit 5-3: Taxiway Flow Patterns with 13R-31L Closed North Flow Exhibit 5-4: Ground Movement Congestion Points with 13R-31L Closed Exhibit 5-5: Suggested Additional Taxiway Use South Flow Exhibit 5-6: Suggested Additional Taxiway Use North Flow Exhibit 5-: Daily Operations Level (01/ /2016) Exhibit 5-8: Peak Operations by Occurrence (01/ /2016) Exhibit 5-9: Hourly Visual Flight Rules Counts / 30 Airport Arrival Rate Exhibit 5-10: Hourly Instrument Flight Rules Counts / 20 Airport Arrival Rate Exhibit 5-11: 15-Minute Visual Flight Rules Counts / 30 Airport Arrival Rate Exhibit 5-12: 15-Minute Instrument Flight Rules Counts / 20 Airport Arrival Rate Exhibit 5-13: Alternative A No Action Exhibit 5-14: Alternative B January 201 Construction and Design Projects and Projects Complete Prior to Exhibit 5-15: Alternative C Existing Conditions (December 2016) and MPU Alternatives Exhibit 5-16: Alternative D Existing Conditions including 01/201 Construction Projects and MPU Alternatives Exhibit 5-1: Preferred Airfield Alternative Pre-Runway 13R-31L Reconstruction (FY 2020) Exhibit 6-1: Preferred Airfield Alternative Ultimate Conditions Sensitivity Analysis [vi]
8 1. Introduction The Dallas Love Field (DAL or the Airport) Master Plan Update (MPU), which was initiated near the end of 2012, was composed using the future dynamics of the Airport, which reflected the then-current airline operations. Since the repeal of the Wright Amendment in October 2014, there has been a significant increase in enplaned passengers, which has escalated the demands on the Airport s facilities. Consequentially, the Airport has experienced an increase in peak hour demands, facility congestion, and costs of operations and maintenance. After the repeal of the Wright Amendment, the airlines response indicated that the Airport will experience greater demand than originally forecast in the MPU. The Master Plan forecast was reexamined to evaluate future needs. Because airlines operating at the Airport changed there was also a change seen with operations and enplaned passengers. These updated forecasts were not incorporated into the demand/capacity analysis of Airport facilities, because the changes occurred after the Federal Aviation Administration (FAA) approved the forecast in the MPU. The following list describes the order of events and forecast implications: January 2013: A forecast of aviation activity was prepared for the MPU to determine the forecast enplaned passenger activity and operations at the Airport. For the near term, the FAA 2013 Terminal Area Forecast (TAF) predicted fewer enplaned passengers and greater operations than the MPU forecast. Consultation was sought from the FAA, and a consensus was reached with regard to the use of specific planning activity levels (PALs) in the master planning analyses. This took emphasis off of when activity would reach certain levels and instead used activity levels as planning triggers. The forecast was approved by the City of Dallas for use in the MPU. The FAA requested that the MPU utilize defined PALs, in order to assess both a low growth scenario and a high growth scenario (based on a combination of the 2013 TAF and MPU forecast) for planning purposes. Spring 2013: The FAA approved the PALs for use in the MPU. September 2014: Ricondo and Associates, Inc. (R&A or the Consultant) prepared a new forecast to reflect the sublease of two American Airlines gates to Virgin America. The forecast assumed that Virgin America would initiate commercial air service with a minimum of 13 daily departures and a maximum of 18 daily departures. Activity levels were forecast to increase accordingly. 2014: The FAA Draft 2014 TAF showed significantly greater growth than the MPU s original forecast. While the TAF did not recognize the mitigating factors imposed by the Five Party Agreement (FPA) 1, it 1 The parties that were signatory to the FPA included the City of Dallas, the City of Fort Worth, the Dallas/Fort Worth International Airport Board, Southwest Airlines, and American Airlines. The main provisions of the FPA consisted of eliminating the restrictions on nonstop Sensitivity Analysis [1-1]
9 did suggest that the FAA was recognizing the implications of the repeal of the Wright Amendment. However, the MPU forecast still showed higher near-term growth in enplaned passengers. February 2015: An additional forecast was created to study the implications of increased departure/arrival frequency by Virgin America (up to 20 daily departures). This study also included the sublease of two additional gates by Southwest Airlines, increasing their total to 18 gates. The FAA 2015 TAF revealed a significant increase in enplaned passengers over the planning horizon, while the MPU showed a smaller increase in enplaned passenger activity. Due to the increase in enplaned passenger activity, as well as the accelerated timing of that growth, the updated forecast weakened the relationship between forecast activity and the physical planning conclusions reached in the MPU (the updated forecast was not used to support the MPU analyses). November 2015: The forecast documented in this study was developed specifically for the purpose of the MPU Sensitivity Analysis (Sensitivity Analysis). It is intended solely to test the sensitivities of the Airport facilities that have been and will continue to be affected by the dramatic passenger growth due to the repeal of the Wright Amendment. Airport activity has experienced many dynamic changes since the repeal of the Wright Amendment. This Sensitivity Analysis has been developed to address the facilities that have been affected due to the increased passenger activity namely the landside and terminal facilities. The Sensitivity Analysis also addresses airside facilities as recent pavement analyses conclude a need for near term improvements to airside elements that were not originally addressed in the MPU. The following sections of this analysis document an updated forecast that more accurately depicts the Airport s predicted growth, as well as the requirements for landside, terminal and airside facilities based on the updated forecast. service from DAL in 2014, as stipulated in the Wright and Shelby Amendments, as well as reducing the number of gates at DAL that accommodate 10 aircraft operations per day from 32 to 20 as soon as practicable. Sensitivity Analysis [1-2]
10 2. Forecast This forecast was developed specifically for the purpose of the Sensitivity Analysis. It is solely intended to test the sensitivities of the Airport facilities that have been and will continue to be affected by the dramatic increase of passenger activity due to the repeal of the Wright Amendment. A summary of the results of the baseline sensitivity forecast (baseline forecast) design day flight schedule (DDFS) for DAL can be found in Table 2-1, Table 2-2, and Table 2-3, as well as on Exhibit 2-1, Exhibit 2-2, Exhibit 2-3, and Exhibit 2-4. The DDFS includes a base year (2015) and two future years (2024 and 2032) over the 20 year planning horizon ( ). Also within this section, the sensitivity forecasts of aviation activity for the Airport are reviewed using the baseline forecast (February 2015) through fiscal year (FY) Baseline Forecast Design Day Flight Schedule 2015 In order to develop the passenger airline DDFS, the monthly passenger activity levels (scheduled seat capacity and operations) for 2015 were reviewed to determine the peak month. Published data identified August as the peak month for commercial airline operations in Due to weekend airline operation levels (typically less than weekday levels), the number of weekday operations in August 2015 was totaled to determine the average weekday of the peak month. Innovata 2 airline schedules for each weekday in August 2015 were reviewed in order to determine that airline operation levels on August 28 were the closest to the peak month average weekday (PMAWD). Consequently, the August 28 schedule serves as the PMAWD baseline schedule. The Innovata airline schedule for this day provides the airline, type of aircraft, number of seats, origin, destination, and flight times for each scheduled flight. 2 Innovata LLC is a travel and data solutions company and is a leading source of airline schedules data. Sensitivity Analysis [2-1]
11 Table 2-1: Baseline Forecast Design Day Flight Schedule Ratios and Targets Passenger Airlines ENPLANED PASSENGERS PASSENGER AIRLINE OPERATIONS YEAR DDFS ANNUAL RATIO 2/ DDFS 1/ ANNUAL RATIO 2/ ,229 6,801, , ,08,969, , ,85 8,185, , CAGR % 1.8% -0.3% 0.9% % 0.3% 0.0% 0.0% % 1.2% -0.2% 0.5% NOTES: CAGR Compound Annual Growth Rate 1/ DDFS based on August 28, / Ratio = Daily/Annual. SOURCES: City of Dallas Department of Aviation; Innovata, October 2015; Ricondo & Associates, Inc., October PREPARED BY: Ricondo & Associates, Inc., October Sensitivity Analysis [2-2]
12 YEAR PAX SEATS Table 2-2: Baseline Forecast Design Day Flight Schedule Summary Passenger Airlines ARRIVALS DEPARTURES TOTAL LOAD FACTOR AVG SEATS OPS PAX SEATS LOAD FACTOR 1/, 2/ AVG SEATS OPS PAX SEATS ,00 28, % ,229 28, % ,929 56,10 9.2% ,618 30, % ,08 30, % ,696 60,68 86.% ,340 31, % ,85 31, % ,126 62, % CAGR % 0.8% -0.3% 1.8% 0.8% -0.3% 1.8% 0.8% -0.3% % 0.3% 0.0% 0.3% 0.3% 0.0% 0.3% 0.3% 0.0% % 0.6% -0.2% 1.1% 0.6% -0.2% 1.1% 0.6% -0.2% NOTES: PAX Passengers AVG SEATS Average seats per operation OPS Operations CAGR Compound Annual Growth Rate 1/ DDFS based on August 28, / Totals may not match due to rounding. SOURCES: City of Dallas Department of Aviation; Innovata, October 2015: Ricondo & Associates, Inc., October PREPARED BY: Ricondo & Associates, Inc., October LOAD FACTOR AVG SEATS OPS Sensitivity Analysis [2-3]
13 Table 2-3: Baseline Forecast Design Day Flight Schedule Fleet Mix Passenger Airlines 1/ NOTE: 1/ DDFS based on August 28, DEPARTURES AIRCRAFT Airbus Airbus Boeing Boeing Boeing Boeing Boeing Cessna Total SOURCES: City of Dallas Department of Aviation; Innovata, October 2015; Ricondo & Associates, Inc., October PREPARED BY: Ricondo & Associates, Inc., October Sensitivity Analysis [2-4]
14 Rolling Hour (10-minute intervals) Deplaned Passengers - Passenger Airlines 3,000 2,500 2,000 1,500 1, Exhibit 2-1: Baseline Forecast Rolling Hour Deplaned Passengers Passenger Airlines 1/ NOTE: 1/ DDFS based on August 28, SOURCES: City of Dallas Department of Aviation; Innovata, October 2015: Ricondo & Associates, Inc., October PREPARED BY: Ricondo & Associates, Inc., October :00 1:00 2:00 3:00 4:00 5:00 6:00 :00 8:00 9:00 10:00 11:00 12:00 13:00 14:00 15:00 16:00 1:00 18:00 19:00 20:00 21:00 22:00 23: Sensitivity Analysis [2-5]
15 Rolling Hour (10-minute intervals) Enplaned Passengers - Passenger Airlines 3,000 2,500 2,000 1,500 1, Exhibit 2-2: Baseline Forecast Rolling Hour Enplaned Passengers Passenger Airlines 1/ NOTE: 1/ DDFS based on August 28, SOURCES: City of Dallas Department of Aviation; Innovata, October 2015; Ricondo & Associates, Inc., October PREPARED BY: Ricondo & Associates, Inc., October :00 1:00 2:00 3:00 4:00 5:00 6:00 :00 8:00 9:00 10:00 11:00 12:00 13:00 14:00 15:00 16:00 1:00 18:00 19:00 20:00 21:00 22:00 23: Sensitivity Analysis [2-6]
16 Rolling Hour (10-minute intervals) Aircraft Arrivals - Passenger Airlines Exhibit 2-3: Baseline Forecast Rolling Hour Aircraft Arrivals Passenger Airlines 1/ NOTE: 1/ DDFS based on August 28, / Operations held constant in 2024 and SOURCES: City of Dallas Department of Aviation; Innovata, October 2015; Ricondo & Associates, Inc., October PREPARED BY: Ricondo & Associates, Inc., October :00 1:00 2:00 3:00 4:00 5:00 6:00 :00 8:00 9:00 10:00 11:00 12:00 13:00 14:00 15:00 16:00 1:00 18:00 19:00 20:00 21:00 22:00 23: Sensitivity Analysis [2-]
17 Rolling Hour (10-minute intervals) Aircraft Departures - Passenger Airlines Exhibit 2-4: Baseline Forecast Rolling Hour Aircraft Departures Passenger Airlines 1/ NOTE: 1/ DDFS based on August 28, / Operations held constant in 2024 and SOURCES: City of Dallas Department of Aviation; Innovata, October 2015; Ricondo & Associates, Inc., October PREPARED BY: Ricondo & Associates, Inc., October :00 1:00 2:00 3:00 4:00 5:00 6:00 :00 8:00 9:00 10:00 11:00 12:00 13:00 14:00 15:00 16:00 1:00 18:00 19:00 20:00 21:00 22:00 23: Sensitivity Analysis [2-8]
18 The number of passengers on each flight was determined by calculating the average monthly flight load factor using the number of monthly passengers and the number of monthly seats by airline and market, which was based on July 2015 U.S. Department of Transportation data (T-100 data provided through Innovata databases). The month of July 2015 was used in order to capture the most current data available post Wright Amendment. This airline/market load factor was applied to the number of seats in the PMAWD baseline schedule to determine the number of passengers on each flight for the base year (2015). The DDFS is built from the 2015 schedule in order to capture the most recent airline schedule/changes. 2.2 Baseline Forecast Design Day Flight Schedule Development The future year DDFS is based on the MPU s revised forecast (dated February 2015 and accepted by the Department of Aviation in March 2015 to support planning analysis). Overall assumptions used in developing the DDFS include: Forecast growth for passengers and operations was based on the revised forecast growth rates (i.e., Southwest Airlines and Other Airlines). The base year PMAWD to annual ratio of passengers would remain stable over future years in the planning horizon. The base year s PMAWD operations capture the most recent schedule changes. As a result, DDFS operations would remain stable over the planning horizon for Southwest Airlines and Other Airlines as presented in the revised forecast. Southwest Airlines will phase out all Boeing and aircraft by The base year DDFS was used in the progressive development of the 2024 DDFS and the 2032 DDFS. Load factors and available seats were determined through an iterative process that attempted to simulate an individual airline's changes in flight frequency and aircraft size in response to forecast growth in enplaned/deplaned passengers and aircraft operations. The following steps describe the schedule development process: 1. Forecast passenger and aircraft operation growth rates were applied to the base year schedule in order to establish targets (passenger and aircraft operation levels) for each of the future DDFSs. These targets provide guidance by maintaining forecast market share in each of the future schedules. 2. Forecast passenger growth rates from 2015 to 2024 were applied to the base schedule on a route-byroute basis. This was followed by a test calculation (run on a route-by-route basis) to determine if forecast 2020 passenger levels could be accommodated on base year aircraft seat capacity (i.e., determining whether the load factor was below 100 percent). If the load factor was greater than the flight-specific threshold (approximately 95 percent), then the base year aircraft was either (1) increased in gauge, (2) allocated additional flights in the airline-market combination, and/or (3) unchanged if the load factor was below 100 percent. If the forecast passenger growth resulted in reasonable load factors, Sensitivity Analysis [2-9]
19 then the aircraft assigned in the schedule remained unchanged, with the exception of aircraft assumed to be phased out. 3. In some cases, professional judgment was employed to determine whether to maintain aircraft gauge or to increase gauge to an airline-market combination. The decision was primarily based on (1) whether the airline fleet consists of larger gauge aircraft for the applicable DDFS period and (2) whether a larger gauge aircraft is available that could reasonably and effectively operate in the market. No aircraft gauge was decreased in the DDFS. 4. Due to airlines operation and fleet limitations, forecast passenger demand that exceeded an airlinemarket seat capacity was reallocated to another relevant airline-market with available seat capacity in order to capture directional and flow-through traffic. For example, if the largest aircraft were assigned to all operations in the Southwest-San Jose combination, then excess passenger demand would be allocated to available capacity in the Southwest-San Francisco and/or Southwest-Oakland combinations. In some instances, excess passengers were assigned to an airline-market combination as connections. For example, in the Southwest-Tampa market combination, excess passengers may be allocated to available capacity in the Southwest-Houston and assumed to connect through Houston due to limited capacity on nonstop service to Tampa. 5. Once the 2024 DDFS was complete, the process was repeated for the 2032 DDFS. Each future horizon DDFS was built upon the prior horizon s DDFS. 2.3 Baseline Forecast Design Day Flight Schedule Summary Results and statistics, including the commercial passenger fleet mix, for the 2015 (base), 2024, and 2032 schedules are shown in Tables 2-1 through 2-3 and Exhibits 2-1 through Aviation Activity Forecasts This section summarizes the sensitivity forecasts of aviation activity for DAL, which are based on the baseline forecast (February 2015) of aviation activity through FY Due to dynamic changes in the Airport s activity since the repeal of the Wright Amendment, a Sensitivity Analysis of the revised forecast has been conducted. Sensitivity forecasts were developed for enplaned passengers and scheduled passenger airlines aircraft operations. Forecasts of all non-passenger operations activity remained unchanged from the revised forecast. 3 Fiscal year represents October to September. All yearly data results in this section are presented in fiscal year, unless otherwise noted. Sensitivity Analysis [2-10]
20 The forecasts represent future activity at the Airport. Actual activity may vary from the forecasts due to unforeseen events or changes in airline service at the Airport or at competing airports. In addition, airline responses to changes in operating costs and demand present another element of uncertainty inherent in the forecasts. Therefore, the forecasts presented in this section represent a range of possible, not necessarily actual, future airline schedules. The remainder of this section provides an overview of the forecast methodology and presents the results, including: Enplaned passenger forecast Aircraft operations and fleet mix forecast Peak activity forecast Forecast comparisons Southwest Airlines (Southwest) is the primary airline serving the Airport; Dallas is one of the airline's major focus cities. The repeal of the Wright Amendment changed many of the characteristics of the Airport from origin and destination (O&D) and connecting passenger flows to nonstop markets served and gate demand. Two derivative growth forecasts were used to develop the Sensitivity Analysis forecasts (sensitivity forecasts) of enplaned passengers and aircraft operations for the Airport. These forecast results represent the post-wright Amendment period (FY ). The sensitivity forecasts were prepared in October 2015 using FY 2014 (ended September 30, 2014) as the base year (the last full fiscal year for which data were available). The aviation activity forecasts presented in this section are based on assumptions about aviation activity in the Dallas region, as well as other factors that may affect future aviation activity at the Airport; however, given the possibility of a change in the competitive environment, two derivative forecasts, both based on the revised forecast, were prepared and utilized to analyze the sensitivity of facility performance to a change in the magnitude or characteristics of Airport activity. These derivative forecasts were modeled as follows: High Growth scenario: This scenario assumes that Virgin America exits the DAL market and Southwest gains control of two additional gates. In this scenario, growth would be higher than what is shown in the 2015 revised forecast due to the intensity with which Southwest utilizes gates. Additionally, this scenario assumes Southwest will slightly increase the intensity of its gate utilization (i.e., average turns per gate). Low Growth scenario: This scenario assumes that Virgin America exits the DAL market and the vacated gates are leased by non-southwest airlines that operate at a lower intensity than either Virgin America or Southwest. Sensitivity Analysis [2-11]
21 It is important to note that this exercise estimates changes in enplaned passengers, operations, and aircraft fleet mix. The following subsections present an estimate of the potential change should Virgin America discontinue its service mid-year FY 201. R&A assumed no negative impact on Southwest s operations or on enplaned passengers resulting from Virgin America discontinuing service at the Airport. Estimates of growth due to additional gate availability have been developed assuming Southwest will operate from these newly available gates (high growth scenario) and non-southwest airlines will operate from the available gates (low growth scenario) SOUTHWEST AIRLINES Southwest has announced upgrades to its aircraft fleet through the retirement of its Boeing 3-500s (122 seats) and Boeing 3-300s (13 seats), in which the airline plans to acquire additional Boeing 3-00s (143 seats) and Boeing 3-800s (15 seats). As a result, the average number of seats per departure for Southwest is forecast to increase from 138. seats (FY 2014) to seats (FY 2032). In addition to increased average seats per departure, load factors are forecast to increase over the comparable period from 5.5 percent (FY 2014) to 85.2 percent (FY 2032). The percentage of local (originating) passengers is expected to drop in FY 2015 from FY 2014 levels due to the repeal of the Wright Amendment and Southwest s announced intention to connect additional passengers through the Airport. Local passenger demand is forecast to increase over the planning period; the percentage of local passengers is forecast to increase from approximately 52.6 percent (FY 2015) to 61.6 percent (FY 2032). Development of the derivative forecasts maintained Southwest s average seats per departure, load factor, and local passenger percentage over the forecast period (FY 2015 to FY 2032) OTHER AIRLINES Other airlines serving the Airport are expected to maintain operations through the applicable time period in the derivative forecasts, with the Airport serving as a spoke destination from the hubs of those airlines, or on a point-to-point basis. The primary operations of network airlines are anticipated to remain largely concentrated at Dallas Fort Worth International Airport High Growth Scenario Derivative Forecasts Assumptions used in the high growth scenario derivative forecast are as follows: Delta Air Lines (Delta) will cease operations at DAL in FY Virgin America will cease operations at DAL in mid-fy 201. As a result, Southwest will lease the two gates occupied by Virgin America. Southwest s gate capacity will increase to 20 gates in mid-fy 201, which will remain unchanged through the forecast period (FY 2032). Southwest s gate utilization will increase from an average of approximately 9.2 daily turns per gate in FY 2015 to 9.5 daily turns per gate in FY After FY 2015, Southwest will begin to transition to larger aircraft, resulting in additional capacity as average seats per departure increase to meet forecast passenger demand. Sensitivity Analysis [2-12]
22 Southwest will not operate or affiliate with an airline that operates regional/commuter aircraft over the forecast period. SeaPort Airlines operations at the Airport will remain unchanged over the forecast period (FY 2015 to FY 2032). After Virgin America ceases operations at DAL, two airlines (SeaPort and Southwest) will operate at the Airport through the remainder of the forecast period. Table 2-4 presents the average aircraft seat capacity, daily departures, load factors, and percentage of local enplaned passengers in the high growth scenario. Southwest s average seat capacity is estimated to increase from seats per departure in FY 2015 to seats per departure in FY 2032, while daily departures are estimated to increase from per day in FY 2015 to per day in FY Southwest s average load factors are estimated to increase from 80.4 percent in FY 2015 to 85.2 percent in FY From FY 2015 to FY 2032, the local percentage of Southwest s enplaned passengers is estimated to increase from 52.6 percent to 61.6 percent. For other airlines, average seat capacity is estimated to decrease from seats per departure in FY 2015 to 9.0 seats per departure in FY 2032, while departures are estimated to decrease from 22.4 per day in FY 2015 to 1.6 per day in FY Load factors for other airlines are estimated to decrease from 8.4 percent in FY 2015 to 49.1 percent in FY The local percentage of other airlines enplaned passengers is estimated to remain at percent, with the exception of FY 2015 to FY 201 due to Virgin America activity. Overall, average seat capacity at the Airport is estimated to increase from an average of seats per departure in FY 2015 to an average of seats per departure in FY 2032, while daily departures are estimated to increase from 12.2 per day in FY 2015 to 191. per day in FY Airport load factors are estimated to increase from 80.2 percent in FY 2015 to 85.2 percent in FY Similar to that of Southwest, the combined airlines percentage of local enplaned passengers is estimated to increase from 5.0 percent in FY 2015 to 61. percent in FY Low Growth Scenario Derivative Forecasts Assumptions used in the low growth scenario derivative forecast are as follows: Delta will cease operations at DAL in FY Virgin America will cease operations at DAL in mid-fy 201. As a result, two new airlines will each lease one of the two gates occupied by Virgin America. Over the forecast period, one new airline will operate mainline Boeing 1 aircraft, averaging 4.4 daily turns per gate; the second additional airline will operate a regional/commuter 66-seat aircraft, averaging 3.5 daily turns per gate, which is similar to average turns and seat capacity exhibited by airlines that previously operated at DAL. Aircraft and load factors for the new airlines are assumed to remain stable over the forecast period. Load factors for the new mainline airline are assumed to be approximately 8.0 percent, which is similar to levels Delta recorded in FY The new regional/commuter airline s load factor is assumed to be 80.0 percent. Sensitivity Analysis [2-13]
23 Table 2-4: Operating Statistics for Airlines Serving the Airport: High Growth Scenario SOUTHWEST AIRLINES OTHER AIRLINES COMBINED AIRLINES AVERAGE AVERAGE AVERAGE AVERAGE AVERAGE AVERAGE FISCAL SEATS/ DAILY LOAD SEATS/ DAILY LOAD SEATS/ DAILY LOAD YEAR DEPARTURE DEPARTURES FACTOR 1/ LOCAL % DEPARTURE DEPARTURES FACTOR 1/ LOCAL % DEPARTURE DEPARTURES FACTOR 1/ LOCAL % % 64.8% % 100.0% % 66.0% Forecast % 52.6% % 9.9% % 5.0% % 52.6% % 95.5% % 55.9% % 52.9% % 94.0% % 51.5% % 53.2% % 100.0% % 53.2% % 53.4% % 100.0% % 53.4% % 54.1% % 100.0% % 54.1% % 54.9% % 100.0% % 54.9% % 55.% % 100.0% % 55.% % 56.4% % 100.0% % 56.4% % 5.2% % 100.0% % 5.2% % 5.8% % 100.0% % 5.8% % 58.5% % 100.0% % 58.5% % 59.0% % 100.0% % 59.0% % 59.6% % 100.0% % 59.6% % 60.2% % 100.0% % 60.2% % 60.8% % 100.0% % 60.8% % 61.2% % 100.0% % 61.2% % 61.6% % 100.0% % 61.% NOTES: For fiscal years ending September 30. 1/ Load factors include through passengers. Through passengers include any passenger that does not disembark at a particular stop (i.e., a passenger s flight stops at the Airport but the passenger remains on the same aircraft to their final destination). SOURCES: City of Dallas Aviation Department; Innovata, October 201; Ricondo & Associates, Inc., October PREPARED BY: Ricondo & Associates, Inc., October Sensitivity Analysis [2-14]
24 Southwest s gate capacity (18 gates) will remain unchanged over the forecast period. In addition, gate utilization will remain stable at approximately 9.2 daily turns per gate through FY After FY 2015, Southwest will begin to transition to larger aircraft, resulting in additional capacity as average seats per departure increase to meet forecast passenger demand. Southwest will not operate or affiliate with an airline that operates regional/commuter aircraft over the forecast period. SeaPort Airlines operations at the Airport will remain unchanged over the forecast period (FY 2015 to FY 2032). Table 2-5 presents the average aircraft seat capacity, daily departures, load factors, and percentage of local enplaned passengers in the low growth scenario. Similar to the high growth scenario, Southwest s average seat capacity is estimated to increase from seats per departure in FY 2015 to seats per departure in FY 2032, while departures are estimated to increase from per day in FY 2015 to per day in FY 2016 and remain stable through the forecast period. Load factors and percentage of local enplaned passengers remain unchanged when compared to the high growth scenario. For other airlines, average seat capacity is estimated to decrease from seats per departure in FY 2015 to 81.2 seats per departure in FY 2032, while departures are estimated to decrease from 22.4 per day in FY 2015 to 9.6 per day in FY Load factors for other airlines are estimated to increase from 8.4 percent in FY 2015 to 83.8 percent in FY As in the high growth scenario, the local percentage of other airlines enplaned passengers is estimated to remain at percent, with the exception of FY 2015 to FY 201 due to Virgin America activity. Overall Airport average seat capacity is estimated to increase from seats per departure in FY 2015 to 14.0 seats per departure in FY 2032, while departures are estimated to increase from 12.2 per day in FY 2015 to 15.2 per day in FY DAL load factors are estimated to increase from 80.2 percent in FY 2015 to 85.2 percent in FY Similar to the high growth scenario, the overall percentage of local enplaned passengers is estimated to increase from 5.0 percent in FY 2015 to 62.8 percent in FY Enplaned Passengers Forecast Results The derivative forecasts of enplaned passengers at the Airport are presented in Table 2-6. In the high growth scenario derivative forecast, enplaned passengers are estimated to reach approximately 8.9 million in 2032 (a 1.5 percent compound annual growth rate [CAGR] from 2015). In the low growth scenario derivative forecast, enplaned passengers are estimated to reach approximately 8.0 million in 2032 (a 0.9 percent CAGR from 2015) Aircraft Operations Forecast Results The forecasts of aircraft operations at the Airport are presented in Table 2- and Table 2-8. Non-passenger operations remain unchanged in both derivative forecasts. Sensitivity Analysis [2-15]
25 Table 2-5: Operating Statistics for Airlines Serving the Airport: Low Growth Scenario SOUTHWEST AIRLINES OTHER AIRLINES COMBINED AIRLINES AVERAGE AVERAGE AVERAGE AVERAGE AVERAGE AVERAGE FISCAL SEATS/ DAILY LOAD SEATS/ DAILY LOAD SEATS/ DAILY LOAD YEAR DEPARTURE DEPARTURES FACTOR 1/ LOCAL % DEPARTURE DEPARTURES FACTOR 1/ LOCAL % DEPARTURE DEPARTURES FACTOR 1/ LOCAL % % 64.8% % 100.0% % 66.0% Forecast % 52.6% % 9.9% % 5.0% % 52.6% % 95.5% % 55.9% % 52.9% % 95.% % 54.9% % 53.2% % 100.0% % 54.5% % 53.4% % 100.0% % 54.8% % 54.1% % 100.0% % 55.5% % 54.9% % 100.0% % 56.3% % 55.% % 100.0% % 5.0% % 56.4% % 100.0% % 5.% % 5.2% % 100.0% % 58.4% % 5.8% % 100.0% % 59.0% % 58.5% % 100.0% % 59.% % 59.0% % 100.0% % 60.3% % 59.6% % 100.0% % 60.8% % 60.2% % 100.0% % 61.4% % 60.8% % 100.0% % 61.9% % 61.2% % 100.0% % 62.4% % 61.6% % 100.0% % 62.8% NOTES: For fiscal years ending September 30. 1/ Load factors include through passengers. SOURCES: City of Dallas Aviation Department; Innovata, October 2015; Ricondo & Associates, Inc., October PREPARED BY: Ricondo & Associates, Inc., October Sensitivity Analysis [2-16]
26 Table 2-6: Historical and Forecast Enplaned Passengers: High Growth and Low Growth Scenarios HIGH GROWTH SCENARIO FORECAST LOW GROWTH SCENARIO FORECAST FISCAL YEAR MAINLINE REGIONAL/ COMMUTER TOTAL MAINLINE REGIONAL/ COMMUTER TOTAL ,206, ,93 4,35,886 4,206, ,93 4,35,886 Forecast ,83,33 42,050 6,89,83 6,83,33 42,050 6,89, ,82,933 2,613,85,546,82,933 2,613,85, ,08,680 2,613 8,081,294,41,991 36,24,8, ,358,505 2,613 8,361,119,655,920 0,19,26, ,480,433 2,613 8,483,046,48,93 88,30,83, ,523,18 2,613 8,525,91,0,50 88,30,859, ,546,002 2,613 8,548,615,4,693 88,30,863, ,58,89 2,613 8,581,492,8,51 88,30,85, ,44,200 2,613 8,46,813,851,962 88,30,940, ,911,06 2,613 8,913,689,916,353 88,30 8,004,661 CAGR % -2.1% 5.9% 62.5% -2.1% 5.9% % -15.1% 1.5% 0.9% 4.5% 0.9% NOTES: For fiscal years ending September 30. CAGR Compound Annual Growth Rate Years are only shown in 5 year increments due to the small year-to-year variation. SOURCES: City of Dallas Aviation Department; Innovata, October 201; Ricondo & Associates, Inc., October PREPARED BY: Ricondo & Associates, Inc., October Sensitivity Analysis [2-1]
27 Table 2-: Historical and Forecast Operations: High Growth Scenario FISCAL YEAR MAINLINE PASSENGER AIRLINES REGIONAL/ COMMUTER TOTAL CARGO OTHER AIR TAXI GENERAL AVIATION MILITAR Y TOTAL ,000 8,200 91, ,25 5, ,889 Forecast ,500 3, ,40 0 2,350 5, , ,200 1, , ,450 5, , ,800 1, , ,550 5, , ,800 1, , ,050 58, , ,300 1, , ,550 58, , ,00 1, , ,050 58, ,260 CAGR % -60.5% 3.9% N/A 0.3% 0.1% 0.1% 19.6% % -5.8% 0.6% N/A 0.4% 0.1% 0.0% 0.4% NOTES: For fiscal years ending September 30. CAGR Compound Annual Growth Rate Years are only shown in 5 year increments due to the small year-to-year variation. N/A Not Applicable SOURCES: City of Dallas Aviation Department; Innovata, October 201; Ricondo & Associates, Inc., October PREPARED BY: Ricondo & Associates, Inc., October Sensitivity Analysis [2-18]
28 Table 2-8: Historical and Forecast Operations: Low Growth Scenario FISCAL YEAR MAINLINE PASSENGER AIRLINES REGIONAL/ COMMUTER TOTAL CARGO OTHER AIR TAXI GENERAL AVIATION MILITAR Y TOTAL ,000 8,200 91, ,25 5, ,889 Forecast ,500 3, ,40 0 2,350 5, , ,200 1, , ,450 5, , ,00 2, , ,550 5, , ,200 3,40 12, ,050 58, , ,200 3,40 12, ,550 58, , ,200 3,40 12, ,050 58, ,320 CAGR % -60.5% 3.9% N/A 0.3% 0.1% 0.1% 19.6% % 0.8% 0.1% N/A 0.4% 0.1% 0.0% 0.1% NOTES: For fiscal years ending September 30. CAGR Compound Annual Growth Rate Years are only shown in 5 year increments due to the small year-to-year change in variation. N/A Not Applicable SOURCES: City of Dallas Aviation Department; Innovata, October 201; Ricondo & Associates, Inc., October PREPARED BY: Ricondo & Associates, Inc., October Passenger Airline Aircraft Operations To calculate the number of annual airline aircraft operations that are required to accommodate the forecast number of passengers, assumptions were applied regarding average load factors, number of seats per departure, and average turns per gate. In the high growth scenario derivative forecast, the majority of the increase in operations is expected to result from changes in Southwest s activity over the forecast period and the assumed exit of Virgin America in mid-fy 201. As Southwest implements a new air service profile at the Airport, its average number of seats per departure is expected to increase from seats in FY 2015 to seats in FY 2032, due to greater use of larger Boeing aircraft with 15 seats and an increase in the average number of seats on its Boeing aircraft to 143 seats (see Table 2-4). Additionally, it is expected that the use of its smaller Boeing aircraft with 122 seats will be phased out. Load factors are forecast to be 80.4 percent in FY 2015 and 85.2 percent by FY For the other airlines, the average number of seats per departure is expected to decrease from seats (FY 2015) to 9.0 seats (FY 2032). Sensitivity Analysis [2-19]
29 As the Airport is gate constrained, the growth in airline aircraft operations is tempered over the forecast period, with the majority of growth occurring by FY Passenger aircraft operations are forecast to increase 3.9 percent between FY 2014 and FY However, from FY 2015 through FY 2032, growth in passenger aircraft operations is forecast at 0.6 percent annually as Southwest s average turns per gate increases from approximately 9.2 turns to approximately 9.5 turns over the comparable period. In this derivative forecast, after mid-fy 201, Southwest is the only airline operating mainline aircraft at the Airport. In the low growth scenario derivative forecast, the majority of the decrease in operations is expected to result from the exit of Virgin America in mid-fy 201. The decrease is mitigated by the reintroduction of service by Delta and United Airlines (United). Once Virgin America ceases operations at the Airport, the other airlines average number of seats per departure is expected to decrease from seats in FY 2015 to 81.2 seats in FY 2032 (see Table 2-5). As the Airport is gate constrained, Delta and United are assumed to operate from gates vacated by Virgin America. Delta and United s gate utilization (i.e., turns per gate) is assumed to remain at levels previously operated by these airlines at the Airport. From FY 2015 through FY 2032, growth in passenger aircraft operations is forecast at 0.1 percent annually. Beginning in FY 2018, average turns per gate for all airlines is held constant, resulting in passenger aircraft operations remaining unchanged from FY 2018 to FY Non-Passenger Airline Aircraft Operations Non-passenger aircraft operations (i.e., cargo, general aviation, other air taxi, and military) remained unchanged in the derivative forecasts; they were updated and align with non-passenger forecast growth rates presented in the MPU. In the high growth scenario derivative forecast, total Airport aircraft operations are forecast to increase from 211,50 (FY 2015) to 228,260 (FY 2032), or at a CAGR of 0.4 percent (see Table 2-). In the low growth scenario derivative forecast, total Airport aircraft operations are forecast to reach 216,320 in 2032, a 0.1 percent CAGR from 2015 (see Table 2-8) Forecasts Comparisons Comparisons of forecast enplaned passengers and total aircraft operations at the Airport are presented in Table 2-9 and Table The comparisons are illustrated on Exhibit 2-5 and Exhibit 2-6. Sensitivity Analysis [2-20]
30 FISCAL YEAR MAINLINE Table 2-9: Forecast Comparison Enplaned Passengers MPU FORECAST BASELINE FORECAST HIGH GROWTH SCENARIO FORECAST LOW GROWTH SCENARIO FORECAST REGIONAL/ COMMUTER TOTAL MAINLINE REGIONAL/ COMMUTER TOTAL MAINLINE REGIONAL/ COMMUTER TOTAL MAINLINE / 4,129,84 104,99 4,234,853 4,206, ,93 4,35,886 4,206, ,93 4,35,886 4,206, ,93 4,35,886 Forecast ,966,04 205,09 6,11,153 6,668, ,100 6,801,946 6,83,33 42,050 6,89,83 6,83,33 42,050 6,89, ,090, ,46 6,303,640,556,631 0,556,631,82,933 2,613,85,546,82,933 2,613,85, ,183, ,026 6,405,65,664,024 0,664,024 8,08,680 2,613 8,081,294,41,991 36,24,8, ,22, ,26 6,502,92,65,61 0,65,61 8,358,505 2,613 8,361,119,655,920 0,19,26, ,363,19 239,50 6,602,48,80,513 0,80,513 8,480,433 2,613 8,483,046,48,93 88,30,83, ,388, ,554 6,63,39,901,618 0,901,618 8,523,18 2,613 8,525,91,0,50 88,30,859, ,398,203 25,553 6,655,55,914,425 0,914,425 8,546,002 2,613 8,548,615,4,693 88,30,863, ,414,96 266,3 6,681,04,935,545 0,935,545 8,58,89 2,613 8,581,492,8,51 88,30,85, ,503, ,683 6,818,534 8,046, ,046,891 8,44,200 2,613 8,46,813,851,962 88,30,940, ,616, ,901 6,981,51 8,185, ,185,189 8,911,06 2,613 8,913,689,916,353 88,30 8,004,661 CAGR % 95.4% 45.% 58.5% -11.8% 56.1% 62.5% -2.1% 5.9% 62.5% -2.1% 5.9% % 3.4% 0.% 1.2% % 1.1% 1.6% -15.1% 1.5% 0.9% 4.5% 0.9% NOTES: For fiscal years ending September 30. Years are only shown in 5 year increments due to the small year-to-year variation. CAGR Compound Annual Growth Rate 1/ Represents forecast data for MPU and actual data for high growth scenario and low growth scenario forecasts. SOURCES: City of Dallas Aviation Department; Innovata, October 201; Ricondo & Associates, Inc., October PREPARED BY: Ricondo & Associates, Inc., October REGIONAL/ COMMUTER TOTAL Sensitivity Analysis [2-21]
31 Table 2-10: Forecast Comparison Total Airport Aircraft Operations MPU FORECAST BASELINE FORECAST HIGH GROWTH SCENARIO FORECAST LOW GROWTH SCENARIO FORECAST FISCAL YEAR PASSENGER NON-PASSENGER TOTAL PASSENGER NON-PASSENGER TOTAL PASSENGER NON-PASSENGER TOTAL PASSENGER NON-PASSENGER TOTAL / 96,493 83,08 19,580 91,200 85,689 16,889 91,200 85,689 16,889 91,200 85,689 16,889 Forecast ,201 83, ,455 12,152 85, , ,40 85, ,50 125,40 85, , ,425 83, ,846 13,440 85, , ,380 85, , ,380 85, , ,64 83,58 204,234 13,440 86, , ,980 86, , ,160 86,130 21, ,29 84, ,158 13,440 86, , ,980 86, ,860 12,940 86, , ,04 85,281 20,985 13,440 8, , ,480 8, ,110 12,940 8, , ,622 86, ,66 13,440 88, ,80 139,880 88, ,260 12,940 88, ,320 CAGR % 0.2% 13.3% 39.4% 0.2% 20.4% 3.9% 0.2% 19.6% 3.9% 0.2% 19.6% % 0.2% 0.2% 0.5% 0.2% 0.3% 0.6% 0.2% 0.4% 0.1% 0.2% 0.1% NOTES: For fiscal years ending September 30. CAGR Compound Annual Growth Rate Years are only shown in 5 year increments due to the small year-to-year variation. 1/ Represents forecast data for MPU and actual data for high growth scenario and low growth scenario forecasts. SOURCES: City of Dallas Aviation Department; Innovata, October 201; Ricondo & Associates, Inc., October PREPARED BY: Ricondo & Associates, Inc., October Sensitivity Analysis [2-22]
32 Exhibit 2-5: Forecast Comparison Enplaned Passengers NOTES: Enplaned Passengers (millions) For fiscal years ending September 30. SOURCES: City of Dallas Aviation Department; Innovata, October 201; Ricondo & Associates, Inc., October PREPARED BY: Ricondo & Associates, Inc., October Historical MPU Forecast Baseline Forecast High Growth Scenario Low Growth Scenario Sensitivity Analysis [2-23]
33 Exhibit 2-6: Forecast Comparison Total Airport Aircraft Operations NOTES: Total Airport Aircraft Operations 300, , , , ,000 50,000 0 For fiscal years ending September 30. SOURCES: City of Dallas Aviation Department; Innovata, October 201; Ricondo & Associates, Inc., October PREPARED BY: Ricondo & Associates, Inc., October Historical MPU Forecast Baseline Forecast High Growth Scenario Low Growth Scenario Sensitivity Analysis [2-24]
34 3. Landside Facilities This section describes the existing and future needs for the following landside facilities based on the Sensitivity Analysis baseline and high growth forecasts. The low growth forecast requirements were not addressed as they were similar to the baseline forecast. The facilities addressed are as follows: On-Airport public and employee parking Airport access, including on-airport roadways, off-airport roadways, and curbside Rental car customer service areas, service sites, and facilities Automobile parking for DAL passengers and other users of the Airport can be categorized as on-airport and off-airport. On-Airport facilities are managed by the Parking Company of America under contract with the City of Dallas (the City). Off-Airport facilities are privately owned and operated. Also at the Airport, the City maintains a cell phone waiting lot and several parking facilities for employees. Exhibit 3-1 shows the various on-airport public and employee parking facilities addressed in this Sensitivity Analysis. Other parking facilities on Airport property that are privately operated and managed by tenants were not evaluated as part of the MPU parking analysis. Space requirements for all on-airport parking facilities maintained by the City are discussed in this section. Requirements were determined by estimating parking demand and rounding up to the nearest 10 spaces. Future requirements were determined by applying growth factors derived from forecast aviation activity. Requirements were compared to available capacity in order to identify surpluses and deficiencies. Design day requirements were estimated to correspond with spaces that would be needed to meet demand on a typical busy day. Peak-day requirements were estimated to accommodate demand during very busy holidays or other special events. 3.1 Airport Parking Facility Requirements Sensitivity Analysis [3-1]


35 Exhibit 3-1: On-Airport Parking Facilities and Capacities SOURCES: Permission Guidelines for Google Maps and Google Earth, (accessed March 01, 2013; Ricondo & Associates, Inc., March PREPARED BY: Ricondo & Associates, Inc., January ON-AIRPORT PUBLIC PARKING DAL has two garages that serve the public. Garage A, closest to the terminal entrance, contains 2,980 parking spaces and serves more short-term parkers. The rate charged in Garage A is incremental, up to a maximum of $1 per day. Garage B is immediately adjacent to Garage A, slightly farther from the terminal, and serves more long-term parkers; it contains 4,000 parking spaces. The rate charged in Garage B is also incremental, up to a maximum of $13 per day. A parking analysis was completed in 2008 based on 2006 data. 4 The methodology used for the 2008 analysis was also used for the 2013 master plan analysis; relevant data were updated to appropriately reflect more current conditions Data Collection and Demand/Capacity Analysis Prior to conducting the parking analysis, various parking data were obtained from the City, in which calendar year 2012 was assumed as a base for estimating existing conditions. The 2012 data included: Total parking spaces by facility Combined monthly total transactions and revenue collected by the parking revenue control system 4 Ricondo & Associates, Inc., Dallas Love Field Public Parking Assessment, technical memorandum issued to Roddy L. Boggus, Senior Vice President, Parsons Brinkerhoff, January 4, Sensitivity Analysis [3-2]
36 (PRCS), from TollTags, and from other parking facility access modes (e.g., employee access cards) Daily TollTag transactions by facility Daily PRCS transactions by facility and parking duration, including daily overnight occupancy counts by facility Other qualitative and anecdotal information was obtained to supplement the quantitative data. The raw data were processed, analyzed, and organized to illustrate how the on-airport public parking system operates, as well as to establish 2012 conditions and demand and to identify trends used to determine future requirements. Transactions and Revenue Exhibit 3-2 shows monthly transactions and revenue data for calendar year 2012, which indicate that October is the peak month for revenue. The data include all sources of transactions and revenue. Transactions (in thousands) Exhibit 3-2: On-Airport Public Parking Transactions and Revenue SOURCES: Parking Company of America, April 2013; Ricondo & Associates, Inc., April PREPARED BY: Ricondo & Associates, Inc., January $2.0 $1.9 $1.8 $1. $1.6 $1.5 $1.4 $1.3 $1.2 $1.1 $1.0 $0.9 $0.8 $0. $0.6 $0.5 $0.4 $0.3 $0.2 $0.1 $- Jan Feb Mar Apr May Jun Jul Aug Sep Oct Nov Dec 2012 Transactions Revenue Revenue (in millions) Duration Reports Exhibit 3-3 shows transactions by duration for each garage. The operational differences between Garages A and B are most evident in these data. Garage A had more transactions for all parking durations up to 3 days. Garage B had more transactions for parking durations longer than 3 days. Sensitivity Analysis [3-3]
37 Exhibit 3-3: On-Airport Parking Revenue Control System Transactions by Duration Transactions 11,000 10,000 9,000 8,000,000 6,000 5,000 4,000 3,000 2,000 1, Hours 2012 Duration Period Garage A Garage B SOURCES: Parking Company of America, April 2013; Ricondo & Associates, Inc., April PREPARED BY: Ricondo & Associates, Inc., January The duration reports only provided data for transactions from PRCS ticket receipts and did not account for TollTag transactions, but it was assumed that the TollTag transaction profile would be similar to that produced by PRCS users. Supplemental information provided by Parking Company of America indicated that, on typical busy days, Garage A fills to near capacity, causing staff to close it and forcing additional short-term parkers into Garage B. This may account for the significant number of short-duration (less than 3 hours) transactions occurring in Garage B. Also, more closures of Garage A occurred in October than in any other month of 2012, due to the high use of the garage without any holiday events, which supports the selection of October 2012 to represent typical busy demand. Days Sensitivity Analysis [3-4]
38 Overnight Occupancy Counts Exhibit 3-4 shows a weekly profile of daily overnight occupancy levels in Garages A and B in October These data represent non-short-term parkers (i.e., parkers staying more than 9 hours). The use of Garage A, which is potentially used by a higher proportion of business travelers, peaks in the middle of the week. The use of Garage B also peaks in the middle of the week, but the peak is sustained toward the end of the week and over the weekend more than Garage A, possibly due to a higher proportion of leisure-traveler use. Overnight Occupancy (spaces) 2,000 1,800 1,600 1,400 1,200 1, Exhibit 3-4: On-Airport Public Parking Overnight Occupancy SOURCES: Parking Company of America, April 2013; Ricondo & Associates, Inc., April PREPARED BY: Ricondo & Associates, Inc., January Estimating 2012 Demand Sun Mon Tue Wed Thu Fri Sat 2012 October Day of the Week Garage A Garage B It was known that the daily occupancies in Garages A and B reach their peaks in the middle of the week during the busy months of the year. At such times, Garage A fills completely, and overflow demand is accommodated in Garage B, which becomes a little more than half-full. The significant number of customers parking for multiple days in Garage A is potentially due to the predominance of business activity at the Airport. Demand in the garages does not reach capacity at other times during the year, including holidays; although, demand in longterm Garage B is higher than in Garage A during holiday periods. This holiday profile could be attributed to a decrease in business travelers, but it could also be attributed to an increase in leisure travelers who are more sensitive to the cost of parking. Daily peak occupancies can be analyzed to determine demand for parking spaces; however, since daily peak occupancies were not available from the PRCS, another method was employed to estimate demand. Transaction data from the duration report for October 2012 were used as the basis for estimating demand. Sensitivity Analysis [3-5]
39 Daily transaction and revenue data for October 2012 were used to calculate average transactions, peak transactions, and the surge in transactions from the average to the peak. The peak days in October 2012 for Garages A and B, respectively, had 39.1 percent and 3.5 percent more transactions than the average day. These data were used to adjust estimates of demand from the average to the busy day. Table 3-1 presents the calculations used to estimate demand in Garages A and B. The actual calculations supporting this table were based on the smallest duration periods possible (as reported in the raw data) in order to maintain fidelity. The numbers in the table were aggregated for reporting purposes. Table 3-1: 2012 On-Airport Public Parking Space Demand GARAGE A TRANSACTIONS FROM TO MONTHLY 1/ BUSY DAY GARAGE B TRANSACTIONS BUSY DAY DEMAND MONTHLY 1/ BUSY DAY BUSY DAY DEMAND TOTAL BUSY DAY DEMAND DURATION DISTRIBUTION 0 hours 3 hours 9, , % 3 hours 24 hours 4, ,30 1, ,12 2, % 24 hours 9, ,061 6, , % Total 23,228 2,610 11,199 2,246 4, % % Full: 8.6% 56.2% Estimated Overnight: 1,811 1,583 3,394 % Full: 60.8% 39.6% 48.6% Actual Overnight: 1,812 1,583 3,395 % Full: 60.8% 39.6% 48.6% % Different from Estimated: 0.0% 0.0% 0.0% Capacity: 2,980 4,000 6,980 NOTE: 1/ Parking Revenue Control System only. SOURCES: City of Dallas, 2012; Ricondo & Associates, Inc., April PREPARED BY: Ricondo & Associates, Inc., January An estimated turnover rate for each duration period was calculated based on a few assumptions. For those periods longer than 1 day, the turnover rate is simply the inverse of the average number of days for that period (e.g., for the 2 to 3 day period, the turnover rate would be 1/2.5). For shorter periods, the turnover rate was calculated based on the average parking duration, the assumed number of busy operational Airport hours per day (1 hours), and an additional calibration factor. The number of October 2012 transactions was divided by the number of days in the month (31 days) and then increased by the average-to-peak-day surges to estimate the number of busy day transactions. Busy day demand was then calculated by dividing the estimated number of busy day transactions by the estimated turnover rate to determine the required number of spaces. Sensitivity Analysis [3-6]
40 To validate the calculations, the statistics provided at the bottom of Table 3-1 were calculated and compared. The estimated overnight demand was the summation of the estimated busy day demand for durations longer than 1 day and 0 percent of the demand for durations between 10 and 24 hours. The actual overnight demand represents the average overnight occupancy recorded in October Calibration factors for each facility were adjusted so that the estimated overnight demand matched actual demand. When comparing demand to capacity, a practical capacity was utilized. To account for the inability to completely fill a facility, a level of service factor was applied. It was assumed that Garage A would fill to 90 percent before it would have to be closed, and it was assumed that Garage B would be closed when its occupancy approached 95 percent. Such closures are a customer service feature that prevents customers from spending excessive time searching for the few remaining unoccupied spaces, assuming that users of Garage A require a slightly higher level of service than users of Garage B. Based on information received from Airport staff, on a typical busy day, Garage A becomes full (approaching 90 percent full, at which point it is closed), and overflow demand spills into Garage B, which only reaches a little over half-full. These results are reflected in the estimated demand shown in Table 3-1 for each facility. These statistics verify that the estimates of demand are reasonable. Prior to this analysis, some employees had been issued cards providing them access to Garage B. These employees were estimated to require almost 500 spaces in It was assumed that, for this analysis, these employees would be accommodated in an employee-dedicated facility in the future and would no longer occupy spaces accessible to the public Forecasting Future Demand and Requirements The increase in originating passengers was used to estimate future parking requirements. The numbers of enplaned passengers in 2012 and the forecast numbers through 2032 were used to calculate expected growth in public parking demand at the Airport. Exhibit 3-5 depicts forecast changes in passenger activity. Based on transactions, total 2012 design day demand was estimated to be 4,856 spaces. Similarly, total overnight occupancy in 2012 was estimated to be 3,394 spaces (0 percent of design demand). The relationship between daily peak and overnight demand was assumed to be constant over the planning horizon and was applied to the maximum observed October 2012 overnight occupancy (3,818 spaces) in order to estimate a total peak day demand of 5,462 spaces. The level of service factors were then applied to design day demand, and both design and peak day demands were rounded up to the nearest 10 spaces to estimate 2012 requirements, as shown in Table 3-2, highlighting a need for 5,240 spaces on the design day and 5,40 spaces on the peak day, in which both are below the total capacity of 6,980 spaces. Sensitivity Analysis [3-]
41 Exhibit 3-5: Forecast Enplaned Passenger Activity Passengers (Millions) Historic Annual Enplaned Passengers Historic Annual Originating Enplaned Passengers Baseline Scenario Forecast Annual Originating Enplaned Passengers Baseline Scenario Forecast Annual Enplaned Passengers High Growth Scenario Annual Originating Enplaned Passengers High Growth Scenario Annual Enplaned Passengers SOURCE: Ricondo & Associates, Inc., January PREPARED BY: Ricondo & Associates, Inc., January Fiscal Year Sensitivity Analysis [3-8]
42 Table 3-2: Estimated On-Airport Public Parking Space Requirements Enplaned Passengers (millions) Originating Enplaned Passengers (millions) BASELINE FORECAST HIGH GROWTH SCENARIO FORECAST EXISTING (2012) REQUIREMENTS (SPACES) 1/ DESIGN DAY 2/ CAPACITY DEMAND REQUIREMENTS 1/ Garage A 2,980 2,609 2,880 3,90 4,940 5,440 4,020 5,00 5,630 Garage B 4,000 2,246 2,360 3,260 4,060 4,40 3,300 4,10 4,630 Total 6,980 4,856 4,40 6,540 8,140 8,960 6,620 8,360 9,280 Surplus/(Deficit) 2, (1,160) (1,980) 360 (1,380) (2,300) PEAK DAY Total 6,980 5,462 4,90 6,860 8,530 9,410 6,940 8,60 9,40 Surplus/(Deficit) 2, (1,550) (2,430) 40 (1,80) (2,60) NOTES: 1/ Requirement rounded up to nearest 10 spaces. Includes 500 employee spaces removed. 2/ Level of service factors of 10 percent and 5 percent were applied to Garages A and B, respectively. SOURCE: Ricondo & Associates, Inc., January PREPARED BY: Ricondo & Associates, Inc., January Applying the proportional changes in passenger activity to the 2012 total design and peak day demands produced future total demands. Applying the same level of service factors and the same rounding as 2012 requirements produced estimated future design and peak day requirements, as depicted on Exhibit 3-6 for the baseline forecast and Exhibit 3- for the high growth scenario forecast. Sensitivity Analysis [3-9]
43 Exhibit 3-6: Estimated Public Parking Requirements (Baseline Forecast) Required Spaces 11,000 10,000 9,000 8,000,000 6,000 5,000 4,000 3,000 2,000 1,000 0 Constrained Garage A Garage A Overflow into Garage B Constrained Garage B Garage B Overflow Peak Day Garage A Capacity Garage A and Garage B Capacity SOURCE: Ricondo & Associates, Inc., January PREPARED BY: Ricondo & Associates, Inc., January Sensitivity Analysis [3-10]
44 Exhibit 3-: Estimated Public Parking Requirements (High Growth Scenario Forecast) Required Spaces 11,000 10,000 9,000 8,000,000 6,000 5,000 4,000 3,000 2,000 1,000 0 Constrained Garage A Garage A Overflow into Garage B Constrained Garage B Garage B Overflow Garage A Capacity Garage A and Garage B Capacity Peak Day SOURCE: Ricondo & Associates, Inc., January PREPARED BY: Ricondo & Associates, Inc., January As shown in Table 3-2, the existing garages would be unable to accommodate all demand on typically busy days at the activity levels forecast through the planning period. Capacity could be expected to be insufficient on typically busy days and on peak days beginning in 2016 for both the baseline and the high growth scenario forecasts. By 2032, an additional 1,160 spaces could be required to consistently accommodate demand when using the baseline forecast, and 2,190 spaces could be required to accommodate demand when using the high growth scenario forecast. On the absolute peak day in 2032, 2,430 additional spaces would be required to accommodate all demand when using the baseline forecast, and 2,60 spaces would be required when using the high growth scenario forecast Conclusions For both forecast scenarios, Garages A and B are expected to be insufficient in regards to accommodating future design day or peak day demand. The timing of the need for new spaces will be dependent on the rate at which demand increases, which is in turn dependent on the rate at which activity (specifically originating passenger Sensitivity Analysis [3-11]
45 activity) increases at the Airport. Future demand is also dependent on other factors, such as the split between different types of travel (i.e., business vs. leisure) and economic factors (e.g., parking rates, airline ticket fares), that may or may not change the profile of demand in the future. At the time of this Sensitivity Analysis, Garage C was under design to accommodate approximately 3,800 parking spaces with an additional 1,000 spaces available for valet parking on the two lower levels. Garage C is intended to meet the parking demand through ON-AIRPORT EMPLOYEE PARKING The on-airport employee parking facilities maintained by the City and considered in this analysis are located in the terminal area, as depicted on Exhibit 3-1. Other facilities not considered in this analysis are reserved for and managed by Airport tenants. Total on-airport employee parking capacity is 49 spaces. Estimated 2012 on-airport employee parking demand was provided by the City, in which the information was obtained through a survey of tenants and users requiring parking in Airport-operated facilities. These demands are summarized in Table 3-3. Table 3-3: 2012 On-Airport Employee Parking Space Demand TENANT DEMAND Department of Aviation 15 Department of Aviation Employee Parking 159 Communications Center 5 Badging 3 Additional 8 Federal Aviation Administration 55 Transportation Security Administration 42 Other Airlines 40 Southwest Airlines 15 Concessionaires 40 Other 0 Dallas Police Department 30 Taxicab Starters 5 Diamond Security 6 Weather Staffing Contractor 1/ 4 Visitor 25 Total 43 NOTE: 1/ Contract group providing weather staffing at the Airport named FOFM/AWO in SOURCE: City of Dallas, PREPARED BY: Ricondo & Associates, Inc., January Sensitivity Analysis [3-12]
46 Changes in employee parking demand are caused by changes in staffing, which are related in part to changes in passenger activity (e.g., concessionaires) and in part to changes in the number of aircraft operations (e.g., maintenance) at the Airport. For this reason, changes in employee parking demand were estimated based on the average change rates of passenger activity, as depicted on Exhibit 3-5, and aircraft operations, as depicted on Exhibit 3-8. Employee parking demands were converted to requirements by rounding up to the nearest 10 spaces. Estimated employee parking requirements are depicted on Exhibit 3-9 for the baseline forecast and on Exhibit 3-10 for the high growth scenario forecast; they are also summarized in Table 3-4. As a result of the forecast increase in aviation activity at the Airport and the accommodation of employee parking displaced from Parking Garages A and B, an additional 93 spaces would be required by 2032 for the baseline forecast. For the high growth scenario forecast, an additional 1,113 spaces would be required by The location of the employee spaces is to be determined. Starting in October 2014, employees have been shuttled from Love Hub on Lemmon Avenue. Aircraft Operations (Thousands) SOURCE: Ricondo & Associates, Inc., January PREPARED BY: Ricondo & Associates, Inc., January Exhibit 3-8: Forecast Aircraft Operations Fiscal Year Historic Annual Aircraft Operations Baseline Scenario Annual Aircraft Operations High Growth Scenario Annual Aircraft Operations Sensitivity Analysis [3-13]
47 Exhibit 3-9: Forecast Employee Parking Requirements (Baseline Forecast) Required Spaces 1,800 1,600 1,400 1,200 1, SOURCE: Ricondo & Associates, Inc., January PREPARED BY: Ricondo & Associates, Inc., January Constrained Overflow Capacity With Current Garage A and Garage B Parkers Sensitivity Analysis [3-14]
48 Exhibit 3-10: Forecast Employee Parking Requirements (High Growth Scenario Forecast) Required Spaces 1,800 1,600 1,400 1,200 1, SOURCE: Ricondo & Associates, Inc., January PREPARED BY: Ricondo & Associates, Inc., January Constrained Overflow Capacity With Current Garage A and Garage B Parkers Sensitivity Analysis [3-15]
49 Table 3-4: Estimated On-Airport Employee Parking Space Requirements YEAR BASELINE FORECAST HIGH GROWTH SCENARIO FORECAST EXISTING (2012) Enplaned Passengers (millions) Originating Passengers (millions) Aircraft Operations (thousands) Employee Lot Requirements 1/ Plus Garage A/Garage B Parkers Requirements 1/ 940 1,240 1,391 1,40 1,220 1,465 1,610 Average Growth 2/ % 48.0% 56.4% 29.% 55.9% 1.3% Surplus/(Deficit) (443) (43) (894) (93) (23) (968) (1,113) NOTES: 1/ Rounded up to nearest 10 spaces. 2/ From 2012 data. SOURCE: Ricondo & Associates, Inc., January PREPARED BY: Ricondo & Associates, Inc., January Airport Access Requirements Ricondo & Associates, Inc. conducted a demand/capacity analysis for the Airport s access and ground support system components. This analysis includes a review of previous demand/capacity analyses and incorporates the results of the sensitivity forecasts prepared by R&A for the MPU FORECASTS For this Sensitivity Analysis, gated flight schedules were developed for year 2015, in addition to baseline and high growth scenarios for year 2024 and year These forecasts were converted to rolling 60-minute passenger volumes at curbside by applying airline load factors, Origin and Destination(O&D) percentages, and lead/lag time at curbside to the gated passenger flight schedules. Since DAL has both arrival and departure functions on the same level at the Airport, the combined arrivals plus departures passenger (total passenger) peak period is most critical for this analysis. Measuring the passenger results at curbside, the baseline and high growth scenarios for 2024 and 2032 resulted in almost identical peak values, with only the high growth scenario having higher passenger volumes in the hours between the peaks. As a result, the baseline growth scenario had higher values during the peak periods and, therefore, was utilized in this analysis. Exhibit 3-11 compares the baseline growth scenario with the high growth scenario for 2024 and Sensitivity Analysis [3-16]
50 Exhibit 3-11: Baseline Growth versus High Growth Scenario Total Passengers at Curbside (2024 and 2032) Passenger Volume at Curb 2,600 2,400 2,200 2,000 1,800 1,600 1,400 1,200 1, :00 5:30 6:00 6:30 :00 :30 8:00 8:30 9:00 9:30 10:00 10:30 11:00 11:30 12:00 12:30 13:00 13:30 14:00 14:30 15:00 15:30 16:00 16:30 1:00 1:30 18:00 18:30 19:00 19:30 20:00 20:30 21:00 21:30 22:00 22:30 23:00 23:30 60-minute Rolling Hour Time of Day (Hour Ending) 2032 High DEPARTURES + ARRIVALS 2032 Baseline DEPARTURES + ARRIVALS 2024 High DEPARTURES + ARRIVALS 2024 Baseline DEPARTURES + ARRIVALS NOTE: The time for the graph begins at 5:00am due to the Voluntary Noise Abatement Program which allows no commercial flight to depart earlier than 6:00 a.m. SOURCE: Ricondo & Associates, Inc., June PREPARED BY: Ricondo & Associates, Inc., June To obtain the future growth relationships relative to the baseline 2013 calibrated data used in the MPU, the total arrival plus departure passenger volumes at curbside for 2015, 2024, and 2032 were compared on Exhibit The resulting morning and afternoon peaks from these graphs are tabulated in Table 3-5, and result in peak hour growth rates that were used to project the landside roadway volumes accordingly. Sensitivity Analysis [3-1]
51 Exhibit 3-12: Departures and Arrivals Passengers at Curbside (2013/2015/2024/2032) Passenger Volume at Curb 2,600 2,400 2,200 2,000 1,800 1,600 1,400 1,200 1, :00 5:30 6:00 6:30 :00 :30 8:00 8:30 9:00 9:30 10:00 10:30 11:00 11:30 12:00 12:30 13:00 13:30 14:00 14:30 15:00 15:30 16:00 16:30 1:00 1:30 18:00 18:30 19:00 19:30 20:00 20:30 21:00 21:30 22:00 22:30 23:00 23:30 NOTE: The time for the graph begins at 5:00am due to the Voluntary Noise Abatement Program which allows no commercial flights to depart earlier than 6:00 a.m. SOURCE: Ricondo & Associates, Inc., June PREPARED BY: Ricondo & Associates, Inc., June Table 3-5: Peak Hour Passenger and Growth Rates for Landside A.M. PEAK P.M. PEAK A.M. PEAK P.M. PEAK A.M. PEAK P.M. PEAK A.M. PEAK P.M. PEAK 6:10 A.M. - :10 A.M. 6:35 P.M. - :35 P.M. 60 minute Rolling Hour Time of Day (Hour Ending) 2032 Baseline DEPARTURE + ARRIVALS 2024 Baseline DEPARTURES + ARRIVALS 2015 DEPARTURES + ARRIVALS 2013 DEPARTURES + ARRIVALS 5:50 A.M. - 6:50 A.M. 5:15 P.M. - 6:15 P.M. 5:55 A.M. - 6:55 A.M. 5:15 P.M. - 6:15 P.M. 5:55 A.M. - 6:55 A.M. 5:15 P.M. - 6:15 P.M. Departures Passengers , ,94 1,019 1,843 1,145 Arrivals Passengers , , ,40 Total Passengers 851 1,191 1,499 1,98 1,855 2,24 1,912 2,552 Growth Relative to % 51.0% 118.0% 90.9% 124.% 114.3% SOURCE: Ricondo & Associates, Inc., June PREPARED BY: Ricondo & Associates, Inc., June Sensitivity Analysis [3-18]
52 3.2.2 ON-AIRPORT ROADWAYS The on-airport roadway demand/capacity analysis conducted for the MPU consisted of updating the trip generation and trip assignment models developed for the Love Field Modernization Program (LFMP). For the Sensitivity Analysis, the following infrastructure and operational changes were incorporated for the 2024 and 2032 models: Opening of public parking Garage C on Aviation Place, with the diversion of 43 percent of on-airport parking demand to this new parking structure Inbound Herb Kelleher Way at Aviation Place intersection improvements to allow two outbound lanes from Aviation Place Outbound Herb Kelleher Way at Contrail Lane intersection reconfiguration to reduce the outbound Herb Kelleher Way lanes from four lanes to three, allowing for free-flow left turn of outbound Contrail Lane onto Herb Kelleher Way Relocation of the cell phone lot to a new location on Aviation Place Relocation of the on-airport rental car companies to a Consolidated Rental Car Facility (Site 3) at the location of Denton Drive and Mockingbird Lane A spreadsheet demand/capacity model was created to calculate the capacity of the roadway system on a linkby-link basis. The terminal area roadways are classified based on speed-flow rate tables applicable to airport roads, as developed in conformance with Airport Cooperative Research Program (ACRP) Report 40, Airport Curbside and Terminal Area Roadway Operations. The capacity and level of service ranges for terminal area roadways are summarized on Exhibit Roadways at DAL range from entry/exit roadways with speeds of 40 miles per hour to curbside roadways with speeds below 20 miles per hour. For the ease of identifying links in the analysis table, each link was given a letter designation. Exhibit 3-14 provides a map of the links considered in this demand/capacity analysis. The link-by-link demand/capacity analysis was conducted for 2015, 2024, and 2032 for both the a.m. and p.m. peak periods based on the growth factors relative to originating enplaned passengers. The resulting link demand volumes and resulting level of service (LOS) for each link are presented in Table 3-6. LOS A represents the optimal operating condition, characterized by uninterrupted free-flow operations. At the other end of the scale, LOS F represents the worst operating condition, characterized by severe roadway congestion and delay. LOS C is generally a desirable operating condition for the design of new facilities; however, LOS D conditions may be acceptable at some larger airports during peak periods. For purposes of analyzing existing facilities and the need to provide improvements, it was assumed that LOS D conditions would trigger capacity enhancements or demand reduction measures before LOS E or LOS F conditions occur. Sensitivity Analysis [3-19]
53 09 W 3 5 W / 1 W / 5 / W 3 - / W / W 5 8 / - W / 3 W 9 - W / 1 W / W 3-3 / W 9-3 W 5 8 / - W W 3 9 W 3 - / - / W 5 8 / W - W 3 W / - W 9-3 / W / W - W 0 Jetway Systems - A3 68 / 144 (TRUSS) W 8-3 / 1 W / 5 / W W / Jetway Systems - A3 61 / 12 (TRUSS) Jetway Systems - A3 68 / 144 (TRUSS) 03 Jetway Systems - A3 61 / 12 (TRUSS) Jetway Systems - A3 68 / 144 (TRUSS) 04 Jetway Systems - A3 58 / 116 (TRUSS) Jetway Systems - A3 58 / 116 (TRUSS) Jetway Systems - A3 68 / 144 (TRUSS) W 8-3 / 1 W / 5 / W W W / W 5 8 / - W W / 3 3 W 8-3 / W / 5 / W 3-3 W 9 - Aviation Place Aviation Place Herb Kelleher Way Herb Kelleher Way Contrail Lane Recirculation Road Jetway Systems - A3 68 / 144 (TRUSS) Jetway Systems - A3 68 / 144 (TRUSS) DALLAS LOVE FIELD Roadway Classification Speed (mph) A Entry/Exit Roadway Terminal Loop Road Terminal Access Road Curbside Service Road Maximum Capacity Ranges Level of Service B C ,130 1,10 1,010 1,010 1,010 1,410 D E Capacity = number of vehicles per hour per lane SOURCES: Transportation Research Board, ACRP Report 40, July Ricondo & Associates Inc, June PREPARED BY: Ricondo & Associates, Inc., June NORTH 0 NTS Drawing: N:\Love Field\21 Landside Sensitivity Analysis\05 CAD\Data Collection Plan_v5_SA_rev.dwg_Layout: Exhibit 3-13_Jul 2, 201, 10:44am Sensitivity Analysis Tom Braniff Lane Herb Kelleher Way Mockingbird Lane Edwards Avenue Hawes Avenue AUGUST 201 Colville Avenue Ansley Avenue Waddell Avenue Ralston Avenue Aubrey Avenue EXHIBIT 3-13 Roadway Link Capacities

54 I DALLAS LOVE FIELD AUGUST 201 ),.. Lower Level Roadway (Commercial Vehicles) ~ : ) Upper Level Roadway (Private Vehicles) SOURCE: Ricondo & Aoooci bls, Inc., June PREPARED BY: Rlcondo & Assodates. Inc. Juno " NOl{TH 0 I Sensitivity Analysis Herb Kelleher Way NTS Aviation Place Contrail Lane '":I:====== == Recirculation Road ~ J U::::::::!:=='=::Y '---- J Roadway Network Link Designations
55 LINK LOCATION Table 3-6: Terminal Area Roadway Demand/Capacity Analysis NUMBER OF LANES LINK SPEED MAXIMUM LOS E BASELINE CAPACITY 1/ VEHICLES PER LANE PER HOUR LINK CAPACITY (VEHICLES/ HOUR) VOLUME A.M. PEAK P.M. PEAK A.M. PEAK P.M. PEAK A.M. PEAK P.M. PEAK A Herb Kelleher Way, Inbound between Mockingbird Lane and Hawes Avenue ,410 5,640 1,98 B 1,259 A 2,283 B 1,128 A 2,353 B 1,265 A B Herb Kelleher Way, Inbound between Hawes Avenue and Tom Braniff Lane ,410 5,640 1,95 B 1,289 A 2,268 B 1,165 A 2,338 B 1,30 A C Herb Kelleher Way, Inbound between Tom Braniff Lane and 2nd Recirculation Road ,410 4,230 2,126 C 1,514 B 2,454 C 1,449 B 2,530 C 1,626 B D Herb Kelleher Way, Inbound between 2nd Recirculation Road and Outbound Recirculation Road ,10 4,680 2,159 C 1,581 B 2,531 C 1,688 B 2,608 C 1,894 B E Herb Kelleher Way, Inbound between Outbound Recirculation Road and Aviation Place Exit ,10 3,510 2,084 C 1,489 C 2,530 D 1,83 C 2,608 D 2,061 C F Herb Kelleher Way, Inbound between Aviation Place Exit and Contrail Lane Outbound Road ,10 3,510 1,68 C 1,36 B 1,634 C 1,409 B 1,684 C 1,581 C G Herb Kelleher Way, Inbound between Aviation Place Exit and Aviation Place Inbound to Terminal ,10 4,680 1,22 B 1,468 B 1,25 B 1,610 B 1,8 B 1,806 B H Herb Kelleher Way, Inbound prior to Garages A and B Entrance ,010 6,060 1,22 B 1,468 A 1,25 B 1,610 B 1,8 B 1,806 B I Herb Kelleher Way, Inbound between Garages A and B Entrance and Upper/Lower Level Terminal Split ,010 6, A 1,341 A 1,190 A 1,33 B 1,22 A 1,945 B K Entrance to Garages A and B ,010 1, D 12 A 535 C 91 A 552 C 102 A S Upper Level Curbside Exit ,010 2, B 1,050 C 933 C 1,365 D 962 C 1,532 D T Lower Level Curbside Exit ,010 1, A 292 B 25 B 368 B 265 B 414 C U Herb Kelleher Way, Outbound between Terminal Exit and Garages A and B Exit Road ,10 3, B 1,341 B 1,190 B 1,33 C 1,22 B 1,945 C V Garages A and B Exit Road ,10 2, A 563 A 33 A 405 A 34 A 454 A W Herb Kelleher Way, Outbound between Garages A and B Exit and 1st Recirculation Road ,10 4,680 1,009 A 1,905 B 1,223 B 2,138 C 1,261 B 2,400 C X Herb Kelleher Way, Outbound between 1st Recirculation Road and Contrail Lane ,10 3, B 1,813 C 1,180 B 2,022 C 1,216 B 2,269 D Y Herb Kelleher Way, Outbound between Contrail Lane and Outbound Recirculation Road ,10 4,680 1,256 B 2,026 C 1,554 B 2,598 C 1,602 B 2,916 D Z Herb Kelleher Way, Outbound between Outbound Recirculation Road and 2nd Recirculation Road ,10 4,680 1,331 B 2,118 C 1,600 B 2,631 C 1,649 B 2,952 D AA Herb Kelleher Way, Outbound between 2nd Recirculation Road and Tom Braniff Lane ,410 4,230 1,298 B 2,050 C 1,558 B 2,50 C 1,606 B 2,813 D AB Herb Kelleher Way, Outbound between Tom Braniff Lane and Hawes Avenue ,410 5,640 1,312 A 2,054 B 1,259 A 2,3 B 1,298 A 2,66 C AC Herb Kelleher Way, Outbound between Hawes Avenue and Mockingbird Lane ,410 5,640 1,248 A 1,955 B 1,181 A 2,252 B 1,21 A 2,52 C AD Hawes Avenue, Northbound ,10 1,10 4 A 105 A 91 A 133 A 94 A 149 A AE Hawes Avenue, Southbound ,10 1,10 34 A 63 A 42 A 80 A 44 A 90 A AF Tom Braniff Lane, Northbound ,010 1, A 80 A 28 A 118 A 29 A 133 A AG Tom Braniff Lane, Southbound ,010 1, A 232 A 90 A 158 A 93 A 1 A AH 2nd Recirculation Road ,10 1,10 33 A 68 A 41 A 124 A 43 A 139 A AI Outbound Recirculation Road ,10 1,10 6 A 92 A 46 A 32 A 4 A 36 A AJ Contrail Lane, Outbound adjacent to 1st Recirculation Road ,010 1, B 213 A 349 B 269 B 359 B 302 B AK 1st Recirculation Road ,010 1, A 92 A 44 A 116 A 45 A 131 A AL Aviation Place, Northbound Exit Road ,010 1, B 21 A 803 E 311 B 828 E 349 B AN Aviation Place, Southbound Outbound Lanes through Intersection at Herb Kelleher Way ,010 2, A 121 A 280 A 460 A 289 A 516 B NOTE: 1/ Refer to Exhibit 3-13 for roadway link capacities for all LOS ranges. SOURCE: Ricondo & Associates, Inc., June PREPARED BY: Ricondo & Associates, Inc., June LEVEL OF SERVICE VOLUME LEVEL OF SERVICE VOLUME LEVEL OF SERVICE VOLUME LEVEL OF SERVICE VOLUME LEVEL OF SERVICE VOLUME LEVEL OF SERVICE Sensitivity Analysis [3-22]
56 The a.m. peak resulted in the highest roadway volumes, with the single-lane ramp to the entrance to Garages A and B (Link K) experiencing LOS D by Once Garage C opens and parking demand is diverted to the new garage, Link K no longer experiences a poor LOS in years 2024 and As a result of the parking shift to Garage C, the single-lane Aviation Place northbound (Link AL) toward the new garage would then experience a.m. peak LOS E in years 2024 and Inbound Herb Kelleher Way (Link E) prior to the exit to Aviation Place would experience a.m. peak LOS D in years 2024 and 2032 due to forecast growth. The link that would experience capacity problems during the p.m. peak of forecast year 2032 is Upper Level Curbside Exit Roadway (Link S). Here, the curbside roadway narrows from four lanes to two lanes, which creates a bottleneck LOS D. Additionally, the outbound lanes of Herb Kelleher Way from Contrail Lane to Tom Braniff Lane (Links X, Y, Z, and AA) reach LOS D ON-AIRPORT INTERSECTION LEVEL-OF-SERVICE ANALYSIS Intersection LOS analysis provides a quantitative means of analyzing the operation of signalized and unsignalized intersections. This analysis was conducted at two signalized intersections: Herb Kelleher Way and Aviation Place and Herb Kelleher Way and Tom Braniff Lane. The intersection of Herb Kelleher Way and Hawes Avenue is stop-controlled and was analyzed using a different process. In all cases, Synchro 5 was utilized to analyze the intersections based on Highway Capacity Manual 6 procedures. The existing signal timings at the two signalized intersections were obtained from the City s Department of Public Works and Transportation, and were incorporated within a Synchro signal timing network model that was created to analyze the terminal area roadway and traffic signal network. Table 3- presents the estimated vehicle delay, volume to capacity ratio (V/C), and LOS during the a.m. departures peak and the p.m. arrivals peak at the two intersections for years 2015, 2024, It is anticipated that both of the signalized intersections will operate at LOS B or better during forecast year Synchro is a traffic-signal simulation and optimization software developed by Trafficware. 6 Transportation Research Board, Highway Capacity Manual, Sensitivity Analysis [3-23]
57 Table 3-: Estimated Intersection Level of Service Analysis HERB KELLEHER WAY AT AVIATION PLACE (SIGNALIZED) DEPARTURE PEAK ARRIVAL PEAK HERB KELLEHER WAY AT TOM BRANIFF LANE (SIGNALIZED) DEPARTURE PEAK ARRIVAL PEAK HERB KELLEHER WAY AT HAWES AVENUE (STOP-CONTROLLED) DEPARTURE PEAK ARRIVAL PEAK Delay (seconds) V/C 2/ LOS 1/ A A B B D F Delay (seconds) V/C 2/ LOS 1/ B B B B E D Delay (seconds) V/C 2/ LOS 1/ B B B B E F NOTES: 1/ LOS Level of Service. Intersection LOS is a function of delay attributed to the traffic control device, either a traffic signal or a stop sign, and is expressed in seconds per vehicle based on the following criteria: Signalized Intersection Level of Service Stop-Controlled Level of Service LOS Control Delay (seconds/vehicle) LOS Control Delay (seconds/vehicle) A 10.0 A 10.0 B >10.0 and 20.0 B >10.0 and 15.0 C >20.0 and 35.0 C >15.0 and 25.0 D >35.0 and 55.0 D >25.0 and 35.0 E >55.0 and 80.0 E >35.0 and 50.0 F >80.0 F >50.0 2/ V/C Volume to Capacity Ratio. If this value is greater than 1.0, there is more traffic demand than the roadway can handle, and delays are imminent. SOURCES: Ricondo & Associates, Inc., June 2016; Transportation Research Board, Highway Capacity Manual, PREPARED BY: Ricondo & Associates, Inc., June As shown in Table 3-, it is estimated that the stop-controlled intersection at Herb Kelleher Way and Hawes Avenue would operate at LOS F at forecast year 2015 during the arrivals peak, but it would slightly improve for forecast year 2024 due to the reduction of rental car traffic. However, it would eventually fall back to LOS F in forecast year The poor intersection performance is attributed to the left-turning southbound Hawes Avenue experiencing a difficult movement across four inbound lanes on Herb Kelleher Way onto outbound Herb Kelleher Way. At the time of this Sensitivity Analysis, the intersection was experiencing congestion and backups past Hawes Avenue during peak periods. While it could be assumed that this intersection would benefit from signalization to improve the LOS, its proximity to the Cedar Springs Road/Herb Kelleher Way and Mockingbird Lane intersection, as well as the long queuing on outbound Cedar Springs Road/Herb Kelleher Way, suggest that this intersection would operate better as a right-in/right-out for inbound Cedar Springs Road/Herb Kelleher Way traffic OFF-AIRPORT ROADWAYS The performance of off-airport roadways and intersections is critical for access to the Airport by passengers and employees, as well as by ground transportation services. A quantitative review of the roadway system, including intersection analyses, was conducted to assess the anticipated decrease in LOS for these facilities over the planning horizon. While improvements to off-airport roadways may not be actionable, with an Sensitivity Analysis [3-24]
58 understanding of the future performance of these roads and intersections, the other City Departments may be able to work with the Department of Aviation to ensure the inclusion of appropriate improvements into a transportation improvement program sponsored by the City of Dallas. The intersection turning movement counts were collected on Friday, February 21, 2014, and on Monday, February 24, Data were collected during the a.m. peak (6:00 a.m. to 8:30 a.m.) and during the p.m. peak (4:30 p.m. to 8:00 p.m.) at the following intersections: Airdrome Drive at Lemmon Avenue Mockingbird Lane at Lemmon Avenue Mockingbird Lane at Airdrome Drive Mockingbird Lane at Cedar Springs Road/Herb Kelleher Way Mockingbird Lane at Denton Drive The United States Conference of Mayors, U.S. Metro Economies Outlook - Gross Metropolitan Product, and Critical Role of Transportation Infrastructure, July From the intersection turning movement counts, the a.m. and p.m. rolling 60-minute peak hours from the data set were identified for each intersection. The a.m. peak hour was identified as :30 a.m. to 8:30 a.m., and the p.m. peak hour was identified as 4:30 p.m. to 5:30 p.m. To analyze intersection demand/capacity performance, the peak hour turning movement counts, along with intersection geometry and signal phasing and timing, were input into Synchro. The turning movement counts for these peak periods, as well as the existing intersection LOS computed using Synchro (based on Highway Capacity Manual procedures), are presented on Exhibit 3-15 and Exhibit 3-16 for the a.m. and p.m. peaks, respectively. With the existing traffic volumes for the off-airport roadways identified for the data collection period in February 2014, the roadway volumes were then factored back to baseline 2013 values based on passenger activity from the baseline gated airline schedule. This resulted in baseline 2013 volumes in which LOS was established for the intersections, and a spreadsheet trip generation model was prepared to segment traffic by activity type (e.g., airline passenger traffic, other Airport traffic, and non-airport background traffic). Different growth rates for all three traffic components were developed using the following assumptions: Airline passenger traffic will increase based on originating enplaned passengers for the various years. Other service and employee Airport traffic will increase in proportion to the blended averages of annual originating passenger growth rate and annual aircraft operations growth rate. Non-Airport background traffic activity will increase based on regional traffic growth rates, as reported by the North Central Texas Council of Governments (NCTCOG) model, and historical economic growth rate for gross metropolitan product (GMP), as reported for Dallas-Fort Worth-Irving, Texas, by The United States Conference of Mayors. Sensitivity Analysis [3-25]
59 DALLAS LOVE FIELD AUGUST Lemmon Avenue and Airdrome Drive LEGEND # x Intersection Roads 1 Lemmon Avenue Airdrome Drive Herb Kelleher Way Intersection Level of Service 3 5Mockingbird Lane 4 2 Cedar Springs Road Denton Drive 2 3 (C) 80 (C) (D) (D) 305 (D) (A) 190 (C) 84 (C) (A) 5 (A) (E) 203 (D) C 1344 (C) C (B) B D B (C) (D) 399 (D) (C) (A) Lemmon Avenue and Mockingbird Lane 201 (C) 610 Airdrome Drive and Mockingbird Lane Herb 4Keleher Way/Cedar Springs Road and Mockingbird Lane 5 Mockingbird Lane and Denton Drive (E) (E) 41 (D) (B) (C) 261 (E) SOURCES: Google Earth Pro, February 2014; GRAM Traffic of North Texas, Inc., February 2014; Ricondo & Associates, Inc., June PREPARED BY: Ricondo & Associates, Inc., June EXHIBIT 3-15 NORTH ft. Turning Movement Counts and Intersection Level of Service Existing a.m. Peak Hour Drawing: N:\Love Field\21 Landside Sensitivity Analysis\05 CAD\new_Off_Airport_Intersections_ALL 8 SCENARIOS_withConRAC_rev.dwg_Layout: Exhibit 3-15 Baseline 2014 AM_Jul 2, 201, 10:44am Sensitivity Analysis
60 DALLAS LOVE FIELD AUGUST Lemmon Avenue and Airdrome Drive 1 Lemmon Avenue Airdrome Drive Lemmon Avenue and Mockingbird Lane 3 C 3 Airdrome Drive and Mockingbird Lane C Herb 4Keleher Way/Cedar Springs Road and Mockingbird Lane (D) D 5 Mockingbird Lane and Denton Drive (D) 54 (D) C PREPARED BY: Ricondo & Associates, Inc., June (F) 256 LEGEND (D) 323 # Intersection Denton Drive 3 Roads x Intersection Level of Service SOURCES: Google Earth Pro, February 2014; GRAM Traffic of North Texas, Inc., February 2014; Ricondo & Associates, Inc., June Herb Kelleher Way 5Mockingbird Lane 2 Cedar Springs Road (D) 104 (B) (D) (F) 55 (D) (A) 985 (B) 95 (D) (C) 6 (B) C 35 (B) (C) 0 82 (D) (A) (D) 352 (D) (B) (B) 32 (C) (D) 195 (E) EXHIBIT 3-16 NORTH ft. Turning Movement Counts and Intersection Level of Service Existing p.m. Peak Hour Drawing: N:\Love Field\21 Landside Sensitivity Analysis\05 CAD\new_Off_Airport_Intersections_ALL 8 SCENARIOS_withConRAC_rev.dwg_Layout: Exhibit 3-16 Baseline 2014 PM_Jul 2, 201, 10:44am Sensitivity Analysis
61 Another assumption related to the trip generation model for the off-airport roadways is the opening of a Consolidated Rental Car Center located off-airport at the intersection of Mockingbird Lane and Denton Drive (Site 3). Rental car traffic related to rental car operations would be conducted at this new consolidated site, thus removing many rental car trips from the on-airport roadway. Access to/from the Consolidated Rental Car Center would be provided via a single bus service between the facility and the commercial curbside at the Airport on a 5-minute headway. This alone would reduce the number of busing trips from over 60 trips per hour to just 12 trips per hour. This off-airport roadway analysis does not assume any improvements to the number of lanes or the geometry of any of the existing intersections. It is understood that many of these roadway and intersection movements are currently at or near capacity, but assuming any other infrastructure changes other than adjustments to existing signal timings is beyond the scope of this Sensitivity Analysis. New intersection turning movement volumes based on the three different growth rates for 2015, 2024, and 2032 were produced using the spreadsheet trip generation model. Each of the scenarios was then modeled in Synchro to determine the LOS for each intersection. The results of the 2015 a.m. peak hour scenario are presented on Exhibit 3-1. The additional traffic generated by the Airport results in a minimum of one movement on each approach to the Cedar Springs Road/Herb Kelleher Way at Mockingbird Lane intersection being at LOS E or worse, with the intersection as a whole operating at LOS F. Additionally, the left-turn traffic on the eastbound Denton Drive approach at Mockingbird Lane also decreases to LOS F. The 2015 p.m. peak hour scenario results are displayed on Exhibit The outbound traffic at the Cedar Springs Road/Herb Kelleher Way and Mockingbird Lane intersection increases beyond the left-turn capacity of the dual left-turn lanes, affecting this movement as well as degrading the other approaches. However, this intersection as a whole is still operating at an overall LOS E. The intersection of Denton Drive at Mockingbird Lane degrades to an overall LOS D in Traffic analysis results for the baseline forecast year 2024, representing.9 million annual enplaned passengers (MAEP), are presented on Exhibit 3-19 and Exhibit During the a.m. peak hour, all approaches would have at least one movement at LOS F at the Cedar Springs Road/Herb Kelleher Way at Mockingbird Lane intersection, even though overall intersection performance would be at LOS E. During the p.m. peak, the LOS at the Cedar Springs Road/Herb Kelleher Way and Mockingbird Lane intersection would deteriorate from LOS D to an overall LOS F. Traffic analysis results for the baseline forecast year 2032, representing 8.2 MAEP, are presented on Exhibit 3-21 and Exhibit With the Cedar Springs Road/Herb Kelleher Way at Mockingbird Lane intersection operating at LOS F in both the a.m. and p.m. peak hours, the intersection would not be able to process the Airport traffic demand and heavy southbound commuter traffic. Therefore, traffic from the Cedar Springs Road/Herb Kelleher Way at Mockingbird Lane intersection would affect other intersections, as well as create gridlock during the a.m. peak hour. Similar traffic would occur during the p.m. peak hour, but the heavy Airport traffic and northbound commuter Mockingbird Lane traffic would be most heavily affected. Table 3-8 summarizes the LOS analysis for the nonterminal roadway intersections. Sensitivity Analysis [3-28]
62 DALLAS LOVE FIELD AUGUST Lemmon Avenue and Airdrome Drive 1 Lemmon Avenue Airdrome Drive Lemmon Avenue and Mockingbird Lane 3 D 3 Airdrome Drive and Mockingbird Lane B Herb 4Keleher Way/Cedar Springs Road and Mockingbird Lane (E) 65 4 F 5 Mockingbird Lane and Denton Drive (E) 43 (D) C PREPARED BY: Ricondo & Associates, Inc., June (F) 252 LEGEND (D) 142 # Intersection 5 Denton Drive 25 Roads x Intersection Level of Service SOURCES: Google Earth Pro, February 2014; GRAM Traffic of North Texas, Inc., February 2014; Ricondo & Associates, Inc., June Herb Kelleher Way Mockingbird Lane 2 Cedar Springs Road (C) 84 (C) (D) (F) 523 (E) (E) 18 (F) 88 (C) (B) 86 (C) C 243 (C) (D) (B) (D) (F) 683 (D) (A) (C) 36 (C) (C) 306 (E) EXHIBIT 3-1 NORTH 0 Drawing: N:\Love Field\21 Landside Sensitivity Analysis\05 CAD\new_Off_Airport_Intersections_ALL 8 SCENARIOS_withConRAC_rev.dwg_Layout: Exhibit AM_Jul 2, 201, 10:44am Sensitivity Analysis 600 ft. Turning Movement Counts and Intersection Level of Service 2015 a.m. Peak Hour
63 DALLAS LOVE FIELD AUGUST Lemmon Avenue and Airdrome Drive 1 Lemmon Avenue Airdrome Drive Lemmon Avenue and Mockingbird Lane 3 C 3 Airdrome Drive and Mockingbird Lane C Herb 4Keleher Way/Cedar Springs Road and Mockingbird Lane (F) E 5 Mockingbird Lane and Denton Drive (D) 5 (D) D PREPARED BY: Ricondo & Associates, Inc., June (F) 28 LEGEND (D) 339 # Intersection Denton Drive 39 Roads x Intersection Level of Service SOURCES: Google Earth Pro, February 2014; GRAM Traffic of North Texas, Inc., February 2014; Ricondo & Associates, Inc., June Herb Kelleher Way 5Mockingbird Lane 2 Cedar Springs Road (D) 109 (A) (C) (D) 1033 (D) 100 (E) (F) 40 (E) (C) 5 (D) C 413 (D) (C) (C) (B) (E) 453 (E) (A) (B) 34 (C) (C) 216 (F) EXHIBIT 3-18 NORTH ft. Turning Movement Counts and Intersection Level of Service 2015 p.m. Peak Hour Drawing: N:\Love Field\21 Landside Sensitivity Analysis\05 CAD\new_Off_Airport_Intersections_ALL 8 SCENARIOS_withConRAC_rev.dwg_Layout: Exhibit PM_Sep 14, 201, 4:49pm North Entrance Roadway Planning
64 DALLAS LOVE FIELD AUGUST Lemmon Avenue and Airdrome Drive 1 Lemmon Avenue Airdrome Drive Lemmon Avenue and Mockingbird Lane 3 E 3 Airdrome Drive and Mockingbird Lane B Herb 4Keleher Way/Cedar Springs Road and Mockingbird Lane (F) F 5 Mockingbird Lane and Denton Drive (E) 53 (D) F PREPARED BY: Ricondo & Associates, Inc., June (F) 301 LEGEND (D) 186 # Intersection Denton Drive 31 Roads x Intersection Level of Service Proposed ConRAC SOURCES: Google Earth Pro, February 2014; GRAM Traffic of North Texas, Inc., February 2014; Ricondo & Associates, Inc., June Herb Kelleher Way 5Mockingbird Lane 2 Cedar Springs Road (D) 104 (F) (C) (F) 489 (F) (F) 2408 (F) 109 (D) (F) 21 (F) C 301 (D) (E) (A) (C) (F) 9 (D) (A) (D) 3 (D) (C) 3 (F) EXHIBIT 3-19 NORTH 0 Drawing: N:\Love Field\21 Landside Sensitivity Analysis\05 CAD\new_Off_Airport_Intersections_ALL 8 SCENARIOS_withConRAC_rev.dwg_Layout: Exhibit AM_Jul 2, 201, 10:44am Sensitivity Analysis 600 ft. Turning Movement Counts and Intersection Level of Service 2024 a.m. Peak Hour
65 DALLAS LOVE FIELD AUGUST Lemmon Avenue and Airdrome Drive 1 Lemmon Avenue Airdrome Drive Lemmon Avenue and Mockingbird Lane 3 D 3 Airdrome Drive and Mockingbird Lane C Herb 4Keleher Way/Cedar Springs Road and Mockingbird Lane (F) 21 4 F 5 Mockingbird Lane and Denton Drive (E) 0 (D) F PREPARED BY: Ricondo & Associates, Inc., June (F) 326 LEGEND (D) 43 # Intersection Denton Drive 48 Roads x Intersection Level of Service Proposed ConRAC SOURCES: Google Earth Pro, February 2014; GRAM Traffic of North Texas, Inc., February 2014; Ricondo & Associates, Inc., June Herb Kelleher Way 5Mockingbird Lane 2 Cedar Springs Road (F) 135 (C) (D) (F) 834 (F) (C) 1454 (D) 123 (F) (C) 343 (F) D 512 (D) (C) (D) (B) (E) 421 (F) (D) (C) 50 (F) (D) 268 (F) EXHIBIT 3-20 NORTH ft. Turning Movement Counts and Intersection Level of Service 2024 p.m. Peak Hour Drawing: N:\Love Field\21 Landside Sensitivity Analysis\05 CAD\new_Off_Airport_Intersections_ALL 8 SCENARIOS_withConRAC_rev.dwg_Layout: Exhibit PM_Jul 2, 201, 10:44am Sensitivity Analysis
66 DALLAS LOVE FIELD AUGUST Lemmon Avenue and Airdrome Drive 1 Lemmon Avenue Airdrome Drive Lemmon Avenue and Mockingbird Lane 3 F 3 Airdrome Drive and Mockingbird Lane B Herb 4Keleher Way/Cedar Springs Road and Mockingbird Lane (F) F 5 Mockingbird Lane and Denton Drive (E) 64 (D) F PREPARED BY: Ricondo & Associates, Inc., June (F) 343 LEGEND (D) 223 # Intersection Denton Drive 38 Roads x Intersection Level of Service Proposed ConRAC SOURCES: Google Earth Pro, February 2014; GRAM Traffic of North Texas, Inc., February 2014; Ricondo & Associates, Inc., June Herb Kelleher Way 5Mockingbird Lane 2 Cedar Springs Road (D) 126 (F) (C) (F) 504 (F) (F) 2895 (F) 132 (D) (F) 23 (F) C 346 (D) (F) (B) (D) (F) 803 (D) (A) (D) 83 (E) (D) 438 (F) EXHIBIT 3-21 NORTH 0 Drawing: N:\Love Field\21 Landside Sensitivity Analysis\05 CAD\new_Off_Airport_Intersections_ALL 8 SCENARIOS_withConRAC_rev.dwg_Layout: Exhibit AM_Jul 2, 201, 10:45am Sensitivity Analysis 600 ft. Turning Movement Counts and Intersection Level of Service 2032 a.m. Peak Hour
 25 4 F 5 Mockingbird Lane and Denton Drive 210")
67 DALLAS LOVE FIELD AUGUST Lemmon Avenue and Airdrome Drive Lemmon Avenue and Mockingbird Lane 3 F 3 Airdrome Drive and Mockingbird Lane C Herb 4Keleher Way/Cedar Springs Road and Mockingbird Lane (F) 25 4 F 5 Mockingbird Lane and Denton Drive (E) 85 (D) F PREPARED BY: Ricondo & Associates, Inc., June (F) 391 LEGEND (D) 52 # Intersection Roads 5 Denton Drive 58 x Intersection Level of Service Proposed ConRAC SOURCES: Google Earth Pro, February 2014; GRAM Traffic of North Texas, Inc., February 2014; Ricondo & Associates, Inc., June Herb Kelleher Way Lemmon Avenue Airdrome Drive Mockingbird Lane 2 Cedar Springs Road (F) 163 (F) (F) (F) 928 (F) F 60 (F) (D) 143 (E) 149 (F) (D) 386 (F) 1025 (C) (D) (C) (F) 466 (F) (F) (D) 59 (F) (F) 31 (F) EXHIBIT 3-22 NORTH ft. Turning Movement Counts and Intersection Level of Service 2032 p.m. Peak Hour Drawing: N:\Love Field\21 Landside Sensitivity Analysis\05 CAD\new_Off_Airport_Intersections_ALL 8 SCENARIOS_withConRAC_rev.dwg_Layout: Exhibit PM_Jul 2, 201, 10:45am Sensitivity Analysis
68 Table 3-8: Off-Airport Roadway Intersection Level of Service Analysis INTERSECTION DELAY INTERSECTION INTERSECTION DELAY INTERSECTION INTERSECTION DELAY INTERSECTION (SECONDS) LOS (SECONDS) LOS (SECONDS) LOS Lemmon Avenue and Mockingbird Lane 35.0 D 60.9 E 102. F Airdrome Drive and Lemmon Avenue 2.1 C 23.6 C 20.9 C Mockingbird Lane and Airdrome A.M. Drive 15.6 B 13.4 B 16.5 B Mockingbird Lane and Herb Kelleher Way 82.6 F 18.8 F F Mockingbird Lane and Denton Drive 25.6 C 88.5 F F Lemmon Avenue and Mockingbird Lane 29.1 C 41.5 D 88.2 F Airdrome Drive and Lemmon Avenue 2.0 C 39.1 D 8. F Mockingbird Lane and Airdrome P.M. Drive 24. C 29.3 C 34.1 C Mockingbird Lane and Herb Kelleher Way 58.3 E 125. F 213. F Mockingbird Lane and Denton Drive 40.0 D 81.4 F F NOTE: LOS Level of Service SOURCE: Ricondo & Associates, Inc., June PREPARED BY: Ricondo & Associates, Inc., June designated zone CURBSIDE DATA AND GROWTH Since the MPU, the terminal curbside allocations have changed to accommodate the operation of transportation network companies (TNCs), which are app-based ride-hailing services that now account for about 25 percent of the vehicles on the lower level commercial roadway at the Airport. The presence of TNCs at the Airport has not affected the upper level departures curbside; although, they are allowed to drop off customers on the upper level. TNCs are not allowed to pick up TNC customers on the upper level curbside designated for arrivals. Instead, they have been allocated 192 feet at the end of the commercial curbside, which was previously used by the hotel/parking shuttles for pick-up. The hotel/parking shuttles now pick up and drop off customers at the same location between the rental car shuttles and the Dallas Area Rapid Transit (DART) public transit bus stop. Exhibit 3-23 depicts the curbside zones, corresponding color codes, and linear curb length for each Sensitivity Analysis [3-35]
69 DALLAS LOVE FIELD AUGUST 201 Aviation Place Ticketing Hall Curbside Check-in East Tunnel T PRIVATE VEHICLE DEPARTURES DROP-OFF 450' RAC COUNTERS IN TERMINAL Baggage Claim Hall R l ne un l T by tra ob en L C to AF Central Lobby D West Tunnel SOURCE: Ricondo & Associates, Inc., June PREPARED BY: Ricondo & Associates, Inc., June NORTH Garage A ft. Drawing: N:\Love Field\21 Landside Sensitivity Analysis\05 CAD\LANDSIDE SITE PLAN Final_V3_SA_rev.dwg_Layout: Exhibit 3-23_Jul 2, 201, 10:44am Sensitivity Analysis LEGEND Private Vehicle Curb Overlap Linear Feet 162 Private Vehicle Departures Curb 315 Private Vehicles Arrivals Curb 318 Taxicab Queuing 300 Taxicab Loading 22 Hotel/Parking Shuttle 244 TNC Queuing 192 Shared Ride Vans 80 Rental Car Shuttles 19 Dallas Area Rapid Transit (DART) 60 Limousines 92 Charter & Employee Bus Curb 200 EXHIBIT 3-23 Curbside Allocations
70 To obtain an accurate count of the new TNC traffic and current curbside conditions, a new curbside classification data collection was conducted during the :00 a.m. to 9:00 a.m. period on Monday, May 2, 2016, and during the 4:00 p.m. to 6:00 p.m. period on Thursday, May 5, The peak-hour results of this vehicle classification study confirm the vehicle mode shift from the past results of the MPU. Table 3-9 compares the current vehicle mode classification to similar data collected on Monday, February 23, Other than the 12.6 percent increase in overall a.m. peak-hour traffic and 5.3 percent increase in overall p.m. peak-hour traffic, the largest change was the TNC mode capturing 25.3 percent of the lower level vehicle traffic. It should be noted that TNCs were not allowed to pick up passenger from the Airport until April The curbside classification data collected in May 2016 is considered equivalent to the peak month from This statement can be justified based on historical monthly total passenger data at the Airport. Historically, May monthly enplaned passengers are roughly within 1 percent of the peak month (October) from the previous year. Table 3-10 illustrates this historical trend. Utilizing these new May 2016 curbside vehicle classification counts as the 2015 peak month, the analysis applied the passenger forecast growth to the vehicle volumes to generate year 2024 and year 2032 traffic volumes by mode for the curbside. Table 3-11 utilizes these passenger growth rates to compute the total upper level and lower level curbside vehicle volumes. These new vehicle totals were then distributed by the vehicle classification mode split from May 2016 to calculate the curbside demand/capacity for the 2015, 2024, and 2032 peak periods CURBSIDES ANALYSIS Curbsides consist of two primary components that have measurable capacity: (1) available curbside frontage for the loading and unloading of passengers to/from vehicles and (2) throughput capacity of the adjacent travel lanes. The length of available curbside frontage for a given vehicle mode will affect passenger LOS and safety. Furthermore, crowded curbside frontage areas will have a direct effect on the throughput of the adjacent travel lanes. The curbside demand/capacity analysis was conducted for the 2015, 2024, and 2032 passenger demand conditions. The surplus/deficit of available curbside frontage and throughput capacity of the adjacent travel lanes was therefore calculated for each of the baseline and forecast scenarios. The curbside spreadsheet model developed to estimate peak-hour terminal curbside requirements uses peakhour vehicle counts combined with average dwell times by vehicle mode to determine the required linear length of curbside. To account for non-uniform arrival rates and varying dwell times for vehicles stopped at the curbside during the peak hour, the model applies a statistical surge factor based on a Poisson arrivals distribution in order to estimate the maximum number of occupied parking spaces during the peak hour. The estimated space requirements are multiplied by the average length of each vehicle type (including a buffer to represent the empty space between two parked vehicles) to determine the demand for curbside frontage in linear feet. Sensitivity Analysis [3-3]
71 Table 3-9: Vehicle Classification Summary A.M. PEAK P.M. PEAK UPPER LEVEL CURB FEBRUARY 23, 2015 (8:00 9:00 A.M.) NUMBER OF VEHICLES PERCENT OF TOTAL MAY 2, 2016 (8:00 9:00 A.M.) NUMBER OF VEHICLES PERCENT OF TOTAL FEBRUARY 23, 2015 (5:00 6:00 P.M.) NUMBER OF VEHICLES PERCENT OF TOTAL MAY 5, 2016 (4:45 5:45 P.M.) NUMBER OF VEHICLES PERCENT OF TOTAL Private Vehicles % % % % Taxicabs % % % % TNCs N/A 0.0% 0 0.0% N/A 0.0% 0 0.0% Hotel/Motel Shuttles 1 0.2% 3 0.% 2 0.2% 0 0.0% Airport-Operated Shuttles 0 0.0% 0 0.0% 1 0.1% 0 0.0% Shared Ride Vans 0 0.0% 3 0.% 6 0.6% 0 0.0% Limousines 0 0.0% 0 0.0% 0 0.0% 1 0.1% Other 1.6% % 2 0.2% 5 0.5% Upper Level Total % % % 1, % LOWER LEVEL CURB Private Vehicles 9 4.% 2 0.8% % 3 1.1% Taxicabs % % % % TNCs N/A 0.0% % N/A 0.0% % Hotel/Motel Shuttles 9 4.% % 8 2.9% % Airport-Operated Shuttles % % % % Shared Ride Vans 3.6% 6 2.3% 13 4.% 3 1.1% Limousines % % % % City Buses 4 2.1% 4 1.5% 3 1.1% 3 1.1% Other 4 2.1% 2 0.8% 4 1.5% 1 0.4% Lower Level Total % % % % TERMINAL AREA TOTALS ,253 1,320 NOTES: Totals may not add to 100 percent due to rounding. N/A Not Available SOURCES: Ricondo & Associates, Inc., February 2015; Ricondo & Associates, Inc., May PREPARED BY: Ricondo & Associates, Inc., June Sensitivity Analysis [3-38]
72 Table 3-10: Total Enplaned Passengers at Dallas Love Field by Month MONTH January 623, , ,38 966,548 1,196,35 February 620,94 605,68 631, ,28 1,142,88 March 695,266 1,084 52,224 1,130,032 1,336,09 April 61,088 69,012 45,869 1,162,896 1,290,94 May 08,483 42,296 4,400 1,235,181 1,359,889 June 15,260 63,035 69,946 1,232,233 1,324,533 July 14,989 60,161 5,308 1,20,096 1,289,835 August 04,335 28,44 25,890 1,299,00 1,2,098 September 644,59 682,18 692,451 1,296,192 1,324,80 October 32,399 63, ,1 1,36,644 1,393,310 November 685,145 68, ,68 1,302,084 1,326,232 December 65,524 11,082 1,041,33 1,309,614 1,300,998 Annual Total 8,13,92 8,40,586 9,413,636 14,49,498 15,562,38 NOTES: Data in italics represent months after the termination of the Wright Amendment. Data in bold represent how the May passenger totals closely approximate the peak month total from the previous year (October). SOURCE: City of Dallas Aviation Department, Resources Traffic Statistics, (accessed June 2016). PREPARED BY: Ricondo & Associates, Inc., June Table 3-11: Peak Hour O & D Passenger, Vehicles, and Curbside Demand Growth A.M. PEAK P.M. PEAK A.M. PEAK P.M. PEAK A.M. PEAK P.M. PEAK 5:50 A.M. 5:15 P.M. 5:55 A.M. 5:15 P.M. 5:55 A.M. 5:15 P.M. 6:50 A.M. 6:15 P.M. 6:55 A.M. 6:15 P.M. 6:55 A.M. 6:15 P.M. Departures Passengers 1, ,94 1,019 1,843 1,145 Arrivals Passengers 31 1, , ,40 Total Passengers 1,499 1,98 1,855 2,24 1,912 2,552 Growth Relative to % 26.4% 2.6% 41.9% Upper Level Vehicles 453 1, , ,468 Lower Level Vehicles Total Curbside Vehicles 14 1, , ,82 SOURCE: Ricondo & Associates, Inc., June PREPARED BY: Ricondo & Associates, Inc., June Curbside frontage demand is a theoretical measurement of the peak accumulation of vehicles waiting at the curbside if they were aligned nose-to-tail in a single queue. For existing conditions, a utilization factor can be derived, which is the calculated ratio of curbside demand in linear feet divided by the existing curbside length. The utilization factor provides an indication of the amount of double and triple parking that would result for a given demand, and the LOS associated with a given utilization rate recognizes that vehicles do not park uniformly along the curbside. For example, a very low utilization factor indicates that vehicles are easily Sensitivity Analysis [3-39]
73 accommodated along the inner curb without the need to double-park. This utilization factor equates to an excellent LOS (e.g., LOS A). Conversely, a very high utilization factor equates to double and triple parking along the entire curbside, restricting vehicle movements and resulting in a poor LOS. In this analysis, the upper level arrivals and departures curbsides allow for private vehicles to pick up and drop off passengers in multiple lanes, while the lower level curbsides are all assigned to commercial vehicle passenger loading/unloading, which is restricted to loading in the one lane directly adjacent to the curbside. Table 3-12 describes the LOS for various utilization ranges for multiple-lane passenger loading/unloading that occurs on the upper level curbside, which is used primarily by private vehicles. For private vehicle curbsides with multiple-lane passenger loading/unloading, LOS C is generally a desirable condition during peak activity periods at major airports, including DAL on most days of the year. LOS C represents an acceptable condition in which double-parking is common, especially near terminal entrances, with some intermittent triple-parking. LOS D conditions may be acceptable during peak seasonal periods. Table 3-12: Level of Service and Utilization Ranges for Curbsides with Multiple-Lane Passenger Loading/Unloading LOS UTILIZATION RANGES DESCRIPTION A 0% 90% Excellent: Drivers experience no interference from pedestrians or other motorists B 91% 110% Very Good: Relatively free-flow conditions with limited double-parking C 111% 130% Good: Double-parking near doors is common with some intermittent triple-parking D 131% 10% Fair: Vehicle maneuverability is restricted due to frequent double/triple parking E 11% 200% Poor: Significant delays and queues; double/triple parking throughout curbside F > 200% Failure: Motorists unable to access/depart curbside; significant queuing along entry road NOTE: Utilization is the ratio of curbside demand divided by available curbside length. SOURCE: Ricondo & Associates, Inc., July 2010 (based on information published in Airport Cooperative Research Program, ACRP Report 40, Airport Curbside and Terminal Area Roadway Operations). PREPARED BY: Ricondo & Associates, Inc., June Table 3-13 describes the utilization ranges for single-lane passenger loading/unloading that typically occurs at curbsides used by commercial vehicles. For commercial vehicle curbsides with single-lane passenger loading/unloading, LOS C is generally a desirable condition during peak activity periods at major airports, including DAL for most days of the year. LOS D conditions may be acceptable during peak seasonal periods. Curbsides with single-lane loading are not considered to be operating at a poor LOS when all available curbside length is being used (100 percent utilization). When a single lane is fully utilized, parked vehicles are still able to depart and access the curbside, and they are not generally blocked by vehicles in a second parking lane. For curbsides with single-lane passenger loading/unloading, double- or triple-parking or queuing along 30 percent or more of the adjacent travel lane constitutes a failed LOS (i.e., LOS F). Sensitivity Analysis [3-40]
74 Table 3-13: Level of Service and Utilization Ranges for Curbsides with Single-Lane Passenger Loading/Unloading LOS UTILIZATION RANGES DESCRIPTION A 0% 0% Excellent: Drivers experience no interference from pedestrians or other motorists B 1% 85% Very Good: Relatively free-flow conditions with no double-parking C 86% 100% Good: Curbside utilization is approaching full capacity, but maneuverability is adequate D 101% 115% Fair: Vehicle maneuverability is becoming restricted due to double-parking or queuing E 116% 130% Poor: Vehicle maneuverability is restricted due to double-parking or queuing F > 130% Failure: Delays and queues and/or double-parking exceeds desired utilization NOTE: Utilization is the ratio of curbside demand divided by available curbside length. SOURCES: Ricondo & Associates, Inc., July 2010 (based on information published in Airport Cooperative Research Program, ACRP Report 40, Airport Curbside and Terminal Area Roadway Operations). PREPARED BY: Ricondo & Associates, Inc., June Table 3-14 provides a summary of the estimated demand and requirements for the upper level and lower level curbsides during the 2015, 2024, and 2032 a.m. peak hour. As shown in the table, the analysis was based on the assumption that 4 linear feet would be allocated for the departures curbside (passenger drop-off), and 318 linear feet would be allocated for the arrivals curbside (passenger pickup). In estimating the total amount of usable curb, an overlap area of approximately 162 feet was considered. This overlap area is the area between the arrivals curbside and the departures curbside. It was assumed that this area would be used for passenger drop-off during the departures peak hour and for passenger pickup during the arrivals peak hour. The functional upper level curbside would, therefore, consist of a total of 95 linear feet. As shown in the table, it is anticipated that the departures curbside would operate at LOS C in year 2015 and at LOS D in years 2024 and 2032 during the a.m. peak hour, while the lower level commercial staging areas would operate at LOS A during the same period. The LOS estimates for the upper level curbside were based on multiple-lane utilization, and the LOS for the lower level curbside was based on single-lane utilization, as previously defined. Table 3-15 provides a summary of the estimated demand and requirements for the upper level and lower level curbsides during the 2015, 2024, and 2032 p.m. peak hour. As shown in the table, the analysis was based on the assumption that 428 linear feet would be allocated for the departures curbside (passenger drop-off) and 36 feet would be allocated for the arrivals curbside (passenger pickup). The total amount of usable curbside was assumed to include an approximate 162-foot overlap area between the arrivals and departures curbsides. This area would be shared between arrivals and departures during the respective peak hours to accommodate the curbside demand; 0 percent of the overlap area was assumed to be utilized by the departures curbside, and 30 percent would be utilized by the arrivals curbside. As shown in the table, it is estimated that the departures curbside would operate at LOS D at 2015, LOS E at 2024, and LOS E at 2032 during the p.m. peak hour, and the arrivals curbside would operate at LOS C at 2015, LOS D at 2024, and LOS D at The lower level commercial staging areas would operate at LOS A with only one LOS C during the same period. The LOS estimates for the upper level curbside were based on multiple-lane utilization, and the LOS of the lower level curbside was based on single-lane utilization, as previously defined. Sensitivity Analysis [3-41]
75 Table 3-14: Sensitivity Analysis Curbside Allocations (a.m. Peak Hour) CURB REQUIRED REQUIRED REQUIRED LENGTH CURB CURBSIDE CURB CURBSIDE CURB CURBSIDE AVAILABLE LENGTH UTILIZATION LEVEL OF LENGTH UTILIZATION LEVEL OF LENGTH UTILIZATION LEVEL OF A.M. PEAK (FEET) (FEET) FACTOR SERVICE (FEET) FACTOR SERVICE (FEET) FACTOR SERVICE UPPER LEVEL 1/ Arrivals Curbside % A 25 8% A 25 8% A Departures Curbside 4 3/ % C % D % D Upper Level Totals % A 65 85% A 00 88% A LOWER LEVEL 2/ Taxicabs % A % A % A Limousines % A 30 33% A 30 33% A Shared Ride Vehicles % A 30 38% A 30 38% A Rental Car Shuttles 4/ % A 30 15% A 30 15% A Hotel/Parking Shuttles % A 90 3% A 90 3% A TNCs % A 90 4% A 90 4% A DART Transit Buses % A 40 6% A 40 6% A Lower Level Totals 1, % A % A % A NOTES: 1/ Maximum utilization factor for upper level roadways 200 percent, representing double loading of the curbside lanes. 2/ Maximum utilization factor for lower level roadways 100 percent, representing single loading of the curbside commercial vehicle lanes. 3/ Overlap area between departures and arrivals is 100 percent allocated to departures during a.m. peak. 4/ Rental car shuttle demand is reduced in 2024 and 2032 because of rental car facility operations. SOURCE: Ricondo & Associates, Inc., June PREPARED BY: Ricondo & Associates, Inc., June Sensitivity Analysis [3-42]
76 Table 3-15: Sensitivity Analysis Curbside Allocations (p.m. Peak Hour) CURB REQUIRED REQUIRED REQUIRED LENGTH CURB CURBSIDE CURB CURBSIDE CURB CURBSIDE AVAILABLE LENGTH UTILIZATION LEVEL OF LENGTH UTILIZATION LEVEL OF LENGTH UTILIZATION LEVEL OF P.M. PEAK (FEET) (FEET) FACTOR SERVICE (FEET) FACTOR SERVICE (FEET) FACTOR SERVICE UPPER LEVEL 1/ Arrivals Curbside % C 55 15% D % D Departures Curbside 428 3/ % D 50 15% E % E Upper Level Totals 95 1, % D 1,325 16% D 1, % E LOWER LEVEL 2/ Taxicabs % A % A % A Limousines % A 60 65% A 90 98% C Shared Ride Vehicles % A 30 38% A 30 38% A Rental Car Shuttles 4/ % A 30 15% A 30 15% A Hotel/Parking Shuttles % A % A % A TNCs % A % A % A DART Transit Buses % A 40 6% A 40 6% A Lower Level Totals 1, A 500 A 555 A NOTES: 1/ Maximum utilization factor for upper level roadways 200 percent, representing double loading of the curbside lanes. 2/ Maximum utilization factor for lower level roadways 100 percent, representing single loading of the curbside commercial vehicle lanes. 3/ Overlap area between departure and arrivals is 0 percent allocated to departures and 30 percent to arrivals during p.m. peak. 4/ Rental car shuttle demand is reduced in 2024 and 2032 because of rental car facility operations. SOURCE: Ricondo & Associates, Inc., June PREPARED BY: Ricondo & Associates, Inc., June Sensitivity Analysis [3-43]
77 The curbside spreadsheet model also makes a calculation of the curbside roadway throughput relative to the capacity of the roadway based on the level of congestion at the curbside. This calculation decreases the roadway capacity based on the friction provided in the adjacent loading/unloading lanes. This calculation was performed on the upper level roadways in the departures and arrivals sections of the curbside, assuming a loading lane and four adjacent bypass lanes. Some sections of the curbside have extra-wide 20-foot loading/unloading lanes, but for the sake of this calculation, this extra-wide lane was considered as a single lane. The results of this calculation for the various curbside locations and forecast years are presented in Table All sections of the upper level roadway performed at an acceptable V/C ratio and LOS A during forecast years 2015 and In year 2032, the p.m. peak operated at LOS C in the departures area and LOS B in the arrivals area. These results indicate the roadway has the potential to carry the forecast amount of traffic by the loading/unloading zones with the predicted amount of curbside loading/unloading activity, but DAL seems to suffer from vehicles avoiding the use of the outer lanes as a means of bypassing the congestion near the curbside lanes. This is a function of the lack of signage to inform unfamiliar drivers on which sections of the terminal are for arrivals and departures, as well as on the close proximity of the two zones in the designated overlap area that is congested with the weaving of departures vehicles trying to exit the terminal and the arrivals vehicles trying to get closer to the curbside. Table 3-16: Curbside Bypass Lane Roadway Volume/Capacity and Level of Service A.M. PEAK P.M. PEAK UPPER LEVEL (DEPARTURES) Roadway volume/capacity (V/C) 1/ Roadway level of service (LOS) A A A A A C UPPER LEVEL (ARRIVALS) Roadway volume/capacity (V/C) 1/ Roadway level of service (LOS) A A A A A B NOTE: 1/ Roadway capacity in the V/C calculation is a function of the curbside utilization and the number of total lanes in the loading/unloading zone. SOURCE: Ricondo & Associates, Inc., June PREPARED BY: Ricondo & Associates, Inc., June The breaking point of the upper Level curbside appears to be occurring prior to the 2024 forecast year, which is visible during peak hours today at the curbside. The spreadsheet model utilized a long average dwell time for the departures vehicles (2 minutes and 15 seconds), which is a longer dwell time than at other airports studied by R&A. A typical departures vehicle average dwell time for similar airports ranges from 1 minute 40 seconds to 1 minute 50 seconds. When rerunning the curbside simulation spreadsheet model with private vehicle dwell times for departures of 1 minute 45 seconds, the 2032 p.m. peak departures curbside decreased from a utilization factor of 193 percent (LOS E) to a utilization factor of 152 percent (LOS D). The observed active dwell times on the upper level for arrivals passengers was recorded at 1 minute 40 seconds, which is typical for most airports; however, DAL drivers spend much of their time stuck in the congestion in the departures curbside area. An overall increase in level of curbside enforcement would help reduce the curbside dwell times and help improve the curbside LOS in both the departures and arrivals section of the upper level roadway. Sensitivity Analysis [3-44]
78 3.3 Rental Car Rental car companies representing nine national brands operate on Airport property in exclusive-use leaseholds. Advantage, Alamo, Avis, Budget, Enterprise, Hertz, and National operate along the northeast side of Herb Kelleher Way. Dollar and Thrifty operate southeast of the terminals on the northwest side of West Mockingbird Lane, northeast of Herb Kelleher Way. Each company s leasehold includes a rental car ready/return area, vehicle storage parking area, employee parking area, fueling facilities, wash bays, light maintenance bays, an administrative area, and vehicle stacking/staging spaces. All companies transport their customers between the terminal building and their facilities via individual company-operated shuttle buses. Specific requirements for each of the following rental car facility components are addressed after the discussion of the methodology used to determine requirements: Customer Service Area Rental Car Ready/Return Area and Onsite Vehicle Storage Area Service Sites Fueling Positions Wash Bays Vehicle Light Maintenance Bays - Vehicle Stacking/Staging Spaces METHODOLOGY In September 2013, R&A sent a questionnaire requesting hourly transaction information, as well as the size, configuration, and use of existing facilities, to each of the nine on-airport rental car companies. As part of the Sensitivity Analysis, another questionnaire was sent to the industry in May All nine on-airport companies returned a completed questionnaire. The rental car facility requirements were developed using DAL-specific facility utilization rates based on hourly rental car transactions during a peak rental day. A peak rental day (based on individual company questionnaire responses) was selected as the design day, since ready vehicles occupy more space than the same number of return vehicles and, therefore, represent the maximum space required during a peak period. Planning-hour activity was defined as the peak-hour number of returns or rentals. For forecasting purposes, existing (2014), 2015, 2024, and 2032 demand was based on the forecast growth of originating passengers, as it was assumed that terminating passengers are equal to originating passengers. Hourly rental car transactions were determined from a 2014 peak month; therefore, 2014 is considered existing. Sensitivity Analysis [3-45]
79 Exhibit 3-24 presents the hourly rentals and returns during the peak rental day, which was a Monday. It was assumed that rental car activity would increase at the same rate as the number of originating passengers. Future requirements were determined based on the passenger forecasts completed in October 2015 for baseline, low growth, and high growth scenarios. Transactions Exhibit 3-24: Peak Rental Car Day Rentals and Returns by Hour SOURCE: Ricondo & Associates, Inc., Dallas Love Field Rental Car Industry Questionnaire, May PREPARED BY: Ricondo & Associates, Inc., November CUSTOMER SERVICE AREA Total Rentals Hour Total Returns The customer service area is used to process arriving rental car customers. The required number of counter positions is the primary factor that determines the size of the customer service area. The peak rental day s peakhour number of rental car transactions at the customer service counter was used to determine customer service counter requirements. During the peak rental day, the peak-hour number of rental car transactions was 238. Of the 238 peak-hour transactions, 62 percent, or 148, were regular counter transactions and 38 percent, or 90, were kiosk or preferred area transactions. A preferred area is where the customer is able to bypass the customer service counter and proceed directly to the rental car ready area. Based on R&A experience at similar airports with rental car customer business/leisure splits that are similar to those of the Airport market, it was assumed that a typical Sensitivity Analysis [3-46]
80 rental car counter transaction takes approximately 10 minutes, which translates to 6 transactions per 1 hour. With 148 regular counter transactions during the peak hour, 6 transactions per 1 hour per position, and an assumed additional 30 percent surge factor, 32 regular customer service positions would be needed today. Table 3-1 presents the customer service counter requirements for existing (2014) demand and each planning year. Note that there would be a deficit of customer service positions in each forecast scenario beginning in Table 3-1: Customer Service Counter Requirements EXISTING BASELINE SCENARIO HIGH GROWTH SCENARIO COMPONENT Customer Service Counter Facility Requirements Regular Customer Service Positions Existing Customer Service Counters Regular Customer Service Positions Surplus/(Deficiency) Regular Customer Service Positions 19 2 (8) (9) 2 (13) (15) SOURCE: Ricondo & Associates, Inc., Dallas Love Field Rental Car Industry Questionnaire, May PREPARED BY: Ricondo & Associates, Inc., November RENTAL CAR READY/RETURN AREA AND ONSITE VEHICLE STORAGE AREA Customers pick up and return rental cars in the ready/return areas. Ready vehicles are parked in a 90-degree configuration with traffic lanes, similar to the configuration of a conventional public parking lot. Return vehicles are parked in a nose-to-tail configuration. As previously mentioned, the peak rental day at the Airport, Monday, was selected as the design day, since ready vehicles occupy more space than the same number of return vehicles and would represent the maximum space required during a peak period. The key utilization rate, or hours of available parking capacity, used to determine ready and return space requirements was the peak hour number of rentals (238) and returns (155) and the number of hours of peak activity that the spaces would be required to accommodate during the peak rental day. Rental car companies prefer to maintain a sufficient supply of ready spaces and vehicles to accommodate the planned number of vehicles to be rented during the next hour's expected transactions. In addition, rental car companies prefer to have additional ready spaces available in case unplanned operational challenges occur, such as delayed flights. When flights are delayed, delayed customers are added to the next hour s planned rentals, potentially creating a shortfall of available vehicles. To alleviate this potential shortfall and to avoid customer delays, the rental car companies prefer to have a buffer of ready vehicles available to provide more capacity. than 1 hour of Sensitivity Analysis [3-4]
81 Therefore, the rental car companies typically prefer to have 2 to 3 hours of capacity for rental car ready and return vehicles (i.e., spaces). According to responses regarding the number of existing spaces and the transaction information collected from the questionnaire, the rental car companies at the Airport have approximately 2.5 hours of ready space capacity and 2.0 hours of return space capacity during peak periods. Based on this information, an average of 3.0 hours of rental car ready capacity and 2.0 hours of rental car return capacity was used to develop the facility requirements. Table 3-18 presents the rental car ready/return area requirements for existing (2014) demand and for each planning year. Note that for each planning year, there would be a deficiency of ready/return spaces. Table 3-18: Rental Car Ready/Return Space Requirements EXISTING BASELINE SCENARIO HIGH GROWTH SCENARIO COMPONENT Rental Car Ready/Return Facility Requirements Ready Spaces 14 1,101 1,306 1,341 1,101 1,41 1,460 Return Spaces TOTAL 1,024 1,59 1,83 1,923 1,59 2,032 2,095 Existing Rental Car Ready/Return Ready/Return Spaces Surplus/(Deficiency) Ready/Return Spaces (10) (25) (1,019) (1,069) (25) (1,18) (1,241) NOTE: Totals may not add due to rounding. SOURCE: Ricondo & Associates, Inc., Dallas Love Field Rental Car Industry Questionnaire, May PREPARED BY: Ricondo & Associates, Inc., November Also included in the vehicle space requirements is the onsite vehicle storage requirement during a peak week. This represents the number of spaces the rental car companies need to store vehicles that are not being rented or parked in a ready or return space. The utilization rate was calculated using the difference of rental and return transactions during the 2015 peak rental week, which, according to the questionnaire responses, nets 58 peak rentals and returns. It is assumed that ready/return spaces are not used to store vehicles. Table 3-19 presents the onsite vehicle storage facility requirements for existing (2014) demand and for each planning year. Note that, for each planning year, there would be a deficit of onsite vehicle storage spaces. Sensitivity Analysis [3-48]
82 Table 3-19: Rental Car Onsite Vehicle Storage Space Requirements EXISTING BASELINE SCENARIO HIGH GROWTH SCENARIO COMPONENT Rental Car Onsite Vehicle Storage Facility Requirements Storage Spaces 58 1,169 1,386 1,424 1,169 1,504 1,550 Existing Onsite Vehicle Storage Storage Spaces Surplus/(Deficiency) Storage Spaces 92 (319) (536) (54) (319) (654) (00) SOURCE: Ricondo & Associates, Inc., Dallas Love Field Rental Car Industry Questionnaire, May PREPARED BY: Ricondo & Associates, Inc., November The area required for exit booths was also calculated. Exit booths house personnel responsible for checking the credentials of the drivers of the rented vehicles exiting the facility. It was assumed that each booth could process 30 vehicles per 1 hour, at approximately 2.0 minutes per vehicle. Table 3-20 presents the exit booth requirements. No information regarding the existing number of exit booths was collected therefore no deficiency or surplus was calculated.. Table 3-20: Exit Booth Requirements EXISTING BASELINE SCENARIO HIGH GROWTH SCENARIO COMPONENT Exit Booth Requirements Exit Booths Existing Exit Booths Exit Booths 1/ N/A N/A N/A N/A N/A N/A N/A Surplus/(Deficiency) Exit Booths (8) (12) (15) (15) (12) (16) (16) NOTE: 1/ No information regarding the existing number of exit booths was collected therefore no deficiency or surplus was calculated. SOURCE: Ricondo & Associates, Inc., Dallas Love Field Rental Car Industry Questionnaire, May PREPARED BY: Ricondo & Associates, Inc., November Sensitivity Analysis [3-49]
83 3.3.4 SERVICE SITES The service sites accommodate vehicle support functions, such as fueling, washing, maintenance, and stacking/staging. After being processed through the service sites, the vehicle is parked in either a stacking space located at the service site or in a ready space for the next customer. Parking (stacking/staging) lanes are provided for queuing vehicles at each stage of the process. Thus, vehicles may be staged in lanes waiting for fuel, staged in lanes after fueling and waiting for washing, staged in lanes after washing and waiting for an available ready stall, or parked in the onsite vehicle storage area Fueling Positions The number of fueling positions required to accommodate future demand was based on the number of vehicles that can be fueled within the peak hour. The number of peak-hour returns is 155. Assuming that 12 minutes are required to fuel 1 vehicle, 5 vehicles can be fueled per 1 hour per position. The 12 minutes includes fueling, vacuuming, trash removal, checking and replacing fluids (oil, wiper fluid, and antifreeze), and checking all internal and external lights. This results in a requirement of 31 fueling positions for existing conditions (2014). Table 3-21 presents the fueling position requirements for existing (2014) demand and for each planning year. Note that, for each planning year, there would be a deficiency in fueling positions. Table 3-21: Fueling Position Requirements EXISTING BASELINE SCENARIO HIGH GROWTH SCENARIO COMPONENT Fueling Position Requirements Fueling Positions Existing Fueling Positions Fueling Positions Surplus/(Deficiency) Fueling Positions 5 (12) (21) (22) (12) (26) (2) SOURCE: Ricondo & Associates, Inc., Dallas Love Field Rental Car Industry Questionnaire, May PREPARED BY: Ricondo & Associates, Inc., November Wash Bays The number of wash bays required to accommodate future demand was based on the number of vehicles that can be washed in the peak hour. The number of peak hour returns is 155. Assuming that 2 minutes are required to wash a vehicle, a metric of 30 vehicles washed per 1 hour per wash bay was used to calculate the requirements. This results in a requirement of 5 wash bays for existing (2014). Table 3-22 presents the wash bay requirements for existing (2014) demand and for each planning year. Note that, for each planning year, there would be a surplus in wash bays, with the exception of the high growth scenario in 2024 and 2032 and the baseline scenario in Sensitivity Analysis [3-50]
84 Table 3-22: Wash Bay Requirements EXISTING BASELINE SCENARIO HIGH GROWTH SCENARIO COMPONENT Wash Bay Requirements Wash Bays Existing Wash Bays Wash Bays Surplus/(Deficiency) Wash Bays (1) SOURCE: Ricondo & Associates, Inc., Dallas Love Field Rental Car Industry Questionnaire, May PREPARED BY: Ricondo & Associates, Inc., November Vehicle Light Maintenance Bays Vehicle light maintenance bays are located adjacent to the wash bays. Maintenance bays and functional areas include vehicle lifts, parts storage, tool lockers, vehicle records storage, administrative support, employee break and locker areas, and an employee parking area. Light maintenance bays are used to change oil, align wheels, or replace minor parts, such as interior, head, or tail lights. Requirements for employee administrative support and employee parking areas were also developed. Because of the often unscheduled nature of vehicle maintenance, no utilization rate was developed for the maintenance bays. Instead, the requirements for maintenance bays, the administrative area, and the employee parking area were developed by increasing the existing quantity by the O&D passenger forecast rate. Based on the questionnaire responses, the rental car industry stated a need of 25 light maintenance bays; therefore, this number was used as the baseline for facility requirements. Increasing the 25 maintenance bays by the baseline passenger forecast growth rate results in a requirement of 4 maintenance bays in This same methodology was used for the employee administrative area and employee parking. Table 3-23 presents the requirements for light maintenance bays, employee administrative area, and employee parking spaces for existing (2014) demand and for each planning year. Sensitivity Analysis [3-51]
85 Table 3-23: Light Maintenance Bay, Employee Administrative Area, and Employee Parking Requirements EXISTING NEED BASELINE SCENARIO HIGH GROWTH SCENARIO COMPONENT Light Maintenance Bay Facility Requirements Light Maintenance Bays Administrative Area Requirements Administrative Area (square feet) 3,193 8,824 10,465 10,48 8,824 11,355 11,05 Employee Parking Requirements Employee Parking Spaces SOURCE: Ricondo & Associates, Inc., Dallas Love Field Rental Car Industry Questionnaire, May PREPARED BY: Ricondo & Associates, Inc., November Vehicle Stacking/Staging Spaces Overflow parking areas are provided near the service sites for the staging of clean vehicles for peak rental periods and for the stacking of return vehicles. A metric of 6 stalls per fueling nozzle was used to calculate the requirements. The utilization rate used to size the stacking area is based on the number of required fueling positions in 2014 (31) multiplied by the aforementioned metric (6 stalls/fueling nozzle). This results in a requirement of 186 vehicle stacking spaces for existing (2014) conditions. Returned vehicles are positioned in the stacking areas prior to being serviced. In some cases, clean vehicles may be stored in this area prior to being returned to a ready stall. Depending on the number of fueling positions on each fuel island, two, four, or six spaces would be provided on each island to stack clean or dirty vehicles (based on R&A s experience and an understanding of similar airport rental car facilities). Table 3-24 presents the facility requirements for vehicle stacking and staging spaces for existing (2014) demand and for each planning year. Table 3-24: Vehicle Stacking/Staging Space Requirements EXISTING BASELINE SCENARIO HIGH GROWTH SCENARIO COMPONENT Vehicle Stacking Space Requirements Stacking Spaces Existing Vehicle Stacking Spaces Stacking Spaces Surplus/(Deficiency) Stacking Spaces (22) (28) SOURCE: Ricondo & Associates, Inc., Dallas Love Field Rental Car Industry Questionnaire, May PREPARED BY: Ricondo & Associates, Inc., November Sensitivity Analysis [3-52]
86 3.3.5 FACILITY REQUIREMENTS SUMMARY A summary of the requirements for the rental car facility components is presented in Table 3-25 for existing (2014) demand and for each planning year. Table 3-25: Rental Car Facility Requirements Summary EXISTING BASELINE SCENARIO HIGH GROWTH SCENARIO COMPONENT Customer Service Area Regular Customer Service Positions Ready/Return and Onsite Vehicle Storage Area Ready Spaces 14 1,101 1,306 1,341 1,101 1,41 1,460 Return Spaces Storage Spaces 58 1,169 1,386 1,424 1,169 1,504 1,550 Service Sites Fueling Positions Wash Bays Light Maintenance Bays Stacking Spaces SOURCE: Ricondo & Associates, Inc., Dallas Love Field Rental Car Industry Questionnaire, May PREPARED BY: Ricondo & Associates, Inc., November A summary of the surplus or deficiency in the requirements for the rental car facility components is presented in Table 3-26 for existing (2014) demand and for each planning year. Those components that would be operating at a deficiency are shown in parentheses. A summary of the total requirements for each rental car facility component is presented in Table 3-2 for each planning year. Sensitivity Analysis [3-53]
87 Table 3-26: Requirements Surplus/(Deficiency) Summary EXISTING BASELINE SCENARIO HIGH GROWTH SCENARIO COMPONENT Regular Customer Service Positions 19 2 (8) (9) 2 (13) (15) Ready/Return and Onsite Vehicle Spaces Total Ready/Return Spaces (10) (25) (1,019) (1,069) (25) (1,18) (1,241) Onsite Vehicle Storage Spaces 92 (319) (536) (54) (319) (654) (00) Service Sites Fueling Positions 5 (12) (21) (22) (12) (26) (2) Wash Bays (1) Vehicle Stacking/Staging Spaces (22) (28) SOURCE: Ricondo & Associates, Inc., Dallas Love Field Rental Car Industry Questionnaire, May PREPARED BY: Ricondo & Associates, Inc., November Sensitivity Analysis [3-54]
88 Table 3-2: Rental Car Facility Requirements 2015 SPACE PROGRAM 2024 SPACE PROGRAM 2032 SPACE PROGRAM HIGH HIGH HIGH BASELINE GROWTH BASELINE GROWTH BASELINE GROWTH SCENARIO SCENARIO SCENARIO SCENARIO SCENARIO SCENARIO Customer Service Area Regular Counter Positions Ready/Return/Storage Areas Ready Spaces 1,101 1,101 1,306 1,41 1,306 1,460 Return Spaces Subtotal Area Ready/Return (spaces) 1,59 1,59 1,83 2,032 1,888 2,095 Storage Spaces 1,169 1,169 1,386 1,504 1,424 1,550 Exit Booths QTA/Service Site Fueling Positions Wash Bays Stacking and Staging Spaces Maintenance Bays Administrative Area (square feet) 8,824 8,824 10,465 11,355 10,48 11,05 Employee Parking (spaces) TOTAL REQUIREMENT - SQUARE FEET 919, ,924 1,091,065 1,184,155 1,109,448 1,219,305 TOTAL REQUIREMENT - ACRES SOURCE: Ricondo & Associates, Inc., Dallas Love Field Rental Car Industry Questionnaire, May PREPARED BY: Ricondo & Associates, Inc., November Sensitivity Analysis [3-55]
89 4. Terminal Facilities This section describes the analysis performed to determine future terminal facility requirements for DAL after the terminal components of the LFMP have been completed. The LFMP was created in 2009 to accommodate the increase in commercial air service after the repeal of the Wright Amendment on October 13, 2014; it represents a joint effort by the City of Dallas and Southwest Airlines to expand and transform DAL into a convenient, modern airport for travelers. There have been significant changes since 2009 to the manner in which passengers interface with terminal facilities, including: terminal space planning standards, technology improvements, passenger preferences, and trusted traveler programs. 4.1 Planning Activity Levels Planning activity levels (PALs) represent activity levels that may trigger the need for additional airport capacity or other development. The use of PALs facilitates the need to plan for aviation activity levels, rather than plan for specific timelines DESIGN DAY FLIGHT SCHEDULE The DDFS from two commercial aviation passenger forecasts developed in 2015 were used to derive the potential range of terminal facility requirements depending on the intensity of gate utilization. The DDFS included flight-by-flight data, including load factors and O&D shares. Table 4-1 summarizes and compares key metrics from the high growth forecast and baseline forecast DDFS pertaining to peak-hour levels for flight operations, as well as for arriving and departing passengers. Exhibit 4-1 illustrates the diurnal levels of originating passengers at their scheduled time of departure. The exhibit indicates that the peak-hour activity level for originating passengers occurs between :00 a.m. and 8:00 a.m. for both the high growth forecast and baseline forecast DDFS. Sensitivity Analysis [4-1]
90 Table 4-1: Design Day Flight Schedule Metrics DAILY UNITS 2015 BASELINE Departures HIGH GROWTH BASELINE HIGH GROWTH Aircraft Operations operations Seats passengers 28,355 30,384 35,308 31,152 36,200 Enplaned Passengers passengers 22,22 26,01 30,48 26,83 31,299 Originating Passengers Arrivals passengers 12,586 15,62 18,209 1,330 19,948 Aircraft Operations operations Seats passengers 28,355 30,384 35,308 31,152 36,200 Deplaned Passengers passengers 22,09 26,598 31,128 2,345 31,969 Terminating Passengers passengers 13,040 16,290 18,821 1,85 20,686 PEAK HOUR Departures Aircraft Operations operations Seats passengers 3,205 3,286 3,96 3,414 3,860 Enplaned Passengers passengers 2,404 2,95 3,39 2,862 3,422 Originating Passengers passengers 1,91 2,35 2,92 2,403 2,91 Arrivals Aircraft Operations operations Seats passengers 2,859 3,218 3,248 3,314 3,455 Deplaned Passengers passengers 2,350 2,51 2,911 2,826 3,095 Terminating Passengers passengers 1,648 1,845 2,061 1,888 2,050 Overall Aircraft Operations operations SOURCE: Ricondo & Associates, Inc., March PREPARED BY: Ricondo & Associates, Inc., March Sensitivity Analysis [4-2]
91 Exhibit 4-1: Diurnal Originating Passenger Activity Levels Rolling Hour Originating Passengers 3,000 2,800 2,600 2,400 2,200 2,000 1,800 1,600 1,400 1,200 1, High: 2, Baseline: 2, : 1,91 SOURCE: Ricondo & Associates, Inc., March PREPARED BY: Ricondo & Associates, Inc., March Planning Basis 2032 High: 2, Baseline: 2,403 0:00 1:00 2:00 3:00 4:00 5:00 6:00 :00 8:00 9:00 10:00 11:00 12:00 13:00 14:00 15:00 16:00 1:00 18:00 19:00 20:00 21:00 22:00 23: High 2024 High 2032 Baseline 2024 Baseline 2015 This section describes the planning basis utilized to determine future terminal facility requirements. The planning basis includes: passenger processing sequences, terminal operating parameters, and passenger attributes, which are intended to be specific to DAL. The sources used to develop the planning basis included: previous published studies; site observations made in fall 2015; data collected at comparable airports; and industry-published guidelines representing best practices pertaining to processing rates and LOS PASSENGER PROCESSING SEQUENCE Exhibit 4-2 and Exhibit 4-3 illustrate typical passenger processing sequences for originating (departing) passengers and destination (terminating) passengers, respectively. The exhibits also illustrate sequences for connecting passengers, who generally do not utilize terminal facilities located on landside (uncontrolled terminal zone). Sensitivity Analysis [4-3]

92 Exhibit 4-2: Originating Passengers Flows SOURCE: Ricondo & Associates, Inc., March PREPARED BY: Ricondo & Associates, Inc., March SOURCE: Ricondo & Associates, Inc., March PREPARED BY: Ricondo & Associates, Inc., March PASSENGER ATTRIBUTES Exhibit 4-3: Destination Passengers Flows Passenger attributes and LOS standards are the principle considerations applied against demand to determine facility requirements Passenger Group Size Passenger group size pertains to the number of passengers that share the same reservation code and conduct transactions as a group. Table 4-2 lists the group size characteristics sourced from the Ticketing Hall Simulation Summary, which was used in this analysis. Table 4-2: Passenger Group Size GROUP SIZE UNITS 1 passenger percent passengers percent 25 3 passengers percent 9. 4 passengers percent 6. 5 passengers percent 4.4 SOURCE: Love Field Modernization Team, Ticketing Hall Simulation Summary, April 2, PREPARED BY: Ricondo & Associates, Inc., March Sensitivity Analysis [4-4]

93 Passenger Show-Up Profiles Show-up profiles represent the amount of time departing passengers show up at check-in ahead of their scheduled time of flight departure. Exhibit 4-4 illustrates the show-up profiles sourced from the Ticketing Hall Simulation Summary, which was used in this analysis. NOTE: Totals may not add to 100% due to rounding. Exhibit 4-4: Passenger Show-Up Profiles SHOW-UP TIME UNITS More than 3 hours percent hours percent hours percent hour percent.8 SOURCE: Love Field Modernization Team, Ticketing Hall Simulation Summary, April 2, PREPARED BY: Ricondo & Associates, Inc., March Checked Bags Table 4-3 shows the number of checked bags per originating passenger that was used for this study. The number of 0. checked bags per passenger was applied to both arriving and departing passengers. Sensitivity Analysis [4-5]
94 Table 4-3: Checked Bags per Originating Passenger ATTRIBUTES UNITS Checked Baggage Overall Bags per Originating Passenger bags/passenger 0. Percentage of Passengers Not Checking Bags passenger 35.0% Percentage of Passengers Checking Bags passenger 65.0% Bags Per Passenger passenger 0 passenger 35.0% 1 passenger 56.4% 2 passenger 5.% 3 passenger 2.0% 4 passenger 0.5% 5+ passenger 0.4% SOURCES: Love Field Modernization Team, Ticketing Hall Simulation Summary, April 2, 2010; Ricondo & Associates, Inc., March PREPARED BY: Ricondo & Associates, Inc., March LEVEL OF SERVICE STANDARDS LOS standards define key performance objectives for passenger transaction wait times and the amount of space provided to passengers waiting in queue. Table 4-4 lists the LOS standards framework for the design of terminal facilities, as recommended by the International Air Transport Association in its Airport Development Reference Manual, 10th edition. The standards are the following: Overdesign (A/B): facilities resulting in underutilized spaces with nearly no delays; high maintenance and construction cost relative to facility utilization. Optimum Design (C): facilities that provide adequate space and reasonable delays; cost of maintenance and construction is equitable to facility utilization. Suboptimum Design (D): a facility that meets one but not both space and time LOS variables; facility should consider improvements. Suboptimum Design (E): facilities resulting in breakdown with unacceptable delays; strongly suggests improvements to an over-utilized facility. The specific LOS standards used for individual processors and functional are identified in the following discussion on operating parameters. Sensitivity Analysis [4-6]


95 DALLAS LOVE FIELD OCTOBER 2016 Table 4-4: International Air Transport Association Level-of-Service Space-Time Framework NOTES: IATA - International Air Transport Association ADRM Airport Development Reference Manual CIP Commercial Important Passenger 1/ The lower limit is only to be considered if extensive Food and Beverage is provided in the departures lounge or concession zone seating is available. SOURCE: International Air Transport Association, Airport Development Reference Manual, 10th ed., March PREPARED BY: Ricondo & Associates, Inc., March Sensitivity Analysis [4-]
96 4.2.4 OPERATING PARAMETERS The following section introduces five operating parameters specific to airports. Each one of these areas, with the exception of outbound bag makeup, represents a direct interaction between the operation of the airport and the passenger. These operating parameters are the following: Check-in Passenger Security Screening Checkpoint Holdrooms Outbound Bag Makeup Bag Claim Check-in Exhibit 4-5 illustrates check-in channel preferences for departing passengers, as observed through onsite observations made in fall Passengers were offered different check-in options that included full-service counters or a combination of check-in kiosks and bag-drop counters. Full-Service Agent Positions: Based on observation, full-service agents positions were prioritized to passengers flying to international destination flying by way of connecting through another domestic airport and passengers needing special assistance; such as minors travelling alone, and premium passengers. Kiosk Check-in (boarding pass and/or self-tag): The majority of passengers were encouraged to use the kiosk check-in process. Kiosks in the check-in lobby could be used by passengers to acquire boarding passes and baggage tags; kiosks located in other locations, such as adjacent to the security checkpoint, could only be used by passengers to acquire boarding passes. Bag-Drop Counters: Passengers who are checking bags, self-tag their check-in baggage at kiosks and drop them at agent-staffed bag-drop counters. Table 4-5 lists the transaction times and wait times for passengers using in-terminal check-in facilities. Sensitivity Analysis [4-8]
97 Exhibit 4-5: Check-In Channel Preferences SOURCE: Ricondo & Associates, Inc., Site Observations, October PREPARED BY: Ricondo & Associates, Inc., March NOTE: N/A Not Applicable SOURCE: Ricondo & Associates, Inc., Site Observations, October PREPARED BY: Ricondo & Associates, Inc., March Table 4-5: Check-In Wait Times and Transaction Times NO CHECKED BAGS WAIT TIME TRANSACTION TIME Bypass N/A N/A Kiosk 2.0 minutes 3.0 minutes CHECKED BAGS WAIT TIME TRANSACTION TIME Kiosk 2.0 minutes 3.5 minutes Bag Induction 4.0 minutes 1.0 minute Agent 15.0 minutes 3.0 minutes Sensitivity Analysis [4-9]
98 Passenger Security Screening Checkpoint Table 4-6 lists the operating parameters for Transportation Security Administration (TSA) screening checkpoints. The analysis utilized screening rates for standard screening and Pre that are consistent with TSA guidelines for new checkpoints. The percentage of passengers eligible to use Pre was based on data from fall Table 4-6: Passenger Security Screening Checkpoint Screening Rates CHECKPOINT TYPE PERCENTAGE WAIT TIME PROCESSING RATE Pre 30% minutes 150 passengers/hour Standard 0% 10 minutes 260 passengers/hour SOURCE: Ricondo & Associates, Inc., Site Observations, October PREPARED BY: Ricondo & Associates, Inc., March Holdrooms Holdrooms comprise preboarding areas adjacent to aircraft gates, which are used by passengers for sitting and standing, airline agent check-in podiums, and boarding/deplaning queuing spaces and aisles. Holdroom requirements are based on the predominant or largest aircraft supported by the holdroom. For this analysis, high and low requirements for holdrooms were developed based on the two aircraft models that are most common in the Southwest Airlines fleet: a Boeing 3-00 configured for 143 seats represented the low range for holdroom requirements, and a Boeing configured for 15 seats represented the high range. Table 4- lists other planning factors that were applied to the respective aircraft seating capacities in order to develop the individual holdroom space requirements Outbound Bag Makeup Outbound bag makeup facility requirements principally pertain to the number and capacity of bag makeup devices (typically bag carousels, piers, or slides) that receive and accumulate checked bags prior to being loaded onto baggage carts or containers for delivery to outbound aircraft. Bags accumulated on makeup devices have cleared TSA Hold Bag Screening. Table 4-8 lists the criteria used to determine outbound bag makeup facility requirements, which, for this analysis, were developed in terms of the linear feet of cart staging positions used for flight makeup during the period beginning 120 minutes and ending 30 minutes before scheduled time of departure. Sensitivity Analysis [4-10]
99 Table 4-: Holdroom Planning Criteria PLANNING FACTORS UNITS OF MEASURE UNITS SOURCE Aircraft Seats Southwest Airlines Load Factor percentage 95% Ricondo & Associates, Inc., March Adjoining Holdroom Credit percentage 0.9 ACRP 25 4/ Agent Counter Area 1/ square feet ACRP 25 4/ Agent Counter Positions positions 2 ACRP 25 4/ Aisleway 2/ square feet ACRP 25 4/ Aisleway 2/ row 1 ACRP 25 4/ Holdroom Calculation 3/ Seated square feet ,19 Ricondo & Associates, Inc., March Standing square feet Ricondo & Associates, Inc., March Queueing square feet Ricondo & Associates, Inc., March Adjoining square feet 1,24 2,110 Ricondo & Associates, Inc., March Total Area Required 2,144 2,530 Holdroom Factor Passengers per square foot NOTES: 1/ Based on 4 feet wide and 30 feet deep. 2/ Based on 6 feet wide and 30 feet deep. 3/ Based on 40 percent seated, 30 percent standing, and 30 percent queuing. 4/ Airport Cooperative Research Program, Report 25, Airport Passenger Terminal Planning and Design, 2010 SOURCES: Airport Cooperative Research Program, Report 25, Airport Passenger Terminal Planning and Design, 2010; Ricondo & Associates, Inc., March PREPARED BY: Ricondo & Associates, Inc., March Table 4-8: Outbound Baggage Makeup Planning Criteria OUTBOUND BAG MAKEUP UNITS SOURCE Linear feet per Cart feet 6.0 Airport Cooperative Research Program, Report 25 Overall Bags per Passenger ratio 0. Ticketing Hall Simulation Summary, April 2, 2010 Bags per Cart bags 40.0 Airport Cooperative Research Program, Report 25 Cart Close-Out Time minutes 30.0 Airport Cooperative Research Program, Report 25 SOURCES: Airport Cooperative Research Program, Report 25, Airport Passenger Terminal Planning and Design, 2010; Love Field Modernization Team, Ticketing Hall Simulation Summary, April 2, PREPARED BY: Ricondo & Associates, Inc., March Sensitivity Analysis [4-11]
100 Bag Claim Domestic bag claim capacity is principally determined by the amount of retrieval area, which is defined as a 12- foot band surrounding a bag claim device, provided for passengers waiting to claim their checked bags. The analysis is predicated on last bag delivery occurring within 20 minutes of flight arrival. Table 4-9 lists the criteria used to determine the requirements for bag claim. Table 4-9: Domestic Bag Claim Planning Criteria DOMESTIC BAG CLAIM UNITS SOURCE Last Bag Delivery (after arrivals) minutes 20 Passenger Accumulation percent 60 Ricondo & Associates, Inc., July Retrieval Zone Depth feet 12 Area per Passenger in Retrieval Zone for LOS C Typical Claim Device Linear Presentation Length Typical Claim Device Retrieval Area Total Device Area (Retrieval, Device, and Circulation) square feet 18 linear feet 190 square feet square feet 2,45 4,35 IATA, Airport Development Reference Manual, 10th ed., March IATA, Airport Development Reference Manual, 10th ed., March From Existing Terminal Layout From Existing Terminal Layout From Existing Terminal Layout SOURCES: International Air Transport Association, Airport Development Reference Manual, 10th ed., March 2014; Ricondo & Associates, Inc., July PREPARED BY: Ricondo & Associates, Inc., March Analysis Future requirements of check-in facilities, security screening checkpoints, holdrooms, outbound baggage makeup, and bag claim are reviewed in the following section. The existing data are shown for the year 2015, and forecast requirements are shown for the years 2024 and 2032 (for both the baseline and the high growth scenario forecasts) CHECK-IN Passenger demand for check-in facilities was separately modeled using computer simulation software that applied planning criteria, which included show-up profiles and processing rates, in order to determine the number and types of check-in units that would be needed to maintain the Airport s prescribed LOS standard for check-in wait times. Table 4-10 lists the number of required check-in positions that correlate to the respective DDFS activity levels. The terminal inventory of check-in positions indicated adequate capacity to support the baseline and high growth scenario DDFS activity levels; however, additional kiosks would be needed. Sensitivity Analysis [4-12]
101 Table 4-10: Check-In Requirements PASSENGER PROCESSING EXISTING SPACE AVAILABLE REQUIREMENTS ACTUAL BASELINE FORECAST HIGH GROWTH FORECAST BASELINE FORECAST HIGH GROWTH FORECAST Peak Hour Originating Passengers 1/ NA 1,91 2,35 2,92 2,403 2,91 Peak Hour Passenger Check-in Demand NA 1,459 1,69 1,86 1,831 1,85 Kiosks 2/ Bag Induction Points NA Agent Positions NA TOTAL STAFF POSITIONS NOTE: 1/ At schedule time of departure. 2/ Kiosks are not included in total staff positions as they can be relocated or added based on need. SOURCE: Ricondo & Associates, Inc., March PREPARED BY: Ricondo & Associates, Inc., March PASSENGER SECURITY SCREENING CHECKPOINT Computer modeling was used to determine the number of security screening lanes needed to maintain the LOS standard for security wait times and to estimate the numbers of passengers waiting in queue. Demand at the security screening checkpoint was modeled using a consolidated checkpoint configuration and was based on passengers being able to complete their check-in transactions within the prescribed LOS wait times. Table 4-11 lists the peak-hour demand basis and requirements for the security screening lanes that correlate to the respective DDFS activity levels. The terminal inventory of security screening lanes indicated these should provide adequate capacity to support the baseline and high growth scenario DDFS activity levels. PASSENGER PROCESSING Table 4-11: Security Screening Checkpoint Requirements EXISTING SPACE AVAILABLE REQUIREMENTS HIGH HIGH BASELINE GROWTH BASELINE GROWTH ACTUAL FORECAST FORECAST FORECAST FORECAST Peak Hour Originating Passengers 1/ NA 1,91 2,35 2,92 2,403 2,91 Peak Hour Passenger Checkpoint Demand NA 1,851 2,218 2,342 2,30 2,389 Pre Positions NA Standard Positions NA TOTAL STAFF POSITIONS NOTE: 1/ At schedule time of departure. SOURCE: Ricondo & Associates, Inc., March PREPARED BY: Ricondo & Associates, Inc., March Sensitivity Analysis [4-13]
102 4.3.3 HOLDROOMS The holdroom planning criteria described in Section was applied to every flight comprising the peak hour for flight operations in order to determine the aggregate holdroom area requirement. Flight operations were used instead of gates due to the high number of turns per gate, which causes overlapping holdroom occupancy between closely scheduled flight departures. Table 4-12 lists the holdroom requirements depending on the respective aircraft seating capacity (low range and high range), which can be summarized as follows: Baseline Scenario requirements do not change for 2024 and 2032 as the operations per hour stay the same. Although the current space is adequate for the low range aircraft (B3-00) requirements through 2032; the high-range aircraft (B3-800) requirements show a need for an additional 6,000 square feet of holdroom area for the 2024 and 2032 requirements. This is equivalent to approximately two holdroom areas based on the approximate 2,640 square feet per holdroom requirement for a B High Growth Scenario requirements are the same through 2032 due to the number of peak hour operations staying consistent through the planning period. However, the 2024 and 2032 low range aircraft requirements show a need for an additional 2,000 square feet, equivalent to one additional holdroom, over existing conditions. In addition, the high range aircraft requirements illustrate the need for approximately 11,000 square feet of additional holdroom area, or four additional holdrooms over the existing conditions based on the B3-800 requirement of 2,640 square feet per holdroom. PASSENGER PROCESSING UNITS GROUP III PLANNING FACTORS Table 4-12: Holdroom Requirements EXISTING SPACE AVAILABLE REQUIREMENTS ACTUAL BASELINE FORECAST HIGH GROWTH FORECAST BASELINE FORECAST HIGH GROWTH FORECAST Peak Hour Operations Operations NA TOTAL HOLDROOM REQUIREMENT Low-Range Requirements: / sq ft 49,310 4,10 51,450 4,10 51,450 49,40 High-Range Requirements: / sq ft 58,180 55,650 60,10 55,650 60,10 NOTES: 1/ Based on 2,144 square feet per Boeing / Based on 2,641 square feet per Boeing SOURCE: Ricondo & Associates, Inc., March PREPARED BY: Ricondo & Associates, Inc., March Sensitivity Analysis [4-14]
103 4.3.4 OUTBOUND BAGGAGE MAKEUP A spreadsheet model was used to determine the number of carts required to support the peak 10-minute flight makeup period. The required number of carts was multiplied by 6 linear feet per cart to convert the requirement into linear feet of cart staging positions based on perpendicular cart staging. Table 4-13 lists outbound baggage makeup requirements that correlate to the respective DDFS activity levels. The current baggage makeup area should provide adequate capacity to support the baseline forecast; however, at the high growth scenario forecast activity levels, cart staging will be operating at capacity. OUTBOUND BAGGAGE MAKEUP UNITS Table 4-13: Baggage Makeup Requirements EXISTING SPACE AVAILABLE REQUIREMENTS ACTUAL BASELINE FORECAST HIGH GROWTH FORECAST BASELINE FORECAST HIGH GROWTH FORECAST Peak 10-min Flights in Makeup operations Cart Requirement cart PEAK 10-MIN REQUIRED LENGTH linear feet/cart SOURCE: Ricondo & Associates, Inc., March PREPARED BY: Ricondo & Associates, Inc., March BAG CLAIM A spreadsheet model was used to determine domestic bag claim requirements based on last bag delivery occurring within 20 minutes of flight arrival. Table 4-14 lists the bag claim requirements that correlate to the respective DDFS activity levels. An additional bag claim device will be needed for the baseline 2024 forecast. Two additional bag claim devices will be needed to support the 2024 high growth scenario forecast, as well as for both the baseline and high growth scenario 2032 DDFS activity levels. DOMESTIC BAG CLAIM UNITS Table 4-14: Bag Claim Requirements EXISTING SPACE AVAILABLE REQUIREMENTS ACTUAL BASELINE FORECAST HIGH GROWTH FORECAST BASELINE FORECAST HIGH GROWTH FORECAST Peak 20 Minutes Passengers with Bags passengers Peak 20 Minutes Operations operations Bag Claim Requirement devices Retrieval Area Requirement square feet 10,980 10,980 13,25 16,40 13,25 16,40 Total Bag Claim Area Requirement square feet 1,500 1,500 21,85 26,250 26,250 26,250 SOURCE: Ricondo & Associates, Inc., March PREPARED BY: Ricondo & Associates, Inc., March Sensitivity Analysis [4-15]
104 5. Airfield Facilities After the delivery of the May 2015 MPU, a new pavement analysis was conducted, which noted the need to reconstruct Runway 13R-31L much earlier than anticipated. Due to the deteriorating pavement on Runway 13R- 31L, a further analysis of the operational capacity of the airfield was required to determine near-term airfield improvements needed to efficiently operate on a single-runway system, as well as determine how these improvements integrate into an ultimate airfield layout. The Sensitivity Analysis alternatives were based on current FAA standards, findings in the 2015 MPU, the updated pavement analysis (2015), January 201 construction projects, and January 201 design projects. 5.1 Data Collection and Existing Conditions Documentation An updated basemap was created to reflect existing airfield conditions. The existing conditions represented the baseline configuration of the airfield as of FY This includes the demolition, reconstruction, expansion, and rehabilitation of several geometric features across the airfield that were under contract for construction as of November The basemap was utilized for capacity analysis and the development of alternatives. The basemap reflects the following construction projects: Rehabilitate Taxiway B from B1 to B3 and Connectors B3 and B4 Rehabilitate Runway Intersections Runway Incursion Mitigation Runway Conversion Project Configure north of the terminal to represent the existing layout: Taxilane Q Remain Overnight (RON) Taxiway P Exhibit 5-1 presents the airfield basemap. Sensitivity Analysis [5-1]

105 Exhibit 5-1: Existing Conditions (2020) Basemap NOTE: Existing basemap included construction projects that were under contract for construction as of November SOURCES: City of Dallas, November 2016; Ricondo & Associates, Inc., November PREPARED BY: Ricondo & Associates, Inc., November Operational Analysis of the Existing Airside Facilities In the 2015 MPU, the airside was assessed, assuming both Runway 13L-31R and Runway 13R-31L were in operation. The airfield improvements were thus based on adjustments to accommodate FAA design standards and minor capacity gains. Since the 2015 MPU was submitted, the reconstruction of Runway 13R-31L and the increased aircraft operations post Wright Amendment have changed the initial assumptions. To further understand the capacity of the existing airfield without Runway 13R-31L in operation, and considering any necessary improvements needed to add capacity to the east airfield during the runway reconstruction, both qualitative and quantitative analyses were performed. The analyses were conducted for both 2016 (existing) and 2020 (Runway 13R-31L reconstruction). The analyses are described in the following sections. Sensitivity Analysis [5-2]
106 5.2.1 AIRFIELD CAPACITY QUALITATIVE ANALYSIS On November 3, 2016, a meeting was held for R&A staff, Air Traffic Control Tower (ATCT) personnel, and Department of Aviation (DoA) staff to determine the issues that impact current aircraft movements on the airfield. During this meeting, the topics discussed included the following: general description of project (Runway 13R-31L extended closure) assumptions of traffic levels studied the current airfield layout and GA parking configuration investigation of taxi flows based on the revised existing conditions possible ground movement congestion points in both north and south flow spacing required for a shared-use runway in visual flight rules (VFR) and instrument flight rules (IFR) conditions surface movements severe weather operations the location and magnitude of GA operations aircraft towing operations from General Dynamics to north of Runway 13L-31R impacts of navigational aids (NAVAIDs) in existing conditions construction impacts to operators west of Runway 13R-31L during construction The following subsections focus on the main conclusions that arose from the meeting Taxi Flow Patterns Taxi-flow patterns are illustrated on Exhibit 5-2 and Exhibit 5-3. Sensitivity Analysis [5-3]


107 Exhibit 5-2: Taxiway Flow Patterns with 13R-31L Closed South Flow SOURCES: City of Dallas, November 2016: Ricondo & Associates, Inc., November PREPARED BY: Ricondo & Associates, Inc., November Sensitivity Analysis [5-4]


108 Exhibit 5-3: Taxiway Flow Patterns with 13R-31L Closed North Flow SOURCES: City of Dallas, November 2016: Ricondo & Associates, Inc., November PREPARED BY: Ricondo & Associates, Inc., November Ground Movement Congestion Points The analysis identified the congestion points for three ground movements, which are illustrated on Exhibit 5-4. They were as follows: South Flow Operations: There is insufficient room to hold delayed aircraft, which causes a back-up of aircraft in this area. North Flow Operations: There is insufficient room to hold delayed aircraft, which causes a back-up of aircraft in this area. Towed Aircraft: Towed aircraft will be difficult to transition to points on Taxiway B north of Taxiway B1. Towed aircraft will be required to cross Runway 13L-31R on Taxiways A1/B1, which will cause the potential for opposite-direction traffic flows on Taxiway A between Taxiways A1 and D. Sensitivity Analysis [5-5]


109 Exhibit 5-4: Ground Movement Congestion Points with 13R-31L Closed South Flow Congestion SOURCES: City of Dallas, November 2016: Ricondo & Associates, Inc., November PREPARED BY: Ricondo & Associates, Inc., November Findings Towed Aircraft Congestion North Flow Congestion Through conversations with ATCT personnel and DoA staff, suggested taxiway additions, consistent with the MPU recommendations and geometry, were drafted to be further analyzed. The preliminary findings are shown on Exhibit 5-5 and Exhibit 5-6. Sensitivity Analysis [5-6]


110 Exhibit 5-5: Suggested Additional Taxiway Use South Flow SOURCES: City of Dallas, 2016; Ricondo & Associates, Inc., November PREPARED BY: Ricondo & Associates, Inc., November Exhibit 5-6: Suggested Additional Taxiway Use North Flow SOURCES: City of Dallas, 2016, Ricondo & Associates, Inc., November PREPARED BY: Ricondo & Associates, Inc., November Sensitivity Analysis [5-]
111 5.2.2 AIRFIELD CAPACITY QUANTITATIVE ANALYSIS A quantitative analysis was also performed to further establish the airfield capacity at the time of Runway 13R- 31L reconstruction. The analysis utilized activity data provided by Vector Airport Systems to determine a peak day of operations. Vector s data indicated that the maximum daily traffic was 53 operations, which occurred on September 23, A busy traffic day was determined by using Vector s data and discussions with ATCT personnel. An operational level of 20 operations on October 5, 2016 (see Exhibit 5-) was identified to be used as a busy day in the analysis, as this level of traffic was repeated on several instances during the studied time frame and 53 operations was considered to be an outlier. Exhibit 5-8 shows the peak operations by occurrence from January 2016 through early October Vector Airport Systems and Aviation System Performance Metrics (ASPM) data validated normal busy day operations. The forecast operations held fairly stable from 2016 through 2020, with little to no growth expected for air carrier operations prior to In addition, it was assumed that other vacated gates would not increase the number of operations, which is constrained by the limited number of gates (20) and the turn times on gates. There was also little to no GA growth accommodated, which remains consistent with the MPU SOURCE: Vector Airport Systems, October PREPARED BY: Ricondo & Associates, Inc., November Exhibit 5-: Daily Operations Level (01/ /2016) 20 Operations (Busy Day) Daily Operations Sensitivity Analysis [5-8]
112 Exhibit 5-8: Peak Operations by Occurrence (01/ /2016) Days Operations SOURCE: Federal Aviation Administration, Aviation System Performance Metrics, October PREPARED BY: Ricondo & Associates, Inc., November Daily Demand and Capacity Operations Runway capacity was determined using 20 operations as a busy day. Through discussions with the ATCT personnel, 4 nautical miles (NM) between arrivals was determined to be the amount of spacing required to use Runway 13L-31R in shared operations 8 during VMC conditions; 6 to NM spacing would be required for shareduse operations during instrument meteorological conditions (IMC). Historical knowledge and FAA Operational Information System (OIS) information indicated that 4 NM spacing yields an airport arrival rate (AAR) of 30 arrivals per hour in VFR conditions; thus, it was assumed that this would yield an airport departure rate (ADR) of 30 departures per hour. In addition, historical knowledge and FAA OIS information indicated that 6 NM spacing yields an AAR of 20; thus, it was assumed that this will yield an ADR of 20 in IFR conditions. Table 5-1 presents a benchmark of runway capacity at other airports with similar operational runway use. 8 Shared-use operations refers to arrivals and departures on the same runway. Sensitivity Analysis [5-9]
113 Table 5-1: Benchmark of Existing Runway Capacity AIRPORT ARRIVAL RUNWAY DEPARTURE RUNWAY IMC OPERATIONS VMC OPERATIONS San Diego International Airport William P. Hobby Airport R 12R L 30L (SRO) Chicago Midway International Airport 13C 13C NOTES: SRO Single Runway Operation IMC Instrument Meteorological Conditions VMC Visual Meteorological Conditions SOURCE: Federal Aviation Administration, National Airspace System Status, (accessed November 2016). PREPARED BY: Ricondo & Associates, Inc., November Hourly Demand and Capacity Hourly data were analyzed on a single-use runway using data from October 5, The data were analyzed assuming that the runway capacity holds at 30 arrivals and 30 departures per hour in VFR conditions and at 20 arrivals and 20 departures per hour in IFR conditions. VFR conditions exist when the cloud cover is equal to or greater than 1,000 feet above the ground and when visibility conditions are 3 miles or greater. IFR conditions exist when either the ceiling or the visibility is less than what is prescribed for VFR. For VFR conditions, 2 hourly periods of either arrival or departure demand exceeds capacity (see Exhibit 5-9). The hours exceeding demand are :00 a.m. and 4:00 p.m. The :00 a.m. departure demand exceeds departure capacity of a balanced, shared airfield, particularly due to the morning rush and the voluntary noise program for commercial carriers, which allows departures no earlier than 6:00 a.m. Since arrival demand is low during the :00 a.m. hour, additional departures could be accommodated. The 4:00 p.m. hour exceeds capacity due to the arrival demand. Although the arrival demand exceeds the arrival capacity, the departure demand is reduced during that hour, enabling additional arrivals during this peak arrival hour. Contrary to VFR conditions, both arrivals and departures meet or exceed capacity during individual hours in IFR conditions (see Exhibit 5-10). There are no opportunities to capture some unused capacity and shift it to the higher demand operations. The subsequent hours in busy periods do not provide sufficient capacity to absorb previous operations; thus, delays will escalate throughout the day. Sensitivity Analysis [5-10]


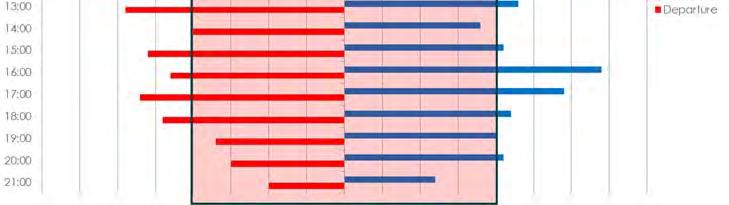
114 Exhibit 5-9: Hourly Visual Flight Rules Counts / 30 Airport Arrival Rate SOURCE: Federal Aviation Administration, Aviation System Performance Metrics, October PREPARED BY: Ricondo & Associates, Inc., November Exhibit 5-10: Hourly Instrument Flight Rules Counts / 20 Airport Arrival Rate SOURCE: Federal Aviation Administration, Aviation System Performance Metrics, October PREPARED BY: Ricondo & Associates, Inc., November Sensitivity Analysis [5-11]


115 Minute Demand and Capacity It should be noted that hourly counts provide a global view of the Airport s demand and capacity. To provide a more detailed view of demand versus capacity, 15-minute time periods were analyzed. The VFR 15-minute counts indicate that there are numerous times throughout the day when demand exceeds capacity of a single runway operation. (see Exhibit 5-11). In most cases, when the demand exceeds the capacity, the subsequent 15-minute period has additional capacity available. This indicates that at certain times, delays of up to 15 minutes would be present, but they could be rapidly reduced by utilizing the additional capacity in the next time period. To be certain, the time period from 4:00 p.m. to 5:00 p.m. was analyzed in detail. During this hour, there is unused departure or arrival capacity, allowing an impacted operation to make use of the unutilized capacity. The IFR 15-minute counts show that there is insufficient capacity within a one hour period to eliminate delays during IFR conditions (see Exhibit 5-12). Due to the insufficient capacity, delays would continue throughout the day, without the ability to recover to a point where delays are eliminated. Exhibit 5-11: 15-Minute Visual Flight Rules Counts / 30 Airport Arrival Rate NOTE: The box illustrated indicates the 30 AAR broken down in to 15 minute segments. SOURCE: Federal Aviation Administration, Aviation System Performance Metrics, October PREPARED BY: Ricondo & Associates, Inc., November Sensitivity Analysis [5-12]


116 Exhibit 5-12: 15-Minute Instrument Flight Rules Counts / 20 Airport Arrival Rate NOTE: The box illustrated indicates the 20 AAR broken down in to 15 minute segments. SOURCE: Federal Aviation Administration, Aviation System Performance Metrics, October PREPARED BY: Ricondo & Associates, Inc., November in Section QUALITATIVE AND QUANTITATIVE ANALYSES FINDINGS Through quantitative and qualitative analyses, it was determined that in 2020 there is sufficient capacity during visual meteorological conditions (VMC) to accommodate anticipated demand, with minor delays on a singlerunway airfield. However, during IMC, there is insufficient capacity to accommodate anticipated demand. During the reconstruction of Runway 13R-31L, the Air Traffic Control System Command Center (ATCSCC), with the cooperation of air carriers and GA operators, will need to enact a ground-delay program for arrivals during IMC conditions. Demand management strategies will also be required. In order to accommodate additional demand, alternatives were developed (described in Section 5.3). A preferred airfield alternative to provide additional capacity for near-term and ultimate conditions is identified Sensitivity Analysis [5-13]


117 5.3 Alternative Development and Alternatives Workshop The analyses identified that additional capacity must be provided on the east airfield prior to the reconstruction of Runway 13R-31L. Therefore, alternatives were developed, which are identified in the following subsections ALTERNATIVES DEVELOPMENT The 2015 MPU alternatives addressed airfield geometry that was inconsistent with current FAA design standards. Since capacity was not identified as a challenge over the planning horizon, the MPU did not seek to optimize the airfield capacity. The alternatives presented in the MPU utilized existing infrastructure where possible to create more cost-effective alternatives, while minimizing disruption during implementation. The Sensitivity Analysis alternatives identified the potential for capacity gains on the east airfield to accommodate the additional aircraft at the time of the Runway 13R-31L reconstruction Alternative A: No Action Alternative A is a no-action alternative. This eliminates the January 201 construction and design projects and simply leaves the December 2016 airfield (see Exhibit 5-13). The following are advantages and disadvantages for Alternative A. Exhibit 5-13: Alternative A No Action SOURCES: City of Dallas, November 2016: Ricondo & Associates, Inc., November PREPARED BY: Ricondo & Associates, Inc., December 201. Sensitivity Analysis [5-14]


118 ADVANTAGES Requires minimal investment. DISADVANTAGES Operations would be limited in the current configuration as Runway 13R-31L would not be able to be used for an extended period of time due to the pavement condition. The limited operational capability of a single runway airfield would translate into capacity constraints and aircraft delays. The 2015 pavement analysis indicated that there was other deteriorating pavement on the airfield, which this alternative does not address Alternative B: January 201 Construction and Design Projects to be Completed Prior to 2020 Alternative B utilized the existing January 201 construction and design projects, assuming these to be completed prior to 2020 (see Exhibit 5-14). The following are advantages and disadvantages for Alternative B. Exhibit 5-14: Alternative B January 201 Construction and Design Projects and Projects Complete Prior to 2020 SOURCES: City of Dallas, November 2016: Ricondo & Associates, Inc., November PREPARED BY: Ricondo & Associates, Inc., December 201. Sensitivity Analysis [5-15]
119 ADVANTAGES Taxiway M extension supports operational efficiency. Addresses deteriorating pavement. DISADVANTAGES Establishes single perpendicular runway crossings outside the high-energy portion. Provides a connector on the Runway 13L end to help with constructability and operational efficiency during the Runway 13R-31L construction. It is inconsistent with the MPU or Airport Layout Plan (ALP) submittal; therefore, it may not be eligible to receive Passenger Facility Charge (PFC) funding for the projects. 9 Does not fully leverage existing airfield infrastructure. Runway occupancy does not warrant high-speed exits; therefore, the new configuration of Taxiways B1 and B2 is not necessary when accommodating the new FAA design standard to remove 3-node intersections. The alternative does not mitigate direct connections between apron and runways. The configuration eliminates exit Taxiway B4 that is currently utilized by aircraft landing on Runway 13L Alternative C: Existing Conditions (December 2016) and MPU Alternatives This alternative assumes that the January 201 design and construction projects are not completed, and the existing conditions, as of December 2016, remain. In addition, the MPU alternatives for the east airfield are added to this alternative, noting both a near-term and a long-term alternative (see Exhibit 5-15). The following are advantages and disadvantages for Alternative C. ADVANTAGES Provides operational efficiency for a single-runway operation. Maximizes the efficiency of investment (leverages existing infrastructure). Generally consistent with ultimate development provided in MPU/ALP. Eliminates nonperpendicular taxiway crossings. Establishes two perpendicular crossings outside the high-energy portion. 9 This comment assumed that the PFC application was already submitted and that some construction may be grant-funded. However, the PFC application for these projects has not been submitted and only the design of the Runway Incursion Mitigation (RIM) project and the decoupling of Runway are grant-funded. Sensitivity Analysis [5-16]
.")

120 Exhibit 5-15: Alternative C Existing Conditions (December 2016) and MPU Alternatives SOURCES: City of Dallas, November 2016: Ricondo & Associates, Inc., November PREPARED BY: Ricondo & Associates, Inc., December 201. DISADVANTGES Not consistent with January 201 construction plan. The single taxiway crossing is within the high-energy portion of the runway (by 285 feet). This was further investigated with FAA headquarters after the meeting, and new findings indicate that this alignment would not need a Modification to Standards (MOS) should the taxiway be a 90-degree angle from the Runway 13L-31R centerline Alternative D: Integration of January 201 Construction and Design Projects and MPU Alternatives Alternative D is a combination of the January 201 construction and design projects with the MPU alternatives (see Exhibit 5-16). The following are advantages and disadvantages for Alternative D. Sensitivity Analysis [5-1]


121 Exhibit 5-16: Alternative D Existing Conditions including 01/201 Construction Projects and MPU Alternatives SOURCES: City of Dallas, November 2016: Ricondo & Associates, Inc., November PREPARED BY: Ricondo & Associates, Inc., December 201. ADVANTAGES Provides operational efficiency for a single-runway operation. Addresses deteriorating pavement. Eliminates nonperpendicular taxiway crossings on Runway 13L-31R. 10 Establishes three perpendicular crossings outside the high-energy portion. DISADVANTAGES There are modifications to the January 201 design. Not consistent with ultimate development provided in the MPU/ALP. 10 Taxiway B3 as a perpendicular taxiway would not require an MOS; it is considered to be acceptable according to FAA Headquarters meeting) (determined after the Sensitivity Analysis [5-18]


122 5.3.2 ALTERNATIVES WORKSHOP AND PREFERRED AIRFIELD ALTERNATIVE The purpose of the Alternatives Workshop was to conduct an open forum to gain a consensus of the ultimate airfield layout for DAL, a preferred alternative, while taking into consideration the need for the operational efficiency of a single-runway operation as early as The advantages and disadvantages of each of the four alternatives were discussed and vetted with key Airport stakeholders. The preferred alternative was selected based on the need to address FAA standards, the life of existing pavement, and capacity improvements needed to accommodate the reconstruction of Runway 13R-31L, as well as any enabling projects. Exhibit 5-1 presents an illustration of the preferred alternative. After discussion of the four alternatives, it was determined that not one of the alternatives was preferred; rather, a combination of elements from Alternative B and Alternative D was preferred. Table 5-2 lists the airfield elements that were carried forward to create operational efficiency on the east airfield during Runway 13R-31L reconstruction. The preferred pre Runway 13R-31L reconstruction alternative was then integrated into an ultimate airfield layout that is shown in Section 6.4. Exhibit 5-1: Preferred Airfield Alternative Pre-Runway 13R-31L Reconstruction (FY 2020) SOURCES: City of Dallas, November 2016: Ricondo & Associates, Inc., November PREPARED BY: Ricondo & Associates, Inc., March 201. Sensitivity Analysis [5-19]
123 Table 5-2: Preferred Airfield Alternative AIRFIELD ELEMENT Construct Taxiway M from the Runway 13L end to Taxiway D (or at a minimum to the Runway18-36/Taxiway E intersection per the 01/201 Garver design). Include the relocation of the Runway 13L glideslope. Reconstruct Taxiway B at the Runway 13L end per the 01/201 Garver design, improving constructability and operational efficiency during construction. Reconstruct Taxiway D per the 2015 Master Plan Update. Represent a straightened Taxiway D for the ultimate configuration. Demolish Taxiways B5 and B6 in the ultimate configuration. Reconfigure Taxiways B1 and B2 per the 2015 Master Plan Update. Reconstruct Taxiway M from the Taxiway B1 intersection to the Runway 31R end. This will require the relocation of the Runway 31R glideslope (which is currently under design contract). Reconstruct Taxiway B for areas not included in proposed design packages. The 2015 Pavement Evaluation Report indicates a need for Taxiway B rehabilitation/reconstruction in the near-term with a single-runway operation. Construct Taxiway T in line with the existing Taxiway A2 and demolish Taxiways B3 and B4. 1/ NOTE: 1/ This option was not decided at the December meeting. Under further evaluation of costs and future implications of design, the option was decided upon by DoA in February 201. SOURCE: Airfield Alternatives Workshop, December 14, PREPARED BY: Ricondo & Associates, Inc., December Sensitivity Analysis [5-20]
124 6. Conclusion In summary, this Sensitivity Analysis encompassed the overall impacts brought upon DAL by the repeal of the Wright Amendment, as well as the operations of the airline gates, which were not covered in the original MPU (initiated in 2012, completed in 2015). The results of the sensitivity analyses, presented in this report, more accurately represent capacity requirements for landside and terminal facilities due to the increased passenger growth at the Airport as well as airfield capacity needs to address deteriorating pavement and accommodate activity with a single operating runway during reconstruction of Runway 13R-31. The following sections review the key elements presented throughout this report and highlight key comparisons between the requirements shown in the original MPU and those in this Sensitivity Analysis. 6.1 Forecast Overview The forecasts presented in this report were developed to test the sensitivities of Airport facilities. Passenger airline DDFSs for the years 2015, 2024, and 2032 were reviewed and analyzed; Tables 2-1 thorough 2-3 display the results of the baseline DDFSs for passenger airlines and review peak load factors and other important information. As mentioned in Section 2, the forecasts in the MPU were based on the previous operations at the Airport (prior to the expiration of the Wright Amendment); the growth in enplaned passengers was dependent on increased operations and fleet size (see Table 2-9 and Exhibit 2-5 for illustrations and data on the forecast comparisons). The forecasts showed an increase to 6.3 million enplaned passengers in 2016 and nearly.0 million enplaned passengers in Since the MPU was developed, the Airport has experienced a more pronounced increase in enplaned passengers than that forecast in the MPU, due to the operations that are currently being conducted by the airlines operating at DAL. In 2015 alone, the actual number of enplaned passengers approached the MPU s 2032 forecast at nearly.0 million enplaned passengers. This increase in enplaned passengers is expected to either hold steady or continue to increase. Both the baseline sensitivity analysis and the high growth scenario forecasts showed a rise of nearly 1 million enplaned passengers from 2015 to 2016, reflecting the 2016 forecasts in the range of.8-.9 million enplaned passengers. This trend begins to dip down, holding near the.8 million enplaned passengers range until close to 2032, in which 8 million enplaned passengers are again reached. Table 6-1 displays the variances of enplaned passengers between the MPU forecast and the sensitivity forecast. Sensitivity Analysis [6-1]
125 Table 6-1: Forecast Variance Enplaned Passengers FISCAL YEAR MPU FORECAST SENSITIVITY ANALYSIS BASELINE FORECAST FORECAST VARIANCE / 4,234,853 4,35, % Forecast ,11,153 6,89, % ,303,640,85, % 201 6,405,65,8, % ,502,92,26, % ,602,48,83, % ,63,39,859, % ,655,55,863, % ,681,04,85,89 1.9% 202 6,818,534,940, % ,981,51 8,004, % Average Variance from MPU Forecast 16.% NOTES: For fiscal years ended September 30. 1/ Represents data from MPU forecast and actual data for high growth scenario and low growth scenario forecasts. following sections. 2/ Years are only shown in 5 year increments due to the small year-to-year variation. SOURCES: City of Dallas Aviation Department; Innovata, October 201; Ricondo & Associates, Inc., October PREPARED BY: Ricondo & Associates, Inc., October As shown through the variance in forecasts, it was necessary to revisit the demand/capacity analysis in the MPU for facilities that would be affected by these increases. A summary reviewing the similarities and differences between the MPU (2015) and the Sensitivity Analysis, as well as an overview of key points, is presented in the Sensitivity Analysis [6-2]
126 6.2 Landside Facilities Overview Comparisons of landside facility requirements presented in the MPU (2015) and the Sensitivity Analysis are explained in the following subsections AIRPORT PARKING FACILITY REQUIREMENTS The MPU parking calculations are forecast at million enplaned passengers (which represents year 2032). Table 6-2 displays the difference in space requirements from the 2032 MPU forecast to the 2024 and 2032 Sensitivity Analysis baseline forecasts. It should be noted that the Sensitivity Analysis calculations exceed the 2032 MPU calculations in The demand for parking in 2032 grew from just over 8,500 spaces in the MPU forecast to approximately 9,410 on the peak day in the 2032 baseline forecast for the Sensitivity Analysis. This demand could be accommodated in Garages A, B, and C throughout the planning horizon. FORECAST Table 6-2: Forecast Parking Requirements MILLION ANNUAL ENPLANEMENTS ORIGINATING PASSENGERS SPACES NEEDED PEAK DAY SPACES NEEDED MPU 2032).0 million 4.5 million 8,520 8,900 Sensitivity Analysis Baseline million 3.9 million 6,540 6,860 Sensitivity Analysis Baseline million 4.8 million 8,140 8,530 Sensitivity Analysis Baseline million 5.3 million 8,960 9,410 NOTE: Enplaned passengers and originating passengers based on fiscal years ending September 30. SOURCE: Ricondo & Associates, Inc., October PREPARED BY: Ricondo & Associates, Inc., October AIRPORT ACCESS On-Airport roadways experience some demand changes due to the improvements noted in Section This includes the opening of public parking Garage C, reallocation of the cell phone lot, inbound Herb Kelleher Way improvements, outbound Herb Kelleher Way improvements, and the relocation of the rental car companies to a Consolidated Rental Car Facility. LOS C is considered the trigger point in which improvement planning should begin to occur. As compared to the MPU, once Garage C opens and parking demand is diverted to the new garage, the LOS increases for some roadway links located on Airport roadways. There are a few other on-airport roadways that meet LOS D, E, and F during the planning horizon. These can be found in Table 3-6. Sensitivity Analysis [6-3]
127 The intersection at Herb Kelleher Way and Hawes Avenue also has a LOS D or below in the baseline Sensitivity Analysis forecast and is currently in need of improvements. Table 6-3 displays the difference in the off-airport intersection LOS (for both the a.m. and the p.m. peaks) between the MPU 2032 forecast and the Sensitivity Analysis baseline forecast. INTERSECTION Table 6-3: Intersection Level of Service Comparison Table (MPU vs Baseline Sensitivity Forecast) 2032 A.M. MPU (LOS) 2032 P.M. MPU (LOS) 2015 A.M. SENSITIVITY ANALYSIS (LOS) 2015 P.M. SENSITIVITY ANALYSIS (LOS) 2024 A.M. SENSITIVITY ANALYSIS (LOS) 2024 P.M. SENSITIVITY ANALYSIS (LOS) 2032 A.M. SENSITIVITY ANALYSIS (LOS) 2032 P.M. SENSITIVITY ANALYSIS (LOS) Lemmon Avenue and Airdrome Drive C C C C C D C F Lemmon Avenue and Mockingbird Lane C C D C E D F F Airdrome Drive and Mockingbird Lane B C B B B C B C Herb Kelleher Way/Cedar Springs Road and Mockingbird Lane F F F E F F F F Mockingbird Lane and Denton Drive E E C D F F F F NOTE: All years are in fiscal year ending September 30. SOURCE: Ricondo & Associates, Inc., MPU, PREPARED BY: Ricondo & Associates, Inc., October As indicated in Table 6-3, the LOS in the Sensitivity Analysis baseline scenario for all intersections other than Airdrome Drive and Mockingbird Lane experience LOS C or poorer for both a.m. and p.m. peaks. This LOS continues to decline reaching LOS C or worse for all intersections in the p.m. peak for the 2024 forecast. In 2032, LOS F is reached in the p.m. peak hour at all intersections other than Airdrome Drive/Mockingbird Lane. Improvements need to be implemented at these intersections in order to mitigate congestion on the off-airport roadways. For the on-airport Roadways, other than a few LOS D roadway links, the entrance to Garage A and Garage B was the only reported LOS E. LOS E is reached at this link by 2024 and continues through 2032 at this level. Sensitivity Analysis [6-4]
128 6.2.3 CURBSIDE As described, the terminal curbside allocations have changed to accommodate the operation of TNCs. In addition, new curbside classification data were collected, which generated different results that are presented in Table 6-4. Table 6-4 displays the difference in the LOS for the curbside allocations between the MPU and the Sensitivity Analysis baseline forecast. Table 6-4: Curbside Allocations Comparison Table MPU 2032 A.M. (LOS) MPU 2032 P.M. (LOS) SENSITIVITY ANALYSIS 2015 A.M. (LOS) SENSITIVITY ANALYSIS 2015 P.M. (LOS) 2024 A.M. (LOS) 2024 P.M. (LOS) 2032 A.M. (LOS) Enplaned Passengers.0 million 6.8 million 8.0 million 8.2 million Upper Level Arrivals Curb LOS F F A C A D A D Upper Level Departures Curb LOS F F C E D E D E Lower Level Curb (All Areas Combined) LOS A A A A A A A A NOTE: All years are in fiscal year ending September 30. SOURCE: Ricondo & Associates, Inc., MPU, PREPARED BY: Ricondo & Associates, Inc., October P.M. (LOS) Table 6-4 shows the MPU curbside LOS has been improved based on recent trends noted in the new classification data. However, even with the new consumer trends at the curbfront, LOS E is reached in the baseline scenario in 2015 for the p.m. peak on the upper level departures roadway. Both the arrivals area and departures area of the upper level curb experience LOS D or below in 2024 and beyond; therefore, improvements for this area should be identified. (Congestion is due to a shortage in curbside length, not throughput capacity of by-pass lanes) RENTAL CAR There is an existing need for rental car facilities at the Airport. In 2032 the space requirement to accommodate these needs would be between acres. This remains the same in both the MPU and the Sensitivity Analysis. This need will be accommodated in a Rental Car Facility, which is currently in the preliminary planning stages. Sensitivity Analysis [6-5]
129 6.3 Terminal Facilities Overview During the creation of the MPU, the terminal facility requirements were not analyzed due to the LFMP being underway. However, the Sensitivity Analysis did review and analyze the existing and future requirements for the major components of the terminal CHECK-IN The terminal inventory of check-in positions indicated adequate capacity to support the baseline and high growth scenario DDFS activity levels; however, additional kiosks would be needed. By 2032, the baseline forecast suggests that the peak-hour check-in demand will be approximately 1,830 passengers, with the peakhour originating passengers being approximately 2, PASSENGER SECURITY SCREENING CHECKPOINT Computer modeling was used to determine the number of security screening lanes needed to maintain LOS C for security wait times and to estimate the number of passengers waiting in queue. The terminal s existing number of security screening lanes should provide adequate capacity to support the baseline forecast activity levels. By 2032, the baseline forecast suggests that the peak-hour checkpoint demand will be approximately 2,30 passengers, with the peak-hour originating passengers being approximately 2, HOLDROOMS Holdroom requirements change due to the size of aircraft operating at the gate. The existing square footage is adequate to support the baseline forecast requirements for low-range aircraft (B3-00) through However, the existing space available is insufficient for the baseline forecast requirements for high-range aircraft (B3-800). These requirements show a need of approximately 55,650 square feet in 2024 and 2032, equating to roughly an additional 6,000 square-feet over existing conditions. The high growth forecast requires nearly 2,000 square feet of additional space in both 2024 and 2032 to support the low-range aircraft. The 2024 and 2032 high growth forecast requirement surges to over 10,000 additional square feet for high-range aircraft OUTBOUND BAGGAGE MAKEUP By 2032, the baseline forecast estimates that the peak 10-minute flights in makeup will reach 38, while the cart requirement will reach approximately 90. The current baggage makeup area provides adequate capacity to support these requirements BAG CLAIM In 2024, the baseline requirements will reach approximately 21,900 square feet. This would require an additional bag claim device to support the forecast enplanements. By 2032, the baseline forecast suggests that the total bag claim area requirement will reach approximately 26,250 square feet. This would require an additional two bag-claim devices. Sensitivity Analysis [6-6]

130 6.4 Airfield Facilities Overview The airfield facilities were assessed due to the need to reconstruct Runway 13R-31L in the near future. Through qualitative and quantitative analyses, it was determined that improvements would need to be completed on the east airfield to accommodate demand during the Runway 13R-31L reconstruction period. The impacts occurring during poor weather conditions, requiring ILS areas to be protected, reduce the capacity of the Airport to lowerthan-required levels during these events. Improvements in taxiways and NAVAID locations have allowed the Airport to operate at acceptable levels during low visibility or ceilings. The sequencing of aircraft in all weather conditions became necessary to maximize the throughput of the Airport. Even in good weather, the tower must have the ability to change the sequence of departure aircraft near the approach end of the departure runway in order to maximize the throughput of the Airport during construction periods. Exhibit 5-1 noted the significant changes necessary to accommodate all of the Airport operations during the reconstruction period. The major component of the preferred near-term airfield alternative is the construction of Taxiway M from the Runway 13L end to Taxiway D and the reconstruction of Taxiway M from the Taxiway B1 intersection to the Runway 31R end, after which additional aircraft can be accommodated. Exhibit 6-1 illustrates how those changes are incorporated into the ultimate airfield layout. Exhibit 6-1: Preferred Airfield Alternative Ultimate Conditions SOURCES: City of Dallas, November 2016: Ricondo & Associates, Inc., November PREPARED BY: Ricondo & Associates, Inc., March 201.r Sensitivity Analysis [6-]
Forecast and Overview
 Forecast and Overview DENVER INTERNATIONAL AIRPORT Overall goals of the (MPR): Work with DEN to refine the preferred airport development plan to guide the development over an approximate 25-year planning
3. Aviation Activity Forecasts
 3. Aviation Activity Forecasts This section presents forecasts of aviation activity for the Airport through 2029. Forecasts were developed for enplaned passengers, air carrier and regional/commuter airline
Time-series methodologies Market share methodologies Socioeconomic methodologies
 This Chapter features aviation activity forecasts for the Asheville Regional Airport (Airport) over a next 20- year planning horizon. Aviation demand forecasts are an important step in the master planning
MASTER PLAN UPDATE GRANT NUMBER
 T MASTER PLAN UPDATE D R AF GRANT NUMBER 3-48-0062-42 MAY 2015 1. Introduction... 1-1 1.1 History of Dallas Love Field... 1-1 1.2 Airport Setting... 1-2 1.2.1 DALLAS-FORT WORTH-ARLINGTON METROPOLITAN STATISTICAL
Appendix B Ultimate Airport Capacity and Delay Simulation Modeling Analysis
 Appendix B ULTIMATE AIRPORT CAPACITY & DELAY SIMULATION MODELING ANALYSIS B TABLE OF CONTENTS EXHIBITS TABLES B.1 Introduction... 1 B.2 Simulation Modeling Assumption and Methodology... 4 B.2.1 Runway
FORECASTING FUTURE ACTIVITY
 EXECUTIVE SUMMARY The Eagle County Regional Airport (EGE) is known as a gateway into the heart of the Colorado Rocky Mountains, providing access to some of the nation s top ski resort towns (Vail, Beaver
1.0 Project Background Mission Statement and Goals Objectives of this Sustainable Master Plan
 TABLE OF CONTENTS CHAPTER 1 INTRODUCTION 10 Project Background 1-1 11 Mission Statement and Goals 1-1 12 Objectives of this Sustainable Master Plan 1-2 CHAPTER 2 INVENTORY 20 Airport Background 2-1 201
FORT LAUDERDALE-HOLLYWOOD INTERNATIONAL AIRPORT ENVIRONMENTAL IMPACT STATEMENT DRAFT
 D.3 RUNWAY LENGTH ANALYSIS Appendix D Purpose and Need THIS PAGE INTENTIONALLY LEFT BLANK Appendix D Purpose and Need APPENDIX D.3 AIRFIELD GEOMETRIC REQUIREMENTS This information provided in this appendix
Planning, Development and Environment Committee
 Page 1 of 7 MEMORANDUM TO: Planning, Development and Environment Committee FROM: Neil Ralston, Airport Planner Airport Development (726-8129) SUBJECT: 2035 MSP LONG TERM COMPREHENSIVE PLAN FORECAST, FACILITY
According to FAA Advisory Circular 150/5060-5, Airport Capacity and Delay, the elements that affect airfield capacity include:
 4.1 INTRODUCTION The previous chapters have described the existing facilities and provided planning guidelines as well as a forecast of demand for aviation activity at North Perry Airport. The demand/capacity
SAN JOSÉ INTERNATIONAL AIRPORT
 SAN JOSÉ INTERNATIONAL AIRPORT NEAR-TERM TERMINAL CAPACITY ANALYSIS AIRPORT COMMISSION AUGUST 14, 2017 August 14, 2017 AGENDA 1. Forecast Review (with 14 MAP High Case) 2. Gate Requirements and Aircraft
MASTER PLAN GEORGE BUSH INTERCONTINENTAL AIRPORT/HOUSTON. Houston Airport System Houston, Texas DRAFT TECHNICAL REPORT.
 in association with AirProjects Inc. Conway Consulting Gunda Corporation Quadrant Consultants RdlR Architects Sunland Group DRAFT TECHNICAL REPORT MASTER PLAN Prepared for Houston Airport System Houston,
Study Design Outline. Background. Overview. Desired Study Outcomes. Study Approach. Goals (preliminary) Recession History
 Recession History") MIA BASELINE ACTIVITY FORECASTS, DERIVATIVE DATA AND FLEET MIX PROJECTIONS RESULTS SUMMARY ACCEPTANCE BRIEFING FOR THE AIRPORT AND SEAPORT COMMITTEE (ASC) JULY 15, 2010 Study Design Outline Background
MIA BASELINE ACTIVITY FORECASTS, DERIVATIVE DATA AND FLEET MIX PROJECTIONS RESULTS SUMMARY ACCEPTANCE BRIEFING FOR THE AIRPORT AND SEAPORT COMMITTEE (ASC) JULY 15, 2010 Study Design Outline Background
CHAPTER 4 DEMAND/CAPACITY ANALYSIS
 CHAPTER DEMAND/CAPACITY ANALYSIS INTRODUCTION The demand/capacity analysis examines the capability of the airfield system at Blue Grass Airport (LEX) to address existing levels of activity as well as determine
The forecasts evaluated in this appendix are prepared for based aircraft, general aviation, military and overall activity.
 Chapter 3: Forecast Introduction Forecasting provides an airport with a general idea of the magnitude of growth, as well as fluctuations in activity anticipated, over a 20-year forecast period. Forecasting
AIRPORT MASTER PLAN UPDATE
 AIRPORT MASTER PLAN UPDATE PENSACOLA INTERNATIONAL AIRPORT Technical Advisory Committee Meeting #2 June 20, 2017 Agenda» Introduction» Facility Requirements Airside Terminal Landside General Aviation Cargo
November 2013 Passenger and Cargo Traffic Statistics Reno-Tahoe International Airport
 November 2013 Passenger and Cargo Traffic Statistics Reno-Tahoe International Airport December 26, 2013 U.S. DOMESTIC INDUSTRY OVERVIEW FOR NOVEMBER 2013 All RNO Carriers Domestic Systemwide year over
Table of Contents. Master Plan March 2014 TOC i Spokane International Airport
 Table of Contents Page Chapter 1 Inventory 1. Introduction... 1 1 1.1 Community Profile... 1 2 1.1.1 Location and Setting... 1 1 1.1.2 Climate... 1 2 1.1.3 Socioeconomic Conditions... 1 5 1.1.4 Area Land
Regional Jets ,360 A319/ , , , ,780
 Excel Tab Name: Seats (18 MAP) PASSENGER AIRLINE FLIGHT SCHEDULE CALCULATION RECORD Summary 17.2 MAP flight schedule* (with Southwest Airlines B737-800s changed to B737-700s) Number of Total Seats Avg.
Greater Orlando Aviation Authority Orlando International Airport One Jeff Fuqua Boulevard Orlando, Florida Memorandum TO: FROM:
 Greater Orlando Aviation Authority One Jeff Fuqua Boulevard Orlando, Florida 32827-4399 Memorandum TO: FROM: Participating Airlines Phil Brown, Executive Director DATE: SUBJECT: Rate Methodology for FY
EXHIBIT E to Signatory Airline Agreement for Palm Beach International Airport RATE AND FEE SCHEDULE
 EXHIBIT E to Signatory Airline Agreement for Palm Beach International Airport RATE AND FEE SCHEDULE SECTION I - DEFINITIONS The following words, terms and phrases used in this Exhibit E shall have the
Airport Preliminary Master Plan Workshop Board of County Commissioners April 18, 2017
 Airport Preliminary Master Plan Workshop Board of County Commissioners April 18, 2017 (PRELIMINARY DRAFT) WORK IN PROGRESS - FOR DISCUSSION PURPOSES ONLY Agenda (PRELIMINARY DRAFT) WORK IN PROGRESS - FOR
FLL Master Plan Update Technical Advisory Committee (TAC) Briefing #1. September 28, 2016
 Briefing #1. September 28, 2016") FLL Master Plan Update Technical Advisory Committee (TAC) Briefing #1 September 28, 2016 TAC Committee Role: Internal Stakeholders To provide input on the master planning analysis from the technical and
FLL Master Plan Update Technical Advisory Committee (TAC) Briefing #1 September 28, 2016 TAC Committee Role: Internal Stakeholders To provide input on the master planning analysis from the technical and
Westover Metropolitan Airport Master Plan Update
 Westover Metropolitan Airport Master Plan Update June 2008 INTRODUCTION Westover Metropolitan Airport (CEF) comprises the civilian portion of a joint-use facility located in Chicopee, Massachusetts. The
FLL Master Plan Update Policy Advisory Committee (PAC) Briefing #2 July 10, 2017
 Briefing #2 July 10, 2017") FLL Master Plan Update Policy Advisory Committee (PAC) Briefing #2 July 10, 2017 (PRELIMINARY DRAFT) WORK IN PROGRESS - FOR DISCUSSION PURPOSES ONLY PAC Committee (PRELIMINARY DRAFT) WORK IN PROGRESS -
FLL Master Plan Update Policy Advisory Committee (PAC) Briefing #2 July 10, 2017 (PRELIMINARY DRAFT) WORK IN PROGRESS - FOR DISCUSSION PURPOSES ONLY PAC Committee (PRELIMINARY DRAFT) WORK IN PROGRESS -
Washington Dulles International Airport (IAD) Aircraft Noise Contour Map Update
 Aircraft Noise Contour Map Update") Washington Dulles International Airport (IAD) Aircraft Noise Contour Map Update Ultimate ASV, Runway Use and Flight Tracks 4th Working Group Briefing 8/13/18 Meeting Purpose Discuss Public Workshop input
Washington Dulles International Airport (IAD) Aircraft Noise Contour Map Update Ultimate ASV, Runway Use and Flight Tracks 4th Working Group Briefing 8/13/18 Meeting Purpose Discuss Public Workshop input
October 2013 Passenger and Cargo Traffic Statistics Reno-Tahoe International Airport
 October 2013 Passenger and Cargo Traffic Statistics Reno-Tahoe International Airport December 4, 2013 U.S. DOMESTIC INDUSTRY OVERVIEW FOR OCTOBER 2013 All RNO Carriers Systemwide year over year comparison
Executive Summary. MASTER PLAN UPDATE Fort Collins-Loveland Municipal Airport
 Executive Summary MASTER PLAN UPDATE Fort Collins-Loveland Municipal Airport As a general aviation and commercial service airport, Fort Collins- Loveland Municipal Airport serves as an important niche
Welcome to the Boise Airport Master Plan Update Open House
 Welcome to the Boise Airport Master Plan Update Open House Get the facts and sign up for the Master Plan Update newsletter at http://www.iflyboise.com/about-boi/master-plan/ What does the Master Plan Update
RSAT RUNUP ANALYSIS 1. INTRODUCTION 2. METHODOLOGY
 RSAT RUNUP ANALYSIS 1. INTRODUCTION The FAA Runway Safety Action Team (RSAT) is a team of FAA staff that works with airports to address existing and potential runway safety problems and issues. The RSAT
TABLE OF CONTENTS. Washington Aviation System Plan Update July 2017 i
 TABLE OF CONTENTS Chapter 1 Overview... 1-1 1.1 Background... 1-1 1.2 Overview of 2015 WASP... 1-1 1.2.1 Aviation System Performance... 1-2 1.3 Prior WSDOT Aviation Planning Studies... 1-3 1.3.1 2009 Long-Term
 Existing Conditions AIRPORT PROFILE Passenger Terminal Complex 57 air carrier gates 11,500 structured parking stalls Airfield Operations Area 9,000 North Runway 9L-27R 6,905 Crosswind Runway 13-31 5,276
 AGENDA REPORT Ordinance: Approval of Proposed Fiscal Year 2017-18 Airline Landing Fee Rates, Terminal Space Rental Rates, and Other Fees, and Amendment and Restatement of Port Ordinance No. 3634. (Aviation)
DEVELOPMENT OF TOE MIDFIELD TERMINAL IROJECT CAPACITY ENHANCEMENT REPORT DEPARTMENT OF AVIATION TOM FOERSTER CHAIRMAN BARBARA HAFER COMMISSIONER
 PETE FLAHERTY COMMISSIONER TOM FOERSTER CHAIRMAN DEPARTMENT OF AVIATION BARBARA HAFER COMMISSIONER STEPHEN A. GEORGE DIRECTOR ROOM M 134, TERMINAL BUILDING GREATER PITTSBURGH INTERNATIONAL AIRPORT PITTSBURGH,
Amended & Restated Lease of Terminal Building Premises (Airport Use & Lease Agreement)
") Amended & Restated Lease of Terminal Building Premises (Airport Use & Lease Agreement) Briefing to the Transportation and Environment Committee Department of Aviation October 27, 2008 Purpose Review 5-Party
Amended & Restated Lease of Terminal Building Premises (Airport Use & Lease Agreement) Briefing to the Transportation and Environment Committee Department of Aviation October 27, 2008 Purpose Review 5-Party
SECTION 3 AVIATION ACTIVITY FORECASTS
 SECTION 3 AVIATION ACTIVITY FORECASTS 3.1 INTRODUCTION Projecting future aviation demand is a critical element in the overall master planning process. The activity forecasts developed in this section are
Fort Wayne International Airport Master Plan Study. Executive Summary
 Fort Wayne International Airport Master Plan Study Executive Summary March 2012 Introduction Airport Background Forecast of Aviation Activity Development Plans Recommended Airfield & Access Development
TABLE OF CONTENTS. General Study Objectives Public Involvement Issues to Be Resolved
 TABLE OF CONTENTS Description Page Number LIST OF ACRONYMS... a CHAPTER ONE INTRODUCTION General... 1-1 Study Objectives... 1-1 Public Involvement... 1-2 Issues to Be Resolved... 1-2 CHAPTER TWO EXISTING
Forecast of Aviation Activity
 DETROIT METROPOLITAN WAYNE COUNTY AIRPORT FAR PART 150 NOISE COMPATIBILITY STUDY UPDATE CHAPTER B FORECAST OF AVIATION ACTIVITY Forecast of Aviation Activity Introduction This chapter summarizes past aviation
Master Plan Phase 2 Workshop
 Master Plan Phase 2 Workshop Tampa Airport: A Legacy of Innovation and Convenience Tampa Airport: A legacy of Innovation and Convenience The world s first airport people mover Tampa Airport: A legacy of
SAMTRANS TITLE VI STANDARDS AND POLICIES
 SAMTRANS TITLE VI STANDARDS AND POLICIES Adopted March 13, 2013 Federal Title VI requirements of the Civil Rights Act of 1964 were recently updated by the Federal Transit Administration (FTA) and now require
Memorandum. Roger Millar, Secretary of Transportation. Date: April 5, Interstate 90 Operations and Mercer Island Mobility
 Memorandum To: From: The Honorable Dow Constantine, King County Executive; The Honorable Ed Murray, City of Seattle Mayor; The Honorable Bruce Bassett, City of Mercer Island Mayor; The Honorable John Stokes,
APPENDIX D MSP Airfield Simulation Analysis
 APPENDIX D MSP Airfield Simulation Analysis This page is left intentionally blank. MSP Airfield Simulation Analysis Technical Report Prepared by: HNTB November 2011 2020 Improvements Environmental Assessment/
ACI-NA BUSINESS TERM SURVEY APRIL 2017
 ACI-NA BUSINESS TERM SURVEY APRIL 2017 Airport/Airline Business Working Group Randy Bush Tatiana Starostina Dafang Wu Assisted by Professor Jonathan Williams, UNC Agenda Background Rates and Charges Methodology
The purpose of this Demand/Capacity. The airfield configuration for SPG. Methods for determining airport AIRPORT DEMAND CAPACITY. Runway Configuration
 Chapter 4 Page 65 AIRPORT DEMAND CAPACITY The purpose of this Demand/Capacity Analysis is to examine the capability of the Albert Whitted Airport (SPG) to meet the needs of its users. In doing so, this
SouthwestFloridaInternational Airport
 SouthwestFloridaInternational Airport SouthwestFloridaInternationalAirportislocatedinLee CountyalongtheGulfCoastofSouthFlorida,tenmiles southeastofthefortmyerscentralbusinessdistrict. Theprimaryhighwayaccesstotheairportfrom
BNA Master Plan Update Public Meeting No. 2
 A Six Sigma Organization BNA Master Plan Update Public Meeting No. 2 September 18, 2012 Agenda BNA Master Plan Update Consultants Status of the BNA Master Plan Update Workstation Boards Forecasts of Aviation
RNO Master Plan Approved Alternatives, Financial Analysis, and Facilities Implementation Plan
 RNO Master Plan Approved Alternatives, Financial Analysis, and Facilities Implementation Plan Project Schedule Today Slide 40 Project Vision To provide an achievable, flexible, fiscally, and environmentally
December 2013 Passenger and Cargo Traffic Statistics Reno-Tahoe International Airport
 December 2013 Passenger and Cargo Traffic Statistics Reno-Tahoe International Airport January 24, 2014 U.S. DOMESTIC INDUSTRY OVERVIEW FOR DECEMBER 2013 All RNO Carriers Domestic Systemwide year over year
December 2012 Passenger and Cargo Traffic Statistics Reno-Tahoe International Airport
 December 2012 Passenger and Cargo Traffic Statistics Reno-Tahoe International Airport January 29, 2013 U.S. DOMESTIC INDUSTRY OVERVIEW FOR DECEMBER 2012 All RNO Carriers Systemwide year over year comparison
September 2013 Passenger and Cargo Traffic Statistics Reno-Tahoe International Airport
 September 2013 Passenger and Cargo Traffic Statistics Reno-Tahoe International Airport October 31, 2013 U.S. DOMESTIC INDUSTRY OVERVIEW FOR SEPTEMBER 2013 All RNO Carriers Systemwide year over year comparison
PENSACOLA INTERNATIONAL AIRPORT MASTER PLAN UPDATE WORKING PAPER 3 AVIATION ACTIVITY FORECASTS NOVEMBER 2016
 PENSACOLA INTERNATIONAL AIRPORT MASTER PLAN UPDATE WORKING PAPER 3 AVIATION ACTIVITY FORECASTS NOVEMBER 2016 In association with InterVISTAS Consulting Inc. Table of Contents CHAPTER 3 AVIATION ACTIVITY
,~-- JOHN WAYNE AIRPORT, ORANGE COUNTY. Airline Competition Plan UPDATE. Barry A. Rondinella, A.A.E/C.A.E. Airport Director
 JOHN WAYNE AIRPORT, ORANGE COUNTY Airline Competition Plan UPDATE JOrNVAYN. AIRPOITT O R A N GE COU N TY,~-- Barry A. Rondinella, A.A.E/C.A.E. Airport Director 3160 Airway Avenue Costa Mesa, CA 92626 January
RENO-TAHOE INTERNATIONAL AIRPORT APRIL 2008 PASSENGER STATISTICS
 Inter-Office Memo Reno-Tahoe Airport Authority Date: June 5, 2008 To: Statistics Recipients From: Tom Medland, Director Air Service Business Development Subject: RENO-TAHOE INTERNATIONAL AIRPORT PASSENGER
EAT Master Plan Planning Advisory Committee (PAC) Meeting #2 Summary (FINAL)
 Meeting #2 Summary (FINAL)") PAC Meeting #2: November 10, 2016 Meeting Participants: Pangborn Airport: Port of Chelan County: Consultant Team: PAC Members: Trent Moyers, Tina Stadther, Ron Russ Mark Urdahl Damon Smith, Jeff Smith,
PAC Meeting #2: November 10, 2016 Meeting Participants: Pangborn Airport: Port of Chelan County: Consultant Team: PAC Members: Trent Moyers, Tina Stadther, Ron Russ Mark Urdahl Damon Smith, Jeff Smith,
Preliminary Draft Budget FY Airline Rates and Charges. Sea-Tac International Airport
 Draft Budget FY 2015 Airline Rates and Charges Sea-Tac International Airport Aviation Finance & Budget 2015 Budget Airline Rates and Charges TABLE OF CONTENTS Exhibit Contents 1 Aeronautical Revenue Summary
JOSLIN FIELD, MAGIC VALLEY REGIONAL AIRPORT DECEMBER 2012
 1. Introduction The Federal Aviation Administration (FAA) recommends that airport master plans be updated every 5 years or as necessary to keep them current. The Master Plan for Joslin Field, Magic Valley
APPENDIX E AVIATION ACTIVITY FORECASTS
 APPENDIX E AVIATION ACTIVITY FORECASTS E.1 PURPOSE AND CONTEXT This appendix presents the St. George Airport (SGU) aviation activity forecasts for the period of 2003 through 2020. Among the components
PENSACOLA INTERNATIONAL AIRPORT MASTER PLAN UPDATE AVIATION FORECAST JULY Subconsultant InterVISTAS Consulting Inc.
 PENSACOLA INTERNATIONAL AIRPORT MASTER PLAN UPDATE AVIATION FORECAST JULY 2016 Subconsultant InterVISTAS Consulting Inc. TABLE OF CONTENTS Contents 1.1 Background... 3 1.1.1 Project Introduction... 3 1.1.2
Treasure Island Supplemental Information Report Addendum
 1 1 1 1 0 1 0 1 0 1 Treasure Island Supplemental Information Report Addendum Introduction Purpose The purpose of this Supplemental Information Report (SIR) Addendum is to determine if the current land
Table of Contents. Overview Objectives Key Issues Process...1-3
 Table of Contents Chapter One Introduction Overview...1-1 Objectives...1-1 Key Issues...1-2 Process...1-3 Chapter Two Inventory of Existing Conditions Airport Setting...2-1 Locale...2-1 Airport Surroundings...2-5
Prepared By: Mead & Hunt, Inc Port Lansing Road Lansing, MI 48906
 Master Plan The preparation of this document was financed in part through a planning grant from the Federal Aviation Administration (FAA) as provided under Section 505 of the Airport and Airway Improvement
APPENDIX H 2022 BASELINE NOISE EXPOSURE CONTOUR
 APPENDIX H 2022 BASELINE NOISE EXPOSURE CONTOUR This appendix sets forth the detailed input data that was used to prepare noise exposure contours for 2022 Baseline conditions. H.1 DATA SOURCES AND ASSUMPTIONS
TRANSPORTATION RESEARCH BOARD. Preparing and Using Airport Design Day Flight Schedules. Wednesday, July 18, :00-3:30 PM ET
 TRANSPORTATION RESEARCH BOARD Preparing and Using Airport Design Day Flight Schedules Wednesday, July 18, 2018 2:00-3:30 PM ET Purpose Discuss research from the Airport Cooperative Research Program (ACRP)
FORECAST OF AVIATION DEMAND
 3 3 FORECAST OF AVIATION DEMAND 3.1 FORECASTING BACKGROUND This chapter of the Juneau International Airport (JNU) Sustainability Master Plan (SMP) presents forecasts of future aviation demand. These forecasts
Aviation Activity Forecasts
 C H A P T E R 2 Aviation Activity Forecasts 2.0 OVERVIEW This chapter contains aviation activity forecasts for Chippewa Valley Regional Airport over the 20-year planning horizon. Aviation demand forecasts
ERA Monthly Market Analysis
 ERA Monthly Market Analysis May 2016 Introduction For the production of these statistics in the following report, ERA has teamed up with partners Seabury and Innovata to provide a comprehensive analysis
Recommended Performance Measures
 Recommended Performance Measures January 2009 1 RECOMMENDED PERFORMANCE MEASURES Performance measures are utilized by the North Central Texas Council of Governments (NCTCOG) to monitor the performance
Airport Master Plan. Rapid City Regional Airport. October 2015 FAA Submittal
 Airport Master Plan Rapid City Regional Airport October 2015 FAA Submittal Rapid City Regional Airport Master Plan Update Table of Contents Executive Summary... i Scope & Timeline... i Forecasts... i Preferred
STUDY OVERVIEW MASTER PLAN GOALS AND OBJECTIVES
 INTRODUCTION An Airport Master Plan provides an evalua on of the airport s avia on demand and an overview of the systema c airport development that will best meet those demands. The Master Plan establishes
December 2011 Passenger and Cargo Traffic Statistics Reno-Tahoe International Airport
 December 2011 Passenger and Cargo Traffic Statistics Reno-Tahoe International Airport January 27, 2012 U.S. DOMESTIC INDUSTRY OVERVIEW FOR DECEMBER 2011 All RNO Carriers Systemwide year over year comparison
Kansas City Aviation Department. Community Listening Session
 Kansas City Aviation Department Community Listening Session Listening Session Purpose The Kansas City Aviation Department is moderating these community listening sessions in order to gather feedback from
Passenger and Cargo Statistics Report
 Passenger and Cargo Statistics Report RenoTahoe International Airport December 2015 U.S. DOMESTIC INDUSTRY OVERVIEW FOR DECEMBER 2015 All RNO Carriers Domestic Systemwide year over year comparison Average
Master Plan Update Executive Summary. Photos Courtesy of Houston Airport System
 december 2014 William p. hobby airport Executive Summary Photos Courtesy of Houston Airport System Ph otos C o ur t esy of Hous ton Ai rpo r t Sy st em William P. Hobby Airport Airport Executive Summary
BNA Master Plan Update Community Advisory Committee Meeting No. 5
 A Six Sigma Organization BNA Master Plan Update Community Advisory Committee Meeting No. 5 September 19, 2012 Introductions MNAA Staff RW Armstrong Team Albersman & Armstrong, Ltd. Atkins North America,
March 2014 Passenger and Cargo Traffic Statistics Reno-Tahoe International Airport
 March 2014 Passenger and Cargo Traffic Statistics Reno-Tahoe International Airport April 25, 2014 U.S. DOMESTIC INDUSTRY OVERVIEW FOR MARCH 2014 All RNO Carriers Domestic Systemwide year over year comparison
Chapter Seven COST ESTIMATES AND FUNDING A. GENERAL
 Chapter Seven COST ESTIMATES AND FUNDING A. GENERAL This chapter delineates the recommended 2005 2024 Sussex County Airport Capital Improvement Program (CIP). It further identifies probable construction
3 Aviation Demand Forecast
 3 Aviation Demand 17 s of aviation demand were prepared in support of the Master Plan for Harrisburg International Airport (the Airport or HIA), including forecasts of enplaned passengers, air cargo, based
ERA Monthly Market Analysis
 ERA Monthly Market Analysis March 2018 Introduction For the production of these statistics in the following report, ERA has teamed up with partners Seabury Consulting and Innovata to provide a comprehensive
Love Field Modernization Program Update: Master Planning Recommendations
 Love Field Modernization Program Update: Master Planning Recommendations Briefing to the Council Transportation and Environment Committee April 28, 2008 1 1 Briefing Objective Discuss the background and
Abstract. Introduction
 COMPARISON OF EFFICIENCY OF SLOT ALLOCATION BY CONGESTION PRICING AND RATION BY SCHEDULE Saba Neyshaboury,Vivek Kumar, Lance Sherry, Karla Hoffman Center for Air Transportation Systems Research (CATSR)
ACI-NA BUSINESS TERM SURVEY 2018 BUSINESS OF AIRPORTS CONFERENCE
 ACI-NA 2017-18 BUSINESS TERM SURVEY 2018 BUSINESS OF AIRPORTS CONFERENCE Airport/Airline Business Working Group Tatiana Starostina Dafang Wu Assisted by Professor Jonathan Williams, UNC Agenda Background
Master Plan Update Technical Advisory Committee Meeting
 Nashville International Airport Master Plan Update Technical Advisory Committee Meeting February 14, 2019 Agenda Welcome and Introductions Aviation Activity Forecast Facility Requirements Alternatives
PUBLIC NOTICE. Table 1 Projects Proposed by Amendment
 PUBLIC NOTICE The Dallas Department of Aviation (the Department) intends to file an amendment application to increase the PFC amount of one previously approved project at Dallas Love Field Airport (the
2009 Muskoka Airport Economic Impact Study
 2009 Muskoka Airport Economic Impact Study November 4, 2009 Prepared by The District of Muskoka Planning and Economic Development Department BACKGROUND The Muskoka Airport is situated at the north end
STAFF REPORT. Airport Land Use Plan Consistency Review: Santa Barbara Airport Master Plan. MEETING DATE: November 19, 2015 AGENDA ITEM: 7D
 STAFF REPORT SUBJECT: Airport Land Use Plan Consistency Review: Santa Barbara Airport Master Plan MEETING DATE: AGENDA ITEM: 7D STAFF CONTACT: Peter Imhof, Andrew Orfila RECOMMENDATION: Adopt findings
The demand/capacity analysis was performed utilizing Federal Aviation Administration (FAA) publications, including the following:
 publications, including the following:") Chapter Three To properly plan for the future of Monterey Regional Airport, it is necessary to examine the capacities of the key airport systems. This chapter uses the results of the forecasts prepared
Chapter Three To properly plan for the future of Monterey Regional Airport, it is necessary to examine the capacities of the key airport systems. This chapter uses the results of the forecasts prepared
Draft Concept Alternatives Analysis for the Inaugural Airport Program September 2005
 Draft Concept Alternatives Analysis for the Inaugural Airport Program September 2005 Section 3 - Refinement of the Ultimate Airfield Concept Using the Base Concept identified in Section 2, IDOT re-examined
City of Austin Department of Aviation Austin Bergstrom International Airport 2040 Master Plan. Public Workshop #2 April 19, 2018
 City of Austin Department of Aviation Austin Bergstrom International Airport 2040 Master Plan Public Workshop #2 April 19, 2018 DISCUSSION TOPICS Introduction About the Master Plan Public Workshop #1 Recap
NOTICE OF OPPORTUNITY FOR PUBLIC COMMENT RELATED TO PROPOSED PASSENGER FACILITY CHARGE APPLICATION NOVEMBER 9 TH, 2018
 NOTICE OF OPPORTUNITY FOR PUBLIC COMMENT RELATED TO PROPOSED PASSENGER FACILITY CHARGE APPLICATION NOVEMBER 9 TH, 2018 LAWTON-FORT SILL REGIONAL AIRPORT LAWTON, OKLAHOMA PASSENGER FACILITY CHARGE PROPOSED
2 Aviation Demand Forecast
 2 Aviation Demand Forecast 2.1 Historic Passenger and RPT Aircraft Movements Historic passenger and Regular Public Transport (RPT) aircraft movements from 1980 to 2007, with significant events that have
Passenger and Cargo Statistics Report
 Passenger and Cargo Statistics Report RenoTahoe International Airport December 2016 U.S. DOMESTIC INDUSTRY OVERVIEW FOR DECEMBER 2016 All RNO Carriers Domestic Systemwide year over year comparison Average
Technical Memorandum. Synopsis. Steve Carrillo, PE. Bryan Oscarson/Carmen Au Lindgren, PE. April 3, 2018 (Revised)
") Appendix D Orange County/John Wayne Airport (JWA) General Aviation Improvement Program (GAIP) Based Aircraft Parking Capacity Analysis and General Aviation Constrained Forecasts Technical Memorandum To:
Appendix D Orange County/John Wayne Airport (JWA) General Aviation Improvement Program (GAIP) Based Aircraft Parking Capacity Analysis and General Aviation Constrained Forecasts Technical Memorandum To:
July 2012 Passenger and Cargo Traffic Statistics Reno-Tahoe International Airport
 July 2012 Passenger and Cargo Traffic Statistics Reno-Tahoe International Airport August 31, 2012 U.S. DOMESTIC INDUSTRY OVERVIEW FOR JULY 2012 All RNO Carriers Systemwide year over year comparison Average
Milton. PeterPrinceAirportislocatedinSantaRosaCounty, approximatelythreemileseastofmilton.
 Milton GeneralAviationAirport PeterPrinceAirportislocatedinSantaRosaCounty, approximatelythreemileseastofmilton. Existing Facilities Peter Prince Airport is served by one runway, Runway 18/36, 3,700 feet
Passenger and Cargo Statistics Report
 Passenger and Cargo Statistics Report RenoTahoe International Airport September 2015 U.S. DOMESTIC INDUSTRY OVERVIEW FOR SEPTEMBER 2015 All RNO Carriers Domestic Systemwide year over year comparison Average
Inter-Office Memo Reno-Tahoe Airport Authority
 Inter-Office Memo Reno-Tahoe Airport Authority Date: November 30, 2009 To: Statistics Recipients From: Krys T. Bart, A.A.E., President/CEO Subject: RENO-TAHOE INTERNATIONAL AIRPORT PASSENGER STATISTICS
ERIE INTERNATIONAL AIRPORT MASTER PLAN TABLE OF CONTENTS
 EXECUTIVE SUMMARY ERIE INTERNATIONAL AIRPORT MASTER PLAN TABLE OF CONTENTS PAGE NO. CHAPTER 1-INTRODUCTION... 1-1 1.01 General...1-1 1.02 Purpose and Scope of Study...1-1 1.03 The Planning Process...1-2
Passenger and Cargo Statistics Report
 Passenger and Cargo Statistics Report RenoTahoe International Airport January 2017 U.S. DOMESTIC INDUSTRY OVERVIEW FOR JANUARY 2017 All RNO Carriers Domestic Systemwide year over year comparison Average
Airport Master Plan. Brookings Regional Airport. Runway Runway 17-35
 Runway 17-35 Airport Master Plan Runway 12-30 Brookings Regional Airport Table of Contents Table of Contents Chapter 1: Master Plan Goals... 1-1 1.1. Introduction... 1 1.2. Objective 1 Identify improvements