Turkish Market Growth. Annual GDP Growth Forecast ( ) RPK Growth % 30% Annual RPK Growth Forecast ( ) Asia Pacific 4.5% Africa 4.
|
|
|
- Horace Bradley
- 6 years ago
- Views:
Transcription
1
. (*):Adjusted for double count on Domestic Pax RPK Growth % 30% 26.6% 22.9% 19.1% 19.2% 19.5% 20% 17.1% 13.3% 8.5% 10% 6.0% 5.9% 5.3% 4.")
 Latin America 6.9% M.East 6.3% Asia Pacific 6.3% Africa 5.7% World 5.0% CIS 4.5% Europe 4.2% North America 2.7% Source: Boeing Current Market Outlook (2013-2032)")
2 Turkish Market Growth Domestic (*) International CAGR 24% CAGR 11% E 2013E 2014E 2015E Source: General Directorate of State Airports Authority (DHMI). (*):Adjusted for double count on Domestic Pax RPK Growth % 30% 26.6% 22.9% 19.1% 19.2% 19.5% 20% 17.1% 13.3% 8.5% 10% 6.0% 5.9% 5.3% 4.3% 2.4% -1.1% 0% World RPK Growth THY RPK Growth -10% 2 Annual GDP Growth Forecast ( ) Asia Pacific 4.5% Africa 4.4% Latin America 4.0% M.East 3.8% CIS 3.4% World 3.2% North America 2.5% Europe 1.8% Annual RPK Growth Forecast ( ) Latin America 6.9% M.East 6.3% Asia Pacific 6.3% Africa 5.7% World 5.0% CIS 4.5% Europe 4.2% North America 2.7% Source: Boeing Current Market Outlook ( )

3 Total % Change PAX ASK RPK Europe %Change PAX ASK RPK TK AEA TK AEA TK AEA TK AEA H'13 Middle East PAX ASK RPK %Change TK AEA TK AEA TK AEA TK AEA H'13 Far East PAX ASK RPK % Change TK AEA TK AEA TK AEA TK AEA H'13 TK AEA TK AEA TK AEA TK AEA H'13 Source: AEA= Association of European Airlines June 13 Results (Scheduled Traffic) 3


4 Weekly Flights 8,000 46,0 mn pax 7, mn pax Aircraft 234 Aircraft 6,000 5, ,1 mn pax ,1 mn pax 32,6 mn pax ,6 mn pax ,000 3,000 14,1 mn pax 11,9 mn pax ,7 mn pax ,9 mn pax , ,4 mn pax Destinations 1,
5 TEKİRDAĞ İSTANBUL İSTANBUL SİNOP SAMSUN MERZİFON TRABZON KARS İZMİR BALIKESİR KÜTAHYA DENİZLİ ESKİŞEHİR ISPARTA ANKARA KONYA ERZURUM ERZİNCAN SİVAS MUŞ NEVŞEHİR ELAZIĞ KAYSERİ MALATYA DİYARBAKIR K.MARAŞ ADIYAMAN BATMAN AĞRI IĞDIR VAN BODRUM DALAMAN ANTALYA ADANA G.ANTEP Ş.URFA MARDİN HATAY 5

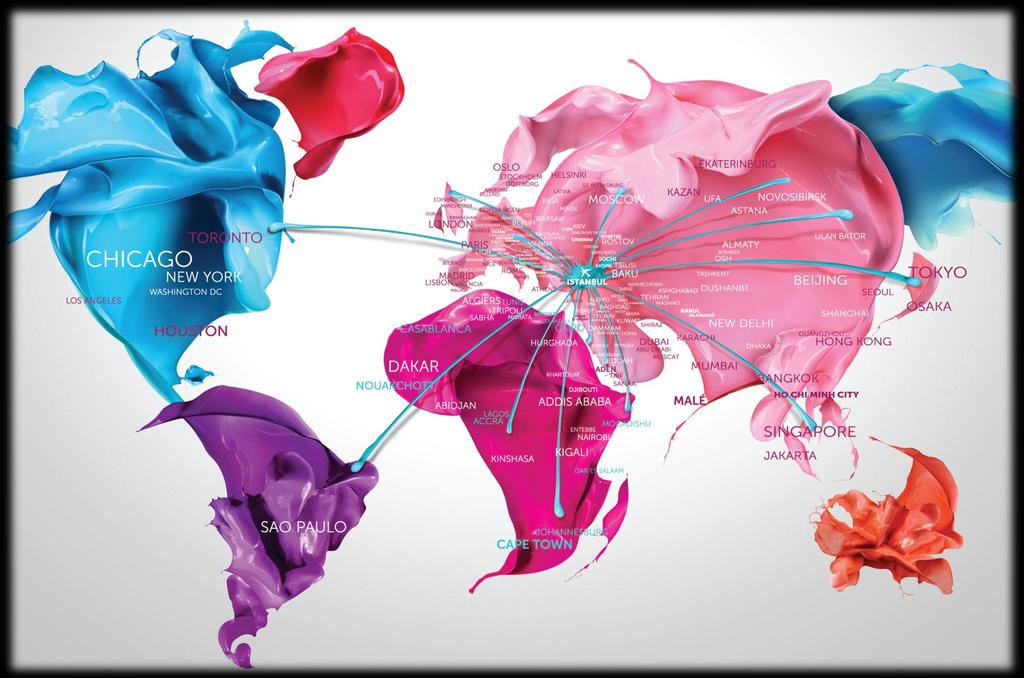
6 AMERICAS (8) EUROPE (93) FAR EAST (28) BUENOS AIRES (4) ATLANTA CHICAGO (7) BOGOTA HOUSTON (4) BOSTON LOS ANGELES (7) CARACAS NEW YORK (21) HAVANA SAO PAULO (7) MEXICO CITY TORONTO (5) MONTREAL WASHINGTON D.C. (7) SAN FRANCISCO *As of June 13 Planned (Weekly Frequency) AFRICA (34) ABIDJAN (4) MISRATA (7) ACCRA (7) MOGADISHU (3) ADDIS ABABA (7) MOMBASA (5) ALEXANDRIA (4) NAIROBI (7) ALGIERS (7) NIAMEY (3) BENGHAZI (10) NOUAKCHOTT (4) CAIRO (17) OUAGADOUGOU (3) CAPETOWN 7) SEBHA SHARM EL CASABLANCA (7) SHEIHK (4) DAKAR (4) TRIPOLI (14) DAR ES SALAAM (7) TUNIS (14) DJIBOUTI (3) YAOUNDE (4) DOUALA (4) ABUJA ENTEBBE(5) ASMARA HURGADA (3) ASWAN JOHANNESBURG(7) BAMAKO KIGALI (5) JUBA KINSHASA (5) KANO KHARTOUM (7) LUXOR KILIMANJARO (5) NDJAMENA LAGOS (7) LUANDA LIBREVILLE (3) ORAN AALBORG (3) DUSSELDORF (28) MALTA (3) SIMFEROPOL (7) AMSTERDAM (28) EDINBURGH (7) MANCHESTER (14) SKOPJE (14) ATHENS (25) EKATERINBURG (4) MARSEILLE (4) SOCHI (3) BAKU (28) FRIEDRICHSHAFEN (4) MILAN (28) SOFIA (14) BARCELONA (21) FRANKFURT (30) MINSK (4) STOCKHOLM (21) BASEL (7) GANJA (4) MOSCOW (28) ST.PETERSBURG (4) BATUMI (7) GENEVA (21) MUNICH (28) STUTTGART (24) BELGRADE (14) GENOA (5) NAKHICHEVAN (4) TALLINN (3) BERLIN (28) GOTHENBURG (12) NAPOLI (7) TBILISI (21) BILBAO (4) HAMBURG (28) NICE (10) THESALONIKI (7) BILLUND (3) HANNOVER (17) NOVOSIBIRSK (3) TIRANA (14) BIRMINGHAM (10) HELSINKI (14) NURNBERG (18) TORINO (7) BOLOGNA (14) KAZAN (4) ODESSA (11) TOULOUSE (7) BREMEN (7) KIEV (13) OSLO (14) UFA (5) BRUSSELS (30) LEFKOSA (35) PARIS (28) WARSAW (4) BUCHAREST (21) LEIPZIG (7) PODGORICA (7) VALENCIA (5) BUDAPEST (14) LISBON (7) PRAG (14) VENICE (21) CHISINAU (7) LJUBLJANA (7) PRISTINA (14) VIENNA (28) COLOGNE (21) LONDON (45) RIGA (6) VILNIUS (3) CONSTANTA (3) LUXEMBOURG (4) ROME (25) ZAGREB (10) COPENHAGEN (21) LVIV (3) ROSTOV (3) ZURICH (28) DONETSK (7) LYON (14) SANTIAGO DE COMPOSTELA(3) KHARKIV DNEPROPETROVSK (7) MADRID (20) SALZBURG (4) KRAKOV DUBLIN (10) MALAGA (7) SARAJEVO (18) LA CORUNA NANTES ROTTERDAM 6 ALMATY (9) JAKARTA (7) TOKYO (7) ASHKHABAD (14) KABUL (7) ULANBATOR (3) ASTANA (3) KARACHI (4) KATHMANDU BANGKOK (11) KUALA LUMPUR (4) LENKERAN BEIJING (7) MALE (4) MANILA BISHKEK (11) MUMBAI (7) MEZAR-I SHERIF COLOMBO (5) NEW DELHI (7) DHAKA (7) OSAKA (7) DUSHANBE (2) OSH (3) GUANGZHOU (7) SHANGHAI (7) HO-CHI-MINH (7) SEOUL (7) HONG KONG (6) SINGAPORE (7) ISLAMABAD (3) TASHKENT (7) MIDDLE EAST (33) ABU DHABI (6) ESFEHAN (2) TAIF (3) ADEN (4) JEDDAH (21) TEHRAN (21) ALEPPO KERMANSHAH (2) TEL AVIV (39) AMMAN (14) KUWAIT (28) YANBU (3) AQABA (3) MADINAH (14) EL-KASIM (4) BAGHDAD (7) MASHAD (5) AHVAZ BAHRAIN (7) MOSUL (4) ABHA BASRA (7) MUSCAT (7) BEIRUT (21) NAJAF (5) DAMASCUS RIYADH (14) DAMMAM (7) SANAA (6) DOHA (10) SHIRAZ (5) DUBAI (14) SULAYMANIYAH (5) ERBIL(7) TABRIZ (7)

7 168 out of 196 international destinations within narrow body range More than 40% of world-wide international traffic within narrow body range 7
8 ASK % RPK % PAX % 14% 12.4% 12% 10% 8% 6% 4% 2% 4.8% 3.7% 3.3% 5.2% 3.9% 3.7% 6.1% 4.2% 4.1% 7.5% 5.6% 5.2% 8.2% 6.3% 6.0% 8.7% 7.2% 6.8% 10.3% 10.0% 8.5% 10.0% 8.4% THY ranks 3rd in passenger; 4th in ASK and 5th in RPK among European Airlines 0% H'13 Source: AEA= Association of European Airlines (Scheduled Traffic) June 13 Results 8


9 ('000) Total Transfer Passengers 30% 9,000 8,000 8,976 12,673 16,483 7,000 6,000 5,000 4,000 3,000 2,000 1, ,249 5,147 4,445 38% 2,487 3,129 1,801 2,229 1, Q'12 1Q' Int l to int l transfer passengers share in total international passengers was 39% in Int'l Direct 20% Domestic 41% Int'l-Dom Transfer 16% Int'l-Int'l Transfer 23% 9


10 (%) ASK RPK L/F % THY Passenger Traffic First Half 2012 vs 2013 Landing up by 22.7% ASK up by 21.3% H'12 1H' RPK up by 26.8% Passenger # ('000) up by 25.8% L/F up by 3.4 pt Total Passengers (Mn) ANNUAL CHANGES ASK (%) RPK (%) PAX (%) L/F (Pt) H'12 1H'13 10
11 (%) (%) Domestic (Bn) ASK RPK L/F% International (Bn) ASK RPK L/F (%) H'12 1H' H'12 1H'13 40 Domestic Passengers (Mn) International Passengers (Mn) 23% 28% H'12 1H' H'12 1H'13
12 Financial Opr. Seat Avg.Fleet YEAR END FLEET* Type Total Owned Lease Lease Capacity Age A , A , Wide Body A , B777-3ER , Wet Lease Total , B ER , B737-9 MAX B , B737-8 MAX B , Narrow Body A , A , A320 NEO A321 NEO A , Wet Lease Total , A Cargo A Wet Lease Total TOTAL , Year End Seat Capacity : 43,018 44,533 50,783 59,096 59,375 64,674 69,206 79,022 80,176 Seat Capacity Change : 18% 4% 14% 16% 0% 9% 7% 14% 1% * After exit/delivery 12
13 Aircraft Purchases Fleet Group Fleet Type 2013* TOTAL Wide Body Narrow Body A B777-3ER Total B B737-9 MAX B B737-8 MAX A A320 NEO 4 4 A321 NEO Total Cargo A Total 1 1 TOTAL * Remaining as of June 13 13

14 Revenue Breakdown PAX 86% Cargo 8% Other 5% Charter 1% Revenue* Breakdown by Geography Domestic 14% Far East 22% Middle East 14% Europe 32% America 10% Africa 8% * Scheduled pax and cargo revenue Int l. Passenger Breakdown by Geography Middle East 15% Far East 12% Africa 8% America 5% Europe 60% 14
15 Revenue (Mn$) Expenses (Mn$) Other* Domestic International Fuel Personnel Other ,448 4,719 4,552 4,552 3,737 6,171 3,726 5,078 2,883 3,182 3,154 3,793 3,298 2,480 2,667 2, H'12 1H'13 10,000 8,319 7,734 8,000 7,070 6,855 22% 18% 6,000 5,149 3,475 4,351 4,148 3,136 4,058 3,676 4,000 3,348 2,773 1,378 1,812 2,602 1,981 2,286 1,339 1,614 1,662 2,000 1, , ,395 2,881 1, ,406 1,369 1, H'12 1H'13 * Cargo, charter and other revenue 15
16 Cost Per ASK ($ cent) CASK Personnel/ASK Fuel/ASK Others /ASK H'12 1H'13 16


17 1,516 1,606 1,024 1,644 1,701 1,122 1,826 2,184 12,951 14,072 15,269 17,119 17,876 17,879 17,391 19,965 Number of Personnel* 15% H'12 1H'13 * THY Technic Personnel is included. Passenger per Employee 10% H'12 1H'13 Average Daily Flight Utilization (hrs) 14:21 14:19 14:59 13:26 13:20 13:18 12:49 12:31 12:36 12:02 12:14 12:11 11:40 11:39 11:40 11:13 11:32 11:40 11:55 12:07 11:48 11:45 11:20 11: H'12 1H'13 WB Long-Haul NB Medium Haul Total 17
18 ($ Mn) 1H'12 % in Total 1H'13 % in Total 13/'12 % Fuel 1,369 37% 1,604 37% 17% Personnel % % 11% Landing 291 8% 371 9% 27% Depreciation 240 7% 321 7% 34% Sales and Marketing 253 7% 304 7% 20% Ground Handling 217 6% 261 6% 21% Passenger Catering 162 4% 206 5% 27% Rents 136 4% 209 5% 53% Maintenance 111 3% 135 3% 21% Others 63 2% 52 1% -17% Codeshare 55 2% 19 0% -65% Advertising 35 1% 49 1% 41% General Administration 25 1% 35 1% 42% Insurance 26 1% 18 0% -31% TOTAL 3, % 4, % 18% Op.Cost per ASK ($) % Op.Cost per ASK ($) except fuel % 18
19 AVG ( ):18,5% H'12 1H'13 (Mn$) H'12 1H'13 Revenue Net Income Net Income Margin (%) 4,4 5,5 18,5 7,9 3,4 0,2 7,7 2,6 1,5 EBIT EBIT Margin (%) 2,1 10,4 12,1 10,8 5,5 3,0 7,2 1,3 4,4 EBITDA EBITDA Margin (%) 10,5 17,9 16,8 17,5 10,9 9,9 14,1 7,8 11,5 EBITDAR EBITDAR Margin (%) 15,9 22,3 20,2 22,9 16,5 14,1 17,6 11,5 16,1 19

20 Revenue by Currency Expenses by Currency Other 29% USD 17% TL 13% TL 26% EUR 13% Other 8% EUR 42% USD 53% 20


21 M+1 M+2 M+3 M+4 M+5 M+6 M+7 M+8 M+9 M+10 M+11 M+12 M+13 M+14 M+15 M+16 M+17 M+18 M+19 M+20 M+21 M+22 M+23 M+24 M+1 M+2 M+3 M+4 M+5 M+6 M+7 M+8 M+9 M+10 M+11 M+12 M+13 M+14 M+15 M+16 M+17 M+18 M+19 M+20 M+21 M+22 M+23 M+24 Turkish Airlines Fuel Hedging Rate Turkish Airlines Currency Hedging Rate 60% 60% 50% 40% 30% 20% 10% 50% 48% 46% 44% 42% 40% 38% 35% 33% 31% 29% 27% 25% 23% 21% 19% 17% 15% 13% 10% 8% 6% 4% 2% 50% 40% 30% 20% 10% 30% 29% 28% 26% 25% 24% 23% 21% 20% 19% 18% 16% 15% 14% 13% 11% 10% 9% 7% 6% 5% 4% 2% 1% 0% 0% Maximum Fuel Hedge Level: 50% Active Surcharge Policy Short position on USD and TRY is hedged 21


22 EBITDAR Margin % Comparison 2012 Annual H EK TK SQ AY AF-KL LH* IAG UA SAS TK LATAM DL UA SAS AF-KL AY LH* IAG *Lufthansa Passenger Airlines. Others based on Group Financials. Source: Calculated based on web site & annual reports. 22

23 PAX Per Personnel 2012 Annual Cost Per ASK ($ Cent) H Others/ASK Fuel/ASK Personnel/ASK ,184 1,866 1,740 1, TK LH** SAS UA SQ IAG EK AY AF-KL SAS UA DL AF-KL LH* IAG AY SQ** EK*** TK LAN **LH is based on airlines business only. Others based on Group Financials. * LH is based on airlines business only. Others based on Group Financials. ** April-June 13, 1st quarter results ** * April 12-March 13, 12M results THY is the most cost efficient among its European Peers 23


24 The Best in Europe in the last 3 years Winner of 3 awards at the 2013 Skytrax World Airline Awards: 24 Best Airline Europe Best Business Class Catering Best Airline in Southern Europe The only 4 Star Airline in all categories in Europe
 463-6363 x-13630 Ms.")
25 THANK YOU Mr. Coşkun KILIÇ, CFO Tel: +90 (212) x Ms. Duygu İNCEÖZ, IR Manager 25
26 Assets ( Mn$) H'13 Cash and Equivalents ,070 1,374 Trade Receivables Other Current Assets Total Current Assets ,197 2,443 Net Fixed Assets ,121 7,773 of which Aircraft and Engines ,392 6,915 Other Non-Current Assets ,227 1,472 Total Non-Current Assets ,348 9,245 Total Assets ,545 11,688 Liabilities (Mn$) H'13 Lease Obligations ,862 5,222 Passenger Flight Liabilities ,546 Accounts Payable Other Liabilities ,204 1,266 Total Liabilities ,513 8,659 Total Shareholders Equity ,032 3,029 of which Issued Capital of which Retained Earnings ,525 Total Liabilities & Shareholders Equity ,545 11,688 26
27 Income Statement (Mn$) H'12 1H'13 13/12% Operating Revenue 2,834 3,737 4,719 4,552 5,448 7,070 8,319 3,726 4,552 22% Operating Expenses 2,773 3,348 4,148 4,058 5,149 6,855 7,722 3,676 4,351 18% of which Fuel , ,406 2,395 2,881 1,369 1,604 17% of which Personnel ,141 1,339 1, % of which Depreciation % of which Rent % Operating Profit % Income From Other Operations % Loss From Other Operations % Profit from Operating Activities % Income From Investment Activities % Share of Investments' Profit (Loss) % Financial Income 238 1, % Financial Expense % Profit Before Tax , % Tax % Net Profit % 27

28 TURKISH CARGO Leading cargo carrier in total export and import cargo in Turkey. As of June 2013, operates 45 destinations with 10 cargo aircraft and 234 destinations with 213 passenger aircraft. By the end of June 2013, THY carried tons of cargo, indicating 15% increase compared to the same period of Revenue (Mn$) 18% H'12 1H'13 28
 Commercial and Ground Handling Quality and Management Trainings Marketing and Sales Trainings Computer and IT")

29 Regional Training Partner for IATA & IATA Authorized Training Center. Provides training services for about people each year Currently has 46 instructors with 40 classrooms. Provides training services in these areas: Technical (Theoretical and Practical) Commercial and Ground Handling Quality and Management Trainings Marketing and Sales Trainings Computer and IT Trainings SAP Trainings Turkish Airlines Flight Training Center Offers Cockpit Crew Training, Cabin Crew Training, Ground Training and Simulators with: 6 full Flight Simulators for B s, A320s, B ER, A330/340 aircraft 1 FNPT II MCC 4 Flight Training Devices for A320, A330/340, B and B777 1 A320 Door Trainer, 1 B777 Door Trainer A340 Business class, B737 Economy Class Cabin Service Trainer (CST) B737/A310/A320/A340 Cabin Emergency Evacuation Trainer(CEET) 29 29
30 THY Group (1H'13) Revenue (Mn $) Personnel THY Rev. % Partnership Structure 1 THY (Consolidated) 4, * - %49 ÖİB - %51 Open to Public 2 Turkish Opet Aviation Fuels 1, % %50 THY - %50 Opet 3 THY Turkish Technic 229 2,024 72% % 100 THY 4 THY Turkish Do&Co 152 3,268 87% %50 THY - %50 Do&Co 5 Turkish Ground Services 110 7,956 80% %50 THY - %50 Havaş 6 Pratt Whitney THY Turkish Engine Center (TEC) % %51 PW - %49 THY 7 HABOM Aviation Maintenance, Repair and Modification Center 11 1, % % 100 THY 8 Goodrich Turkish Airlines Technical Service Center % %60 Goodrich - %40 THY Teknik 9 Turkish Cabin Interior Systems Industries, Inc % %30 THY - %21 THY Teknik - %49 TAI 10 Turkbine Technical Gas Turbines Maintenance & Repair, Inc %50 THY Teknik - %50 Zorlu O&M 11 Aircraft Seat Manufacturing Industry & Trade, Inc % THY & THY Teknik %50-Assan Hanil %50 12 Sun Express (Turkey & Germany Consolidated) 445 2,507 - %50 THY - %50 Lufthansa 13 THY Aydın Çıldır Airport Management, Inc %100 THY 14 THY Aviation Maintenance, Repair and Modification Center % % 100 THY * THY A.O. Personnel 30
 Plans to provide maintenance service to around 400 aircraft yearly, as well as training and other services to civil aviation industry in Turkey and its")
31 Turkish Technic Owned 100% by THY. Provides maintenance services to more than 100 customers, including international airlines such as Lufthansa, KLM, BA and Alitalia as well as domestic airlines. HABOM (Maintenance Repair & Overhaul Center) Plans to provide maintenance service to around 400 aircraft yearly, as well as training and other services to civil aviation industry in Turkey and its region. The facility, designed according to LEED Gold standards, will be located in Sabiha Gokcen International Airport in Istanbul with a total investment of nearly 500 mn$. HABOM is expected to be in full capacity starting from the second half of 2013 and gradually by the year Expected full capacity revenue is around 6.5 bn$. Goodrich THY Technic Service Center Provides repair, overhaul and modification services for Nacelle, Thrust Reverser, and its components; for Turkish Airlines and other customers from Turkish domestic and International markets. The sq meters (indoor) facility is located in Gebze Organized Industrial Zone Turkish Engine Center Provides engine maintenance, repair and overhaul (MRO) services to customers located in Turkey, surrounding regions and worldwide. The environmentally efficient engine overhaul facility has total usage area of 100,000 sq. meters located at the Sabiha Gokcen International Airport. 31


32 Turkish OPET In terms of investment on jet fuel supply; Turkish Airlines established a jet fuel supply company together with local oil retailer OPET on September The business activity of the established company is to supply jet fuel to any type of aircraft. Started supplying jet fuel to THY for all domestic airports as of July 1st Turkish Do&Co Since 2007, operating nine gourmet kitchens all over Turkey: Istanbul (Atatürk and Sabiha Gökcen), Ankara, Antalya, Izmir, Bodrum, Trabzon, Dalaman and Adana. Over 60 national and international airlines are catered from these locations. Turkish Airlines won the Best Business Class Catering award at the 2013 Skytrax World Airline Awards and World's Best Economy Class Onboard Catering award at the 2010 Skytrax Awardswith Turkish Do&Co. 32 TGS Ground Services Owned 50% - %50 by THY and Havaş Havaalanları Yer Hizmetleri A.Ş. Provides ground services to Turkish Airlines since the beginning of 2010, currently at eight major airports in Turkey: Istanbul (Ataturk and Sabiha Gokcen), Izmir, Ankara, Antalya, Adana, Bodrum, Dalaman.
33 Sun Express Turkey Founded in October 1989 as a 50% - 50% subsidiary company of Lufthansa and Turkish Airlines. Market leader in charter flights between Germany and Turkey. Flies to/from 21 airports in Germany, 18 in Turkey and 39 in other countries. Operates with 21 B aircraft with total seat capacity of as of June Carried 2,511,251 passengers with 80.8% load factor by the end of the first half of
34 This presentation is confidential and does not constitute or form part of, and should not be construed as, an offer or invitation to subscribe for, underwrite or otherwise acquire, any securities of Turkish Airlines A.O (the Company ) or any member of its group nor should it or any part of it form the basis of, or be relied on in connection with, any contract to purchase or subscribe for any securities of the Company or any member of its group nor shall it or any part of it form the basis of or be relied on in connection with any contract, investment decision or commitment whatsoever. This presentation has been made to you solely for your information and background and is subject to amendment. This presentation (or any part of it) may not be reproduced or redistributed, passed on, or the contents otherwise divulged, directly or indirectly, to any other person (excluding the relevant person s professional advisers) or published in whole or in part for any purpose without the prior written consent of the Company. This presentation includes forward-looking statements. These forward-looking statements include all matters that are not historical facts, statements regarding the Company s intentions, beliefs or current expectations concerning, among other things, the Company s results of operations, financial condition, liquidity, prospects, growth, strategies and the industry in which the Company operates. By their nature, forward-looking statements involve risks and uncertainties, including, without limitation, the risks and uncertainties set forth in the Company s Offering Memorandum, because they relate to events and depend on circumstances that may or may not occur in the future. The Company cautions you that forward-looking statements are not guarantees of future performance and that its actual results of operations, financial condition and liquidity and the development of the industry in which the Company operates may differ materially from those made in or suggested by the forward-looking statements contained in this presentation. In addition, even if the Company s results of operations, financial condition and liquidity and the development of the industry in which the Company operates are consistent with the forward-looking statements contained in this presentation, those results or developments may not be indicative of results or developments in future periods. The Company does not undertake any obligation to review or confirm analyst expectations or estimates or to release publicly any revisions to any forward-looking statements to reflect events that occur or circumstances that arise after the date of this presentation. 34
Overview Presentation
 March, 2013 1 Overview Presentation The Future Of Air Transport And The Role Of Turkish Airlines International Tourist Arrivals Iata Traffic Flows Between Regions Tourism Development ( Turkey ) Aviation
Cargo Market & Turkish Cargo. Network & Fleet. Products Development and Future Plans
 Turkish Airlines & Turkish Cargo in Brief Cargo Market & Turkish Cargo Network & Fleet Products Development and Future Plans Turkish Airlines & Turkish Cargo in Brief Cargo Market & Turkish Cargo Network
International Trade Forum 25 January 2018
 International Trade Forum 25 January 2018 Flies to more countries than any other airline 300 120 331 DESTINATIONS COUNTRIES AIRCRAFTS In terms of destination country World s #1 Worldwide 300 Destinations
TURKISH CARGO NETWORK: YOUR KEY HUB TO GLOBAL SUPPLY CHAIN November 2017
 TURKISH CARGO NETWORK: YOUR KEY HUB TO GLOBAL SUPPLY CHAIN November 2017 01 Turkish Cargo Network TURKISH CARGO TIMELINE Turkish Airlines was founded in 1933. In the meantime, Turkish Airlines carried
Aviation Market & Economy
 2013 FY Results 1 Aviation Market & Economy Turkish Market Growth (mn pax) Annual GDP Growth Forecast (2012-2032) Domestic (*) International CAGR 15% CAGR 11% Asia Pacific 4.5% 38 44 44 16 18 21 52 25
Cargo Market & Turkish Cargo. Network & Fleet. Fleet. Africa Routes. America Routes. Asia Pacific Routes. Central & Southern Europe Routes
 AGENDA 01 02 03 04 05 Turkish Cargo & Turkish Airlines in Brief Cargo Market & Turkish Cargo Network & Fleet Products Development & Future Plans Turkish Cargo Timeline Tonnage Shares Of Regions Fleet Special
TURKISH AIRLINES. 1Q 14 Results
 TURKISH AIRLINES January - September 14 January - December 14 Financial Operational 1Q 14 Results 1 Aviation Market & Economy Turkish Market Growth (mn pax) Annual GDP Growth Forecast (2013-2033) 38 44
TURKISH AIRLINES 4Q 14 & FY2014 Results Summary. 1Q 14 Results
 TURKISH AIRLINES 4Q 14 & FY2014 Results Summary 1Q 14 Results 1 Key Financial Data Q4'13 Q4'14 Change (USD mn) 2013 2014 Change 2,416 2,530 4.7% Revenue 9,826 11,070 12.7% 2,128 2,209 3.8% Passenger Revenue
Travel Talk. Congratulations. Don t miss American Express Prize. Maha. American Express Travel Services Egypt Lucky Winner.
 December 2011 Maha Travel Talk Congratulations American Express Travel Services Egypt Lucky Winner Mr. Mahmoud Fathy from IT Works is the winner of one Pocket Mouse presented by British Airways. Please
ETIHAD AVIATION GROUP FAST FACTS & FIGURES JANUARY 2018
 ETIHAD AVIATION GROUP FAST FACTS & FIGURES JANUARY 2018 OUR PEOPLE Etihad Aviation Group is a diversified global aviation and travel group comprising five business divisions Etihad Airways, the national
TURKISH AIRLINES INVESTOR DAY May 15, 2014
 TURKISH AIRLINES INVESTOR DAY May 15, 2014 Turkish Airlines Investor Day (May 2014) 1. Investment Highlights & Strategy Overview 2. 2014 Q1 Operational Figures and 2014 Outlook 3. Marketing and Branding
TURKISH AIRLINES 1Q 15 Results Summary. 1Q 14 Results
 TURKISH AIRLINES 1Q 15 Results Summary 1Q 14 Results 1 Key Financial Data (USD mn) 1Q'14 1Q'15 Change Revenue 2,315 2,219-4.1% Passenger Revenue 2,022 1,941-4.0% Net Operating Profit -103-70 32.0% EBIT
Travelling to Liverpool
 Travelling to Liverpool 1 2 International Airports within 45 minutes of Liverpool City Centre 226 Destinations Domestic Non EU EU 25 50 100 150 250 27.4 million passengers per year = 4 million 77 airlines
TRANSIT TIMES CANNOT BE GUARANTEED
 Guide This guide is not definitive and may be subject to change. The transit times stated here are for documents. Transit times may be longer for non-document items travelling outside the EU. (Non-documents
CANADA BAGGAGE REGULATIONS
 CANADA BAGGAGE REGULATIONS At Turkish Airlines, we take into account all the baggage needs of our passengers, and would like to remind you that different baggage regulations are applied on flights to Canada.
Rethinking Global City Competitiveness. Jeremy Kelly, Global Research, JLL 7 th June 2018
 Rethinking Global City Competitiveness Jeremy Kelly, Global Research, JLL 7 th June 2018 A new language of city competitiveness Source: JLL!3 A new language of city competitiveness technology diversity
Contents Introduction...3 Main Headlines...4 The Overall Rankings...7 Most Significant Centres Areas of Competitiveness
 Global Financial Centres Index 19 Contents Introduction... 3 Main Headlines... 4 The Overall ings... 7 Most Significant Centres... 12 19 Areas of Competitiveness... 13 Western Europe... 15 Eastern Europe
INDEX. Turkish Airlines. Turkish Cargo
 INDEX Turkish Airlines Turkish Cargo TURKISH AIRLINES Global Rank 1 Total Pax(Turkey) 1 4 6 The Most Country flying Airline Destination (World) Toplam Total Pax Yolcu (Dünya)* (World)* *: IATA 2013 total
A E R O F L O T R U S S I A N A I R L I N E S ACHIEVEMENTS AND GOALS
 A E R O F L O T R U S S I A N A I R L I N E S ACHIEVEMENTS AND GOALS Aeroflot Today An Overview 1 #1 airline in one of the largest markets globally with leading positions on both domestic and international
TABLE 4. CITYPAIRWISE INTERNATIONAL PASSENGER AND FREIGHT (SCHEDULED) STATISTICS TO AND FROM THE INDIAN TERRITORY DURING THE QUARTER APR-JUN 2016 (P)
 STATISTICS TO AND FROM THE INDIAN TERRITORY DURING THE QUARTER APR-JUN 2016 (P)") TABLE 4. CITYPAIRWISE INTERNATIONAL PASSENGER AND (SCHEDULED) STATISTICS TO ( IN NUMBER AND IN TONNES) 1 ABUDHABI AHMEDABAD 18792 24983 75.1 98.9 2 ABUDHABI BENGALURU 36376 34271 125.3 342.0 3 ABUDHABI
TABLE 4. CITYPAIRWISE INTERNATIONAL PASSENGER AND (SCHEDULED) STATISTICS TO ( IN NUMBER AND IN TONNES) 1 ABUDHABI AHMEDABAD 18792 24983 75.1 98.9 2 ABUDHABI BENGALURU 36376 34271 125.3 342.0 3 ABUDHABI
TURKISH AIRLINES. 1Q 17 Results Summary
 TURKISH AIRLINES 1Q 17 Results Summary Key Financial Data 2015 2016 Change (USD mn) 1Q 16 1Q 17 Change 10,522 9,792-6.9% Revenue 2,188 1,980-9.5% 9,368 8,590-8.3% Passenger Revenue 1,931 1,675-13.3% 935
TURKISH AIRLINES. 1Q 18 Results Summary
 TURKISH AIRLINES 1Q 18 Results Summary Key Financial Data 2016 2017 Change (USD mn) 1Q'17 1Q'18 Change 9.792 10.958 11,9% Revenue 1.980 2.763 39,5% 8.590 9.403 9,5% Passenger Revenue 1.675 2.304 37,6%
PART 1: EXISTING AND EVOLVING GLOBAL FARE COLLECTION INDUSTRY Introduction Transit ticketing industry 6
 Contents PART 1: EXISTING AND EVOLVING GLOBAL FARE COLLECTION INDUSTRY 1 1.1 Introduction 2 1.2 Transit ticketing industry 6 1.2.1 Overview 6 1.2.2 System components and value chain 7 1.2.3 Market size
OUTLOOK FOR BOEING AND CIVIL AVIATION
 OUTLOOK FOR BOEING AND CIVIL AVIATION Randy Tinseth Dr. Fariba Alamdari Vice President, Vice Marketing President, Boeing Market Commercial and Value Airplanes Analysis Boeing Commercial June Airplanes
Facts and figures about Munich Airport
 Location information February 2017 Munich Airport - Facts and figures about Munich Airport 1 - Direct flights from Munich 2 - Cargo traffic 3 - The airport as an engine of employment 3 - Europe's best
TURKISH AIRLINES. 2Q 17 Results Summary
 TURKISH AIRLINES 2Q 17 Results Summary Key Financial Data 2Q 16 2Q 17 Change (USD mn) 1H 16 1H 17 Change 2,444 2.617 7,1% Revenue 4,632 4.597-0,8% 2,140 2.243 4,8% Passenger Revenue 4,071 3.918-3,8% 253
Corporate Presentation. June 2016
 Corporate Presentation June 2016 Quality & Award winning airline Full Service Carrier Focus on quality, efficiency, productivity Young fleet of 61 Aircraft 47 Airbus A320 family 14 Bombardier Star alliance
TURKISH AIRLINES. 8M 15 Traffic Results and Guidance Update. 1Q 14 Results
 TURKISH AIRLINES 8M 15 Traffic Results and Guidance Update 1Q 14 Results 1 Aviation Market & Economy Annual GDP Growth Forecast (2013-2033) Annual RPK Growth Forecast (2013-2033) Africa Asia Pacific Latin
TURKISH AIRLINES. 2Q 16 Results Summary. 1Q 14 Results
 TURKISH AIRLINES 2Q 16 Results Summary 1Q 14 Results 1 Key Financial Data 2Q'15 2Q'16 Change (USD mn) 1H'15 1H'16 Change 2,570 2,444-4.9% Revenue 4,789 4,632-3.3% 2,287 2,140-6.4% Passenger Revenue 4,228
Traffic Development Policy
 2017-2018 Guidelines Strategy The aims at attracting incremental traffic to Genoa airport through: Point to point connections: development of new direct routes to domestic and international airports, including
TURKISH AIRLINES. 3Q 15 Results Summary. 1Q 14 Results
 TURKISH AIRLINES 3Q 15 Results Summary 1Q 14 Results 1 Key Financial Data 3Q'14 3Q'15 Change (USD mn) 9M'14 9M'15 Change 3,318 3,265-1.6% Revenue 8,540 8,054-5.7% 3,030 2,969-2.0% Passenger Revenue 7,649
TURKISH AIRLINES. 1Q 18 Results Summary
 TURKISH AIRLINES 1Q 18 Results Summary Key Financial Data 2016 2017 Change (USD mn) 1Q'17 1Q'18 Change 9.792 10.958 11,9% Revenue 1.980 2.763 39,5% 8.590 9.403 9,5% Passenger Revenue 1.675 2.304 37,6%
ORIGIN / DESTINATION FLIGHT NO FREQ * DEP ARR AIRCRAFT STOPS
 All timings are shown in local times. Every effort has been made to ensure the accuracy of the timetable. However, the schedules are subject to change without prior notice.the company reserves the right,
TURKISH AIRLINES. 2Q 18 Results Summary
 TURKISH AIRLINES 2Q 18 Results Summary Key Financial Data 2Q'17 2Q'18 Change (USD mn) 1H'17 1H'18 Change 2.617 3.177 21,4% Revenue 4.597 5.940 29,2% 2.243 2.711 20,9% Passenger Revenue 3.918 5.014 28,0%
TURKISH AIRLINES. 1Q 18 Results Summary
 TURKISH AIRLINES 1Q 18 Results Summary Key Financial Data 2016 2017 Change (USD mn) 1Q'17 1Q'18 Change 9.792 10.958 11,9% Revenue 1.980 2.763 39,5% 8.590 9.403 9,5% Passenger Revenue 1.675 2.304 37,6%
Advertising and Sponsorship Opportunities 2012 SAUDI ARABIAN AIRLINES
 Advertising and Sponsorship Opportunities 2012 SAUDI ARABIAN AIRLINES Why In Flight Media Entertaining Captive Audience Minimum Distraction Cost effective compared to other mass media (Cost Per Thousand)
Airline Marketing Brussels Airport Léon Verhallen, Head of Airline Business Development
 Airline Marketing Brussels Airport Léon Verhallen, Head of Airline Business Development MAp Reverse Roadshow, June 2007 Top 25 European Passenger Airports Primary gateways O&D leisure & LCC Secondary gateways
TURKISH AIRLINES. 2Q 18 Results Summary
 TURKISH AIRLINES 2Q 18 Results Summary 1 Key Financial Data 2Q'17 2Q'18 Change (USD mn) 1H'17 1H'18 Change 2.617 3.177 21,4% Revenue 4.597 5.940 29,2% 2.243 2.711 20,9% Passenger Revenue 3.918 5.014 28,0%
TURKISH AIRLINES. FY2016 Results Summary
 TURKISH AIRLINES FY2016 Results Summary Key Financial Data 4Q'15 4Q'16 Change (USD mn) 2015 2016 Change 2,468 2,230-9.6% Revenue 10,522 9,792-6.9% 2,171 1,894-12.8% Passenger Revenue 9,368 8,590-8.3% 227
12.3million. passengers and 851,000 tonnes of cargo carried by Cathay Pacific in 2002.
 12.3million passengers and 851, tonnes of cargo carried by Cathay Pacific in 22. The three airlines are based in Hong Kong. Cathay Pacific Airways provides international passenger and cargo services. Dragon
TURKISH AIRLINES. 1Q 16 Results Summary. 1Q 14 Results
 TURKISH AIRLINES 1Q 16 Results Summary 1Q 14 Results 1 Key Financial Data (USD mn) 1Q'15 1Q'16 Change Revenue 2,219 2,188-1.4% Passenger Revenue 1,941 1,931-0.5% Net Operating Profit -35-280 - Profit From
TURKISH AIRLINES. 3Q 17 Results Summary
 TURKISH AIRLINES 3Q 17 Results Summary Key Financial Data 3Q'16 3Q'17 Change (USD mn) 9M'16 9M'17 Change 2.930 3.606 23,1% Revenue 7.562 8.203 8,5% 2.625 3.207 22,2% Passenger Revenue 6.696 7.125 6,4%
TURKISH AIRLINES. 3Q 17 Results Summary
 TURKISH AIRLINES 3Q 17 Results Summary Key Financial Data 3Q'16 3Q'17 Change (USD mn) 9M'16 9M'17 Change 2.930 3.606 23,1% Revenue 7.562 8.203 8,5% 2.625 3.207 22,2% Passenger Revenue 6.696 7.125 6,4%
TURKISH AIRLINES. FY2017 Results Summary
 TURKISH AIRLINES FY2017 Results Summary Key Financial Data 4Q'16 4Q'17 Change (USD mn) 2016 2017 Change 2.230 2.755 23,5% Revenue 9.792 10.958 11,9% 1.894 2.278 20,3% Passenger Revenue 8.590 9.403 9,5%
TURKISH AIRLINES. FY2017 Results Summary
 TURKISH AIRLINES FY2017 Results Summary Key Financial Data 4Q'16 4Q'17 Change (USD mn) 2016 2017 Change 2.230 2.755 23,5% Revenue 9.792 10.958 11,9% 1.894 2.278 20,3% Passenger Revenue 8.590 9.403 9,5%
What this meant to British travellers
 Strength in the pound leads to decreased hotel room rates for UK travellers in first half 2015 September 2, 2015 Global hotel prices paid by travellers worldwide rose by just 1% during first half 2015,
Corporate Presentation. March 2017
 Corporate Presentation March 2017 March 27, 2017 Quality & Award winning airline Full Service Carrier Focus on quality, efficiency Fleet of 58 Aircraft in 2017 46 Airbus A320 family 12 Turboprops 12.5m
4 th Dimension Focus. Global Hotel Trends Q3 2017
 4 th Dimension Focus Global Hotel Trends Q3 2017 2 About the Report This 4D Focus quarterly report uses global data sourced from FCM corporate bookings made offline, online (via OBT), GDS and non- GDS
Mobility in Cities Database
 Mobility in Cities Database Full Dataset This dataset comprises 85 standardised indicators, covering all the 63 cities included in MCD. Customers who purchase this dataset will also receive a copy of the
Athens connectivity & the airport s role
 Athens International Airport Athens connectivity & the airport s role Ioanna Papadopoulou, Director, Communications & Marketing Philoxenia, 10.11.2017 Agenda Connectivity Airport s role Far-East & Australia
Analyst Meeting & Presentation 3Q 2012 Result Announcement. Jakarta, 25 October 2012
 Analyst Meeting & Presentation 3Q 2012 Result Announcement Jakarta, 25 October 2012 0 0 Shareholder List as of 30 September 2012 Shareholder List as of 30 September 2012 Number of Shares % Domestic Government
Analyst and Investor Conference Call Q Ulrik Svensson, CFO and Member of the Executive Board
 Analyst and Investor Conference Call Q2 2017 Ulrik Svensson, CFO and Member of the Executive Board Frankfurt, 2 August 2017 Disclaimer The information herein is based on publicly available information.
EUROPEAN CITIES MONITOR
 EUROPEAN CITIES MONITOR 2006 EUROPEAN CITIES MONITOR Executive Summary Cushman & Wakefield has conducted this survey on Europe s major business cities each year since 1990. The underlying data was researched
LIST OF STATES WHICH THE LAO PDR HAS ESTABLISHED DIPLOMATIC RELATIONS SINCE 1950
 LIST OF STATES WHICH THE LAO PDR HAS ESTABLISHED DIPLOMATIC RELATIONS SINCE 1950 No Countries Capital Dated Representative Residence 1 Afghanistan Kabul AS 11.03.1983 Embassy New York 2 Albania Tirana
5 REASONS WHY OUR CORPORATE TRAVEL PROGRAMME IS PERFECT FOR YOU
 5 REASONS WHY OUR CORPORATE TRAVEL PROGRAMME IS PERFECT FOR YOU REASON #1 WE RE FLUENT IN BUSINESS AND WE RE INVESTED IN YOU Take your company s cost savings to higher altitudes with a Corporate Travel
Marketing Presentation. August 2017
 Marketing Presentation August 2017 Turkish Airlines Rankings Turkish Airlines Figures Brand Value Products & Advantages Subsidiaries of TK 1 / 41 Global Rankings (Traffic & Operation) Number of Countries
TURKISH AIRLINES. June 2015
 TURKISH AIRLINES June 2015 1 1 2 Aviation Market & Economy Annual GDP Growth Forecast (2013-2033) Annual RPK Growth Forecast (2013-2033) Africa Asia Pacific Latin America M.East 4,7% 4,4% 3,9% 3,8% Africa
International Civil Aviation Organization. Fourth Meeting of Traffic Forecasting Sub-Group (TF SG/4) (Cairo, Egypt November 2011)
 (Cairo, Egypt November 2011)") TF SG/4-WP/4 13/11/2011 International Civil Aviation Organization Fourth Meeting of Traffic Forecasting Sub-Group (TF SG/4) (Cairo, Egypt 15-17 November 2011) Agenda Item 4: Review of updated Forecast
TF SG/4-WP/4 13/11/2011 International Civil Aviation Organization Fourth Meeting of Traffic Forecasting Sub-Group (TF SG/4) (Cairo, Egypt 15-17 November 2011) Agenda Item 4: Review of updated Forecast
Analyst Presentation. 9 th June 2006
 Analyst Presentation 9 th June 2006 1 Existing Principal Shareholding Structure CITIC Pacific 46.30% 25.40% 10.00% 68.36% CNAC(HK) 43.29% 7.71% 17.79% 28.50% Dragonair Source: Announcement on 9 th June
Bank of America Merrill Lynch Emerging Markets Corporate Conference. Miami, June 2016
 Bank of America Merrill Lynch Emerging Markets Corporate Conference Miami, June 2016 This presentation may include forward-looking comments regarding the Company s business outlook and anticipated financial
Tiger Airways Holdings Limited FY11 Results
 Tiger Airways Holdings Limited FY11 Results May 2011 Financial Year Ended 31 March 2011 Disclaimer The information contained in this presentation (the "Information") is provided by Tiger Airways Holdings
TBU Q ANALYST & INVESTOR PRESENTATION
 TBU Q1 2014 ANALYST & INVESTOR PRESENTATION 1 Pegasus at a Glance Fleet of 52 aircraft with an average age of 4.1 year Leading presence in domestic market with a market share of 27.4% Operates on over
Information meeting. 1 st September 2011
 Information meeting 1 st September 2011 Full Year 2010-11 key data April 2010-March 2011 Revenues in billions Operating result in millions 77% Passenger 18.10 +11.3% -44 +874 13% Cargo 3.16 +29.5% +69
TURKISH AIRLINES. 4Q 18 Results Summary
 TURKISH AIRLINES 4Q 18 Results Summary 1 Key Financial Data 4Q'17 4Q'18 Change (USD mn) 2017 2018 Change 2.755 2.986 8,4% Revenue 10.958 12.855 17,3% 2.278 2.453 7,7% Passenger Revenue 9.403 10.918 16,1%
Volcanic Eruptions and Global Fallout
 Volcanic Eruptions and Global Fallout Mastertitelformat from airspace closure bearbeiten to airspace monitoring and management Andreas Petzold Research Center Jülich esof 2012 dublin 14 july2012 1 IPCC,
Enskilda Nordic Seminar 2006 Copenhagen 12 January President and CEO Jukka Hienonen
 Enskilda Nordic Seminar 2006 Copenhagen 12 January 2006 President and CEO Jukka Hienonen On blue and white wings since 1923 Over 8 million passengers/year Turnover 1.7 billion euro 9 000 employees 70 aircraft
HotelBenchmark. Survey. Business data for informed decision making. November Summary report Travel, Tourism & Leisure
 HotelBenchmark Survey Business data for informed decision making November 2002 Summary report Travel, Tourism & Leisure HotelBenchmark Survey November summary report For more information on Deloitte &
PRIDE OF OWNERSHIP.
 CONSORTIUM OF LOCALLY OWNED PARTNERSHIPS We understand the fundamental role that pride of ownership plays in inspiring the highest work ethic, quality and professionalism. Each icore office is a locally
Front cover picture: European Parliament, Brussels
 EUROPEAN CITIES MONITOR 2010 Front cover picture: European Parliament, Brussels EUROPEAN CITIES MONITOR Introduction This is the 21st year that Cushman & Wakefield has conducted this survey on Europe s
Information meeting. Jean-Cyril Spinetta Chairman and CEO
 Information meeting Jean-Cyril Spinetta Chairman and CEO Forward-looking statements The information herein contains forward-looking statements about Air France-KLM and its business. These forward-looking
ADCAL LABELS LTD INTERNATIONAL CARRIAGE PRICE LIST
 ADCAL LABELS LTD INTERNATIONAL CARRIAGE PRICE LIST Weight A B C D E F G H I J K L M N KG DOX/NDX DOX/NDX DOX/NDX DOX/NDX DOX/NDX DOX/NDX DOX/NDX DOX/NDX DOX/NDX DOX/NDX DOX NDX DOX NDX DOX NDX DOX NDX
Finnair Q Result
 17 August 2016 CEO Pekka Vauramo CFO Pekka Vähähyyppä Finnair Q2 2016 Result 1 Highlights of the second quarter The seventh consecutive quarter of profit improvement Fukuoka & Guangzhou route openings
MasterCard. Global Destination Cities Index
 MasterCard Global Destination Cities Index MasterCard Worldwide Insights 2Q 2013 Top 20 Global Destination Cities in 2013 1 The top destination city by international visitor arrivals in 2013 is Bangkok,
JAPAN AIRLINES Financial Results 2 nd Quarter Mar / 2014 (FY2013)
") JAPAN AIRLINES Financial Results 2 nd Quarter Mar / 2014 (FY2013) Yoshiharu Ueki, President Norikazu Saito, Managing Executive Officer 31 October, 2013 Contents P.2 P.3 P.4 P.6 1 Overview of 2 nd Quarter
JAPAN AIRLINES Financial Results 2 nd Quarter Mar / 2014 (FY2013) Yoshiharu Ueki, President Norikazu Saito, Managing Executive Officer 31 October, 2013 Contents P.2 P.3 P.4 P.6 1 Overview of 2 nd Quarter
Massachusetts Institute of Technology. Philippe A. Bonnefoy. Massachusetts Institute of Technology Planning & Design of Airport Systems
 Role of the Privatization of Airports in the Dynamics of Multi-Airport Systems Philippe A. Bonnefoy Planning & Design of Airport Systems December 11 th 2007 Introduction Motivation & Problem Growth of
25 th March 2013 Hyatt Hotel Reinforcing Montreal s competitiveness as a financial centre. GFCI 13 Published This Morning!
 Z/Yen Group Limited Risk/Reward Managers 90 Basinghall Street London EC2V 5AY United Kingdom tel: +44 (20) 7562-9562 25 th March 2013 Hyatt Hotel Reinforcing Montreal s competitiveness as a financial centre
MasterCard 2015 Global Destination Cities Index
 MasterCard Global Destination Cities Index Tracking Global Growth: 2009- By: Dr. Yuwa Hedrick-Wong and Desmond Choong Introduction With data going back to 2009, the Global Destination Cities Index charts
Q Fast growth continued, Comparable operating result at record high levels Pekka Vauramo
 2018 Fast growth continued, Comparable operating result at record high levels 17.7.2018 Pekka Vauramo 2 A good - Comparable operating result increased to new seasonal high Revenue Comparable operating
Information meeting. Third quarter results. March 2011
 Information meeting Third quarter 2010-11 results 1 March 2011 Agenda 2010-11: recovery in activity and return to profitability Current issues Air France-KLM ambitions for the next three years 2 All businesses
Athens International Airport. The 2007 market performance
 Athens International Airport The 2007 market performance Great overall performance 70 Airlines 15 New Aer Lingus Air Baltic Air China Carpatair Centralwings Clickair Continental Airlines Finnair Ilyich-Avia
TURKISH AIRLINES. 4Q 15 Results Summary. 1Q 14 Results
 TURKISH AIRLINES 4Q 15 Results Summary 1Q 14 Results 1 Key Financial Data 4Q'14 4Q'15 Change (USD mn) 2014 2015 Change 2,530 2,468-2.5% Revenue 11,070 10,522-5.0% 2,209 2,171-1.7% Passenger Revenue 9,858
KEFLAVÍK AIRPORT FROM A STROLL THROUGH CENTRAL PARK TO A SEAT ON THE LONDON EYE FACTS AND FIGURES 2017
 N 51 30 15.5052 W 0 4 34.2336 FROM A STROLL THROUGH CENTRAL PARK Wake up in New York and drink your morning coffee at the park before you get to work. TO A SEAT ON THE LONDON EYE Enjoy in the evening a
ANALYST MEETING 21 DECEMBER 2016 DEVELİ NİŞANTAŞI ISTANBUL
 ANALYST MEETING 21 DECEMBER 2016 DEVELİ NİŞANTAŞI ISTANBUL AGENDA Macro View Operational Evaluation Fleet Development Management Action Plan Network Development Hedge Strategy 2017 Management View Q&A
AEROPORTO DI BOLOGNA FLIGHT TIMETABLE Scheduled flights
 AEROPORTO DI BOLOGNA 2019 FLIGHT TIMETABLE Scheduled flights Summer 2019 Updated 08/01/2019 Valid until 26/10/2019 Flight Timetable Guide From Airline Flight No. Departure Arrival Frequency Validity 1
2017 A year of strong growth Finnair Q4 and FY 2017 result
 2017 A year of strong growth Finnair Q4 and FY 2017 result 16.2.2018 Pekka Vauramo 1 A record Q4 concluded a strong year 2017 Comparable operating result at record level, 22.9 million euro (Q4 2016: 1.6)
Air Connectivity and Its Impact on Tourism in Asia and the Pacific. A Joint Program between the UNWTO, PATA and the TPO
 Air Connectivity and Its Impact on Tourism in Asia and the Pacific A Joint Program between the UNWTO, PATA and the TPO Why this Report? There is a rapidly growing demand for travel Aviation is a significant
Finnair Q result. 25 October 2017 CEO Pekka Vauramo
 Finnair Q3 2017 result 25 October 2017 CEO Pekka Vauramo 1 All-time best quarter Revenue up by 15% to record level of 735 M Aircraft flew full, passenger load factor was 87% Asian routes and San Francisco
TURKISH AIRLINES. 4Q 15 Results Summary. 1Q 14 Results
 TURKISH AIRLINES 4Q 15 Results Summary 1Q 14 Results 1 Key Financial Data 4Q'14 4Q'15 Change (USD mn) 2014 2015 Change 2,530 2,468-2.5% Revenue 11,070 10,522-5.0% 2,209 2,171-1.7% Passenger Revenue 9,858
TURKISH AIRLINES. 4Q 15 Results Summary. 1Q 14 Results
 TURKISH AIRLINES 4Q 15 Results Summary 1Q 14 Results 1 Key Financial Data 4Q'14 4Q'15 Change (USD mn) 2014 2015 Change 2,530 2,468-2.5% Revenue 11,070 10,522-5.0% 2,209 2,171-1.7% Passenger Revenue 9,858
Front cover picture: London, United Kingdom
 EUROPEAN CITIES MONITOR 2007 Front cover picture: London, United Kingdom EUROPEAN CITIES MONITOR Introduction Cushman & Wakefield has conducted this survey on Europe s major business cities each year since
Information meeting. 12 September 2011
 Information meeting 12 September 2011 Full Year 2010-11 key data April 2010-March 2011 Revenues in billions Operating result in millions 77% Passenger 18.10 +11.3% -44 +874 13% Cargo 3.16 +29.5% +69 +505
BOARD ACTIVITY REPORT
 Page : 1 PURSUANT TO THE COMMUNIQUE SERIAL II. NO.17.1 PRINCIPLES 1 JANUARY 31 MARCH 2017 Page : 2 PURSUANT TO THE COMMUNIQUE SERIAL II. NO.17.1 PRINCIPLES TABLE OF CONTENTS 1. INDUSTRY DEVELOPMENTS...
JET AIRWAYS (I) LTD. Presentation on Financial Results Q4 FY08
 LTD. Presentation on Financial Results Q4 FY08") JET AIRWAYS (I) LTD Presentation on Financial Results Q4 FY08 June 24, 2008 1 1 1 Agenda Domestic operating environment Jet Airways performance highlights JetLite performance highlights Consolidated Jet
JET AIRWAYS (I) LTD Presentation on Financial Results Q4 FY08 June 24, 2008 1 1 1 Agenda Domestic operating environment Jet Airways performance highlights JetLite performance highlights Consolidated Jet
The Presence of Intesa Sanpaolo in the META Region
 The Presence of Intesa Sanpaolo in the META Region Milan, 11 October 2017 Agenda 1 Intesa Sanpaolo and the Group's International Network Intesa Sanpaolo's Support for Internationalization The Presence
HKS on the Road In-Person Information Sessions
 HKS on the Road 2016 In-Person Information Sessions United States San Francisco, California - January 5 New Orleans, LA - June 26 (student-led session) Detroit, MI - July 7 San Francisco, California -
ENHANCING AIR TRANSPORT CONNECTIVITY. Section 7: Taxes, Fees and Charges. Dr. Elijah Chingosho Secretary General AFRICAN AIRLINES ASSOCIATION
 ENHANCING AIR TRANSPORT CONNECTIVITY Section 7: Taxes, Fees and Charges By Dr. Elijah Chingosho Secretary General AFRICAN AIRLINES ASSOCIATION 22 SEPTEMBER 2013 Montreal, Canada INTRODUCTION On average,
airbaltic Ambient Media 2015 More ways of reaching the most desirable audience!
 airbaltic 2015 More ways of reaching the most desirable audience! Table of contents 3 4 5 6 7 8 9 10 15 16 AirBaltic was founded in 1995. Core values are safety, punctuality, service and good price. AirBaltic
Information meeting. September 2011
 Information meeting September 2011 Full Year 2010-11 key data April 2010-March 2011 Revenues in billions Operating result in millions 77% Passenger 18.10 +11.3% -44 +874 13% Cargo 3.16 +29.5% +69 +505
Cathay Pacific Vantage Pass 2019
 Cathay Pacific Vantage Pass 2019 1. Select the destination for your first round-trip ticket. Note the distance zone, preferred class and fare. 2. Select the destination for your second round-trip ticket.
BUS TBS BATUMI AIRPORT TIBLISI AIRPORT TBS BUS
 BUS BATUMI AIRPORT TBS TIBLISI AIRPORT BUS TBS TBILISI & BATUMI S BACKGROUND TBS, located in the capital city Tbilisi; and BUS, located in the city of Batumi on the Black Sea coast in the south west of