Rocky Mountain Crude Oil Market Dynamics. Tad True, Belle Fourche & Bridger Pipelines Wyoming Pipeline Authority October 26, 2010
|
|
|
- Ferdinand McKenzie
- 6 years ago
- Views:
Transcription

1 Rocky Mountain Crude Oil Market Dynamics Tad True, Belle Fourche & Bridger Pipelines Wyoming Pipeline Authority October 26, 2010
2 Agenda & Introduction Logistical Constraints for Rockies Production: Inter Region Constraints: Getting Barrels out of the Rockies Intra Region Constraints: Getting Barrels out of the Williston Basin Lease Constraints: Getting Barrels off the Lease Baker 300
3 Getting Barrels out of the Rockies INTER-REGION CONSTRAINTS
4 Rocky Mountain Crude Complex Hardisty, AB Regina, SK Great Falls, MT Montana Refining 8,200 Clearbrook, MN Salt Lake City, UT Big West 25,000 ChevronTexaco 45,000 Holly Corp 25,000 Silver Eagle Refining 12,500 Tesoro 60,000 Billings, MT ConocoPhillips 58,000 ExxonMobil 60,000 Cenex 56,000 Reno Jct., WY Casper, WY Sinclair 22,500 Rawlins, WY Sinclair 72,000 Newcastle, WY Wyoming Refining 12,500 Guernsey, WY Cheyenne, WY Frontier 52,000 Denver, CO Suncor 88,000 Mandan, ND Tesoro 58,000 McPherson, KS NCRA 79,000 El Dorado, KS Frontier 110,000 St. Paul, MN Flint Hills Resources 298,000 MarathonAshland 70,000 Chicago, IL ExxonMobil 238,000 BP PLC 399,000 CITGO 159,000 Wood River, IL ConocoPhillips 306,000 Cushing, OK

5 Rocky Mountain Crude Complex Hardisty, AB 1,300,000 Pipeline Export Capacity Regina, SK 1,100,000 Great Falls, MT Montana Refining 8,200 Clearbrook, MN 900, , ,000 Billings, MT ConocoPhillips 58,000 ExxonMobil 60,000 Cenex 56,000 Reno Jct., WY Casper, WY Sinclair 22,500 Rawlins, WY Sinclair 72,000 Newcastle, WY Wyoming Refining 12,500 Guernsey, WY Cheyenne, WY Frontier 52,000 Mandan, ND Tesoro 58,000 St. Paul, MN Flint Hills Resources 298,000 MarathonAshland 70,000 Chicago, IL ExxonMobil 238,000 BP PLC 399,000 CITGO 159, ,000 Denver, CO Suncor 88, , ,000 Enbridge Platte White Cliffs
6 Rocky Mountain Crude Complex Hardisty, AB Regina, SK 1,300,000 Pipeline Export Capacity + Refinery Consumption 1,100,000 Great Falls, MT Montana Refining 8,200 Clearbrook, MN 900, , ,000 Billings, MT ConocoPhillips 58,000 ExxonMobil 60,000 Cenex 56,000 Reno Jct., WY Casper, WY Sinclair 22,500 Rawlins, WY Sinclair 72,000 Newcastle, WY Wyoming Refining 12,500 Guernsey, WY Cheyenne, WY Frontier 52,000 Mandan, ND Tesoro 58,000 St. Paul, MN Flint Hills Resources 298,000 MarathonAshland 70,000 Chicago, IL ExxonMobil 238,000 BP PLC 399,000 CITGO 159, ,000 Denver, CO Suncor 88, , ,000 Enbridge Platte White Cliffs Refinery Consumption TRADITIONAL TAKE AWAY CAPACITY
7 Material Balance with Traditional Takeaway 1,300,000 Options 1,100, , , ,000 Imports 300,000 Rocky Mountain Production 100,000 (100,000) Jan-03 Jul-03 Jan-04 Jul-04 Jan-05 Jul-05 Jan-06 Jul-06 Jan-07 Jul-07 Jan-08 Jul-08 Jan-09 Jul-09 Jan-10 Rocky Mountain Production Imports TRADITIONAL TAKE AWAY CAPACITY

8 Non-Traditional Crude Takeaway Options Rail


9 Material Balance with Non-Traditional Takeaway Options 1,300,000 1,300,000 1,100,000 1,100, , , , ,000 1 st ND Rail Facility 500, ,000 White Cliffs More Rail Enbridge Phase VI 500, , , ,000 (100,000) -100,000 Rocky Mountain Production Imports TRADITIONAL TAKE AWAY CAPACITY NON-TRADITIONAL TAKE AWAY CAPACITY


10 Material Balance with Non-Traditional Take- Away Options 1,400,000 1,400,000 1,200,000 1,200,000 1,000,000 1,000, , , , , ,000 Keystone Effect New Rail Facilities Baker Keystone XL Connection 600, , ,000-0 Rocky Mountain Production Imports TRADITIONAL TAKE AWAY CAPACITY NON-TRADITIONAL TAKE AWAY CAPACITY
11 Inter-Region Constraints After Planned Pipeline Export Options in addition to Non-Traditional Facilities, Rockies has sufficient, but inefficient takeaway capacity. Continuing Concerns Non-Traditional Options are expensive Intra-Regional Transportation Constraints Lease Transportation Constraints
12 Moving Barrels Out of the Williston Basin INTRA-REGIONAL CONSTRAINTS


13 Rocky Mountain Crude Complex Intra-Regional Constraints 161,000
14 Moving Barrels off the lease LEASE CONSTRAINTS

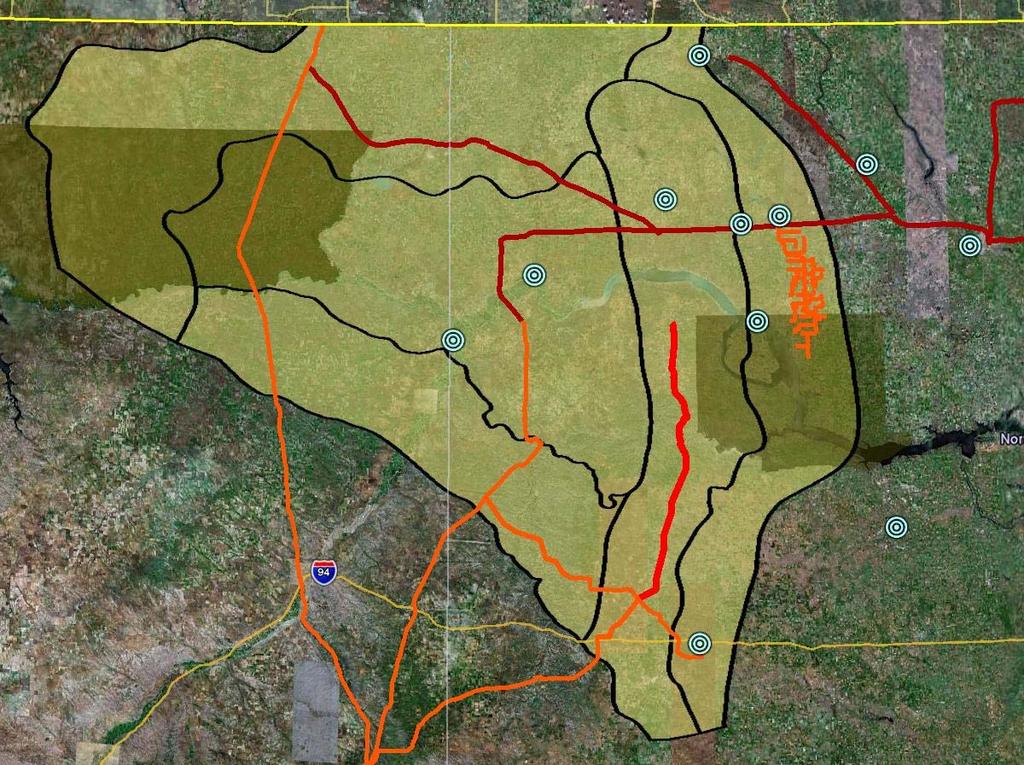
15 Mountrail McKenzie Dunn PICTURE OF MOUNTRAIL, DUNN AND MCKENZIE
16 Mountrail, Dunn & McKenzie Counties 250, , , ,000 50,000 - MOUNTRAIL McKENZIE DUNN Dec-09 Jul-10 Jan-00 Aug-00 Mar-01 Oct-01 May-02 Dec-02 Jul-03 Feb-04 Sep-04 Apr-05 Nov-05 Jun-06 Jan-07 Aug-07 Mar-08 Oct-08 May-09

17 Transportation Costs Total Est. Cost To Guernsey: ~$8 TODAY ~$2 ~$6
18 Transportation Costs Total Est. Cost To Guernsey: ~$4.10 Four Bears ~$1.5 ~$2.60
19 Solutions BAKER 300
20 Overview Raymond Stanley 300,000 Montana BPD INTO BAKER Alexander Poplar Fisher Hwy 201 Richey Glendive Fryburg Bridger Parshall Gathering Mandan North Dakota Billings Baker 300,000 BPD OUT Wyoming OF BAKER Reno Jct. Powder River Osage Mush Creek Alzada Newcastle South Dakota Casper Rawlins Ft. Laramie/ Guernsey Nebraska Cheyenne
21 Project Overview Baker Balance: 2010 Raymond Stanley 130,000 Montana BPD INTO BAKER Alexander Poplar Fisher Hwy 201 Richey Glendive Fryburg Bridger Parshall Gathering Mandan North Dakota Billings Baker 140,000 BPD OUT OF BAKER Wyoming Reno Jct. Powder River Osage Mush Creek Alzada Newcastle South Dakota Casper Rawlins Ft. Laramie/ Guernsey Nebraska Cheyenne


22 Project Overview Baker Balance: 2011 Raymond Stanley 190,000 Montana BPD INTO BAKER Alexander Poplar Fisher Hwy 201 Richey Glendive Fryburg Bridger Parshall Gathering Mandan North Dakota Billings Baker 170,000 BPD OUT OF BAKER Wyoming Reno Jct. Powder River Osage Mush Creek Alzada Newcastle South Dakota Casper Rawlins Ft. Laramie/ Guernsey Nebraska Cheyenne


23 Project Overview Baker Balance: 2012 Raymond Stanley 240,000 Montana BPD INTO BAKER Alexander Poplar Fisher Hwy 201 Richey Glendive Fryburg Bridger Parshall Gathering Mandan North Dakota Billings Baker 200,000 BPD OUT OF BAKER Wyoming Reno Jct. Powder River BFPL: 30,000 Osage Mush Creek Alzada Newcastle South Dakota Casper Rawlins Ft. Laramie/ Guernsey Nebraska Cheyenne


24 Project Overview Baker Balance: 2013 Raymond Stanley 300,000 Montana BPD INTO BAKER Alexander Poplar Fisher Hwy 201 Richey Glendive Fryburg Bridger Parshall Gathering Mandan North Dakota Billings Baker 300,000 BPD OUT OF BAKER Wyoming Reno Jct. Powder River Osage Mush Creek Alzada Newcastle South Dakota Casper Rawlins Ft. Laramie/ Guernsey Nebraska Cheyenne
25 Baker 300 Summary Inter Regional Constraints: Keystone XL Connection: 100,000 Intra Region Constraints: Butte Expansion: 32,000bpd Belle Fourche Loop: 50,000bpd Lease Constraints: With existing lines and Four Bears, most producing wells in western North Dakota will be no farther than 30 miles from pipeline access.
26 Rocky Mountain Crude Oil Market Dynamics Tad True, Belle Fourche & Bridger Pipelines Wyoming Pipeline Authority October 26, 2010
Pipeline Capacity and the Crude Differential. A Presentation to the Wyoming Pipeline Authority Tuesday, April 25, 2006
 Pipeline Capacity and the Crude Differential A Presentation to the Wyoming Pipeline Authority Tuesday, April 25, 2006 Hardisty, AB Regina, SK Great Falls, MT Montana Refining 8,200 Clearbrook, MN Salt
True Pipeline System Montana, North Dakota and Wyoming
 True Pipeline System, North Dakota and Wyoming Stanley Saskatchewan Raymond Alexander Hwy 23 Parshall Fields Poplar North Dakota Hwy 200 Skunk Hill Killdeer Gathering Hwy 22 Dickinson Bakken Oil Express
January 2018 Air Traffic Activity Summary
 January 2018 Air Traffic Activity Summary Jan-2018 Jan-2017 CY-2018 CY-2017 Passengers 528,947 505,421 4.7% 528,947 505,421 4.7% Passengers 537,332 515,787 4.2% 537,332 515,787 4.2% Passengers 1,066,279
Coal Network Update. Jason Plett MANAGER, COAL MARKETING MARCH 14, 2018
 Coal Network Update Jason Plett MANAGER, COAL MARKETING MARCH 14, 2018 BNSF is a Leading U.S. Railroad Berkshire Hathaway company 41,000 employees 32,500 route miles in 28 states and three Canadian provinces
August 2014 Passenger and Cargo Traffic Statistics Reno-Tahoe International Airport
 August 2014 Passenger and Cargo Traffic Statistics Reno-Tahoe International Airport October 8, 2014 U.S. DOMESTIC INDUSTRY OVERVIEW FOR AUGUST 2014 All RNO Carriers Domestic Systemwide year over year comparison
Passenger and Cargo Statistics Report
 Passenger and Cargo Statistics Report RenoTahoe International Airport July 2017 U.S. DOMESTIC INDUSTRY OVERVIEW FOR JULY 2017 Systemwide RNO Carriers Domestic Flights year over year comparison Average
Passenger and Cargo Statistics Report
 Passenger and Cargo Statistics Report RenoTahoe International Airport June 2017 U.S. DOMESTIC INDUSTRY OVERVIEW FOR JUNE 2017 All RNO Carriers Domestic Systemwide year over year comparison Average Load
U.S. DOMESTIC INDUSTRY OVERVIEW FOR OCTOBER 2010 All RNO Carriers Systemwide year over year comparison
 Inter-Office Memo Reno-Tahoe Airport Authority Date: November 22, 2010 To: Chairman and Board of Trustees From: Krys T. Bart, A.A.E., President/CEO Subject: RENO-TAHOE INTERNATIONAL AIRPORT OCTOBER 2010
Passenger and Cargo Statistics Report
 Passenger and Cargo Statistics Report RenoTahoe International Airport July 2018 U.S. DOMESTIC INDUSTRY OVERVIEW FOR JULY 2018 Systemwide RNO Carriers Domestic Flights year over year comparison Average
Passenger and Cargo Statistics Report
 Passenger and Cargo Statistics Report RenoTahoe International Airport June 2018 U.S. DOMESTIC INDUSTRY OVERVIEW FOR JUNE 2018 Systemwide RNO Carriers Domestic Flights year over year comparison Average
Passenger and Cargo Statistics Report
 Passenger and Cargo Statistics Report RenoTahoe International Airport April 2018 U.S. DOMESTIC INDUSTRY OVERVIEW FOR APRIL 2018 Systemwide RNO Carriers Domestic Flights year over year comparison Average
Passenger and Cargo Statistics Report
 Passenger and Cargo Statistics Report RenoTahoe International Airport November 2017 U.S. DOMESTIC INDUSTRY OVERVIEW FOR NOVEMBER 2017 Systemwide RNO Carriers Domestic Flights year over year comparison
Passenger and Cargo Statistics Report
 Passenger and Cargo Statistics Report RenoTahoe International Airport May 2018 U.S. DOMESTIC INDUSTRY OVERVIEW FOR MAY 2018 Systemwide RNO Carriers Domestic Flights year over year comparison Average Load
Passenger and Cargo Statistics Report
 Passenger and Cargo Statistics Report RenoTahoe International Airport January 2018 U.S. DOMESTIC INDUSTRY OVERVIEW FOR JANUARY 2018 Systemwide RNO Carriers Domestic Flights year over year comparison Average
Passenger and Cargo Statistics Report
 Passenger and Cargo Statistics Report RenoTahoe International Airport September 2018 U.S. DOMESTIC INDUSTRY OVERVIEW FOR SEPTEMBER 2018 Systemwide RNO Carriers Domestic Flights year over year comparison
Passenger and Cargo Statistics Report
 Passenger and Cargo Statistics Report RenoTahoe International Airport February 2018 U.S. DOMESTIC INDUSTRY OVERVIEW FOR FEBRUARY 2018 Systemwide RNO Carriers Domestic Flights year over year comparison
November 2013 Passenger and Cargo Traffic Statistics Reno-Tahoe International Airport
 November 2013 Passenger and Cargo Traffic Statistics Reno-Tahoe International Airport December 26, 2013 U.S. DOMESTIC INDUSTRY OVERVIEW FOR NOVEMBER 2013 All RNO Carriers Domestic Systemwide year over
Passenger and Cargo Statistics Report
 Passenger and Cargo Statistics Report Reno-Tahoe International Airport October 2018 U.S. DOMESTIC INDUSTRY OVERVIEW FOR OCTOBER 2018 Systemwide RNO Carriers Domestic Flights year over year comparison Average
Passenger and Cargo Statistics Report
 Passenger and Cargo Statistics Report RenoTahoe International Airport September 2017 U.S. DOMESTIC INDUSTRY OVERVIEW FOR SEPTEMBER 2017 Systemwide RNO Carriers Domestic Flights year over year comparison
December 2013 Passenger and Cargo Traffic Statistics Reno-Tahoe International Airport
 December 2013 Passenger and Cargo Traffic Statistics Reno-Tahoe International Airport January 24, 2014 U.S. DOMESTIC INDUSTRY OVERVIEW FOR DECEMBER 2013 All RNO Carriers Domestic Systemwide year over year
Passenger and Cargo Statistics Report
 Passenger and Cargo Statistics Report Reno-Tahoe International Airport December 2014 U.S. DOMESTIC INDUSTRY OVERVIEW FOR DECEMBER 2014 All RNO Carriers Domestic Systemwide year over year comparison Average
March 2014 Passenger and Cargo Traffic Statistics Reno-Tahoe International Airport
 March 2014 Passenger and Cargo Traffic Statistics Reno-Tahoe International Airport April 25, 2014 U.S. DOMESTIC INDUSTRY OVERVIEW FOR MARCH 2014 All RNO Carriers Domestic Systemwide year over year comparison
July 2012 Passenger and Cargo Traffic Statistics Reno-Tahoe International Airport
 July 2012 Passenger and Cargo Traffic Statistics Reno-Tahoe International Airport August 31, 2012 U.S. DOMESTIC INDUSTRY OVERVIEW FOR JULY 2012 All RNO Carriers Systemwide year over year comparison Average
May 2011 Passenger and Cargo Traffic Statistics Reno-Tahoe International Airport
 May 2011 Passenger and Cargo Traffic Statistics Reno-Tahoe International Airport July 5, 2011 U.S. DOMESTIC INDUSTRY OVERVIEW FOR MAY 2011 All RNO Carriers Systemwide year over year comparison Average
Phillips 66 Company. F.E.R.C. Tariff Index For the Following Pipeline Entities:
 Phillips 66 Company F.E.R.C. Tariff Index For the Following Pipeline Entities: Chisholm Pipeline Company Heartland Pipeline Company Phillips 66 Carrier LLC Phillips 66 Pipeline LLC Phillips 66 Sweeny-Freeport
December 2012 Passenger and Cargo Traffic Statistics Reno-Tahoe International Airport
 December 2012 Passenger and Cargo Traffic Statistics Reno-Tahoe International Airport January 29, 2013 U.S. DOMESTIC INDUSTRY OVERVIEW FOR DECEMBER 2012 All RNO Carriers Systemwide year over year comparison
October 2013 Passenger and Cargo Traffic Statistics Reno-Tahoe International Airport
 October 2013 Passenger and Cargo Traffic Statistics Reno-Tahoe International Airport December 4, 2013 U.S. DOMESTIC INDUSTRY OVERVIEW FOR OCTOBER 2013 All RNO Carriers Systemwide year over year comparison
MAGELLAN PIPELINE COMPANY, L.P. FERC TARIFF INDEX
 MAGELLAN PIPELINE COMPANY, L.P. FERC TARIFF INDEX This Index contains a list of FERC tariffs in effect as of July 1, 2017 Compiled By: Tina R. Granger, Pipeline Tariffs MAGELLAN PIPELINE COMPANY, L.P.
PLAINS PIPELINE, L.P.
 PLAINS PIPELINE, L.P. TARIFF INDEX This index contains a list of FERC tariffs in effect as of February 12, 2016 FERC 70.0.0 PPLP Adoption Notice 71.6.0 PPLP Rules and Regulations 72.17.0 PPLP 73.12.0 PPLP
Passenger and Cargo Statistics Report
 Passenger and Cargo Statistics Report RenoTahoe International Airport December 2016 U.S. DOMESTIC INDUSTRY OVERVIEW FOR DECEMBER 2016 All RNO Carriers Domestic Systemwide year over year comparison Average
September 2013 Passenger and Cargo Traffic Statistics Reno-Tahoe International Airport
 September 2013 Passenger and Cargo Traffic Statistics Reno-Tahoe International Airport October 31, 2013 U.S. DOMESTIC INDUSTRY OVERVIEW FOR SEPTEMBER 2013 All RNO Carriers Systemwide year over year comparison
Passenger and Cargo Statistics Report
 Passenger and Cargo Statistics Report RenoTahoe International Airport January 2017 U.S. DOMESTIC INDUSTRY OVERVIEW FOR JANUARY 2017 All RNO Carriers Domestic Systemwide year over year comparison Average
January 2014 Passenger and Cargo Traffic Statistics Reno-Tahoe International Airport
 January 2014 Passenger and Cargo Traffic Statistics Reno-Tahoe International Airport March 12, 2014 U.S. DOMESTIC INDUSTRY OVERVIEW FOR DECEMBER 2013 All RNO Carriers Domestic Systemwide year over year
Passenger and Cargo Statistics Report
 Passenger and Cargo Statistics Report RenoTahoe International Airport September 2015 U.S. DOMESTIC INDUSTRY OVERVIEW FOR SEPTEMBER 2015 All RNO Carriers Domestic Systemwide year over year comparison Average
Passenger and Cargo Statistics Report
 Passenger and Cargo Statistics Report RenoTahoe International Airport August 2015 U.S. DOMESTIC INDUSTRY OVERVIEW FOR AUGUST 2015 All RNO Carriers Domestic Systemwide year over year comparison Average
Airport Noise Advisory Panel (ANAP)
") Airport Noise Advisory Panel (ANAP) Scheduled Daily Passenger Airlines Departures * 2012 - Reno-Tahoe International Airport (RNO) April (60 + 1 non-stop departures) Continental discontinued their non-stop
Airport Noise Advisory Panel (ANAP) Scheduled Daily Passenger Airlines Departures * 2012 - Reno-Tahoe International Airport (RNO) April (60 + 1 non-stop departures) Continental discontinued their non-stop
Table of Contents PAGE
 DECEMBER 2018 EL PASO INTERNATIONAL AIRPORT MONTHLY ACTIVITY REPORT December 2018 Table of Contents PAGE AIRPORT ACTIVITY OVERVIEW 1 NONSTOP DESTINATION ANALYSIS 2 MAP OF NONSTOP DESTINATIONS 3 FLIGHT
MAGELLAN PIPELINE COMPANY, L.P. FERC TARIFF INDEX
 MAGELLAN PIPELINE COMPANY, L.P. FERC TARIFF INDEX This Index contains a list of FERC tariffs in effect as of July 1, 2018 Compiled By: Tina R. Granger, Pipeline Tariffs MAGELLAN PIPELINE COMPANY, L.P.
Table of Contents PAGE
 OCTOBER 2018 EL PASO INTERNATIONAL AIRPORT MONTHLY ACTIVITY REPORT October 2018 Table of Contents PAGE AIRPORT ACTIVITY OVERVIEW 1 NONSTOP DESTINATION ANALYSIS 2 MAP OF NONSTOP DESTINATIONS 3 FLIGHT SCHEDULE
Table of Contents PAGE
 NOVEMBER 2018 EL PASO INTERNATIONAL AIRPORT MONTHLY ACTIVITY REPORT November 2018 Table of Contents PAGE AIRPORT ACTIVITY OVERVIEW 1 NONSTOP DESTINATION ANALYSIS 2 MAP OF NONSTOP DESTINATIONS 3 FLIGHT
Passenger and Cargo Statistics Report
 Passenger and Cargo Statistics Report RenoTahoe International Airport September 2016 U.S. DOMESTIC INDUSTRY OVERVIEW FOR SEPTEMBER 2016 All RNO Carriers Domestic Systemwide year over year comparison Average
December 2011 Passenger and Cargo Traffic Statistics Reno-Tahoe International Airport
 December 2011 Passenger and Cargo Traffic Statistics Reno-Tahoe International Airport January 27, 2012 U.S. DOMESTIC INDUSTRY OVERVIEW FOR DECEMBER 2011 All RNO Carriers Systemwide year over year comparison
Passenger and Cargo Statistics Report
 Passenger and Cargo Statistics Report RenoTahoe International Airport December 2015 U.S. DOMESTIC INDUSTRY OVERVIEW FOR DECEMBER 2015 All RNO Carriers Domestic Systemwide year over year comparison Average
LOUIS ARMSTRONG NEW ORLEANS INTERNATIONAL AIRPORT For the Period Ending September 30, Enplaned Passengers by Airline
 Domestic Scheduled Enplaned Passengers by Airline Alaska Airlines 7,070 4,331 63.2% 59,552 42,265 40.9% 1.2% 1.0% Virgin America 0 803-100.0% 12,231 803 1423.2% 0.3% 0.0% Allegiant Air 1,333 2,063-35.4%
Hector International Airport
 Hector International Airport Data Acquired via OAG on October 2, 216 Volume 3-17 April 216 thru March 217 (Scheduled Flights Only) October 2, 216 1.% 5.% 5.8% 5.% 3.5% 5.% 6.8%.5%.% -5.% -3.9% -1.4% -2.9%
DTTAS Quarterly Aviation Statistics Snapshot Quarter Report
 Contents DTTAS Quarterly Aviation Statistics Snapshot Quarter 4 2015 Report 1.1 Dublin Airport Key Statistics... 1 1.2 Cork Airport Key Statistics... 3 1.3 Shannon Airport Key Statistics... 5 1.4 Total
Airport Noise Advisory Panel (ANAP)
") Airport Noise Advisory Panel (ANAP) Scheduled Daily Passenger Airlines Departures * 2011 - Reno-Tahoe International Airport (RNO) July (71 non-stop departures) Delta Airlines added one (1) non-stop to
Airport Noise Advisory Panel (ANAP) Scheduled Daily Passenger Airlines Departures * 2011 - Reno-Tahoe International Airport (RNO) July (71 non-stop departures) Delta Airlines added one (1) non-stop to
DTTAS Quarterly Aviation Statistics Snapshot Quarter Report
 Contents DTTAS Quarterly Aviation Statistics Snapshot Quarter 3 2018 Report 1.1 Dublin Airport Key Statistics... 1 1.2 Cork Airport Key Statistics... 3 1.3 Shannon Airport Key Statistics... 5 1.4 Total
DTTAS Quarterly Aviation Statistics Snapshot Quarter Report
 Contents DTTAS Quarterly Aviation Statistics Snapshot Quarter 1 2018 Report 1.1 Dublin Airport Key Statistics... 1 1.2 Cork Airport Key Statistics... 3 1.3 Shannon Airport Key Statistics... 5 1.4 Total
U.S. DOMESTIC INDUSTRY OVERVIEW FOR MARCH
 Inter-Office Memo Reno-Tahoe Airport Authority Date: April 30, 2009 To: Statistics Recipients From: Krys T. Bart, A.A.E., President/CEO Subject: RENO-TAHOE INTERNATIONAL AIRPORT PASSENGER STATISTICS U.S.
MARKET NEWSLETTER No 57 January 2012
 OVERVIEW OF INTRA-EUROPEAN UNION TRADING BETWEEN 2007/08 AND 2010/11 The data on intra-eu trade reported in this month s newsletter have been taken from the EUROSTAT database. However, it is important
SJC North and South Flow
 SJC North and South Flow Pre and Post OAPM Date: January 2018 Phases of Flight ATCC ARTCC ATCC 2 AviationTerms VFR- Visual Flight Rules. Pilots must maneuver to avoid clouds and are responsible for their
Inter-Office Memo Reno-Tahoe Airport Authority
 Inter-Office Memo Reno-Tahoe Airport Authority Date: November 30, 2009 To: Statistics Recipients From: Krys T. Bart, A.A.E., President/CEO Subject: RENO-TAHOE INTERNATIONAL AIRPORT PASSENGER STATISTICS
REFINED PRODUCTS ONLY
 REFINED PRODUCTS ONLY The following Rate Summary is provided only as a reference tool. It does not supersede in any way MPL's published tariffs. Please refer to the following tariffs for other Rules, Regulations,
HOTEL INDUSTRY OVERVIEW. Texas
 HOTEL INDUSTRY OVERVIEW Texas DEMAND GROWTH STRONG BALANCED OCC & ADR GROWTH % Change Room Supply* 149M 1.3% Room Demand* 92M 5.6% Occupancy 61.6% 4.3% A.D.R. $90 4.4% RevPAR $55 8.9% Room Revenue* $8.3B
2016 Commercial Real Estate. Review and Forecast
 2016 Commercial Real Estate Review and Forecast February 4, 2016 Colliers International Saskatchewan Economic Overview Real GDP Growth 6.0% 2014 2015 2016f 5.0% 4.0% 3.0% 2.0% 1.0% 0.0% -1.0% Vancouver
LOUIS ARMSTRONG NEW ORLEANS INTERNATIONAL AIRPORT For the Period Ending August 31, Enplaned Passengers by Airline
 Enplaned Passengers by Airline Domestic Scheduled Alaska Airlines 3,797 4,077-6.9% 36,538 35,188 3.8% 1.0% 1.0% Allegiant Air 5,698 743 666.9% 41,738 14,843 181.2% 1.1% 0.4% American Airlines (US Air)
The Geography of Climate
 The Geography of Climate Objective for Today: Today we will examine ways that latitude and landforms influence climate The focus of our study will be the South American Continent in the Formal Region known
Table of Contents PAGE
 April 2015 EL PASO INTERNATIONAL AIRPORT MONTHLY ACTIVITY REPORT April 2015 Table of Contents PAGE AIRPORT ACTIVITY OVERVIEW 1 NONSTOP DESTINATION ANALYSIS 2 MAP OF NONSTOP DESTINATIONS 3 FLIGHT SCHEDULE
Hotel Industry Performance Overview Washington Lodging Convention
 Hotel Industry Performance Overview Washington Lodging Convention Valerie Woods Director of Business Development, Hotels vwoods@str.com Valerie_STR 2016 STR, Inc. All Rights Reserved. Any reprint, use
BLUE MAN Route Wk # DAY / DATE CITY / STATE SHOW- TIMES
 Wk # DAY / DATE CITY / STATE SHOW- 1 2 3 4 5 4-Jul-11 Tue 5-Jul-11 6-Jul-11 ONDON, ON 7:30PM 1 abatt Centre 7-Jul-11 ONDON, ON 7:30PM 1 8-Jul-11 HAMITON, ON 8:00PM 1 Hamilton Place 9-Jul-11 HAMITON, ON
Table of Contents PAGE
 FEBRUARY 2018 EL PASO INTERNATIONAL AIRPORT MONTHLY ACTIVITY REPORT February 2018 Table of Contents PAGE AIRPORT ACTIVITY OVERVIEW 1 NONSTOP DESTINATION ANALYSIS 2 MAP OF NONSTOP DESTINATIONS 3 FLIGHT
BNSF RAILWAY COMPANY ISSUED: JUL 13, 2010 BOOK: 2 AG PRODUCTS UNIT
 BNSF RAILWAY COMPANY ISSUED: JUL 13, 2010 AG PRODUCTS UNIT EFFECTIVE: JUL 15, 2010 P O BOX 961051 PAGE: 01 FORT WORTH, TX 76161-0051 REVISION: 152 BNSF-4022-M ITEM: 00000 TARIFF REVISION TRANSMITTAL NOTICE
U.S. DOMESTIC INDUSTRY OVERVIEW FOR MAY 2009
 Inter-Office Memo Reno-Tahoe Airport Authority Date: June 30, 2009 To: Statistics Recipients From: Krys T. Bart, A.A.E., President/CEO Subject: RENO-TAHOE INTERNATIONAL AIRPORT PASSENGER STATISTICS U.S.
Naples, Marco Island, Everglades Convention and Visitors Bureau January 2016 Visitor Profile
 RESEARCH DATA SERVICES, INC. 777 SOUTH HARBOUR ISLAND BOULEVARD SUITE 260 TAMPA, FLORIDA 33602 TEL (813) 254-2975 FAX (813) 223-2986 Naples, Marco Island, Everglades Convention and Visitors Bureau January
U.S. Army Corps of Engineers Wilmington District
 U.S. Army Corps of Engineers Wilmington District 2012 East Coast - WEDA October 9-11, 2012 Ongoing & Upcoming Contracts US Army Corps of Engineers Wilmington District Ongoing Contracts Project Quantity
Yukon Bureau of Statistics
 Yukon Bureau of Statistics 2 9 # 1 $ > 0-2 + 6 & ± 8 < 3 π 7 5 9 1 ^ 1 Retail Motor Fuel Prices in the Yukon Average prices as of May 20 th, 2009 Self-serve regular premium diesel Whitehorse 99.5 105.9
Beautiful Property in Cinnamon Ridge with Amazing Views - Walk to the...
 Beautiful Property in Cinnamon Ridge with Amazing Views - Walk to the... Summary 2 BR 2 Bath Condo - sleeps up to 7 Description C212 Cinnamon Ridge - a SkyRun Keystone Property With views like this you
April 2012 Visitor Profile
 RESEARCH DATA SERVICES, INC. 777 SOUTH HARBOUR ISLAND BOULEVARD SUITE 260 TAMPA, FLORIDA 33602 TEL (813) 254-2975 FAX (813) 223-2986 Naples, Marco Island, Everglades Convention and Visitors Bureau April
Naples, Marco Island, Everglades Convention and Visitors Bureau February 2017 Visitor Profile
 RESEARCH DATA SERVICES, INC. 777 SOUTH HARBOUR ISLAND BOULEVARD SUITE 260 TAMPA, FLORIDA 33602 TEL (813) 254-2975 FAX (813) 223-2986 Naples, Marco Island, Everglades Convention and Visitors Bureau February
COURSE DATES & PRICES 2019 NORTH AMERICA
 COURSE DATES & PRICES 2019 NORTH AMERICA SANTA MONICA SHORT TERM - CUT DURATION DAYS OF THE WEEK START DATES ABC CUT 1 5 DAYS MONDAY - FRIDAY Jan 7, 14 Feb 4, 18 Mar 4, 11 Apr 1, 15, 22 May 6, 20 Jun 3,
COURSE DATES & PRICES 2019 NORTH AMERICA
 COURSE DATES & PRICES 2019 NORTH AMERICA SANTA MONICA SHORT TERM - CUT DURATION DAYS OF THE WEEK START DATES ABC CUT 1 5 DAYS MONDAY - FRIDAY Jan 7, 14 Feb 4, 18 Mar 4, 11 Apr 1, 15, 22 May 6, 20 Jun 3,
Naples, Marco Island, Everglades Convention and Visitors Bureau December 2017 Visitor Profile
 RESEARCH DATA SERVICES, INC. 777 SOUTH HARBOUR ISLAND BOULEVARD SUITE 260 TAMPA, FLORIDA 33602 TEL (813) 254-2975 FAX (813) 223-2986 Naples, Marco Island, Everglades Convention and Visitors Bureau December
Naples, Marco Island, Everglades Convention and Visitors Bureau March 2018 Visitor Profile
 RESEARCH DATA SERVICES, INC. 777 SOUTH HARBOUR ISLAND BOULEVARD SUITE 2 TAMPA, FLORIDA 332 TEL (813) 254-2975 FAX (813) 223-2986 Naples, Marco Island, Everglades Convention and Visitors Bureau March 2018
Number of tourism trips of residents increased namely for leisure
 Tourism Demand of Residents 1 st Quarter 2018 25 July 2018 Number of tourism trips of residents increased namely for leisure In the 1 st quarter 2018, residents in Portugal took a total of 4.5 million
Naples, Marco Island, Everglades Convention and Visitors Bureau June 2018 Visitor Profile
 RESEARCH DATA SERVICES, INC. 777 SOUTH HARBOUR ISLAND BOULEVARD SUITE 260 TAMPA, FLORIDA 33602 TEL (813) 254-2975 FAX (813) 223-2986 Naples, Marco Island, Everglades Convention and Visitors Bureau June
Airline industry outlook remains fragile
 Airline industry outlook remains fragile June 2009 www.iata.org/economics To represent, lead and serve the airline industry Airline industry outlook remains fragile Green shoots starting to appear Recovery
Naples, Marco Island, Everglades Convention and Visitors Bureau January 2018 Visitor Profile
 RESEARCH DATA SERVICES, INC. 777 SOUTH HARBOUR ISLAND BOULEVARD SUITE 260 TAMPA, FLORIDA 33602 TEL (813) 254-2975 FAX (813) 223-2986 Naples, Marco Island, Everglades Convention and Visitors Bureau January
Naples, Marco Island, Everglades Convention and Visitors Bureau April 2014 Visitor Profile
 RESEARCH DATA SERVICES, INC. 777 SOUTH HARBOUR ISLAND BOULEVARD SUITE 260 TAMPA, FLORIDA 33602 TEL (813) 254-2975 FAX (813) 223-2986 Naples, Marco Island, Everglades Convention and Visitors Bureau April
Fort Lauderdale August 8, 2017
 Fort Lauderdale August 8, 2017 8/10/2017 TAP Software Analytics Division Brian Finucane TAP Reports Jeff Eastman TAP Hotel Reports Jeanne Eastman TAP Data Source Jeff Eastman Cloud Database Numerous Data
Naples, Marco Island, Everglades Convention and Visitors Bureau August 2018 Visitor Profile
 RESEARCH DATA SERVICES, INC. 777 SOUTH HARBOUR ISLAND BOULEVARD SUITE 260 TAMPA, FLORIDA 33602 TEL (813) 254-2975 FAX (813) 223-2986 Naples, Marco Island, Everglades Convention and Visitors Bureau August
Naples, Marco Island, Everglades Convention and Visitors Bureau November 2012 Visitor Profile
 RESEARCH DATA SERVICES, INC. 777 SOUTH HARBOUR ISLAND BOULEVARD SUITE 260 TAMPA, FLORIDA 33602 TEL (813) 254-2975 FAX (813) 223-2986 Naples, Marco Island, Everglades Convention and Visitors Bureau November
Naples, Marco Island, Everglades Convention and Visitors Bureau January 2013 Visitor Profile
 RESEARCH DATA SERVICES, INC. 777 SOUTH HARBOUR ISLAND BOULEVARD SUITE 260 TAMPA, FLORIDA 33602 TEL (813) 254-2975 FAX (813) 223-2986 Naples, Marco Island, Everglades Convention and Visitors Bureau January
Norfolk District North Atlantic Division
 Norfolk District North Atlantic Division Eastern Chapter of WEDA Fall Conference October 26, 2016 Stephen J. Powell, P.E. (757) 201-7788 US Army Corps of Engineers Norfolk District FY-17 Dredging Program
Naples, Marco Island, Everglades Convention and Visitors Bureau September 2013 Visitor Profile
 RESEARCH DATA SERVICES, INC. 777 SOUTH HARBOUR ISLAND BOULEVARD SUITE 260 TAMPA, FLORIDA 33602 TEL (813) 254-2975 FAX (813) 223-2986 Naples, Marco Island, Everglades Convention and Visitors Bureau September
Naples, Marco Island, Everglades Convention and Visitors Bureau October 2018 Visitor Profile
 RESEARCH DATA SERVICES, INC. 777 SOUTH HARBOUR ISLAND BOULEVARD SUITE 2 TAMPA, FLORIDA 332 TEL (813) 254-2975 FAX (813) 223-2986 Naples, Marco Island, Everglades Convention and Visitors Bureau October
Eficiencia Logistica Q Ruben Medina Director de Desarrollo Economico
 Eficiencia Logistica Q3 2017 Ruben Medina Director de Desarrollo Economico The Energy Port of the Americas Port of Corpus Christi Authority is: #1 US port for export of crude oil 4 th largest US Port by
Naples, Marco Island, Everglades Convention and Visitors Bureau February 2013 Visitor Profile
 RESEARCH DATA SERVICES, INC. 777 SOUTH HARBOUR ISLAND BOULEVARD SUITE 260 TAMPA, FLORIDA 33602 TEL (813) 254-2975 FAX (813) 223-2986 Naples, Marco Island, Everglades Convention and Visitors Bureau February
SYSTEM BRIEF DAILY SUMMARY
 SYSTEM BRIEF SUMMARY * ANNUAL (PEAK HOURS 7:00 AM TO 10:00 PM MON-SAT) MaxTemp NEL (MWH) Hr Ending Hr Ending LOAD ENERGY (MWH) INCREMENTAL COST DAY DATE Civic TOTAL MAXIMUM @Max MINIMUM @Min FACTOR ON
SAN LUIS OBISPO COUNTY REGIONAL AIRPORT ANNUAL AIRLINE PASSENGER SUMMARY SUMMARY BY YEAR AND MONTH 4/11/2018
 ANNUAL AIRLINE PASSENGER SUMMARY SUMMARY BY YEAR AND MONTH 4/11/ JAN FEB MAR IL E Y T 35,023 36,435 38,282 38,390 37,848 35,589 38,325 37,433 32,324 31,169 32,771 33,627 30,978 24,586 23,382 2017 24,586
DELHI TRANSCO LIMITED STATE LOAD DESPATCH CENTER (REGD. OFFICE : SHAKTI SADAN BUILDING, KOTLA ROAD, NEW DELHI
 Computation of Transmiossion Losses of STU Delhi i.e. Delhi Transco Limited system for FY 2007-08 Sl. No. 6=(1 to 5) 8= (6+7) 14=(9 to 13) 15= (8-14) 16=15*100/8 Total Injection to Delhi System Apr-07
Annual Fuel Price Report 2010
 Annual Fuel Price Report 20 The RACQ publishes comprehensive monthly analysis of petrol price movements for major capital city markets and Queensland regional centres. This report draws on that information
I 3-Feb-16 ALLENTOWN PA LEHIGH VALLEY INTL I 10-Sep-06 CEDAR RAPIDS IA THE EASTERN IOWA I 14-Oct-07
 AIDS Report NumbeLocal Event DEvent City Event StateEvent Airport 20160203005489I 3-Feb-16 ALLENTOWN PA LEHIGH VALLEY INTL 20060910018669I 10-Sep-06 CEDAR RAPIDS IA THE EASTERN IOWA 20071014023689I 14-Oct-07
Naples, Marco Island, Everglades Convention and Visitors Bureau March 2013 Visitor Profile
 RESEARCH DATA SERVICES, INC. 777 SOUTH HARBOUR ISLAND BOULEVARD SUITE 260 TAMPA, FLORIDA 33602 TEL (813) 254-2975 FAX (813) 223-2986 Naples, Marco Island, Everglades Convention and Visitors Bureau March
Exchange Sunshine Coast 2014
 Exchange Sunshine Coast 2014 A refresher on CSQ... What does CSQ do? We: promote careers in the building and construction industry invest in skills and training grow the number of skilled workers build
Domestic Visitation to the Northern Territory
 \ YEAR ENDING SEPTEMBER Domestic Visitation to the Northern Territory 20 Year ending September 20 YEAR ENDING SEPTEMBER 20 DOMESTIC OVERNIGHT VISITORS IN THE NORTHERN TERRITORY VISITORS 1.55 MILLION NIGHTS
MONITORING INFORMAL CROSS- BORDER TRADE IN STAPLE FOODS IN SOUTHERN AFRICA
 MONITORING INFORMAL CROSS- BORDER TRADE IN STAPLE FOODS IN SOUTHERN AFRICA A collaborative activity between WFP and FEWS NET Presented at the FAO/University of Pretoria Workshop on Government and Private
Cheyenne Regional Airport Board
 July, 2014 Cheyenne Regional Airport Proposal Under the Small Community Air Service Development Program Docket: Sponsor: DUNS: Congressional District Code: Tax ID: Contact: DOT-OST-2014-0113 Cheyenne Regional
Hotel Association of North Texas. Karrie Keen Director, Destination and Trend Operations
 Hotel Association of North Texas Karrie Keen Director, Destination and Trend Operations To view this presentation, go to HotelNewsNow.com and click on Industry Analysis then Hotel data presentations. Agenda
U.S. Hotel Industry Performance. Brad Garner Chief Operating Officer
 U.S. Hotel Industry Performance Brad Garner Chief Operating Officer 1 Agenda Total US Review Scale Review Segmentation Markets Supply Pipeline 2013 / 2014 Forecast 2 www.hotelnewsnow.com Click on Hotel