Exchange Sunshine Coast 2014
|
|
|
- Aron Richards
- 5 years ago
- Views:
Transcription

1 Exchange Sunshine Coast 2014
2 A refresher on CSQ...
3 What does CSQ do? We: promote careers in the building and construction industry invest in skills and training grow the number of skilled workers build industry capacity to meet industry demand We are here for industry
4 What does CSQ do? CSQ wants to know: What are the evolving needs of our industry? What does the appropriately skilled workforce look like? We will: share information, data, research and insights establish strategic partnerships to engage with and inform, influence and assist our industry
5 Activity and training overview.. CSQ Industry Update October
6 Mar-00 Sep-00 Mar-01 Sep-01 Mar-02 Sep-02 Mar-03 Sep-03 Mar-04 Sep-04 Mar-05 Sep-05 Mar-06 Sep-06 Mar-07 Sep-07 Mar-08 Sep-08 Mar-09 Sep-09 Mar-10 Sep-10 Mar-11 Sep-11 Mar-12 Sep-12 Mar-13 Sep-13 Mar-14 Residential and Commercial Construction Activity Total residential and commercial construction work is on the rise $6b Total value of building work done by sector, Queensland $5b $4b $3b $2b $1b $0b Residential Commercial Total Building Source: ABS Mar 2014, Seasonally Adjusted CSQ Industry Update October
7 Jun-09 Sep-09 Dec-09 Mar-10 Jun-10 Sep-10 Dec-10 Mar-11 Jun-11 Sep-11 Dec-11 Mar-12 Jun-12 Sep-12 Dec-12 Mar-13 Jun-13 Sep-13 Dec-13 Mar-14 Jun-14 Engineering Construction Activity Engineering construction activity has picked up $14b Total value of engineering construction work done by subsector, Queensland $12b $10b $8b $6b $4b $2b $0b Roads Bridges, railways, harbours Electricity Water Telecommunications Recreation Heavy industry (incl. mining) Source: ABS Jun 2014, Original CSQ Industry Update October

8 Jun-09 Sep-09 Dec-09 Mar-10 Jun-10 Sep-10 Dec-10 Mar-11 Jun-11 Sep-11 Dec-11 Mar-12 Jun-12 Sep-12 Dec-12 Mar-13 Jun-13 Sep-13 Dec-13 Mar-14 Jun-14 Engineering Construction Activity And the amount of work in the pipeline is declining... $70b Total value of engineering construction work yet to be done by subsector, Queensland $60b $50b $40b $30b Reduced investment in new assets $20b $10b $0b Roads Bridges, railways, harbours Electricity Water Telecommunications Recreation Heavy industry (incl. mining) Source: ABS Jun 2014, Original CSQ Industry Update October

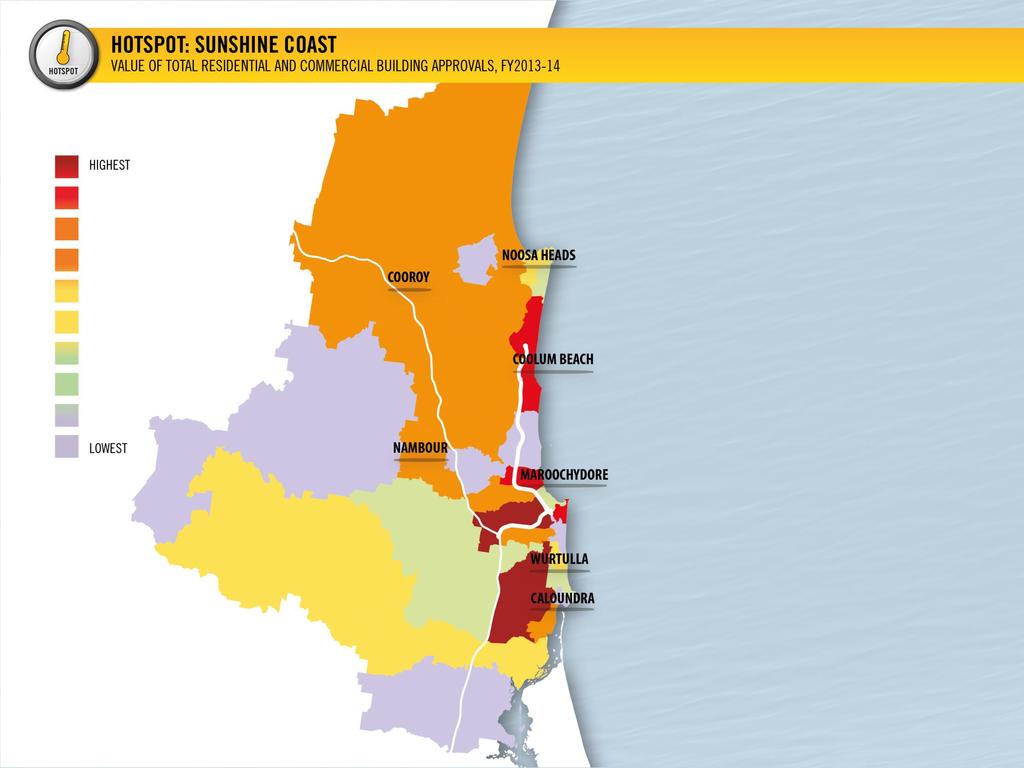
9 Hotspot: Queensland 9
10 10
, CSQ regions 2012-2014 2012-13 2013-14 Growth (%) Gold Coast 752.8 1,255.3 66.8 Brisbane North 1,776.3 2,833.1 59.5 Sunshine Coast 540.8 808.")

11 Residential Building Approvals by Region Residential values have increased, boosted by strong growth in detached houses and higher density residential building Total value of residential building approvals ($millions), CSQ regions Growth (%) Gold Coast , Brisbane North 1, , Sunshine Coast Brisbane South 1, , Far North Wide Bay South West Ipswich Northern Mackay Central Queensland 8, , CSQ Industry Update October 2014 Source: ABS Jul 2013, Original. Significant growth across a number of regions 11
12 Commercial Building Approvals by Region Commercial activity has declined sharply, falling from a peak created by approval of the SCUH project Total value of commercial building approvals ($millions), CSQ regions Growth (%) Gold Coast , Far North Ipswich South West Wide Bay Brisbane North 2, , Northern Mackay Brisbane South 1, Sunshine Coast 1, Central Queensland 8, , Source: ABS Jul 2014, Original. Retail expansion projects CSQ Industry Update October
13 Sunshine Coast: Building Activity by Type The previous peak is evident in the breakdown by type, as is strong residential subsector growth... $2.0b Annual building approval values by type, Sunshine Coast $1.5b $1.0b $0.5b $0.0b Commercial Industrial Social/Institutional New houses New other residential Alterations and additions Source: ABS Jul 2014, Original. CSQ Industry Update October

14 Jul-12 Aug-12 Sep-12 Oct-12 Nov-12 Dec-12 Jan-13 Feb-13 Mar-13 Apr-13 May-13 Jun-13 Jul-13 Aug-13 Sep-13 Oct-13 Nov-13 Dec-13 Jan-14 Feb-14 Mar-14 Apr-14 May-14 Jun-14 Jul-14 Sunshine Coast: Building Activity by Month Dwelling approvals increased 75.4% and total approval values fell 8.0% compared to the same time last year 1,200 Building approval value and counts, Sunshine Coast , Sunshine Coast University Hospital No. dwellings Value of building ($m) Source: ABS Jul 2014, Original. CSQ Industry Update October
15 Construction Industry Sentiment Building Industry Outlook Sunshine Coast 70.3 Sentiment remains very positive and has improved since the previous quarter... Gold Coast 66.7 Brisbane 63.1 Darling Downs and South West Queensland 61.0 Far North Queensland 60.7 Burnett Wide Bay 52.5 North Queensland 52.1 Central Queensland 50.0 Mackay 48.9 Queensland 60.7 *QMBA indexes range between 0 and 100. An index level of 50 indicates satisfactory conditions. Higher results indicate relatively more positive conditions while index levels of less than 50 indicate less satisfactory conditions. Source: QMBA. Survey of Industry Conditions, Jun CSQ Industry Update October
16 Feb qtr 07 May qtr 07 Aug qtr 07 Nov qtr 07 Feb qtr 08 May qtr 08 Aug qtr 08 Nov qtr 08 Feb qtr 09 May qtr 09 Aug qtr 09 Nov qtr 09 Feb qtr 10 May qtr 10 Aug qtr 10 Nov qtr 10 Feb qtr 11 May qtr 11 Aug qtr 11 Nov qtr 11 Feb qtr 12 May qtr 12 Aug qtr 12 Nov qtr 12 Feb qtr 13 May qtr 13 Aug qtr 13 Nov qtr 13 Feb qtr 14 May qtr 14 Aug qtr 14 Queensland: Construction Industry Employment Overall industry employment has been relatively steady 250, , , , , , , , , , , ,000 Total construction industry employment, Queensland ,800 persons at Aug Q 2014 Source: ABS Aug 2014, Yearly moving average. CSQ Industry Update October


17 Feb qtr 07 May qtr 07 Aug qtr 07 Nov qtr 07 Feb qtr 08 May qtr 08 Aug qtr 08 Nov qtr 08 Feb qtr 09 May qtr 09 Aug qtr 09 Nov qtr 09 Feb qtr 10 May qtr 10 Aug qtr 10 Nov qtr 10 Feb qtr 11 May qtr 11 Aug qtr 11 Nov qtr 11 Feb qtr 12 May qtr 12 Aug qtr 12 Nov qtr 12 Feb qtr 13 May qtr 13 Aug qtr 13 Nov qtr 13 Feb qtr 14 May qtr 14 Aug qtr 14 Sunshine Coast: Construction Industry Employment with local industry employment up 13.7% from last year 25,000 20,000 Total construction industry employment, Sunshine Coast ,600 persons at Aug Q ,000 10,000 5,000 0 Source: ABS Aug 2014, Yearly moving average. CSQ Industry Update October

18 Queensland: Training 18
19 Queensland: Training 19

20 Queensland: Training 20

21 Annual Training Plan overview 21
22 ATP The investment $45M for investment in Decrease on the budget $70 $60 $50 $40 $30 $20 $10 $ M $
23 The guiding policy principles Industry-led Evidence-based Co-invested Contestable Performance and employment outcomes based Leveraged investment and service
24 Resulting Programs and Delivery Priorities No changes to our list of ATP programs BUT a clearer focus on the policy principles Focus is still on attracting new entrants, and developing and retaining existing workers


25 CSQ s Key Programs Attract Develop Retain Try A Trade D2C and D2CC TradeStart Gateway schools Pre-Apprenticeship Employment Incentives Skills assessment and gap training Short courses Higher level skills General and civil construction Student contribution fees Apprentice Recommencement Incentive Industry Coordinator Support

26 Our investment to date procurement process now finalised Contracts have been allocated to RTOs across Queensland To find a course and RTO in your location use our course selector at or call our Customer Support Centre on


27 Construction Futures Major Projects Pilot Projects Diversity partner with major contractors on key projects case management approach major contractors and sub-contractors trial skills responses to support new & emerging technologies, work methodologies etc industry-wide application not existing programs entry, participation and retention of workers from a broad range of backgrounds complements attract, develop & retain programs
28 Our research agenda Our research agenda for Building Information Modelling (BIM) Off-site construction (Pre-fabrication) VET Quality Evolving nature of apprenticeships & traineeships The role of incentives School to industry pathways

29 Don t forget the CSQ Excellence Awards 2014 Friday 5 December 2014 at the Brisbane Convention & Exhibition from 6:30pm
30 CSQ Industry Update October
CONSOLE SUNSHINE COAST: CONSTRUCTION INDUSTRY ACTIVITY AND WORKFORCE PROFILE
 CONSOLE SUNSHINE COAST: CONSTRUCTION INDUSTRY ACTIVITY AND WORKFORCE PROFILE MAY 2014 Disclaimer: Whilst all care and diligence has been exercised in the preparation of this report, Construction Skills
January 2018 Air Traffic Activity Summary
 January 2018 Air Traffic Activity Summary Jan-2018 Jan-2017 CY-2018 CY-2017 Passengers 528,947 505,421 4.7% 528,947 505,421 4.7% Passengers 537,332 515,787 4.2% 537,332 515,787 4.2% Passengers 1,066,279
Sunshine Coast Residential Market
 Sunshine Coast Residential Market Warwick Temby HIA Executive Director, QLD HOUSING INDUSTRY ASSOCIATION April 2010 Overview Look at international, national and local events that are shaping the outlook
Queensland Economic Update
 Queensland Economic Update Chamber of Commerce & Industry January 218 cciq.com.au Queensland Economic Update: Summary Economy State Final Demand (SFD) expanded by.2% in the September 217 quarter Household
The Outlook for the Residential Construction Industry Hunter and the Central Coast
 The Outlook for the Residential Construction Industry Hunter and the Central Coast Graham Wolfe HIA Chief Executive Industry Policy and Media HIA Industry Outlook Breakfast Newcastle February 2013 Backdrop:
The Residential Outlook for South Australia
 The Residential Outlook for South Australia Matthew King Economist HOUSING INDUSTRY ASSOCIATION February 2011 Overview Economic backdrop Other important matters Interest rates & bank lending Renovations
market-view Australian housing markets report Residential construction on the rise - higher and higher?
 Australian housing markets report Residential construction on the rise - higher and higher? Dr Andrew Wilson Chief Economist Domain Group October 2016 Copyright 2016 Dr Andrew Wilson all rights reserved
DTTAS Quarterly Aviation Statistics Snapshot Quarter Report
 Contents DTTAS Quarterly Aviation Statistics Snapshot Quarter 4 2015 Report 1.1 Dublin Airport Key Statistics... 1 1.2 Cork Airport Key Statistics... 3 1.3 Shannon Airport Key Statistics... 5 1.4 Total
The Cairns Property Market. Presented by Rick Carr Research Director, Herron Todd White 28 July 2015
 The Cairns Property Market Presented by Rick Carr Research Director, Herron Todd White 28 July 2015 National Market Dubbo Gippsland Horsham Latrobe Valley Newcastle Sydney Tamworth Toowoomba W ollongong
DTTAS Quarterly Aviation Statistics Snapshot Quarter Report
 Contents DTTAS Quarterly Aviation Statistics Snapshot Quarter 1 2018 Report 1.1 Dublin Airport Key Statistics... 1 1.2 Cork Airport Key Statistics... 3 1.3 Shannon Airport Key Statistics... 5 1.4 Total
Driving Ridership Strategic Partnerships
 Driving Ridership Strategic Partnerships Feb 29, 2012 Presented by Priya Bhasin-Singh, Strategic Marketing Associate priya.bhasin-singh@edmonton.ca 2012 APTA Marketing & Communications Conference About
Housing in Hobart: an overview of the data. Richard Eccleston, Lisa Denny, Julia Verdouw & Kathleen Flanagan University of Tasmania May 2018
 Housing in Hobart: an overview of the data Richard Eccleston, Lisa Denny, Julia Verdouw & Kathleen Flanagan University of Tasmania May 2018 Informing the Housing Debate Tasmania is facing significant housing
Cheatham County, TN. Hotel, Restaurant, and Travel Industries: Economic Profile and Business Trends, 2006
 Cheatham County, TN Cheatham County (Kingston Springs & Ashland City areas) Hotel, Restaurant, and Travel Industries: Economic Profile and Business Trends, Steve Morse, Ph.D. Director & Economist Tourism
Maury County, TN. Hotel, Restaurant, and Travel Industries: Economic Profile and Business Trends, Maury County (Columbia and Spring Hill area)
") Maury County, TN Maury County (Columbia and Spring Hill area) Hotel, Restaurant, and Travel Industries: Economic Profile and Business Trends, 06 Steve Morse, Ph.D. Director & Economist Tourism Institute
Maury County, TN Maury County (Columbia and Spring Hill area) Hotel, Restaurant, and Travel Industries: Economic Profile and Business Trends, 06 Steve Morse, Ph.D. Director & Economist Tourism Institute
Loudon County, TN. Hotel, Restaurant, and Travel Industries: Economic Profile and Business Trends, Loudon County (Loudon and Lenoir City areas)
") Loudon County, TN Loudon County (Loudon and Lenoir City areas) Hotel, Restaurant, and Travel Industries: Economic Profile and Business Trends, Steve Morse, Ph.D. Director & Economist Tourism Institute
Loudon County, TN Loudon County (Loudon and Lenoir City areas) Hotel, Restaurant, and Travel Industries: Economic Profile and Business Trends, Steve Morse, Ph.D. Director & Economist Tourism Institute
Australia s Building Industry current conditions and future prospects
 Australia s Building Industry current conditions and future prospects Dr Harley Dale HIA Chief Economist Alpine Nurseries Business Seminar Tuesday 26th August 2014, Sydney What is driving housing activity?
DTTAS Quarterly Aviation Statistics Snapshot Quarter Report
 Contents DTTAS Quarterly Aviation Statistics Snapshot Quarter 3 2018 Report 1.1 Dublin Airport Key Statistics... 1 1.2 Cork Airport Key Statistics... 3 1.3 Shannon Airport Key Statistics... 5 1.4 Total
Number of tourism trips of residents increased namely for leisure
 Tourism Demand of Residents 1 st Quarter 2018 25 July 2018 Number of tourism trips of residents increased namely for leisure In the 1 st quarter 2018, residents in Portugal took a total of 4.5 million
Housing Outlook. Mr Sam White, Ray White Group Mr Harley Dale, Housing Industry Association. 29 October 2007
 Housing Outlook Mr Sam White, Ray White Group Mr Harley Dale, Housing Industry Association 29 October 2007 Australian Business Economists October 2007 Presented by Sam White Average Prices 700,000 600,000
Keflavik International Airport Passenger forecast 2018
 Keflavik International Airport Passenger forecast 2018 2 Keflavik International Airport Passenger forecast Keflavik International Airport 2018 3 Passenger Forecast 2018 Forecast 2018 6,409,312 3,971,969
RIDERSHIP TRENDS. October 2017
 RIDERSHIP TRENDS October 2017 Prepared by the Division of Strategic Capital Planning December 2017 Table of Contents Executive Summary...1 Ridership...3 Estimated Passenger Trips by Line...3 Estimated
RIDERSHIP TRENDS. January 2018
 RIDERSHIP TRENDS January 2018 Prepared by the Division of Strategic Capital Planning March 2018 Table of Contents Executive Summary...1 Ridership...3 Estimated Passenger Trips by Line...3 Estimated Passenger
TOP END INDUSTRY SENTIMENT AT A GLANCE - SEPTEMBER QUARTER 2015
 TOP END INDUSTRY SENTIMENT AT A GLANCE - SEPTEMBER QUARTER 2 PERFORMANCE BUSINESS OUTLOOK Darwin and surrounds Sector performance index Kakadu / Arnhem Land (KAL) KAL Sector performance index No responses
Qantas Airport Retail Retailer Forum. June 2011
 Qantas Airport Retail Retailer Forum June 2011 Agenda 6 months in Review Airport Retail & Advertising Restructure Retail Development Overview Key Business Strategies Trading Performance Marketing Strategy
2018 MEETING and EVENTS CALENDAR 2018 Version 6 DATE DAY TIME MEETING VENUE. 1st Monday NEW YEAR'S DAY HOLIDAY STATEWIDE
 MASTER BUILDERS ASSOCIATION OF TASMANIA INC. 2018 MEETING and EVENTS CALENDAR 2018 Version 6 DATE DAY TIME MEETING VENUE Jan-18 1st Monday NEW YEAR'S DAY HOLIDAY STATEWIDE 26th AUSTRALIA DAY - Holiday
2007/08 Full Year Results Investor Briefing
 2007/08 Full Year Results Investor Briefing Highlights of Result Profit before tax up 46% to $1,408 million Up 36% on the reported result Margin improvement $3 billion of Sustainable Future Benefits achieved
USING SPECIAL INTERESTS TO DRIVE TRAVEL. Chris Atkinson TNZ Marketing Communications Manager Sectors Wednesday 12 March, 9am
 USING SPECIAL INTERESTS TO DRIVE TRAVEL Chris Atkinson TNZ Marketing Communications Manager Sectors Wednesday 12 March, 9am Agenda 1. Introduction 2. Special Interest (SI) overview and definition 3. Recap:
Street Based Lifestyle Monitor
 Street Based Lifestyle Monitor Cardiff (October 2013-October 2015) 0 Executive Summary Those living a street based lifestyle are the public face of homelessness and yet accurate data around how many people
Domestic Visitation to the Northern Territory
 \ YEAR ENDING SEPTEMBER Domestic Visitation to the Northern Territory 20 Year ending September 20 YEAR ENDING SEPTEMBER 20 DOMESTIC OVERNIGHT VISITORS IN THE NORTHERN TERRITORY VISITORS 1.55 MILLION NIGHTS
NHBC NEW HOME STATISTICS REVIEW Q3 2017
 NHBC NEW HOME STATISTICS REVIEW 2017 NHBC statistics represent a unique source of detailed up-to-date information on new home construction and the house-building industry. The figures relate to new homes
Property Metrics Median Days on Market 120
 Property Prices Median Sale Price (Log Scale) $45, Property Metrics Median Days on 12 Median Vendor Discount 8% May-16 Aug-16 Nov-16 Feb-17 May-17 Aug-17 Nov-17 Feb-18 $32, 9 6% $23, 6 4% $165, Vacant
2018 MEETING and EVENTS CALENDAR 2018 Version 4 DATE DAY TIME MEETING VENUE. 1st Monday NEW YEAR'S DAY HOLIDAY STATEWIDE
 MASTER BUILDERS ASSOCIATION OF TASMANIA INC. 2018 MEETING and EVENTS CALENDAR 2018 Version 4 DATE DAY TIME MEETING VENUE Jan-18 1st Monday NEW YEAR'S DAY HOLIDAY STATEWIDE 26th AUSTRALIA DAY - Holiday
CHINA HOTEL MARKET OUTLOOK
 CHINA HOTEL MARKET OUTLOOK Topics To Cover Key Market Assessment China Hotel Market Sentiment Survey The Big Picture For China In 2010 Key Market Outlook KEY MARKET ASSESSMENT Key Market Occupancy Trends
Monthly Fuel Price Report August September 2017
 Cost in cents per litre Monthly Fuel Price Report August 217 5 September 217 The RACQ monthly fuel price report presents a summary of the fuel price trends in Queensland for August 217. Key points At 125.6
JOURNAL ECONOMIC PERTH & KINROSS Q1-Q2 2018
 For more information regarding the content of this publication, please contact: Marek Styczen, Project Officer - Enterprise Planning & Development The Environment Service Perth & Kinross Council Pullar
Train to Plane Connection Construction of the Burbank Airport North Metrolink Station
 Train to Plane Connection Construction of the Burbank Airport North Metrolink Station Community Meeting - March 13, 2017 1 Community Meeting Agenda 6:00 6:30 PM Open House 6:30 7:15 PM Presentation 7:15
Queensland Economic Update
 Queensland Economic Update Chamber of Commerce & Industry March 2018 cciq.com.au Queensland Economic Update: Summary National Accounts GDP expanded 2.3% during calendar year 2017. QLD state final demand
July 2012 Passenger and Cargo Traffic Statistics Reno-Tahoe International Airport
 July 2012 Passenger and Cargo Traffic Statistics Reno-Tahoe International Airport August 31, 2012 U.S. DOMESTIC INDUSTRY OVERVIEW FOR JULY 2012 All RNO Carriers Systemwide year over year comparison Average
Yukon Tourism Indicators Year-End Report Yukon Tourism Indicators Year-End Report 2015
 Yukon Tourism Indicators Overview The Yukon Tourism Indicators is published by the Department of Tourism and Culture as a companion to the monthly Yukon Tourism Visitation Report. This document is intended
RIDERSHIP TRENDS. August 2018
 RIDERSHIP TRENDS August Prepared by the Division of Strategic Capital Planning October Table of Contents Executive Summary...1 Ridership...3 Estimated Passenger Trips by Line...3 Estimated Passenger Trips
Auckland Transport Quarterly Indicators Report 2018/19
 Attachment 1 Auckland Transport ly Indicators Report 218/19 September 218 Table of Contents Page 2. 1. Executive summary 2. External indicators 3. Performance by Key Priority 3.1 Deliver an efficient and
Measures & Projections October 31, GoToBermuda.com
 Measures & Projections October 31, 2015 GoToBermuda.com October Total Vacation Visitor Arrivals Vacation Arrivals Oct-14 Oct-15 2015 Air Vacation 9,203 10,344 1,141 12.40 126,842 127,044 202 0.16 Cruise
NSW BUSINESS CONDITIONS DECEMBER Quarterly snapshot of NSW economy informed by the businesses of NSW
 NSW BUSINESS CONDITIONS DECEMBER 218 Quarterly snapshot of NSW economy informed by the businesses of NSW NSW THIS QUARTER The NSW Business Chamber s Business Conditions Survey points to tougher trading
The Economic Impact of Poole s Visitor Economy 2015
 The Economic Impact of Poole s Visitor Economy 2015 Produced By The South West Research Company Ltd October 2016 Contents Page Introduction 3 Poole data 4 Dorset data 17 Introduction This report examines
QCB Report Q
 Q 8-9 October to 3 December 8 Market Overview & Insights The following report outlines the key activity and results of the Queenstown Convention Bureau for Q (Oct, Nov, Dec) of 8-9 financial year. This
AFTA Travel Trends. July 2017
 AFTA Travel Trends July 2017 AFTA Travel Trends Report 2017 Inbound and Outbound overview Introduction This snapshot provides an overview of the balance of trade between Inbound and Outbound Travel for
Annual Fuel Price Report 2010
 Annual Fuel Price Report 20 The RACQ publishes comprehensive monthly analysis of petrol price movements for major capital city markets and Queensland regional centres. This report draws on that information
Perth and Kinross Economic Journal Quarter (April - June 2016)
") For more information regarding the content of this publication, please contact: Marek Styczen, Project Officer - Enterprise Planning & Development The Environment Service Perth & Kinross Council Pullar
For more information regarding the content of this publication, please contact: Marek Styczen, Project Officer - Enterprise Planning & Development The Environment Service Perth & Kinross Council Pullar
International Visitation to the Northern Territory. Year ending September 2017
 International Visitation to the Northern Territory Year ending September 2017 The following is a summary of information relevant to the Northern Territory (NT) tourism industry including visitation results
May 2011 Passenger and Cargo Traffic Statistics Reno-Tahoe International Airport
 May 2011 Passenger and Cargo Traffic Statistics Reno-Tahoe International Airport July 5, 2011 U.S. DOMESTIC INDUSTRY OVERVIEW FOR MAY 2011 All RNO Carriers Systemwide year over year comparison Average
Sound Transit Operations January 2014 Service Performance Report. Ridership
 Ridership Total Boardings by Mode Mode Jan-13 Jan-14 % YTD-13 YTD-14 % ST Express 1,343,290 1,426,928 6.2% 1,343,290 1,426,928 6.2% Sounder 245,135 256,775 4.7% 245,135 256,775 4.7% Tacoma Link 86,229
The Economic Impact of Gloucestershire s Visitor Economy Forest of Dean district
 The Economic Impact of Gloucestershire s Visitor Economy 201 Forest of Dean district Produced on behalf of the Wye Valley and Forest of Dean Tourism Association By The South West Research Company Ltd January
The Economic Impact of Gloucestershire s Visitor Economy Forest of Dean district
 The Economic Impact of Gloucestershire s Visitor Economy 2014 Forest of Dean district Produced on behalf of the Wye Valley and Forest of Dean Tourism Association By The South West Research Company Ltd
Construction Industry Focus Survey. Sample
 Construction Industry Focus Survey 1 CONTENTS Executive Summary 1 1. Leading Activity Indicator 2 2. Activity by sector and constraints Residential, Non-residential, Civil Engineering 3. Orders and Tenders
SEQ Catalyst Projects
 m3property Update SEQ Catalyst Projects Winter 2018 Since our Autumn Catalyst Projects report, several projects in South East Queensland s pipeline of major projects have progressed and several new projects
Inland Queensland Roads Action Plan
 Inland Queensland Roads Action Plan Creating jobs. Driving Productivity. Attracting Investment Glenys Schuntner IQ-RAP Secretariat RDA Townsville and North West Queensland Chief Executive Officer Overview
WHY INVEST IN QUEENSLAND URBIS MARKET OUTLOOK
 WHY INVEST IN QUEENSLAND URBIS MARKET OUTLOOK WHO IS URBIS? PERTH AUSTRALIA ADELAIDE BRISBANE GOLD COAST SYDNEY MELBOURNE Urbis is an integrated multi-disciplinary consulting firm with a unique and comprehensive
Youth/Backpacker Visitation to the Northern Territory. Year ending June 2017
 Youth/Backpacker Visitation to the Northern Territory Year ending June 2017 2 The following is a summary of information relevant to the Northern Territory tourism industry using visitation results from
Sound Transit Operations December 2014 Service Performance Report. Ridership
 Ridership Total Boardings by Mode Mode Dec-13 Dec-14 % YTD-13 YTD-14 % ST Express 1,266,130 1,396,787 10.3% 16,605,299 17,661,976 6.4% Sounder 248,710 285,016 14.6% 3,035,735 3,361,317 10.7% Tacoma Link
Fort Bend Central Appraisal District. Glen Whitehead, RPA Chief Appraiser July 20, 2017
 Fort Bend Central Appraisal District Glen Whitehead, RPA Chief Appraiser July 20, 2017 1 2014 Texas Comptroller's Property Value Study Findings Two Categories failed to pass the Property Value Study in
Quarterly Bulletin of Statistics
 Q2 QUARTERLY BULLETIN OF STATISTICS 2nd Quarter GOVERNMENT OF BERMUDA Cabinet Office Department of Statistics Quarterly Bulletin of Statistics Q2 Highlights Air Arrivals: Bermuda hosted 75,013 tourists.
Third Quarter Marketing Report B R A N SON/LAKES A R EA C VB N OVEMBER, 2013
 Third Quarter Marketing Report B R A N SON/LAKES A R EA C VB N OVEMBER, 2013 Economic Outlook +5.1% from July 2011 Consumer Confidence is Up 7% This Year Increasing from 66.7 in Dec to 71.2 Today +6.7%
HOLIDAY VISITORS BY AGE
 REGIONAL REPORT Report Period: Year Ending e 20 e 2015 LASSETERS HOTEL, ALICE SPRINGS OVERVIEW OVERNIGHT Visitors Holiday VFR Business Visitor nights ALOS (nights) Domestic 226 2 22 75 1,1 4.9 Intra-Territory
PROPERTY. Property Sales Number of Sales per Quarter. Property Prices Median Sale Price (Log Scale) 1,600 House Sales. Houses.
 1,600 House Sales. Houses.") Property Number of per Quarter Property Prices Median Sale Price (Log Scale) 1,6 House Unit Land Total (Trend) $45, Houses 1,2 $32, 8 $23, Units 4 $165, Vacant Land Mar-8 Mar-9 Mar-1 Mar-11 Mar-12 Mar-13
Property Number of per Quarter Property Prices Median Sale Price (Log Scale) 1,6 House Unit Land Total (Trend) $45, Houses 1,2 $32, 8 $23, Units 4 $165, Vacant Land Mar-8 Mar-9 Mar-1 Mar-11 Mar-12 Mar-13
BHP Billiton Iron Ore Western Australia. Iron Ore. Presentation to Analysts June Ian Ashby, President and COO BHP Billiton Iron Ore
 BHP Billiton Western Australia Presentation to Analysts June 2005 Ian Ashby, President and COO BHP Billiton BHP Billiton Overview Record 53.6Mt of iron ore produced in the first half of FY2005 On target
CairnsWatch. September Level 1, 95 Sheridan Street Cairns Qld 4870 PO Box 6843 Cairns Qld 4870
 CairnsWatch September 2018 Cairns OVERVIEW AT A GLANCE The Cairns economy gained further pace over the last month, led by strong employment growth and reduced unemployment. However forward indicators,
Herron Todd White. South East Queensland Property Overview. Thursday, 17 November 2011 Sofitel, Brisbane.
 Herron Todd White South East Queensland Property Overview Thursday, 17 November 2011 Sofitel, Brisbane 1300 880 489 1 Alan Key Environmental Offsets Thursday, 17 November 2011 1300 880 489 Identity Earthtrade
Infrastructure for Growth
 A passion to deliver a prosperous future Connecting North Cambridgeshire Infrastructure for Growth Infrastructure for growth Wisbech is the largest settlement in Fenland. The town and its hinterland has
U.S. DOMESTIC INDUSTRY OVERVIEW FOR MARCH
 Inter-Office Memo Reno-Tahoe Airport Authority Date: April 30, 2009 To: Statistics Recipients From: Krys T. Bart, A.A.E., President/CEO Subject: RENO-TAHOE INTERNATIONAL AIRPORT PASSENGER STATISTICS U.S.
TravelClick: Business Intelligence Lodging Outlook. Sara Duggan. Regional Vice President, Business Intelligence TravelClick 03/23/18
 TravelClick: Business Intelligence 2018 Lodging Outlook Sara Duggan Regional Vice President, Business Intelligence TravelClick 03/23/18 25,000+ Partners 25 283 Million $49 Billion 365 North America Markets
JOURNAL ECONOMIC PERTH & KINROSS Q3 2017
 For more information regarding the content of this publication, please contact: Marek Styczen, Project Officer - Enterprise Planning & Development The Environment Service Perth & Kinross Council Pullar
West Somerset 2015 Local data version
 West Somerset 2015 Local data version Introduction This report examines the volume and value of tourism and the impact of visitor expenditure on the local economy in West Somerset and Somerset county in
Norway MARKET REVIEW Norwegian Visitors in Finland Statistical Trends and Profile
 Norway MARKET REVIEW 2015 Norwegian Visitors in Finland Statistical Trends and Profile 24.11.2016 STATISTICS ON NORWEGIAN TOURISM IN FINLAND STATISTICAL TRENDS 3 Registered overnights 4 Number of visitors
AFTA Travel Trends. June 2017
 AFTA Travel Trends June 2017 AFTA Travel Trends Report 2017 Inbound and Outbound overview Introduction This snapshot provides an overview of the balance of trade between Inbound and Outbound Travel for
Chattanooga & Hamilton Co. Tourism Trends & Economic Outlook
 Chattanooga & Hamilton Co. Tourism Trends & Economic Outlook How Tourism Works for Chattanooga, TN January 21, 2010 Presentation by: Steve Morse, Ph.D. Director & Economist, Tourism Institute University
Supreme Court records, (bulk , )
") Supreme Court records, 1793 1974 (bulk 1847 1862, 1870 1966) Ontario County Records and Archives Center Overview of the Records: Creator: Ontario County Court Clerk Extent: 48 volumes, 8 indexes, 25.53
Supreme Court records, 1793 1974 (bulk 1847 1862, 1870 1966) Ontario County Records and Archives Center Overview of the Records: Creator: Ontario County Court Clerk Extent: 48 volumes, 8 indexes, 25.53
HOTEL INDUSTRY OVERVIEW. Texas
 HOTEL INDUSTRY OVERVIEW Texas DEMAND GROWTH STRONG BALANCED OCC & ADR GROWTH % Change Room Supply* 149M 1.3% Room Demand* 92M 5.6% Occupancy 61.6% 4.3% A.D.R. $90 4.4% RevPAR $55 8.9% Room Revenue* $8.3B
Air China Limited Annual Results. March Under IFRS
 Air China Limited 21 Annual Results Under IFRS March 211 Agenda Part 1 Highlights Part 2 Business Overview Part 3 Financial Overview Part 4 Outlook 2 Part 1 Highlights Steady Economic Growth; Asia Pacific
Visit Wales Research Update
 Visit Wales Research Update 19 January 21 This update summarises tourism performance by drawing upon Visit Wales own research and information from other relevant sources. It is based upon information available
CairnsWatch. March Level 1, 95 Sheridan Street Cairns Qld 4870 PO Box 6843 Cairns Qld 4870
 Watch March 2017 Cairns OVERVIEW AT A GLANCE The Cairns economy continues to muddle along, with no real directional changes evident over the last month. Tourism and employment indicators remain positive,
With the completion of this project, we would like to follow-up on the projections as well as highlight a few other items:
 TO: FROM: Mayor and Council Interim City Manager Rebecca Underhill, Director of Finance DATE: February 28, 2014 SUBJECT: Water Meter Project Analysis On March 28, 2012, Acting City Manager Mike Loftin
SJC North and South Flow
 SJC North and South Flow Pre and Post OAPM Date: January 2018 Phases of Flight ATCC ARTCC ATCC 2 AviationTerms VFR- Visual Flight Rules. Pilots must maneuver to avoid clouds and are responsible for their
December 2012 Passenger and Cargo Traffic Statistics Reno-Tahoe International Airport
 December 2012 Passenger and Cargo Traffic Statistics Reno-Tahoe International Airport January 29, 2013 U.S. DOMESTIC INDUSTRY OVERVIEW FOR DECEMBER 2012 All RNO Carriers Systemwide year over year comparison
MARKET NEWSLETTER No 57 January 2012
 OVERVIEW OF INTRA-EUROPEAN UNION TRADING BETWEEN 2007/08 AND 2010/11 The data on intra-eu trade reported in this month s newsletter have been taken from the EUROSTAT database. However, it is important
August 2014 Passenger and Cargo Traffic Statistics Reno-Tahoe International Airport
 August 2014 Passenger and Cargo Traffic Statistics Reno-Tahoe International Airport October 8, 2014 U.S. DOMESTIC INDUSTRY OVERVIEW FOR AUGUST 2014 All RNO Carriers Domestic Systemwide year over year comparison
The Geography of Climate
 The Geography of Climate Objective for Today: Today we will examine ways that latitude and landforms influence climate The focus of our study will be the South American Continent in the Formal Region known
December 2011 Passenger and Cargo Traffic Statistics Reno-Tahoe International Airport
 December 2011 Passenger and Cargo Traffic Statistics Reno-Tahoe International Airport January 27, 2012 U.S. DOMESTIC INDUSTRY OVERVIEW FOR DECEMBER 2011 All RNO Carriers Systemwide year over year comparison
Tourism in the Caribbean Netherlands in 2017
 Paper Tourism in the Caribbean Netherlands in 2017 May 2018 CBS Paper, 1 Contents 1. Bonaire 3 1.1 Number of air tourist arrivals down by 5 percent in 2017 3 1.2 Number of cruise passengers on Bonaire
InterContinental Brand Simon Scoot -Vice President InterContinental Brand Management. June 2010
 InterContinental Brand Simon Scoot -Vice President InterContinental Brand Management June 2010 1 Video Brand History 2 InterContinental: leading global network Americas: System = 55 hotels Pipeline = 6
October 2013 Passenger and Cargo Traffic Statistics Reno-Tahoe International Airport
 October 2013 Passenger and Cargo Traffic Statistics Reno-Tahoe International Airport December 4, 2013 U.S. DOMESTIC INDUSTRY OVERVIEW FOR OCTOBER 2013 All RNO Carriers Systemwide year over year comparison
Produced by: Destination Research Sergi Jarques, Director
 Produced by: Destination Research Sergi Jarques, Director Economic Impact of Tourism Oxfordshire - 2016 Economic Impact of Tourism Headline Figures Oxfordshire - 2016 number of trips (day & staying) 27,592,106
BRANSON 2 nd QUARTER 2014 MARKETING REPORT
 BRANSON 2 nd QUARTER 2014 MARKETING REPORT October 14, 2014 Branson Convention & Visitors Bureau PRESENTATION OVERVIEW Economic Overview Travel Industry Update Branson 2Q 2014 Update ECONOMIC OUTLOOK Consumer
Community Forum 17 August Resort Management Update
 Community Forum 17 August 2013 Resort Management Update Topics Board Appointments Snowmaking and Water Supply Update Strategy Planning & Operational Direction 5 Year Strategic Management Plan Update 2013/14
MARKET INSIGHTS UPDATE North America
 SPOTLIGHT ON: THE SHOULDER TRAVEL SEASON PG2 A monthly update including relevant information on travel industry trends, consumer and meetings market research, competitive intelligence, and Hawai i s performance
The Yorke & Mid North (State Govt) Region. Workforce Wizard Region Report
 Region. Workforce Wizard Region Report") The Yorke & Mid North (State Govt) Region Workforce Wizard Region Report Table of Contents Executive Summary 3 Population and Social Characteristics 4 Current Population 4 Age Groups 4 Key Populations
The Yorke & Mid North (State Govt) Region Workforce Wizard Region Report Table of Contents Executive Summary 3 Population and Social Characteristics 4 Current Population 4 Age Groups 4 Key Populations
International Visitation to the Northern Territory. Year ending December 2017
 International Visitation to the Northern Territory Year ending December 2017 The following is a summary of information relevant to the Northern Territory (NT) tourism industry including visitation results
Produced by: Destination Research Sergi Jarques, Director
 Produced by: Destination Research Sergi Jarques, Director Economic Impact of Tourism North Norfolk District - 2016 Contents Page Summary Results 2 Contextual analysis 4 Volume of Tourism 7 Staying Visitors
Produced by: Destination Research Sergi Jarques, Director
 Produced by: Destination Research Sergi Jarques, Director Economic Impact of Tourism Norfolk - 2016 Contents Page Summary Results 2 Contextual analysis 4 Volume of Tourism 7 Staying Visitors - Accommodation
Quarterly Bulletin of Statistics
 QUARTERLY BULLETIN OF STATISTICS 2nd Quarter Q2 GOVERNMENT OF BERMUDA Department of Statistics Quarterly Bulletin of Statistics Q2 Highlights Imports The value of imports decreased 15.8 per cent to $299.1
SIA GROUP FINANCIAL RESULTS
 FINANCIAL RESULTS For Ended 30 June 2018 197200078R Operating Result Q1 Q1 Better/ FY18/19 FY17/18 R1 (Worse) ($M) ($M) (%) Total Revenue 3,844 3,864 (0.5) Q1 Better/ FY17/18 R2 (Worse) ($M) (%) 3,689