Current and Potential Mobility in Venice
|
|
|
- Gyles Patrick
- 5 years ago
- Views:
Transcription

1 Current and Potential Mobility in Venice By: John Bonina Sean R Cody Michael Panicci Katherine Smith Fabio Carrera, Advisor Peter Hansen, Advisor Date: December 15, 2017 Contact: ve17-move@wpi.edu Website: This report represents the work of WPI undergraduate students submitted to the faculty as evidence of completion of a degree requirement. WPI routinely publishes these reports on its website without editorial or peer review. For more information about the projects program at WPI, please see
2 Abstract This project investigated the limits of the current transportation and parking systems, evaluated improvements to these systems, and explored innovative changes. We analyzed the current car parking availability and potential alterations. We investigated current boat parking regulations, and proposed additional temporary boat parking spots, and created a smartphone application design to regulate boat parking. We analyzed reconfiguring water bus service throughout the historic city and adding a subway line to the city s infrastructure. The analyses created by this project are an important first step in improvements to Venice s transportation and parking systems. i
3 Executive Summary The transportation and parking systems in the historic city of Venice have gone through many changes. From the railway bridge in 1846 to the Piazzale Roma car garage in 1934, little has changed since these earlier innovations. The historic city s only modes of transportation are still walking or by boat, and temporary boat parking is extremely limited. Combined with the ever-increasing tourist population, travel through the historic city has become increasingly difficult for business visitors and even for the residents of Venice. This project s mission was to investigate current transportation and parking systems in Venice and explore potential improvements. Our objectives were to: 1. Assess current transportation and parking systems within Venice. 2. Explore improvements to the current water bus and boat parking systems. 3. Research innovative transportation and parking options as well as their impacts. We explored several topics including car parking, boat parking, express boat lines, and a potential subway system. We formed separate methodology for examining each topic and have arrived at several results and recommendations. Boat Parking We analyzed the locations of over 1,600 rive, places along canals where boats can park, which are located throughout the historic city. Almost all of these are limited to 15 minutes of usage. Among these 1,600 spots, 91 allow for one-hour parking, and only 59 of the one-hour spots allow parking during daytime hours. Using data previously collected by the Venice Project Center recording the location of every store in the historic city, we created a heat-map of stores to identify the optimal locations for boat parking spots. We excluded stores primarily targeted to tourists such as souvenir shops, and plotted the current one-hour parking spots on the same map. We determined that the current one-hour spots are not in ideal locations. This can be seen in Figure 1 below. Figure 1. Map of one-hour daytime spots superimposed on a heat map of non-tourist stores. ii
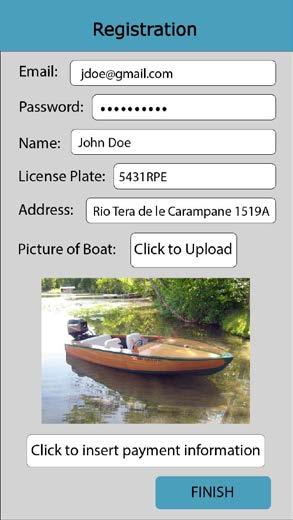
4 Based on this analysis, we recommend that the number of temporary boat parking spots be increased. To identify the locations of new parking spots, we applied the following criteria: the spot must have a minimum number of stores nearby and more spots should be located near areas of greater store density. Spots also had to be located in canals with a minimum width of 5 meters to allow parking on both sides of the canal and continued mobility through it. Finally, we implemented a minimum distance between any two spots. We used QGIS to visualize the 31 docks that Vento di Venezia has proposed around Venice, and removed potential parking spots in proximity to these docks. Figure 2 shows the 221 spots that we suggest as ideal for temporary boat parking. The tool we created can be customized to modify the criteria and analyze changes. Figure 2. Map of our proposed temporary boat parking spots We examined the current system for regulating boat parking in the current temporary parking spots. We found that boat owners are exceeding the one-hour maximum time limit at the spots, certain spots are missing signs, and no observed boats displayed the required disco orario (a self time-meter). We proposed a new online tool for reserving and regulating boat parking. This system could be a web-based application suitable for smartphones or other browsers to allow boat owners to register their boats and to reserve and pay for a boat parking spot in advance. Authorities could use the same application with a separate interface to permit them to view reservations, payments and compliance, including issuing fines. A concept for the view of the application for users or for system administrators can be seen in Figure 3. iii
5 Figure 3. Design for a boat parking app, showing the user view (above left) and the enforcement view (above right) Car Parking Next, we examined car parking by gathering data on the number of available parking spots from several online resources and from Google satellite views. We understood the need for car parking based on the number of people entering the historic city via the Ponte della Libertá. We found that there are a total of 5,633 parking spots in Venice, with an additional 1,790 spots immediately across the Ponte della Libertá in Mestre. One possible location for additional parking is converting an existing surface lot on Tronchetto into a five-tier lot. We also performed a cost benefit analysis on this proposed lot and found that this lot would cost million to construct and result in 1,207 additional parking spaces. Because creating additional parking in Venice could increase traffic on the Ponte della Libertá, we do not recommend such investments in additional car parking in the historic city. Current Transportation Systems: Water Bus Lines Congested water bus lines with frequent stops result in longer travel times. Express boat lines could decrease these travel times. One express line that we examined was line 6, which serves as an express line for lines 5.1 and 5.2 on the southern end of the historic city between Lido and Piazzale Roma. In the summer, the line skips four stops made by lines 5.1 and 5.2, allowing it to travel faster. However, in the winter the line runs less frequently and only skips one of these stops. iv


6 While line 6 travels faster along the southern portion of the historic city, it does not reach the railway station Ferrovia as lines 5.1 and 5.2 do, resulting in there being no express connection between Lido and Ferrovia. We concluded that traveling from Lido to Ferrovia could take 9 fewer minutes if the southern portion of lines 5.1 and 5.2 made the same stops as line 6. The change to lines 5.1 and 5.2 can be seen below in Figure 4, in which the lines skip the stops San Zaccaria, Santo Spirito, Santa Marta, and San Basilio. Figure 5 shows the route that line 6 would take if it made the stops that lines 5.1 and 5.2 currently make between Lido and Piazzale Roma. Figure 4. Suggested express service to replace ACTV Lines 5.1 and 5.2 Figure 5. Suggested local service to replace ACTV Line 6 By using isochrones, a tool to visualize all the areas that can be accessed from a specific location within a certain amount of time, we can establish the limits of mobility within the historic city. For example, Figure 6 shows a 15 minute isochrone from Lido, created with an isochrone generator that we produced, which includes walking and public transportation. The blocks become lighter in color as the time it takes to get to the point increases. v

7 Figure minute isochrone from Lido Santa Maria Elisabetta (S.M.E.) water bus station.. Innovative Transportation Systems: Venice Subway Next we examined a large scale change to the transportation system in the historic city: a subway system. Subway systems have been proposed for Venice in the past, and a 2005 proposal was funded but never constructed. In Venice, a subway could be built under the lagoon or canals to avoid existing structures, and only passages to subway stations would affect the fabric of the historic city. Our study shows that a subway would substantially reduce travel times compared to any of the possible improvements to the existing transportation systems. We examined the travel times from Lido, a major population center in Venice and a possible terminus of the subway system. The potential subway system we analyzed included stops in Lido, in the canal next to San Zaccaria (for access to San Marco), a stop in the Giudecca canal with a pedestrian tunnel between Zattere in Dorsoduro and Palanca in Giudecca, and a major station between Venice s two main transportation hubs, Piazzale Roma (for buses and trams) and Ferrovia (intercity trains). This route segment, shown below in Figure 7, was the primary route for analysis and part of two possible subway extensions to the mainland, one to the center of Mestre, shown in Figure 8 below, and the other to Marco Polo Airport, the fourthbusiest airport in Italy and the busiest airport in Italy not connected to rail transportation, shown in Figure 9 below. vi
8 Figure 7. Route map from Lido to Piazzale Roma Figure 8. Possible extension of the Lido - Piazzale Roma subway to Mestre vii

9 Figure 9. Possible extension of the Lido - Piazzale Roma subway to Marco Polo Airport We calculated travel times and used isochrones to visualize subway routes with faster mobility. Travel from Lido to Central Mestre decreased from 60 minutes to 15.8 minutes, and from Lido to Marco Polo Airport from 66 minutes to 16.5 minutes. Our isochrone generator could calculate travel times beyond subway stations as if the subway was already a part of Venice s public transportation system. Also, another tool that we created, a subway route simulator, allows us to visualize how a specific route would change if a subway system was implemented. Figure 10 shows the current route and duration of travel, while Figure 11 shows how the route and duration would change if the above subway system was implemented. Figure 10. Subway route simulator using current system viii
10 Figure 11. Subway route simulator using proposed subway line We concluded that a subway system in Venice would cost about 201 million per kilometer. Based on this unit cost, we determined that the line from Lido to Piazzale Roma would cost 1.4 billion to construct, the extension from Piazzale Roma to Mestre would cost 1.7 billion, and the extension from Piazzale Roma to Marco Polo Airport would cost 1.5 billion. Previous subway proposals have not been without controversy. Opponents of the 2005 subway which proposed to connect Marco Polo Airport to Arsenale were concerned that the system would lead to real estate speculation, increase the cost of living, bring more tourists, exacerbate congestion, and fuel a tourism-driven economy. These concerns should be taken seriously, but we believe that reducing travel times for residents also has benefits that should not be underestimated. Decreasing travel times may bring non-tourism business into the city, increase the quality of life for residents, spread the economic vitality across the larger Commune of Venice in Mestre and Lido, and create a 21st-century transportation infrastructure to enable Venice to thrive in the new economy. Conclusions Our study compared the benefits of modest changes to existing water bus systems to a new transportation system. For example, traveling between Lido and the railway station takes 43 minutes with the current water bus system using lines 5.1 or 5.2 during the summer. An express water bus service would take 34 minutes to travel between these points. A subway would take 11 minutes for the same journey. The subway system could also improve access to Mestre and Marco Polo Airport, reducing travel times for each destination from Lido by about 75%, but also costing the city up to 4.53 billion. We concluded that while car parking is limited, possible expansions would most likely result in more congestion on the Ponte della Libertá. We were also able to conclude that Venice s current system for boat parking is being exploited, and we proposed a new system to regulate it that would revolve around a smartphone application. Lastly, ix
11 we were able to determine suggestions for possible alternative boat parking spots for the historic city. Through our work on parking and transportation systems within Venice, we have laid the groundwork for several projects. We completed an analysis of car parking, boat parking, express boat lines, and a potential subway system. While our analyses both explored and resulted in many recommendations, our work can be used as a framework for future innovative projects involving the parking and transportation systems in Venice. Our boat parking spot generator, various cost analysis, and isochrone generator are vital tools that we foresee being used when entering the implementation stages of alternate boat parking spots or alternative transportation systems for Venice. x
12 Acknowledgements Our team would like to thank the following individuals/organizations for their assistance throughout our project: Fabio Carrera: For providing continuous support and guidance towards meeting our goals and objectives. Peter Hansen: For supplying us with constant edits, suggestions, and feedback on our work while guiding us towards our goals. Paolo Corposanto: For providing a tremendous amount of data pertaining to the history and current state of the transportation systems in Venice. Nicola Musolino: For educating us on several online resources that were used for data analysis within our project. Piero Toffolo: For acting as a liaison between us and ACTV as well as educating us on QGIS software. Alberto Sonino with Vento di Venezia: For acting as our liaison throughout this project and supplying us with innovative ideas for exploration. xi
13 Authorship While every member contributed to every section through minor contributions and editing, the following members primarily contributed to the below sections. John Bonina: Contributed to Introduction, Background, Methodology, Car Parking, Express Boat Lines, Subway System Cost Analysis Sean Cody: Contributed to Introduction, Background, Methodology, Boat Parking Michael Panicci: Contributed to Introduction, Background, Methodology, Boat Parking, Express Boat Lines, Subway System Benefit Analysis Katherine Smith: Contributed to Introduction, Background, Methodology, Boat Parking, Express Boat Lines, Subway System Benefit Analysis xii
14 Table of Contents Abstract i Executive Summary ii Acknowledgements xi Authorship xii Table of Contents xiii Table of Figures xv Table of Equations xvii Table of Tables xvii 1. Introduction 1 2. Background History of Mobility in Venice Tourism Impacts Venice Tourist Hot Spots Tourism Trends Accessibility of Venice Cars Long Haul Busses Trains Airplanes Cruise Ships Cargo Ships Navigating the Venetian Canals Water Busses Water Taxis Moto Ondoso Methodology Parking Systems and Potential Improvements Car Parking and Potential Improvements Methodology - Examining Car Parking Availability and Potential Improvements Results - Evaluation of Current Car Parking and Potential Improvements Analysis - Potential Car Parking Improvements 18 xiii
15 4.2 Boat Parking and Potential Improvements Current One-Hour Parking System Vento di Venezia Docks Methodology - Examining Boat Parking Results - Suggesting Boat Parking Spots Analysis - Assessing Suggested Spots Designing a System for Regulating Boat Parking Results - A Smarter System Analysis - Assessing a Digital Regulation System Conclusions Potential Improvements to Water Bus Systems Express Boat Service Methodology Results Analysis Reopening the Rio de'l Arsenal Methodology Results Analysis Conclusions A Subway System for Venice Venice Subway System Past Proposal Isochrone Generator Subway Route Simulator Methodology Estimating Subway System Costs Estimating Subway System Benefits Results Proposed Subway System Costs Proposed Subway System Benefits Analysis Conclusions 58 xiv
16 7. Conclusions & Recommendations Works Cited 63 Appendix A: Availability of Car Parking in the Historic City and Mestre 70 Appendix B: Isochrone Generator and Subway Route Simulator Outputs, Including Hand-Drawn Isochrones 74 Appendix C: Cost Calculations for Potential Subway Routes 81 Appendix D: Travel Times for Proposed Subway Lines 99 Appendix E: Cost-Benefit Analysis for the Lido - Mestre - Airport Subway System 105 Lido - P.le Roma Line 105 Lido - Mestre Line 116 Lido - Airport Line 130 Table of Figures Figure 1. Map of one-hour daytime spots superimposed on a heat map of non-tourist stores.... ii Figure 2. Map of our proposed temporary boat parking spots... iii Figure 3. Design for a boat parking app, showing the user view (above left) and the enforcement view (above right)... iv Figure 4. Suggested express service to replace ACTV Lines 5.1 and v Figure 5. Suggested local service to replace ACTV Line 6... v Figure minute isochrone from Lido Santa Maria Elisabetta (S.M.E.) water bus station..... vi Figure 7. Route map from Lido to Piazzale Roma... vii Figure 8. Possible extension of the Lido - Piazzale Roma subway to Mestre... vii Figure 9. Possible extension of the Lido - Piazzale Roma subway to Marco Polo Airport... viii Figure 10. Subway route simulator using current system... viii Figure 11. Subway route simulator using proposed subway line... ix Figure 12. Parking options after crossing Ponte della Libertá... 6 Figure 13. Cruise Ship Docking Procedures... 8 Figure 14. Venetians protest the encroachment of multiple cruise ships on the harbor of their city... 8 Figure 15. A vaporetto Figure 16. A water taxi parked on the side of a canal in Venice Figure 17. Location of our proposed parking garage Figure 18. Temporary parking signage Figure 19. Disco Orario xv
17 Figure 20. All boat parking spots (left) and parking spots divided by time limit (right) Figure 21. QGIS rendering of one of Vento di Venezia s proposed docks Figure 22. Map of docks proposed by Vento di Venezia Figure 23. Current 1-hour spots and 1-hour daytime spots Figure 24. Current Daytime 1-Hour Boat Parking and Stores Heatmap Figure 25. Suggested temporary boat parking spots Figure 26. Parking app Figure 27. ACTV line 6 summer service Figure 28. ACTV line 6 winter service Figure 29. Map showing service for ACTV line Figure 30. Proposed express line to replace Lines 5.1 and Figure 31. Proposed local line for the south end of Venice Figure minute isochrone from Rialto bridge Figure 33. Subway route simulator from Central Mestre to Lido using current system (top) and using suggested subway system (bottom) Figure 34. Route map from Lido to Piazzale Roma Figure 35. Possible extension of the Lido - Piazzale Roma subway to Mestre Figure 36. Possible extension of the Lido - Piazzale Roma subway to Marco Polo Airport Figure 37. Map of other proposed subway systems Figure 38. Graph of Cumulative Costs vs. Revenue for Lido - Piazzale Roma Route Figure 39. Graph of Cumulative Costs vs. Revenue for the full line from Lido to Mestre Figure 40. Graph of Cumulative Costs vs. Revenue for the full line from Lido to Marco Polo Airport Figure 41. Cumulative cost and revenue for the 2005 proposal, assuming none of the incoming cargo is shipped along the system Figure 42. Cumulative cost and revenue for the 2005 proposal, assuming 50% of incoming cargo is shipped along the system at a price of 100/ton Figure minute isochrone from Lido S.M.E. with the current transportation system (above left) and with a subway system (above right) Figure 44. Screenshot of the Google My Maps file used to estimate the car capacity of Venice City Park in Mestre Figure 45. Screenshot of the AutoCAD file used to estimate the number of parking spaces in Green Park Figure minute walking isochrone for the Rialto Bridge Figure minute walking isochrone for the Piazza San Marco at 12:00am Figure Minute Isochrone from Piazza San Marco Figure minute isochrone from Piazzale Roma Figure Minute Isochrone from Giuseppe Garibaldi Monument Figure Minute Isochrone from Venice Project Center xvi
18 Figure Minute Isochrone from Marco Polo Airport with Subway from Airport to Lido.. 77 Figure Minute Isochrone from Mestre with Subway from Mestre to Lido Figure Figure Figure Figure Figure Figure 59. Derivation for Equation Table of Equations Equation Equation Equation Equation Equation Equation Equation Table of Tables Table 1: Summary of Parking Availability in the Historic City and Mestre Table 2: Cost Calculations for an Additional Parking Garage on Tronchetto Table 3: Calculations for the Capacity of an Additional Parking Lot on Tronchetto Table 4: Summary of Boat Parking Data Table 5: Cost Analysis of Additional ACTV Service Through the Rio de'l Arsenal Table 6: Estimated Travel Time of Boats Through the Rio de'l Arsenal Table 7: Calculations for Time Required to Walk From Arsenale to Celestia Table 8: Current Ferry Travel Times Between Celestia and Arsenale Table 9: Construction Costs for the Lido - P.le Roma Route Using the Comparison Method Table 10: List of Construction Costs for Each Potential Subway Line Table 11: Travel Times in Minutes for Lido-Piazzale Roma Route With Extensions to Mestre and the Airport Table 12: Current Travel Times in Minutes for Lido-Piazzale Roma Route With Extensions to Mestre and the Airport Table 13: List of Parking Lots by Location, Ownership, and Capacity Table 14: Parking Area Sizes, Car Area Sizes, and Estimated Capacity of Venice City Park xvii
19 Table 15: Unit Cost Estimate for a Subway System in Venice Using an Extension to Berlin s Subway System Table 16: Unit Cost Estimate for a Subway System in Venice Using an Extension to Naples s Subway System Table 17: Unit Cost Estimate for a Subway System in Venice Using Amsterdam s North-South Line Table 18: Unit Cost Estimate for a Subway System in Venice Using Copenhagen s Circle Line 82 Table 19: Unit Cost Estimate for a Subway System in Venice Using Paris s Metro Line Table 20: Determination of the Unit Cost for the Comparison Method (see Table 15-Table 19) 82 Table 21: Rapid Transit Systems Analyzed by Pickrell (1985) Table 22: Determination of Railway and Station Unit Costs for the Unit Cost Method Table 23: Cost Calculations for Airport-Arsenale Route (Original Proposal) Using the Unit Cost Method Table 24: Cost Calculations for a One-Track Version of the Airport-Arsenale Route (Original Proposal) Table 25: Cost Calculations for Murano - Ferrovia Route Using the Unit Cost Method Table 26: Cost Calculations for Airport - Lido Route (Addendum to original proposal) Using the Unit Cost Method Table 27: Cost Calculations for Airport - F.te Nove - Ferrovia Route Using the Unit Cost Method Table 28: Estimate of Maintenance Cost per Car-Mile Based on the PATH Transportation System Table 29: Estimate of Maintenance Cost per Car-Mile Based on the Los Angeles Metro Rail Table 30: Estimate of Maintenance Cost per Car-Mile Based on the Boston T Table 31: Estimate of Maintenance Cost per Car-Mile Based on the New York City Subway Table 32: Estimate of Maintenance Cost per Car-Mile Based on the Miami Metrorail Table 33: Estimate of Maintenance Cost per Car-Mile Based on the Washington Metro Table 34: Estimate of Maintenance Cost per Car-Mile Based on the Madrid Metro Table 35: Estimate of Maintenance Cost per Car-Mile Based on Philadelphia s SEPTA Subway Table 36: Estimate of Maintenance Cost per Car-Mile Based on the Atlanta MARTA System.. 89 Table 37: Estimate of Maintenance Cost per Car-Mile Based on the Berlin U-Bahn Table 38: Estimate of Maintenance Cost per Car-Mile Based on the Paris Metro Table 39: Estimate of Maintenance Cost per Car-Mile Based on the London Underground Table 40: Estimate of Maintenance Cost per Car-Mile Based on the Bay Area Rapid Transportation system Table 41: Estimate of Maintenance Cost per Car-Mile Based on the Chicago L Table 42: Estimate of Maintenance Cost per Car-Mile Based on Table 28 - Table Table 43: Cost and Revenue Calculations for the Airport - Arsenale Route (Original Proposal) 93 xviii
20 Table 44: Present Value Analysis for the Airport - Arsenale Route (Original Proposal), Excluding Cargo Transportation Table 45: Cumulative Costs and Revenues for the Airport - Arsenale Route, Excluding Cargo Transportation Table 46: Travel Times for Airport-Arsenale Route (Original Proposal) Table 47: Train Travel Times for the Route Circumnavigating Venice Table 48: Time Required to Access the Platform for Each Station on the Route Circumnavigating Venice Table 49: Current Travel Times in Minutes Between Stops on the Airport-Arsenale Route (Original Proposal) Table 50: Travel Times for Murano - Ferrovia Route Table 51: Current travel times in minutes between stops on the Murano-Piazzale Roma Route102 Table 52: Travel Times for Airport - Lido Route (Addendum to original proposal) Table 53: Current Travel Times in Minutes Between Stops on the Airport - Lido Route (Addendum to original proposal) Table 54: Travel Times for Airport - F.te Nove - Ferrovia Route Table 55: Current Travel Times in Minutes Between Stops on the Aeropuerto F.te Nove Ferrovia Route Table 56: Station Coordinates and Distances to Platform Table 57: Train Departure and Arrival Times for Each Stop on the Lido - P.le Roma Route (from Lido - P.le Roma) Table 58: Maintenance Cost per Passenger for the Lido - P.le Roma Line Table 59: Total Number of Overnight Stays by Tourists from Table 60: Population of the Historic City, Lido, and Giudecca in 2011 and Table 61: Maintenance Cost and Revenue Generated by Tourists Through 2083 for the Lido - P.le Roma Line Table 62: Maintenance Cost and Revenue Generated by Locals Through 2083 for the Lido - P.le Roma Line Table 63: Parameters for the Present Value Analysis for All Branches of the Lido - Mestre - Airport System Table 64: Present Value Analysis for the Lido - P.le Roma Line Table 65: Cumulative Cost of the Lido - P.le Roma Line With Interest Table 66: Train Departure and Arrival Times for Each Stop on the Lido - Mestre Route Table 67: Cost Calculations for the Extension to Mestre Using the Comparison Method Table 68: Cost Calculations for the Entire Lido - Mestre Line Using the Comparison Method 118 Table 69: Maintenance Cost per Passenger for the P.le Roma - Mestre Extension Table 70: Maintenance Cost and Revenue for the P.le Roma - Mestre Extension, Based on 1986 and 1997 Data Table 71: Parameters for the Present Value Analysis for the Extension to Mestre xix
21 Table 72: Present Value Analysis for the P.le Roma - Mestre Extension Through Table 73: Present Value Analysis for the Entire Lido - Mestre Line Through Table 74: Cumulative Cost of the P.le Roma - Mestre Extension With Interest Table 75: Cumulative Cost of the Lido - Mestre Line With Interest Table 76: Train Departure and Arrival Times for Each Stop on the Lido - Airport Route Table 77: Cost Calculations for the Extension to Airport Using the Comparison Method Table 78: Cost Calculations for the Entire Lido - Airport Line Using the Comparison Method 131 Table 79: Maintenance Cost per Passenger for the P.le Roma - Airport Extension Table 80: Total Arrivals and Tourist Arrivals in Marco Polo Airport, Table 81: Projected Ridership of P.le Roma - Airport Extension, Based on Table Table 82: Present Value Analysis for the P.le Roma -Airport Extension Through Table 83: Present Value Analysis for the P.le Roma -Airport Extension Through Table 84: Present Value Analysis for the Entire Lido - Airport Line Through Table 85: Cumulative Cost of the P.le Roma -Airport Extension With Interest Table 86: Cumulative Cost of the Lido - Airport Line With Interest xx
22 1. Introduction From the opening of the Venice Railway Bridge in 1846, to the first steamer line in 1881, and the opening of the Ponte della Libertá and Rio Novo in 1933, the historic city of Venice has previously been at the forefront of transportation innovation in Italy. However, in the past 80 years the historic city has made very few updates to its transportation and parking systems. As tourism in Venice increases, the outdated systems are unequipped to efficiently handle both the needs of tourists and Venetians. The resulting congestion contributes to many problems, including overcrowding, a tourist driven economy, and rising housing costs, which have driven many locals to leave the area in search of a better quality of life. Any person traveling into or within the historic city of Venice is impacted by lengthy travel times and limited parking. For example, the average commutes to work of a Venetian and United States citizen take roughly the same amount of time, however the average Venetian travels only about one-eighth the distance 1. This lengthy commute is partially due to the large number of stops the water busses must make combined with the slow speeds that the water busses are allowed to travel through the canals. A separate issue is the lack of boat and car parking within the historic city, which prevents boat owners from using their boats for common errands such as grocery shopping, and forces car owners to leave their vehicles on the mainland and then use another form of transportation such as a bus, tramway, or train. In response to these problems, several proposals have been made to improve the current system or introduce a more modern system to Venice. One of the more noteworthy proposals was made in 2005 for a subway to travel from the Marco Polo airport, underneath the Venetian lagoon, to the shipyards on the eastern side of Venice in only 14 minutes. 2 This proposal received the necessary approval and funding, but construction never began, and the money was used for other projects. Another proposal on a smaller scale was a dock proposal made by Vento di Venezia. This proposal would introduce several docks around Venice and the surrounding area, improving boat parking availability. 3 This proposal has yet to receive the proper approval and funding in order to proceed. Based on these proposals and others, it s clear that there s a strong desire for improvement in the historic city of Venice. However, in order for the city to approve of and implement these proposals, the impacts outlined by the proposals need to be understood. Therefore, any suggestion examined regarding the future of Venice will be fully analyzed, including their costs and benefits. The goal of our project was to investigate current transportation systems in Venice, explore potential improvements, and compile the information which we gather, in order to assist 1 Brafford et al., Sylvers, Vento di Venezia,
23 the community in addressing the creation of a transportation system that is efficient and accessible. We organized data from previous research on transportation and proposals to determine their costs and benefits. With the help of our advisors, liaisons, and especially Paolo Corposanto, we also proposed several improvements and additions to Venice s transportation and parking systems. 2
24 2. Background The current transportation transportation infrastructure of Venice is strongly influenced by the city s unique geography and topography. The current transportation and parking systems are pushed to their maximum capabilities due to the tremendous amount of tourists visiting Venice throughout the year. With tourism congestion, constant impacts to the foundation of Venice due to wakes in the water, and a decrease in the population of the historic city, the need for an upgrade to the current transportation system becomes progressively more pressing. There are several forms of transportation that exist in other parts of the world that could possibly be implemented in Venice. There are also designs for car and boat parking used elsewhere that could also be implemented in Venice. Furthermore, current technological advancements have led to a growth in the development of futuristic means of transportation and parking. As transportation systems become increasingly complex and intertwined, technology has made assessing transportation options in Venice easier. Currently there are several resources for navigating Venice. While route times can be be calculated, it is difficult to determine which routes are the fastest. The present limitations of technological transit accessibility in Venice must be established. These limitations must be exploited and thoroughly understood before one can propose or develop an alternative. 2.1 History of Mobility in Venice Although the railway bridge into Venice opened in 1846, people hoping to travel within the city could only do so by walking, rowing, or sailing until 1881, when the first steamer line was introduced in Venice. Its route, which ran along the Grand Canal and connected the Piazzale Roma to Lido, is still in use today as Line 1 of Venice s ACTV service. 4 Venice saw two major transportation innovations in the year First, the road bridge from Mestre to Venice (now known as the Ponte della Libertá) was opened, along with a bus terminal in Venice. The Rio Novo, intended as a more direct connection between St. Mark s Square and the Piazzale Roma, was also opened in this year. However, the Piazzale Roma became prone to congestion starting in the 1960s and 1970s. The Rio Novo, meanwhile, became obsolete over time and was closed to water bus traffic in the early 1990s. It remains open to water taxis, and the area along it is considered one of the worst places to live in Venice because of the noise pollution from the engines of these water taxis. 5 Since 1933, Venice s transportation infrastructure has changed very little. Service to several outlying islands was discontinued, and a dedicated night network was added to the ACTV service, but the major aspects of Venice s transportation system have remained the same. 4 Paolo Corposanto (Personal Communication) 5 Paolo Corposanto (Personal Communication) 3
25 Even the speed at which boats travel through Venice s waters has not changed since they were introduced Tourism Impacts Venice The number of tourists who visit Venice has increased over the past few years, with the total number of overnight tourists alone rising from 4.1 million to 4.5 million between 2011 and The disposition of these tourists to visit the city at certain times of year, especially during the months of July, August, and September, and to frequent certain major destinations, results in overcrowding in popular areas of Venice Tourist Hot Spots Tourists who visit Venice favor a number of locations, including St. Mark s Basilica, which receives an average of 379,208 visitors annually 8 and is ranked as the top tourist destination in the city by several tourism websites. 9 Another Venetian landmark, the Palazzo Ducale (Doge s Palace), received an average of 1,329,906 visitors annually between 2011 and With a wait time of 150 minutes, the Doge s Palace is tied with the London Eye and the Anne Frank House for the honor of the European tourist attraction with the longest wait time. 11 Additional tourist hotspots in the historic city include the Grand Canal; the Galleria dell'accademia, which receives 305,302 visitors annually; 12 and the Piazza San Marco, located directly outside of St. Mark s Basilica. Because such high numbers of tourists visit these locations, the locations themselves and the areas around these locations are highly congested, and as a result are not favorable to pedestrian mobility Tourism Trends Tourism in Venice has increased over the years, and is only predicted to continue to increase rapidly. In 2012, over 60,000 tourists visited the city every day, which is slightly more than the population of the historic city; 13 in comparison, the city s tourism capacity has been estimated to be 11,240 overnight tourists and 10,857 day trippers. 14 For a city equipped to handle large numbers of tourists, this can be good, as there are typically economic benefits from tourists spending money on amenities such as hotels, transportation around the city, and restaurants. However, for Venice, tourism is crippling the local population. 6 Paolo Corposanto (Personal Communication) 7 City of Venice, City of Venice, Renzulli, n.d. 10 City of Venice, Daily Mail, n.d. 12 City of Venice, Mack, Canestrelli and Costa,
26 The number of tourists in Venice varies at different times throughout the year, as most of the people visiting do so during holidays or during the the warmer seasons. The peak month is typically July, followed by August and September which is later in the year than previous years trends indicate. 15 This shows that the time of year that tourists will visit is expanding as opposed to staying in a more limited peak time frame. Celebrations in Venice such as Carnevale also cause a large influx in tourism. When the city experiences these influxes in tourism it only puts further stress on the transportation and parking systems. 2.3 Accessibility of Venice There are several ways to arrive in the historic city of Venice. Options include cars, busses, boats, and airplanes. Depending on the traveler, a certain system can be more beneficial than another. Understanding these factors allows for the introduction of possible improvements to Venice s transportation infrastructure Cars Nearly 70,000 individuals enter Venice along the Ponte della Libertá every business day, nearly 20,000 of whom arrive by car. 16 Since this bridge is the only way to enter Venice by car, congestion along the bridge can become extreme in the event of high traffic caused by a holiday or other large event. In order to preserve Venice s historic character, once cars arrive from the Ponte della Libertá they are not allowed in any location in the historic city besides the parking area located at Piazzale Roma. Should parking be unavailable in the historic city, the cars have no option but to turn around, which creates further frustration and congestion at the entrance to the historic city, and limits the car capacity of the Ponte della Libertá to approximately 30,000 travelers per day. 17 The congestion caused by this infrastructure is unsustainable. To visualize the limits of parking, a map has been included with all the major parking areas after crossing the Ponte della Libertá (Figure 12). 15 City of Venice, Pedrocco, Da Mosto, Morel, Gibin, Tonin, Fracchia, et al.,

27 Figure 12. Parking options after crossing Ponte della Libertá Long Haul Busses When visiting Italy and attempting to travel from one region to another, including Venice, trains and cars are not your only option. Various bus companies have interregional routes. For instance, SENA Autoline has routes throughout 17 of the 20 regions of Italy. These long haul busses can be a good option for tourists, but are impractical for anyone attempting to conduct business or work in the city. 18 Tourists hoping to take a bus from Marco Polo airport into the historic city have two options at their disposal. They can either take the private ATVO bus, or they can take the Linea 5 Aerobus run by the ACTV, Venice s public transportation system. The ACTV aerobus typically takes minutes to travel from the airport to the Piazzale Roma, and both lines cost 8 euros for a one-way trip. Currently the ACTV owns approximately 620 land busses. These busses reduce the amount of individual vehicles that would be necessary without them; however they still largely contribute to the congestion of the single roadway into the historic city Trains The main train station in Venice, the Venezia Santa Lucia station, receives an average of 82,000 passengers and 450 trains every day. 20 In comparison, the Venetian population is slightly below 60,000, and the city s tourism capacity has been estimated to be 11,240 overnight tourists and 10,857 day trippers. 21 Four rail lines serve this station--le Frecce, Italo, Thello, and the City 18 Imboden, n.d.,a 19 ACTV, n.d. 20 Grandi Stazioni, n.d. 21 Canestrelli and Costa,
28 Night Line--and the cities most commonly traveled to from this station include Italian cities such as Rome and Florence, as well as international cities such as Paris, Vienna, and Zurich Airplanes Venice has two airports at which international travelers can arrive. The larger of the two is the Marco Polo Airport, located on the mainland about 8 kilometers away from the historic city. It is Italy s fifth-busiest airport, receiving 8.4 million passengers in As a result of the number of passengers that Marco Polo airport receives, one of its terminals, which was opened in 2002, is already at full capacity. 23 Venice is also served by the Treviso airport, located in Treviso, Italy. However, this airport is located 40 km away from Venice, primarily offers local and cross-continental flights from discount airlines, and is much smaller than Marco Polo Airport Cruise Ships Venice is a popular destination for tourists to travel to by means of cruise ships. These cruise ships hold on average approximately 3,000 passengers, and enter through the lagoon. There are three major ports where cruise ships can dock: the Marittima, the San Basilio, and the Riva dei Sette Martiri, as can be seen below in Figure 13. Due to its large ship capacity and proximity to tourist hot spots, the Marittima is the most popular port among travelers. Over 600 ships come to Venice yearly, bringing about 30,000 passengers daily in peak season. 25 When these cruise ships dock and passengers deboard this can create severe congestion in and around the area of the port. In addition, the cruise ships are negatively impacting the Venice Lagoon itself as they create substantial wakes which suspend 1.2 x 10 6 metric tons of sediment annually. 26 Finally, these cruise ships cause tremendous congestion in the Venetian canals. To visualize the congestion, Figure 14 shows multiple cruise ships taking up a large amount of space in the canals. Public protest can also be seen, as the pedestrians in the photograph have jumped in the canal to protest the cruise ships. 22 Grandi Stazioni, n.d. 23 Airport-Venice.com, Venice Airport.it, n.d. 25 Bellingham, Davis, O Brien, & Saari, Rapaglia, J., Zaggia, L., Parnell, K., Lorenzetti, G., & Vafeidis,


29 Figure 13. Cruise Ship Docking Procedures Figure 14. Venetians protest the encroachment of multiple cruise ships on the harbor of their city Cargo Ships In addition to passenger ships, cargo ships are very prevalent throughout Venice. Cargo ships are the primary delivery system of goods to the historic city; ships arrive at port daily 8
30 bringing supplies to restock the city. Similar to cruise ships, cargo ships also cause congestion in the waterways, and there have been past proposals to attempt to control the flow of cargo. Students from the University of Venice proposed that cargo ships be charged for the size of their boats per unit length to force suppliers to be more efficient in storage. 27 A past Worcester Polytechnic Institute student team at the Venice Project Center proposed that cargo ships would deliver their supplies to a warehouse on the port, which would then organize and distribute the cargo. This system would allow cargo ships to complete their trips in a more timely fashion Navigating the Venetian Canals Upon arriving in Venice, people can either travel within the city on foot or along its waterways. If they choose to do the latter, they can travel by water busses or more expensive water taxis. All of these boats produce wakes (moto ondoso) that are damaging the foundations of the city Water Busses The most common type of public transportation throughout Venice is water busses, which are operated by the ACTV, the city s primary public transportation company. The ACTV owns approximately 160 boats and carries more than 190 million passengers annually. With the ACTV, people can travel by water bus either with the Vaporetto, such as the one shown in Figure 15, or the Motoscafo, which are two different types of boats. 29 Vaporetti are the most widely used type of water bus in Venice, and are used to transport both people and their luggage. Each vaporetto is 21 meters long and can hold up to 220 passengers at a time. Due to the size of these water buses and the congestion of the canals, crashes between other boats and water busses are not uncommon, and have resulted in death Libardo, Nocera, & Trabucco, Amilcar, Bourgeois, Setalsingh, & Tassinari, ACTV, n.d. 30 ACTV, n.d. 9

31 Figure 15. A vaporetto Motoscafi are very similar to vaporetti but smaller, as they are 20.7 meters long and less wide, and can hold up to 160 passengers at a time. 31 They were introduced after the Rio Novo was opened in 1933, in order to allow for the ACTV system to run through canals other than the Grand Canal. 32 Although the Rio Novo is no longer open to water buses, the motoscafi continue to be in use Water Taxis The water taxis of Venice provide a more upscale means of traveling around the historic city. These water taxis, one of which is shown in Figure 16, can hold up to ten people, and feature private captains, upholstered seats, and open-air seating in the rear of the boat. They are also fairly expensive, with trips between Marco Polo Airport and central Venice costing upwards of 110, and trips within the historic city costing between 40 and Most water taxis in Venice operate under the Consorzio Motoscafi Venezia, which was formed through the union of several of the leading independent taxi companies at the time. The Consorzio operates a fleet that consists of over 100 water taxis that operate 24 hours a day. Each water taxi is connected to an operation center using an advanced GPS system, which allows for the coordination of the fleet of taxis and reduces customers waiting times. 34 Though the water taxis are typically faster and more convenient than water busses, their exorbitant prices make them unusable for the typical Venetian on the daily commute. 31 ACTV, n.d. 32 Paolo Corposanto (Personal Communication) 33 Imboden, n.d.,b 34 Consorzio Motoscafi Venezia, n.d. 10
, the wakes generated by the motorboats in")
32 Figure 16. A water taxi parked on the side of a canal in Venice Moto Ondoso An unfortunate side effect of the waterborne transportation systems discussed up to this point is moto ondoso (translated to wave movement), the wakes generated by the motorboats in Venice s waterways, which damage the foundations of the city. This damage is expensive to repair: in 2006, the Venice government set aside 35 million euros to continue scheduled maintenance of canals retaining walls. 35 The problems caused by moto ondoso are worsened by the fact that only 3% of boats in Venice s canals follow the speed limits for those canals, and only 13% travel within 2 km/h of these speed limits. 36 Increasing the speed of the boats in Venice s waterways from 5 km/h, the speed limit in most of Venice s minor canals, to 7 km/h leads to anywhere from a 36% increase for personal boats with high payloads to a 336% increase for small cargo boats, regardless of payload, in the energy with which the waves impact the walls of the canals. 37 Since 87% of boats in Venice s waterways travel more than 2 km/h above the posted speed limits, the waves from these boats wakes impact the city s foundations with even more energy. A previous Venice Interactive Qualifying Project completed through Worcester Polytechnic Institute proposed a five-year plan for reducing moto ondoso in Venice s waterways. During the first year of this plan, speed limits in the canals would be more thoroughly enforced, which the group estimated would lead to a 13% reduction in moto ondoso. A taxi-sharing app, to be finalized during the first year, would then be introduced in the second year, contributing to a 35% reduction in moto ondoso. The third year would involve the implementation of new hulls on 35 Black, Migdal, Morin, Rene, & Vitello, Nodine, Jagannath, & Chiu, Nodine et al.,
33 taxi and cargo boats, the fourth year would see the introduction of new Alilaguna boat hulls, and the fifth year would involve evaluating the plan s effectiveness. The proponents of this plan expect it to reduce the severity of moto ondoso by 77%. 38 This plan has served merely as a concept up to this point. With enough funding and support, this can become a reality. 38 Gonclaves, Jasinski, Pauwels, & Tedesco,
34 3. Methodology The goal of this project was to investigate current transportation systems in Venice, explore potential improvements, and compile the information which would assist the Venice Project Center and Vento di Venezia in recommending an alternative transportation system that is efficient and accessible. The objectives of this project were to: 1. Assess current transportation and parking systems within Venice. 2. Explore improvements to the current systems. 3. Research innovative transportation and parking options as well as their impacts. We analyzed the costs and benefits of several possible subway lines, as well as express water bus services. In order to assess the benefits of several subway systems, we created an isochrone generator and a subway route generator. We examined current car parking availability and proposed new temporary parking spots in ideal locations, as well as a system to regulate these spots. This project s field of inquiry was limited to transportation and parking systems within Venice. These systems include public systems that are owned and maintained by the local or state government. The term innovative transportation system refers to methods of transport either still in development or invented in the last 50 years, as well as transportation methods that do not currently exist in Venice in any form but are in use in other locations. When assessing the current transportation systems, the spatial scope was limited to the historic city of Venice, as well as the mainland city of Mestre. In terms of evaluating current systems, we were only interested in what already exists in the historic city and in Mestre, so the scope is limited. Our project also attempted to evaluate innovative systems not currently implemented. When analyzing the feasibility of implementing a transportation system in Venice, the scope was also limited to Venice, since all of the transportation systems that we analyzed would run either within the historic city, or between the historic city and points on the mainland such as Mestre and Marco Polo Airport. Data collected by the VPC and other information sites was collected in previous years for all times of the year. The proposed transportation systems that we evaluated would be active at any time of day and at any point of the year. In terms of data being collected, the team was in Venice between October and December Data collected from Venice by the team was collected during this time span. The following chapters contain detailed methodology, results, and analysis for each of our main objectives. 13
35 4. Parking Systems and Potential Improvements Whether a person is traveling into the historic city by car or attempting to visit a store within it by boat, parking can be difficult. There are very few parking options for arriving cars and the temporary parking near Venetian storefronts for boats is extremely limited. 4.1 Car Parking and Potential Improvements Due to the layout of Venice, cars can either park at Piazzale Roma, the square at the end of the Ponte della Libertá, or at Tronchetto on the edge of the historic city. If all of the lots in the historic city are full, one would have no further options but to return to the mainland in Mestre, and from there travel into and later out of the historic city by other means Methodology - Examining Car Parking Availability and Potential Improvements In order to examine potential improvements to car parking, we first had to evaluate the current car parking availability in Venice. To estimate the availability of car parking in the historic city of Venice and on the mainland in Mestre, we first found the locations of parking services in these areas by finding the locations classified by Google Maps as Parking. We then created a list of the locations that were either within the historic city of Venice, or on the shoreline of Mestre near the Ponte della Libertá. With the exception of Green Park, a private lot in Mestre, every parking lot shown in the Google Maps list contained a link to that parking lot s website. All but one of these websites contained information about the lots capacities. However, since no web site exists for Green Park, and the web site for Venice City Park, another private lot in Mestre, did not display the parking lot s capacity, we had to estimate the capacities of these parking lots using different methods. To find the capacity of Green Park we took a screenshot of the parking lot from Google Map s aerial view and opened the screenshot in AutoCAD. In the AutoCAD file, we created rectangular blocks with the dimensions of a typical car, including buffer room between cars, and placed them over each car and over empty parking spaces, making sure to place the blocks as close to each other as possible without overlapping them. When we had covered the entire parking lot with these blocks in the AutoCAD file, we counted the total number of blocks using AutoCAD s data extraction command. This quantity was recorded as the capacity of the parking lot. Venice City Park had few cars visible in the aerial image available for it on Google Maps. We estimated its capacity by finding the total area reserved for parking using Google My Maps (shown in Figure A of Appendix A), and dividing that by the average area of a parking space. To find the average area of a parking space, we drew blocks around groups of five cars parked adjacent to each other and found the areas of these blocks. In order to ensure that our 14
 with a")
36 results were accurate, we drew three of these blocks, so that we could compute the average area of 15 parking spaces. After establishing the current limitations of the car parking system, we evaluated the possibility of replacing a parking lot in the northwest corner of Tronchetto (shown in Figure 17 below) with a five-story parking garage, the typical garage height given by Means CostWorks. 39 Figure 17. Location of our proposed parking garage In order to estimate the cost of such a parking garage, we found the average cost of a parking garage per parking space in the United States in 2015, and used Equation 1 to adjust this value for inflation and differences in construction costs. CC pp = CC jj (1 + ff) pp jj SS pp SS jj LL pp LL jj Equation 1 In Equation 1, Cp refers to the estimated cost of any parking system being proposed for Venice, Cj refers to the cost of the facility being used as a comparison, f refers to the average inflation rate between times p (the date of new facility s construction) and j (the year of the original facility s construction), Sp and Sj refer to the size of the new facility and the old facility, respectively, and Lp and Lj refer to the country cost indices for the new facility and the original facility. For the purposes of calculating the cost of a parking garage, the Big Mac Indexes of Italy and the United States, which give the average price of a Big Mac at McDonalds in the two (1) 39 Fixr, n.d. 15
37 countries and indicate the purchasing power of their currencies, were used as Lp and Lj, respectively. Since Equation 1 is only used for preliminary cost analysis, the actual cost might be as low as half of the estimated cost and as high as twice the estimated cost Results - Evaluation of Current Car Parking and Potential Improvements Using our methodology, we found there to be a total of 5,633 parking spaces in the historic city of Venice, with another 1,790 spaces directly across the lagoon in Mestre. In the areas of Mestre close to the Ponte della Libertá, public parking is more easily available than private parking, with 1,242 of the 1,790 parking spaces in Mestre owned by government agencies. In the historic city, however, the number of privately-owned parking spaces far exceeds the number of publicly-owned spaces, with 4,900 privately-owned parking spaces and only 733 publicly-owned ones. As shown in Table B, this discrepancy is due to the large parking capacity of the Tronchetto, which can accommodate approximately 4,000 cars. Table 1: Summary of Parking Availability in the Historic City and Mestre Location (Ownership) Sum of Car Capacity Mestre 1790 Private 548 Public 1242 The Historic City 5633 Private 4900 Public 733 Grand Total 7423 When we estimated the capacity of Venice City Park, we found the area of the parking lot reserved for parking spaces to be hectares, and calculated the area of fifteen cars to be hectares. Based on these values, we estimated the capacity of Venice City Park to be
38 cars (see Table 14 and Figure 44). The capacity of Green Park was found to be 222 cars (see Figure 45). Table 2: Cost Calculations for an Additional Parking Garage on Tronchetto US Parking Garage Cost / ft 2 $55.66 Average Inflation from % Elapsed Time (Years) 2 Italy Big Mac Index 4.8 US Big Mac Index 5.3 Base Square Footage of New Facility (ft. 2 ) # of Stories in New Facility 5 Unit Size of Original Facility (ft. 2 ) 1 Tronchetto Parking Garage Cost $25,401, Tronchetto Parking Garage Cost (euros) 21,337, Table 3: Calculations for the Capacity of an Additional Parking Lot on Tronchetto Cost per Parking Space (2015 USD) $18, Cost per Square Foot (2015 USD) $55.66 Square Feet / Space Base Square Footage of New Facility (ft.^2) # of Stories in New Facility 4 Capacity of New Facility 1509 Capacity of Existing Lot 302 Capacity Added 1207 Due to spatial constraints, it would be difficult to add parking spaces within the historic city. However, some possibilities exist for additional parking. Replacing a 97,844-square foot parking lot in the northwest corner of Tronchetto with a five-story parking garage would cost 21,994, and add 1,207 new parking spaces to Venice (accounting for the spots that would be removed to make way for the garage), increasing the historic city s car capacity by 21.4%. 17
39 4.1.3 Analysis - Potential Car Parking Improvements Unlike most bridges, where cars can continue to travel in both directions after crossing the bridge, the only option for cars traveling into the historic city is to park immediately after exiting the Ponte della Libertá, or to immediately return to Mestre. As a result, the number of cars already parked in the historic city and the number of cars leaving the historic city determine the number of cars that can enter. Specifically, the cumulative number of cars that have entered the historic city can be no more than 5,633 cars greater than the cumulative number of cars that have exited the historic city. The 1,207 spaces added by the five-story parking garage would make it easier for daily commuters and people traveling to the city for business purposes to access the city. However, due to the high cost of constructing the garage, the construction costs would be difficult to recover, while the costs of staffing and maintaining the garage would only add to its overall cost, so this project would likely not pay for itself over time. The addition of parking spaces in the historic city could also entice more people to arrive by car and increase congestion on the Ponte della Libertá. While the benefits of replacing a parking lot on Tronchetto with a parking garage would be substantial, the addition of a new garage would have many negative effects that may require additional action. 4.2 Boat Parking and Potential Improvements Parking a boat in the historic city of Venice is an issue faced by boat owners. Those who own boats in the historic city can either park them in private boat parking lots or keep them at Marinas. Tourists can be impacted by this as well, because as canal congestion increases due to parking constraints, canal traffic can increase as the limited space impedes mobility. With the exception of the Canal Grande, the space in the canals is extremely limited, 40 and with boats parked throughout smaller canals, boats have little room to move within the canals Current One-Hour Parking System Although a majority of rive parking spaces are limited to 15 minutes and used primarily for supply delivery and trash pickup, Venice has its own system of boat parking spots reserved for temporary parking by boat owners. These spots are limited to one hour, and are labeled with special signs. An example of one of the signs can be seen in Figure 18 below. 40 Bukowski, n.d. 18


40 Figure 18. Temporary parking signage In addition, boat owners parking in these spots must display the disco orario, a special parking decal acting as a self timer that allows authorities to see how long a boat has been in a space, which can be seen in Figure 19 below. Figure 19. Disco Orario The current temporary boat parking spots can be seen in Figure 20 below. 19
 and parking spots divided by time limit (right) In order to assess the effectiveness and usage of this parking system, we collected data of some of these spots.")
41 Figure 20. All boat parking spots (left) and parking spots divided by time limit (right) In order to assess the effectiveness and usage of this parking system, we collected data of some of these spots. The team visited 9 of the 52 riva parking spots without time availability restrictions every half hour for 5 hours, noting if the spot was in use, if the spots and boats had the proper signs and decals, and taking photos of each boat observed. Based on the data collected, summarized in Table 4 below, the team found that of the 9 spots, only six were used within the 5 hour period. Of the 9 boats observed, 2 exceeded the 1 hour parking limit. In addition, some spots were missing the required signs, and none of the observed boats displayed the required disco orario. We can suggest that, based on the collected data, the system is being exploited. People are violating the guidelines and it has not been observed that authorities are implementing the regulations. Additionally, we can suggest that one hour may not be enough time for temporary boat parking spots seeing as 50% of the boats that remained parked for at least 15 minutes exceeded the one hour time limit. We evaluated this number using boats that were parked for at least 15 minutes because that suggests that the boat owners were using the temporary parking for activities other than things such as loading and unloading. 20
42 Table 4: Summary of Boat Parking Data A B C = B - A Riva # Boat # Time First Spotted Time Last Spotted Minimum Hrs. Spent :02 13: :09 12: :59 15: :09 14: :48 15: :10 14: :12 12: :22 12: :16 15: NONE NONE NONE Vento di Venezia Docks A major factor that we considered when evaluating potential new temporary boat parking was a proposal by Vento di Venezia. They proposed the addition of 31 docks spread throughout Venice and the surrounding area. The proposal included photoshop renderings of each dock, with detailed information including the number of boats that could park at it and estimated cost. However, these spots were spread out and the coordinates listed to locate each spot did not correspond to the locations shown in the photoshop rendering. In order to assess their feasibility and impact as potential improvements, we visualized all the proposed docks on a single QGIS layer. We used Google Maps to find the precise coordinates and used QGIS to sketch a polygon of each dock. Figure 21 below shows an example of one of the docks visualized in QGIS, and Figure 22 below shows a plot of the locations of each of the docks. 21

43 Figure 21. QGIS rendering of one of Vento di Venezia s proposed docks Figure 22. Map of docks proposed by Vento di Venezia Methodology - Examining Boat Parking In order to evaluate the usefulness of temporary boat parking we considered the 91 current available one-hour boat parking spots, potential new dock locations suggested by Vento di Venezia, and stores within the historic city. Temporary boat parking would be primarily used 22

44 for activities such as shopping at stores and having meals. To evaluate this, we needed to visualize the boat parking locations compared to store data from the Venice Project Center. We narrowed down the store data available of the historic city to only include categories of stores that we believe would be used by Venetians. This essentially eliminated categories such as hotels, souvenir shops, travel agencies, etc. We then visualized the current 91 one-hour spots over a heatmap of these stores, as seen in Figure 23 (left). For these temporary boat parking spots to be useable for stores they need to be available during store hours. About one third of the 91 spots in the current one-hour boat parking system can only be used from 20:00 to 04:00, so we then removed these from our visualization, leaving us with 59 spots as seen in Figure 23 (right). Figure 23. Current 1-hour spots and 1-hour daytime spots We were able to conclude that the current system does not provide spots in the most strategic locations if Venetians wanted to take their boat out and visit stores. We came to our conclusions by visualizing the current spots with daytime availability against a heatmap of stores throughout the historic city. The heatmap of stores does not include categories of stores relating to tourism activities, as described previously. The heatmap of stores with the daytime parking spots can be seen below in Figure 24. Figure 24. Current Daytime 1-Hour Boat Parking and Stores Heatmap 23
45 In order to suggest better temporary parking spots, we designed a computer program that would run through all of the current rive spots. To identify the locations of new parking spots, we applied the following criteria: the spot must have a minimum number of stores nearby and more spots should be located near areas of greater store density. Spots also had to be located in canals with a minimum width of 5 meters to allow parking on both sides of the canal and continued mobility through it. Then, we implemented a minimum distance between any two spots. We used QGIS to visualize the 31 docks that Vento di Venezia has proposed around Venice, and removed potential parking spots in proximity to these docks. We then examined the maximum times for which boats should be allowed to park. For the current temporary boat parking system the maximum time is one hour, however, based on our data collection of 9 spots, we found that 25% of the boats observed that remained parked for at least 15 minutes exceeded the one hour time limit. We then considered the amount of time that it takes to dine and shop, two leisure activities that temporary boat parking spots might be used for. In Europe, the average amount of time spent at a restaurant is 77.3 minutes. 41 For shopping, we wanted to account for the total amount of time spent shopping at multiple stores, so even though the historic city does not have shopping malls we found the average length of a trip to a shopping mall in America, 84 minutes, 42 and assumed that it is similar to the full time one might spend shopping in the historic city. The amounts of time spent on both of these activities exceed one hour. Finally, we considered the practicality of two-hour parking spots as opposed to onehour parking spots. Doubling the maximum time that a boat owner can spend parking halves the number of people who can park in a spot throughout the day, should all boat owners stay for the maximum time. This could potentially have a negative effect on store owners because it means that less customers are able to come in. Thus, to account for both the needs of boat owners and the economic impact on stores, only a limited number of temporary boat parking spots should be two-hours Results - Suggesting Boat Parking Spots We believe that the spots seen in Figure 25 below would be ideal for possible temporary parking. These spots fit our mentioned criteria and could improve accessibility to stores. 41 Kimes, Wirtz, & Noone, JCDeaux, n.d. 24
46 Figure 25. Suggested temporary boat parking spots While these 221 spots can be considered viable candidates for increased temporary parking, we have also left behind code that would allow for the alteration of our our criteria. Based on new criteria, different suggested spots could be generated Analysis - Assessing Suggested Spots When examining a specific location with high store density, such as the area surrounding the Rialto Bridge, the current systems provides no daytime spots. By assigning spots based on store density, additional spots were created around the Rialto Bridge in our proposal. When comparing the current spots to the newly proposed spots, the accessibility of stores has drastically increased with our proposal. 4.3 Designing a System for Regulating Boat Parking In order for temporary parking spots to be accessible and regulated, we have designed a platform that will allow both boat owners to find and book temporary parking and authorities to regulate the spots. We have created designs in Adobe Illustrator that can act as a foundation to the development of an actual application available for smartphones. When designing this application, we considered: Enforcement and user side Boat registration Payments and fines Searching for locations Booking within a limited timeframe 25
47 4.3.1 Results - A Smarter System Figure 26 shows our application design, beginning with the login screen (top left). Depending on your login credentials, you will have access to either the user view (bottom left) or the authority view (bottom right). When registering, a user is brought to the registration screen (top middle and top right) where they must provide their personal information, boat information, and payment information. This allows them to be easily identified by enforcement. On the user view, users are able to enter the desired location to which they are traveling and view current availability of spots in that area. When the user selects a spot, they can then see the future availability of that spot for the next 6 hours. From there, they can then book and pay. On the enforcer view, enforcers are able to select a spot to see if it should be currently occupied, and if so, by whom. If the user who booked the spot remains parked past the time limit then they can be issued a fine through the app, and if a boat is parked in a spot that is unregistered with the system, a ticket will be issued. 26


48 Figure 26. Parking app 27
49 4.3.2 Analysis - Assessing a Digital Regulation System When a new regulation system of any type is created, the public will often want the old system to also remain. If the current system of using the disco orario to mark the time arrived at a spot were to be used in addition to the proposed smartphone application, the feature of booking in advance would have to be eliminated. It is not possible to have a boat owner s booked spot be valid if a boat owner using the current system were to park in that spot before they arrived. To use the smartphone application, users would have to arrive at an open spot and then book the spot. Additionally, it would be impossible to implement a payment system through the smartphone application as the current system is free to use. In the attempt at suggesting an efficient system, a system combining the old system and newly proposed system would not be ideal. The new system will have to be standalone in order to be efficient. This means that everyone using the system will have to possess a smartphone. If a boat owner does not have a smartphone or does not register with the application they cannot use the potentially implemented parking spots. Based on data collected, we do not foresee this as a problem. The amount of smartphone users in 2014 was 1.57 billion and the predicted amount for 2020 is 2.87 billion. 43 Of Italy s population of about 59,798,000, 39,323,000 (65.8%) use a smartphone. 44 Technology is becoming more innovative and people are continuously adapting to a changing environment. If implemented, we believe people will be able to adapt to this newly proposed system. 4.4 Conclusions Car parking in Venice is fairly limited, with a total of 5,633 spots in the historic city and another 1,790 spots immediately across the Ponte della Libertá in Mestre. Since cars arriving in the historic city have to either park or turn around, the number of parking spots in the historic city limits the number of cars that can travel over the Ponte della Libertá, leading to congestion on the bridge. Due to the spatial constraints in the historic city, we considered the possibility of converting a current parking lot in Tronchetto into a five-tier parking garage. This lot would increase the car capacity of the historic city by 15.6%, but would cost nearly 22 million to construct and increase traffic on the Ponte della Libertá because additional parking incentivizes more people to drive into the historic city. As a result, we do not recommend the construction of such a garage. We observed two major flaws in the historic city s boat parking system: a lack of onehour spots close to non-tourist stores, and a lack of enforcement of parking regulations. Of the nearly 1,600 rive in Venice, only 91 are available for one-hour parking, and only 59 of these onehour spots are available during the day. Based on the Venice Project Center s data on the locations of stores, these one-hour parking spots are not in optimal locations for shopping at 43 Statista, n.d. 44 Newzoo,
50 these stores. Using this store data, information on the widths of Venice s canals, and the locations of docks proposed by Vento di Venezia, we were able to suggest spots that we recommend that the city convert to one-hour spots. From field work, we witnessed faults in the current one-hour parking system, especially a lack of signs on many of the parking spots. We also found that this system was being exploited, with boat owners often exceeding the maximum time limit and not displaying required information, and found it appropriate to suggest a new system for regulation. We believe that it is time for the boat parking in Venice to align with the current available technology. We designed the layout of a smartphone application that could be used to book (on the user side) and to regulate (on the authority side) our suggested parking spots. Since we do not believe that this system could be used alongside the current system for boat parking regulation, we recommend phasing the current system out and replacing it with the smartphone application that we designed. 29

51 5. Potential Improvements to Water Bus Systems We considered two small scale improvements to Venice s infrastructure, both of which involved changes to the ACTV water bus service. First, we investigated the possibility of replacing the southern part ACTV lines 5.1 and 5.2 with line 6 that runs express between Lido and Piazzale Roma, while line 6 would make all of the stops that lines 5.1 and 5.2 would skip. We evaluated the benefits associated with this system in terms of the time that it would save on the trip from Lido to the Ferrovia. We also investigated the possibility of reopening the Rio de l Arsenal and the Canale delle Galeazze, two connected canals on the eastern end of the historic city, to water bus service. We found the additional cost of adding water bus service through the canals, and estimated the amount of time that it would take boats to travel through the canals in order to determine the time savings associated with this additional service. 5.1 Express Boat Service The ACTV waterbus system currently includes express lines that skip various stops in order to reach certain points of interest more quickly. One example is line 6, which acts as a de facto express line for lines 5.1 and 5.2 during the summer. During the summer, as shown in Figure 27, this line makes five stops over the course of its route: it begins its route at Lido S.M.E. and makes stops at Sant Elena, Giardini, and Zattere before terminating at Piazzale Roma; in comparison, lines 5.1 and 5.2 (shown in Figure 29) make nine stops along the south end of the historic city between Lido and Piazzale Roma. During the winter, as shown in Figure 28, line 6 makes additional stops at San Marta, San Basilio, and Spirito Santo on the western and southern ends of the historic city. This increases the amount of time that it takes to travel between Lido and Piazzale Roma. Figure 27. ACTV line 6 summer service 30


52 Figure 28. ACTV line 6 winter service Figure 29. Map showing service for ACTV line 5.1 However, whereas Lines 5.1 and 5.2 continue their routes on the north end of the historic city, line 6 terminates at Piazzale Roma. As a result, it does not provide service to the Ferrovia and the northwest corner of the historic city. One of the goals of our project was to investigate the possibility of extending the express service that line 6 offers during the summer north of the Piazzale Roma Methodology We investigated the possibility of changing the route of Lines 5.1 and 5.2, so that both lines make only the stops that line 6 currently makes between Lido and Piazzale Roma. Under this system, line 6 would serve as a local line along the south end of the historic city, making all of the stops that lines 5.1 and 5.2 currently make between Lido and Piazzale Roma. We examined the time savings that this would afford in terms of the travel times from Lido to Ferrovia with the existing summertime service and with express service along the south end of the historic city. We used this past summer s timetables for line 5.1 in order to find the amount of time that it takes to travel from Ferrovia to Lido. In order to estimate the amount of time that it would take an express version of line 5.1 to travel between these two points, we found the amount of time that it takes line 5.1 to travel from Ferrovia to Piazzale Roma and added it to the 31

53 amount of time that it takes line 6 to travel from Piazzale Roma to Lido during the summertime, based on the timetables for that line. Figure 30. Proposed express line to replace Lines 5.1 and 5.2. Figure 31. Proposed local line for the south end of Venice Results If Lines 5.1 and 5.2 were replaced with the express service shown in Figure 30, it would take 34 minutes to travel from Ferrovia to Lido. This travel time is based on the fact that it takes four minutes to travel from Ferrovia to Piazzale Roma on line 5.1, and 30 minutes to travel from Piazzale Roma to Lido on line 6 during the summertime. Currently, it takes 43 minutes to travel between the two points in the summertime using line Analysis The time savings associated with replacing Lines 5.1 and 5.2 with an express line along the south end of the historic city are small. However, since the lines currently run with the same frequency, and would presumably continue to run with the same frequency when their routes are changed, this change in service would not result in any additional cost. In addition, replacing the south ends of Lines 5.1 and 5.2 with express service would improve access not only to the Ferrovia, but to the Guglie and Tre Archi stops in the Cannaregio Canal as well. This change in ACTV service would not require that any existing pontoons be replaced, since Lines 5.1 and 5.2 use the same type of boat as line 6. 32
54 The main disadvantage of modifying Lines 5.1, 5.2, and 6 is that the new Lines 5.1 and 5.2 (which would run express along the south end of the historic city), would skip the San Zaccaria stop, while the new line 6, which would stop at San Zaccaria, would not reach the train station. If this service were implemented, the number of lines connecting San Zaccaria to the Ferrovia through the Giudecca Canal would be reduced by half, with Lines 4.1 and 4.2 continuing to travel along this route. While other lines, such as Lines 1 and 2, travel between San Zaccaria and the Ferrovia, they do so along the Grand Canal, and as a result take much longer to complete the journey. This reduction in service could be addressed by joining the new line 6 with Line 3 at Piazzale Roma, so that the local line along the south end of the historic city could then run to Murano. Since line 6 runs every 20 minutes, while Line 3 runs every 30 minutes during the winter, this would require Line 3 to run with an increased frequency, raising the ACTV s operating costs. However, since Line 3 uses the same boats as Lines 5.1, 5.2, and 6, connecting Line 3 with the slow line along the south end of the historic city would not require any stations to be replaced. As a result, the only additional costs associated with connecting the two lines would be the operating costs associated with the increased frequency of service from the Piazzale Roma to Murano. 5.2 Reopening the Rio de'l Arsenal Prior to 1999, ACTV boats ran through the Arsenal along the Rio de l Arsenal and the Canale delle Galeazze, which offered a shortcut for water busses which would otherwise have to travel around the eastern end of the historic city. In 1999, however, the Canale delle Galeazze was closed for repairs and never reopened 45 ; in order to travel between the south and north ends of the historic city along its east side, boats now had to travel around the eastern end of the city. We examined the possibility of running ACTV service through the Rio del Arsenal and the Canale delle Galeazze (collectively referred to as the Rio de'l Arsenal in this section) in order to reduce travel times between the southern and northern ends of the historic city Methodology Since the Rio de'l Arsenal is already wide enough that it does not need to be widened in order to allow water busses to run through it, and reopening it would not require the ACTV to expand its fleet, there are no capital costs associated with reopening the Rio de'l Arsenal to water bus service. In order to calculate the operational expenses associated with additional ACTV service through the Rio de'l Arsenal, we found the 1998 ACTV operating expenses, the final year in which the use of the Rio de l Arsenal was still factored into the ACTV s budget, and adjusted for inflation. We then used the current ACTV timetables to find the total number of hours per 45 Paolo Corposanto (Personal Communication) 33
55 day that all boats spend in revenue service, and divided the ACTV operating costs by this number in order to find the cost of running a boat for an hour per day every day of the year. Next, we found the total number of hours per day that boats would spend running through the Rio de'l Arsenal. To do this, we found the time that boats would require to go through the canal by dividing the length of the canal by the average speed at which ACTV boats travel. Since the service through the Rio de l Arsenal would be an express service for an existing line (ACTV lines 4.1 and 4.2), we assumed that boats would travel through the canal once every 30 minutes-- once per hour in each direction--and divided the time required to travel through the canal by this amount. We then multiplied the resulting quotient by 18 hours, since Line 4.1, to which the service through the canal would be an addition, runs from 6am to midnight. 46 Finally, we multiplied the resulting value by the cost of running a boat for an hour per day every day of the year in order to find the cost of service. In order to assess the benefits of opening the Rio de'l Arsenal to ACTV service, we found the amount of time that boats would take to travel from Arsenale to Celestia by dividing the distance between the two stops along the Rio de'l Arsenal by the average speed of ACTV boats. 47 We also found the time that it currently takes to walk between the two stops by tracing the shortest route in Google My Maps, finding the length of the route, and dividing the length by 1.42 m/s, the average human walking speed. 48 Finally, we found the amount of time currently required to travel between the two fermata using the timetables for ACTV Lines 4.1 and Results The total annual operating expenses for the ACTV were estimated to be 103,000,000 based on 1998 ACTV operating expenses and adjusting for inflation. Since ACTV boats are in revenue service for hours per day 49, we estimated that it cost 88,000 to run a single line for an hour per day, every day of the year. As shown in Table 1, we estimated the cost of service through the Rio de'l Arsenal by assuming that the line would be in service for 18 hours a day and that there would be two crossings of the Rio de'l Arsenal per hour (one in each direction). Based on these assumptions, we determined that adding boat service through the Rio de'l Arsenal would cost an additional 580,000/year. Table 5: Cost Analysis of Additional ACTV Service Through the Rio de'l Arsenal A 1998 ACTV expenses (lire) 1.44E+11 B 1998 ACTV expenses (euros) 74,395, ACTV, n.d. 47 Nodine et al., Browning, Baker, Herron, and Kram, ACTV,
56 C inflation 38.93% D = B x (1+C) 1998 ACTV expenses (2017 euros) 103,357, E Boat-hours of service/day F = D / E Cost/boat-hour x 365 days 88, G Hours/day in service 18 H Avg. Time Between Boats (minutes) 30 I Time to go through Canal (minutes) 11 J = G x I / H Boat-hours/day 6.58 K = F x J Annual Cost of Service 580, As shown in Table 2, boats traveling through the Rio de'l Arsenal at the typical water bus speed of 5.8 km/hr 50 would take approximately 11 minutes to travel between the Arsenale and Celestia fermata, the ACTV stations at each end of the canal. In comparison, boats currently take between 25 and 26 minutes to travel between the two stations, based on timetables for ACTV Lines 4.1 and 4.2. Table 6: Estimated Travel Time of Boats Through the Rio de'l Arsenal Potential Ferry Line Distance Speed Time 1.06 km 5.8 km/hr minutes Analysis The benefits of reopening the Rio de'l Arsenal can be determined in terms of how much time an ACTV line through the canal would save compared to the current means of traveling between the Celestia and Arsenale fermata (boat stops). Table 7 and Table 8 show the current travel times between Arsenale and Celestia by walking and taking an ACTV boat, respectively. 50 Nodine et al.,
57 Table 7: Calculations for Time Required to Walk From Arsenale to Celestia Distance Speed Time Time 1.08 km m/s s 12.7 minutes Table 8: Current Ferry Travel Times Between Celestia and Arsenale Celestia-Arsenale Arsenale-Celestia 25 minutes 26 minutes Compared to walking along the canal, the time savings afforded by running an ACTV line through the Rio de'l Arsenal are small, with less than two minutes of time saved per person. However, the walking speed used in Table 3 apply to the average human being; some groups, such as elderly or disabled individuals, walk at a slower pace. These individuals might also not be able to walk the 1.08 km between the two stations, and might find it easier to remain on the boat as it travels around the eastern end of the island. Reopening the Rio de'l Arsenal to ACTV service would benefit these people especially. Replacing some of the existing service along Lines 4.1 and 4.2 with service through the Rio de'l Arsenal would help reduce costs, but would also make it harder to access the eastern end of the city and the island of Certosa, and would make it more difficult for people in these places to access the rest of the city. However, all of the spots that would be skipped by a line running through the Rio de'l Arsenal are also served by Lines 5.1 and 5.2. Since both of these lines terminate at Lido, however, somebody hoping to travel from the south end of the historic city to the north end of the historic city (or vice-versa) would have to take a boat to Lido and wait for another boat back to the historic city. There would be no other way to reach Certosa. 5.3 Conclusions The current water bus routes were examined with the purpose of finding possible smallscale improvements. Express lines currently exist within the water bus system, but we proposed an alteration. Since there is no express line connecting Lido and the train station, we investigated the possibility of replacing the southern portion of lines 5.1 and 5.2 with an express line that makes only the stops that line 6 makes during the summer. We estimate that this express service can reduce travel times between Lido and the train station by 9 minutes. Since lines 5.1, 5.2, and 6 run with the same frequency, and would likely run with the same frequency even if their routes were reconfigured, we assumed that the added costs of reconfiguring their routes would be 51 Browning et al.,
58 negligible. Because reconfiguring lines 5.1, 5.2, and 6 would decrease the travel times to the train station and the northwest end of the historic city at little to no additional cost, we recommend that authorities consider this possibility. We then examined reopening the Rio de l Arsenal, which was closed in 1999 to water bus service. We determined that doing so would reduce travel times from Arsenale to Celestia by fourteen minutes for those taking the water bus between these points, but that an hourly service between these points would cost 580,000 per year. While some water buses on lines 4.1 and 4.2 could run express through the Rio de l Arsenal, this would require them to bypass the entire east end of the historic city and the island of Certosa, reducing service to these areas. Because of the implications of reduced service to the east end of the historic city, we recommend reopening the Rio de l Arsenal to water bus service only if service through it is added as an extra route and does not affect existing ACTV service. 37
59 6. A Subway System for Venice Subways are currently being used in cities all over the world, and provide quick, inexpensive transportation for commuters and tourists alike. Subways have the advantage of operating underground, and therefore are unaffected by weather conditions or traffic above them. Subways also create the convenience of directly connecting major travel destinations within a city. 6.1 Venice Subway System Past Proposal A proposal for a subway system in Venice was made in 2005 by the mayor of Venice at the time, Paolo Costa. This subway was proposed to travel from the mainland starting at Marco Polo Airport, making 5 stops throughout Venice before ending near Arsenale in the historic city. Travel time from start to end was estimated to be 14 minutes. The Venetian government agreed to pay 56% of the 343 million euro estimated cost. The rest would have to come from private investors. Supporters for the subway claimed it would increase mobility and make it easier for businesses and workers to access the historic city. This proposal ultimately was never implemented, partially due to public opposition, with critics claiming that the subway system would only bring in more tourists. 52 Additionally, while the project received enough contributions from private investors to meet the total cost, the money contributed by these investors was allocated elsewhere Isochrone Generator Isochrones are ways to visualize the area around an origin point that can be reached within a set amount of time. In order to assess the current limits of mobility compared to the limits of mobility if a potential subway system were to be implemented, we used a tool referred to as an Isochrone Generator. This tool we have constructed produces isochrones for analysis. The tool accepts a specific travel time, a latitude, and a longitude as an origin point. The tool then accesses Google Maps Distance Matrix API, returning the duration of travel using walking and available public transportation from the inputted origin to hundreds of points located in a grid format throughout Venice. The outputted result is an infographic that displays red areas where the travel time is less than or equal to the inputted desired travel time. As the travel time approaches the inputted travel time, the boxes color decrease in opacity. An example of an input and output with this tool can be seen in Figure 32. Additional isochrones visualizing the current systems can be found in Appendix B. 52 Sylvers, Fabio Carrera (Personal Communication) 38
60 Input: startingpoint = ' , ' (coordinates of rialto bridge) traveltime = 15 (minutes) Output: Figure minute isochrone from Rialto bridge 6.3 Subway Route Simulator With the isochrone generator, it is possible to visualize many places that can be accessed from a starting point. However, what if you want to see how a specific route would change with the implementation of a subway system. Using a tool that we created, the subway route simulator, this analysis is now possible. As an example, in Figure 33, we can examine with our tool the route and duration of a current trip using public transit and walking from Mestre to Lido. We could also select a potential subway system and view that same route and estimated duration if the selected subway system was created and implemented. The altered route and duration can be seen in Figure 33. This tool will allow us to improve our analysis of suggested systems, as well as provide a way to analyze systems presented in the future. Additional route comparisons can be found in Appendix C and Appendix D. 39


61 Figure 33. Subway route simulator from Central Mestre to Lido using current system (top) and using suggested subway system (bottom) 6.4 Methodology We analyzed several possible options for subway lines into and within Venice, including both new routes and those from past proposals. The first option that we analyzed was the line proposed by Paolo Costa in This line was supposed to have a total length of 8,166 meters and stop at the following locations: Marco Polo Airport Terminal Tessera, located 615 meters southwest of the Marco Polo Airport Murano San Mattia, an island in the northwest of Murano The south end of Murano The west end of Fondamente Nove, on the historic city s northern end The historic city s hospital Arsenale Nord, on the north end of the historic city 40
62 We analyzed the costs and benefits of this line as described in Section and , respectively. We next analyzed an alternate subway line. Similar to the line proposed by Costa, this line would run underwater in order to avoid construction underneath the historic city. However, unlike the line proposed by Costa, this line would also connect to Lido and Giudecca. The line that we examined would stop at the following locations: Lido Santa Maria Elizabeta (S.M.E.), an existing transportation hub on an island of Venice with 16,869 residents. 54 San Zaccaria, which is not only close to the Piazza San Marco and the various tourist attractions located in that area, but is already an ACTV transportation hub. In the middle of the Giudecca canal, connected by a pedestrian tunnel from which pedestrians could reach Giudecca Palanca and Zattere. Giudecca Palanca is located in the center of Giudecca and is home to 6,151 residents. 55 The station in Zattere is close to many of Venice s universities and to the Ponte dell Accademia, which provides a link to San Marco. Between Ferrovia and Piazzale Roma. This stop would provide riders of the subway with access to inter-city rail and bus transportation. Possible extension A of this line would be to Central Mestre, near the central station of its tram system. This stop would provide access to the mainland of Venice, which is home to 70% of the city s population. 56 Possible extension B of this line would be to Marco Polo Airport, the fourth-busiest airport in Italy, which received 9.6 million arrivals in The line from Lido to Piazzale Roma can be seen below in Figure 34. Possible extension A to Central Mestre can be seen below in Figure 35. Possible extension B to Marco Polo Airport can be seen below in Figure Venice Project Center, n.d. 55 Venice Project Center, n.d. 56 Venipedia, Assaeroporti,
63 Figure 34. Route map from Lido to Piazzale Roma Figure 35. Possible extension of the Lido - Piazzale Roma subway to Mestre 42
64 Figure 36. Possible extension of the Lido - Piazzale Roma subway to Marco Polo Airport We also assessed the possibility of several alternate potential subway routes within Venice: A line connecting Murano to Ferrovia and Piazzale Roma. A modification of the line proposed by Paolo Costa in 2005, which would extend to Lido. This line would also make fewer stops, stopping only at Marco Polo Airport, Murano, Fondamente Nove, and Lido S.M.E. A line running from Marco Polo Airport to Fondamente Nove, Ferrovia, and lastly Piazzale Roma. For each of these systems, we plotted a potential route in Google My Maps in order to determine the necessary track length for each line. We then found the costs of each line, the expected travel times between each station, and the current travel times between the locations of each station using the methodology described below. 43

65 6.4.1 Estimating Subway System Costs Figure 37. Map of other proposed subway systems Using the selected subway routes previously determined, we performed cost analysis on these hypothetical implementations. We found the costs of subway construction projects in other cities, and used these costs to estimate the costs of a similar system in Venice using Equation 1: CC pp = CC jj (1 + ff) pp jj SS pp SS jj LL pp LL jj In Equation 1, Cp refers to the estimated cost of a subway system being constructed in Venice, Cj refers to the cost of the facility being used as a comparison, f refers to the average inflation rate between times p (the date of new facility s construction) and j (the year of the original facility s construction), Sp and Sj refer to the length of the Venice subway system and the original subway system, respectively, and Lp and Lj refer to the city cost indices in Venice and in the city where the subway system being used as a reference was constructed. Since Equation 1 is only used for preliminary cost analysis, the actual cost might be as low as half of the estimated cost and as high as twice the estimated cost. For each subway system route that we evaluated, we found the costs of several infrastructure projects and compiled a cost estimate based on the individual cost estimates (1) 44
66 obtained using Equation 1. These revised cost estimates were based on the minimum estimated cost, the average estimated cost, and the maximum estimated cost, as shown in Equation 2. CC pp,rrrrrrrrrrrrrr = CC pp(mmmmmm. ) + 4 CC pp (aaaaaa. ) + CC pp (mmmmmm. ) 6 (2) Equation 2 Equation 2 In addition to estimating the costs of constructing these systems, we estimated the operating costs of these systems using present value analysis. The present value of an expenditure made (or a profit achieved) at some point in the future is calculated using Equation 3, shown below: PP PPPP = (1 + rr) nn (3) Equation 3 Equation 3 In Equation 3, PV refers to the present value of a sum of money either gained or spent, P refers to the amount of money either spent or gained, n refers to the amount of time elapsed between the present and the time in which the transaction takes place (typically in years), and r refers to the effective interest rate, which is calculated based on the interest rate and inflation rate as shown in Equation 4: rr = 1 + ii 1 + ff 1 (4) Equation 4 Equation 4 In Equation 4, i refers to the interest rate and f refers to the inflation rate. Both the average interest rate and the average inflation rate can be calculated based on the inflation rates over a period time using Equation 5: nn ii aaaaaaaaaaaaaa = (1 + ii 1 )(1 + ii 2 )(1 + ii 3 )... (1 + ii nn ) 1 (5) Equation 5 We estimated the costs of the suggested subway routes using two methods. First we used the Comparison Method, which allowed us to estimate the cost of any subway system proposed for Venice based on its length and the cost of subway systems previously constructed in other cities. For this method, we applied the methodology described above to the following subway construction projects from areas throughout Europe: An extension to Berlin s subway system, completed in Spiegel Online,
67 A 1.9-km extension to Line 6 of Naples s subway, opened in Amsterdam s North-South Line 60 Copenhagen s Circle Line 61 Paris s Metro Line We estimated the unit cost per kilometer of these systems if they were constructed in Italy using Equation 1. In order to account for the differences in construction costs (the Lp/Lj term in Equation 1), we found the labor cost indexes of the countries in which these systems were constructed and compared them to Italy s labor cost index. 63 After calculating an estimated unit cost for each of the five systems listed above, we used Equation 2 to estimate a final cost per kilometer for any subway system in Venice. The second method that we used, the Unit Cost Method, accounted for both the length of the subway system being constructed and the number of stations that it contained. For this method, we obtained a separate unit cost per kilometer of one-track underground railway (the type of railway proposed for Venice in 2005) 64 and a unit cost per underground station from Don H. Pickrell s 1985 paper Estimates of Rail Transit Construction Costs, which analyzed the costs of various rapid transportation systems in the United States and created equations to predict the cost of railway lines based on their length and number of stations. 65 We adjusted both unit costs for inflation, converted from dollars to euros, and estimated differences in the two countries labor costs using the countries Big Mac Indexes, which give the average price of a Big Mac in a given country and indicate that country s purchasing power. We also adjusted the unit cost for the railway by converting from miles to kilometers. Our calculations for these revised unit costs can be found in Table 12 in Appendix C. After we had calculated the unit costs per kilometer of rail and per station, we estimated the costs of the various subway lines we were evaluating for Venice using Equation 6: CC tttttttttt = aa 1 LL + aa 2 LL Equation 6 Equation 6 In Equation 6, a1 represents the cost of construction per kilometer of one-track underground railway, L represents the length of railway in kilometers, a2 represents the cost of construction per station, and N represents the number of stations. In order to find the maintenance and operating costs for each subway system, we applied the Comparison Method methodology as described previously to the following rail transportation systems: (6) 59 Railway Gazette, Levy, Railway Gazette, Levy, YCharts, n.d. 64 Sylvers, Pickrell,
68 Port Authority Trans-Hudson (PATH) system Los Angeles Metro Rail Boston T New York City Subway Miami Metrorail Washington, D.C. Metro Madrid Metro Philadelphia SEPTA subway Atlanta MARTA Berlin U-Bahn Paris Metro and RER London Underground Bay Area Rapid Transportation (BART) system Chicago L 66 We then estimated the unit cost per car-mile of these systems if they were constructed in Italy using Equation 1. In order to account for the differences in construction costs (the Lp/Lj term in Equation 1), we found the Big Mac Indexes of the countries in which these systems were constructed and compared them to Italy s Big Mac index. 67 After calculating an estimated unit cost for each of the 14 systems listed above, we used Equation 2 to estimate a final cost per carmile for any subway system in Venice. After we had found a maintenance cost per car-mile, we divided this by the number of passengers that a subway car could accommodate and multiplied the quotient by the length of the subway system in order to find the maintenance cost per passenger, assuming that each passenger rode the route for its entire length. Next, we needed to find the potential ridership for each subway line being evaluated in order to find the total operating cost by passenger use. In order to find the ridership of the line from Lido to Piazzale Roma, we found the number of overnight stays in the historic city by tourists each year from and projected the number of overnight stays from , by which point a financially sound subway system should have generated enough revenue to pay off its construction costs and interest on those costs, using linear regression. We estimated the number of trips taken by tourists by assuming that, on average, each tourist used the subway once for every day that they spent in the historic city, and that half of all day trippers, which we calculated from the number of day trippers entering the city in and assuming the number increased in proportion to the number of overnight arrivals, used the subway system once. Using these assumptions, the total number of tourist trips was equal to the sum of the number of nights spent by tourists in the historic city, the number of arrivals in the historic city, and half of the number of day trippers visiting the city. We also estimated local ridership of the subway by 66 Levy, YCharts, n.d. 68 Blanco, D Ambrosio, La Manna, Martin,
69 obtaining the combined population of the historic city, Giudecca, and Lido, which would each be connected to the subway route, in 2011 and Based on these numbers, we projected the combined population of these islands forward through 2080 and multiplied the population for each year by 260 in order to predict ridership, based on the assumption that half of the residents of these islands used the subway once per day, every day of the year. For each year from , we added the expected tourist ridership and the expected local ridership and multiplied this value by the operating cost per passenger. We estimated the maintenance costs for the extension into Mestre based on the estimated number of people using the extension. In order to find the ridership for the proposed extension to Mestre, we found the number of people arriving in the historic city along the Ponte della Libertá by bus on a typical weekday in 1986 and 1997 and divided the numbers obtained by two, based on the assumption that half of the people arriving by bus would switch to taking the subway if such a system existed. We used linear regression to estimate the number of people who would use the subway on typical weekdays from 2018 through 2080, and multiplied these values by 520 to predict annual ridership, assuming those accessing the historic city by subway rode it every weekday and also used it to return to Mestre. We then multiplied these values by the operating cost that we had calculated for the extension to Mestre. In order to find the ridership for the proposed extension to the airport, we found the number of people who arrived at and departed from Marco Polo Airport each year from We then estimated the number of locals and tourists who arrived at the Airport during each of these years, based on the number of tourists who arrived in We predicted the number of locals and tourists arriving at Marco Polo Airport through 2080 using linear regression, and estimated the number of people using the subway system by multiplying the number of locals by 15%, half of the percentage of Venice s residents who live in the historic city, and the number of tourists by 50%. We found the maintenance costs for each year by multiplying the total number of people using the system by the maintenance cost per person that we had calculated for the system. We then calculated the present value of the total costs of construction and operation of each system through 2080 using Equation 3. For this present value analysis, we assumed that 0.98 km of each system proposed could be constructed in one year, but that all of the capital costs of construction would be committed at the start of This value is based on the construction times and lengths of the Berlin subway system extension, the Naples line 6 extension, and Paris s Metro Line 14. We also found the interest accrued on each branch of the subway system over time, using an average interest rate of 2.06% in the Eurozone from For our calculations of interest, we assumed that all construction costs would be committed and begin to accrue interest at the start of Trading Economics, n.d. 48
70 6.4.2 Estimating Subway System Benefits We quantified the benefits of innovative transportation systems by estimating the time saved by using these transportation systems and the number of people using these systems. We also considered less quantifiable benefits of these subway lines, such as a more pleasant trip to the airport or the alternative to the Ponte della Libertá offered by a subway system into Mestre. In order to estimate the travel time saved, we first established the current travel times for individuals traveling along the subway routes with the current public transportation systems using the Directions feature in Google Maps. In order to ensure that our results reflected typical travel times, we found the travel times at 12:00 pm on weekdays, when public transportation would most likely be running frequently, and recorded both the difference between the arrival time and 12:00 pm, and the difference between the arrival time and the recommended departure time. Finding both of these gave us both the minimum amount of time that it takes to travel between the two points, and the amount of time that traveling between the two points might be expected to take if one had to wait for transportation to arrive. We did this for all of the subway routes we are evaluating. Next, we estimated the revenue benefits through ticket sales. For the subway system proposed in 2005 by Paolo Costa, found the number of people who arrived at Marco Polo Airport each year from We then estimated the number of locals and tourists who arrived at the Airport during each of these years, based on the number of tourists who arrived in We predicted the number of locals and tourists arriving at Marco Polo Airport through 2080 using linear regression, and estimated the number of people using the subway system by multiplying the number of locals by 15% and the number of tourists by 50%. We then found the revenue generated by the subway system by multiplying the number of locals using the transportation each year by 2.00, the proposed fare for locals, and by multiplying the number of tourists using the transportation by 6.00, the proposed fare for tourists. 70 Then, using the ridership found for the Piazzale Roma to Lido route, as well as the possible extensions to Mestre and to Marco Polo Airport as described above, we estimated the revenue benefits for these routes using the same proposed ticket fares as in the 2005 proposal. For the branch of the subway system running from Lido to Piazzale Roma, we found the number of trips taken by tourists each year from using the methodology described in Section and multiplied these numbers by 6.00, the proposed fare for tourists. 71 We also found the number of trips taken by locals using the methodology described in that section and multiplied the values obtained by We estimated the total revenue generated by the extension to Mestre based on ridership of that extension. In order to find the ridership for the proposed extension to Mestre, we found the number of people arriving in the historic city along the Ponte della Libertá by bus on a 70 Sylvers, Sylvers,
71 typical weekday in 1986 and 1997 and divided the numbers obtained by two, based on the assumption that half of the people arriving by bus were arriving from Mestre and the other half were arriving from more distant locations. We used linear regression to estimate the number of people who would use the subway on typical weekdays from 2018 through 2080, and multiplied these values by 520 to predict annual ridership, assuming those accessing the historic city by subway rode it every weekday and also used it to return to Mestre. For the potential extension to Marco Polo Airport, we estimated the number of locals and tourists who arrived at the Airport during each of these years, based on the number of tourists who arrived in We predicted the number of locals and tourists arriving at Marco Polo Airport through 2080 using linear regression, and estimated the number of people using the subway system by multiplying the number of locals by 15% and the number of tourists by 50%. We found the total revenue generated by the system by multiplying the number of locals using the system by 2.00, and multiplied the number of tourists using the system by We also investigated the possibility of using the subway system to ship cargo into the historic city as a means of subsidizing the system. We found the weight of cargo that arrived in Marco Polo Airport each year from , and estimated the weight of incoming cargo through 2047 using linear regression. We then created a data table with different percentages of cargo entering the historic city and different rates charged per ton of cargo transported on the subway. This data table showed the percentage of the present value of the subway s expected revenue through 2047 compared to the present value of the subway s costs through 2047, as a function of these two parameters. For the subway routes which we investigated, we found the travel times between stations using Equation 7, shown below: tt = dd 0.09aa (7) Equation 7 In Equation 7, t represents the travel time between stations, d represents the distance between these stations, and a represents the train s acceleration and deceleration. This equation was derived from the assumption that the trains would spend the first 10% of their travel time between stations accelerating at a constant rate, travel at a constant speed for the middle 80% of their trip, and spend the final 10% of their journey decelerating at a constant rate. The calculations that led to the derivation of this equation can be found in Figure 19. Entering the distances between stations on the 2005 proposed Airport-Arsenale line and using the Goal Seek function, which allows the user to find the value of an input necessary to produce a specified output, to ensure that it took 14 minutes for the train to run between the two termini resulted in an acceleration of m/s 2. 50
72 6.5 Results We determined that the main branch of the potential subway system that we evaluated, from Lido to Piazzale Roma, would require seven years and billion to construct, and would open in We determined that the extension to Mestre would take nine years and billion to construct, while the extension to Marco Polo Airport would take eight years and an additional billion to construct. Assuming that these extensions are constructed at the same time as the line from Lido to Piazzale Roma, the extension from Piazzale Roma to Mestre would open in 2027 and the extension from Piazzale Roma to Marco Polo Airport would open in Proposed Subway System Costs Using the Comparison Method, the subway lines being proposed for Venice were estimated to cost 201 million per two-track kilometer, or million per one-track kilometer. Alternatively, using the Unit Cost Method, these lines were estimated to cost roughly 106 million per kilometer of two-track rail and 66 million per station. These figures were based on a 1985 report that analyzed the costs of various rail transportation systems in the United States and gave unit costs of $103 million (USD in 1983) for each two-track mile of underground rail and $40 million million for each underground station for rapid transit. 72 The values given in that report were adjusted for inflation and differences between purchasing power in the United States and Italy, and were converted from cost per two-track mile to cost per two-track kilometer. As shown in Table 9 and Figure 38, the route from Lido to Piazzale Roma is expected to be the most profitable segment of the subway. It is expected to take seven years and cost billion to construct. However, assuming the subway were to be in operation by 2025, it would generate enough revenue from ridership to pay off all of interest accrued on construction costs and previous maintenance costs by 2034, and would be financially self-sufficient after that year. Table 9: Construction Costs for the Lido - P.le Roma Route Using the Comparison Method Track and Stations Access Tunnels Total Avg. 1,287,899, ,637, ,341,537, Min. 424,629, ,684, ,314, Max. 2,332,517, ,143, ,429,661, Value to use 1,318,000, ,000, ,373,000, Pickrell,
73 Figure 38. Graph of Cumulative Costs vs. Revenue for Lido - Piazzale Roma Route Extending service to Mestre would cost an additional billion, raising the total cost of the system to billion. While the extension to Mestre alone would not generate enough revenue to pay off the interest on the costs of constructing the extension, the full line from Lido to Mestre would generate enough revenue to pay off all construction costs, in addition to all prior operating costs and interest, by 2044, as seen in Figure 39. Figure 39. Graph of Cumulative Costs vs. Revenue for the full line from Lido to Mestre 52
74 Extending the subway line to Marco Polo Airport would add billion to the cost of the subway system, increasing the total cost of the system of Lido to Marco Polo Airport to billion. As is the case with the extension to Mestre, the extension to the Airport alone would not be financially self-sufficient, and the interest for its construction and maintenance costs would cause the total cost to increase over time. The complete line from Lido to Marco Polo Airport would generate enough revenue to recover all construction costs, prior operating costs, and interest by Figure 40. Graph of Cumulative Costs vs. Revenue for the full line from Lido to Marco Polo Airport As shown in Table 10, the 2005 proposed subway line from the Airport to Arsenale is expected to have a capital (construction) cost of billion. The 8,166 km route would take nine years to construct; in comparison, when then-mayor Paolo Costa proposed the system in 2005, it was expected to open in It would begin to operate in 2026 and generate 17.7 million dollars in revenue that year, an amount that is predicted to increase over time as more people travel to Marco Polo Airport. However, the revenue generated by the subway system would not be sufficient to pay back any of the interest accrued on its construction costs, regardless of the amount of cargo that it shipped. Figure 42 shows the cumulative cost and revenue of the subway system over time if 50% of cargo arriving at Marco Polo Airport were shipped along the subway system at a cost of 100/ton. 73 Sylvers,
75 Figure 41. Cumulative cost and revenue for the 2005 proposal, assuming none of the incoming cargo is shipped along the system Figure 42. Cumulative cost and revenue for the 2005 proposal, assuming 50% of incoming cargo is shipped along the system at a price of 100/ton Table 10 contains a summary of the construction costs of the remaining subway lines that we evaluated, shown in Figure 37. Calculations for the cost of construction for each subway line can be found in Appendix C. 54
76 Table 10: List of Construction Costs for Each Potential Subway Line Route Length of Track (km) Number of Stations Estimated Cost Using Comparison Method Estimated Cost Using Unit Cost Method Airport - Arsenale (2005 Proposal) ,645,000, ,326,000, Murano Piazzale Roma ,000, ,000, Airport - Lido ,428,000, ,538,000, Airport - F.te Nove - Piazzale Roma ,922,000, ,405,000, Proposed Subway System Benefits The 2005 proposed subway line from Marco Polo Airport to Arsenale Nord was expected to take 14 minutes to complete the km journey. During this time, it would make seven stops, including the two terminals. 74 Assuming that it spends 16.6 seconds at each train station, the average stopping time observed at a sampling of New York City subway stations 75, and spends the first tenth of its journey between stations accelerating at a constant rate, the proposed subway system would accelerate at m/s 2. Based on this acceleration, projected travel times for the Lido - Piazzale Roma route are shown below. Travel times for the other routes can be found in Appendix D. In Table 11, the travel times between subway stations are displayed for the Lido to Piazzale Roma route, including the possible extensions from Piazzale Roma to Mestre and Marco Polo Airport respectively. This table includes both the time that it takes to access the platform from the point of entry, and the travel times between each station. These components of the travel times can be found in Appendix D. In Table 12 which displays travel times with the current transportation system, the first value in each cell refers to the difference between 12:00pm and the earliest arrival time for someone departing at 12:00pm; the value in parentheses is the difference between the earliest arrival time and the corresponding departure time, which in some cases was later than 12:00pm. Since they would share the same track along the southern edge of the historic city, the Lido-Piazzale Roma line would take 11.8 minutes to reach the Ferrovia and the Piazzale Roma from Lido, and 8.8 minutes to reach those locations from the Piazza San Marco. In comparison, it currently takes 42 minutes to travel from Lido to Piazzale Roma 76 and 23 minutes to travel 74 Bottazzo, Teruashvili and Chan, Google Maps,
77 from the Piazza San Marco to Piazzale Roma 77, not including the time spent waiting for transportation to arrive. The amount of time that the extensions to Mestre and the Airport would save compared to the current systems is also substantial with approximately 75% travel time savings for each. It currently takes 74 minutes to travel from the Airport to Lido, but would take 15.8 minutes using the subway system Table 11: Travel Times in Minutes for Lido-Piazzale Roma Route With Extensions to Mestre and the Airport To (below) / From (right) Lido S.M.E. San Marco / San Zaccaria Zattere Giudecca Palanca Piazzale Roma Mestre Airport Lido S.M.E San Marco / San Zaccaria Zattere Giudecca Palanca Piazzale Roma Mestre Airport Table 12: Current Travel Times 78 in Minutes for Lido-Piazzale Roma Route With Extensions to Mestre and the Airport To (below) / From (right) Lido S.M.E. San Marco - San Zaccaria Giudecca Palanca Zattere Piazzale Roma Central Mestre Airport Lido S.M.E. 23 (21) 33 (32) 23 (22) 43 (41) 62 (58) 82 (74) San Marco - San Zaccaria 26 (20) 18 (17) 12 (10) 36 (31) 48 (44) 68 (60) Giudecca Palanca 32 (32) 22 (16) 8 (4) 31 (19) 52 (38) 69 (61) Zattere 20 (20) 15 (8) 5 (4) 22 (20) 42 (38) 52 (44) Piazzale Roma 42 (42) 37 (23) 21 (19) 22 (22) 26 (22) 39 (31) Central Mestre 61 (59) 51 (47) 41 (39) 41 (41) 29 (27) 36 (23) Airport 65 (63) 65 (62) 50 (50) 50 (50) 35 (31) 45 (24) 77 Google Maps, Google Maps,

78 In order to determine if these subway routes were the most ideal in regards to travel time, we examined isochrones that showed the current areas that can be reached with the current transportation systems and walking against areas that could potentially be reached with the addition of a subway system. You can see in Figure 43 the difference between the 15 minute isochrone from the Lido (left) with the addition of the subway system extending from Piazzale Roma to Lido (right). With the implementation of this system you could reach farther than Piazzale Roma from Lido in 15 minutes. Additional isochrones showing limits of mobility with this potential subway system are found in Appendix B. Figure minute isochrone from Lido S.M.E. with the current transportation system (above left) and with a subway system (above right) 6.6 Analysis Of the various portions of the subway line we evaluated, which would run from Lido to Piazzale Roma, with possible extensions to Mestre and Marco Polo Airport, the portion of the route from Lido to Piazzale Roma is not only the most profitable, but the only portion of the route that can pay back its own construction costs, with interest, at any point in time. While the extension from Piazzale Roma to Mestre would not be financially selfsufficient on its own, the entire route from Lido to Mestre would be able to recover all costs by It would also provide other, less tangible benefits. The extension would provide access to the mainland portions of Venice, where 70% of the city s population lives. It would also serve as an alternative to the Ponte della Libertá, which is occasionally closed multiple times a year, and reduce congestion on the bridge when it is not closed by providing alternative transportation option. In addition to being somewhat more financially beneficial than the extension to Mestre, the extension to Marco Polo Airport also offers a wide range of non-monetary benefits. The connection that it would provide between Marco Polo Airport and Piazzale Roma would make Marco Polo Airport more accessible to those living in nearby cities, such as Padua, Vicenza, and 57
79 Verona by providing a connection between the airport and the railway system. A subway route to the airport would make the journey to and from the airport quicker and therefore less stressful, especially for people carrying luggage. Most likely, the subway could run more frequently than the current transportation service to and from the airport, which would result in even greater time savings for those using it. We determined that Paolo Costa s 2005 proposal for a subway system would not be advisable to implement. Firstly, it would not be financially feasible on its own: while it would be possible to recover a large portion of the cost of construction in the first thirty years of service, it would not be able to recover any of the interest accrued at a 2.06% interest rate, regardless of the amount of cargo that it carried and the rate charged for that cago. The other shortcoming of the original proposal is that it would not serve any of the major transportation hubs in the historic city besides Fondamente Nove. Since the line would reach neither Ferrovia nor Piazzale Roma, it would not be useful for travelers continuing their journeys to locations outside of the historic city, and would only serve people accessing the north end of the historic city from the Airport. In comparison, the extension of our proposed subway line to the airport would give riders direct access to Ferrovia and Piazzale Roma, as well as to Giudecca, Piazza San Marco, and Lido. The one benefit of the original proposal compared to our proposal is that it includes service to Murano; however, the advantages associated with this are mitigated by the fact that Murano s population of 4, is smaller than the populations of both Giudecca and Lido, both of which are directly served by our proposed system, and that the island is already served by multiple water bus lines. 6.7 Conclusions While we analyzed the construction costs and travel times of a number of possible subway systems, we focused primarily on two possible routes. One route was proposed by thenmayor Paolo Costa in This route would have connected Marco Polo Airport to Murano and the northeast end of the historic city, taking approximately fourteen minutes to travel between its two terminals. We determined that this subway system would cost billion to construct, based on a unit cost of 201 million per two-track kilometer. We also determined that, even if the line transported cargo from the airport into the city, it would not generate enough revenue to recover the costs of construction and the interest accrued on those costs until after 2080, and would never recover these costs unless it shipped a large percentage of the cargo arriving at the Airport. Furthermore, the subway line proposed by Costa does not include service to existing transportation hubs such as Piazzale Roma and San Zaccaria, and as a result would only be used by individuals traveling between the Airport and the historic city. Therefore, we do not recommend the implementation of this subway system. 79 Venice Project Center, n.d. 58
80 The other system that we analyzed would start at Piazzale Rome, make stops in Zattere and Giudecca, which would be connected by a pedestrian tunnel, San Zaccaria, and finally the Lido. We were able to assess the cost of this system and determined that it would cost approximately 201 million/km, or billion for the entire route from Lido to Piazzale Roma. We determined that this subway system would allow people to travel from Lido to the Piazzale Roma in ten and a half minutes, whereas it currently takes over 40 minutes to make this trip. We also determined that the revenue generated by ridership would be more than enough to pay for the subway system s operating costs, and could pay for all construction costs, interest, and prior operating costs by With all costs and benefits considered, we recommend that such a system be investigated further and eventually implemented. We also examined the possibilities of extending the subway line to Mestre and Marco Polo Airport. Extending the subway line to the center of Mestre would provide another link between the historic city and the mainland, where 70% of Venice s residents live. 80 With the extension to Mestre, the subway system would recover all prior costs and interest by 2043 and would allow people to travel from Lido to the center of Mestre in 16 and a half minutes, a journey that currently takes roughly an hour. 81 Alternatively, the subway line could be extended from Piazzale Roma to Marco Polo Airport, Italy s fourth-busiest airport and the busiest one without an existing rail connection. 82 With this extension, the entire line would recover all construction and operating costs by 2043 and allow people to travel from Lido to Marco Polo Airport in 16 minutes, whereas it currently takes over an hour to complete this journey. 83 With all costs and benefits considered, we recommend the implementation of such a system. 80 Venipedia, n.d. 81 Google Maps, Fabio Carrera (Personal Communication) 83 Google Maps,
81 7. Conclusions & Recommendations Efficient parking and transportation systems in the historic city of Venice are essential for Venetians and tourists to reach and to move within the city. We have examined alterations and additions to these systems. For each category, we examined what currently exists and what could possibly change in order to result in a more efficient and useful system. We specifically examined car parking, boat parking, the water bus system, and a potential subway system. Within each examined topic, we formulated and analyzed results in order to propose recommendations. Car parking is available in Mestre near the Ponte della Libertá and in the historic city. We were able to quantify the exact amount of car parking currently available. Taking into account parking lots before and after the Ponte della Libertá, there are currently 7,423 parking spaces useful for people traveling to the historic city. Understanding spatial constraints, we determined that expanding upward was a possibility. We assessed the cost of changing a current parking lot in Tronchetto into a five-tier parking garage. We determined that such an expansion could drastically increase the accessibility of Venice by car by increasing the car capacity of the historic city by 15.6%. However, we also determined that it would not be advisable to implement, as it would cost nearly 22 million and increase congestion on the Ponte della Libertá by increasing incentive to drive into the historic city. As a result, we do not recommend the construction of such a garage. We were also able to assess the current temporary boat parking system throughout the historic city. Of about 1,600 rive, only 91 are available for one-hour parking. We concluded that the current system could be more efficient with modification. From field work, we witnessed faults in the current one-hour parking system. We also determined that the current one-hour spots are not in optimal locations. Using store data, canal width, and new dock proposal data, we were able to suggest new spots that could be used. We recommend that the city convert these spots to temporary parking spots. We also witnessed the current system being exploited, with boat owners often exceeding the maximum time limit and not displaying required information, and found it appropriate to suggest a new system for regulation. We believe that it is time for the boat parking in Venice to align with the current available technology. We designed the layout of a smartphone application that could be used to book (on the user side) and to regulate (on the authority side) our suggested parking spots. However, we do not believe that this system could be used alongside the current system for boat parking regulation. As a result, we recommend phasing the current system out and replacing it with the smartphone application that we designed. The current water bus routes were examined with the purpose of finding possible smallscale improvements. Express lines currently exist within the water bus system, but we proposed an alteration. Currently there is no express line connecting Lido and the train station. Replacing the southern portion of line 5.2, which connects Lido and the train station but is not express, with an express service making the stops that line 6 does during the summer could result in a time 60
82 savings of 9 minutes from Lido to the train station. Line 6 would run the route of the current line 5.2, so service to those stops would not be lost. Because reconfiguring lines 5.1, 5.2, and 6 would decrease the travel times to the train station and the northwest end of the historic city at little to no additional cost, we recommend that this possibility be implemented. We then examined reopening the Rio de l Arsenal, which was closed in 1999 to water bus service and determined it would reduce travel times from Arsenale to Celestia by fourteen minutes for those taking the water bus between these points. Based on our analysis of the costs and benefits of reopening this canal, we recommend reopening the Rio de l Arsenal to water bus service only if service through it does not affect existing ACTV service. Finally, we assessed the implementation of a subway system. The system we analyzed would make stops in Zattere and Giudecca, which would be connected by a pedestrian tunnel, San Zaccaria, and finally the Lido. We were able to assess the cost of this system and determined that it would cost approximately 201 million/km, or billion for the entire route from Lido to Piazzale Roma. We were also able to visualize the increase in the amount of locations you can reach due to the implementation of this system through our isochrone generator. We were also able to visualize how certain routes can be improved if a subway system was implemented using our subway route simulator. We determined that the revenue generated by ridership would be more than enough to pay for the subway system s operating costs, and could pay for all construction costs, interest, and prior operating costs by Extending the subway line to the center of Mestre would provide another link between the historic city and the mainland, where 70% of Venice s residents live. 84 With the extension to Mestre, the subway system would recover all prior costs and interest by 2043 and would allow people to travel from Lido to the center of Mestre in 16 and a half minutes, a journey that currently takes roughly an hour. Alternatively, the subway line could be extended from Piazzale Roma to Marco Polo Airport, Italy s fourth-busiest airport and the busiest one without an existing rail connection. 85 With this extension, the entire line would recover all construction and operating costs by 2043 and allow people to travel from Lido to Marco Polo Airport in 16 minutes, whereas it currently takes over an hour to complete this journey. With all costs and benefits considered, we recommend the implementation of such a system. We do not recommend the implementation of the subway line proposed in 2005, from Marco Polo Airport to the northeast end of Venice. This line would cost billion to construct, would not generate enough revenue to recover the costs of construction and the interest accrued on those costs until after 2080, regardless of how much cargo it transported, and would not include service to points of interest such as the Piazzale Roma and St. Mark s Square. The parking and transportation systems within Venice are complex and have many factors influencing them. After assessing these, we explored improvements and additions to the systems, and were able to find results and analyze these findings. By analyzing these, we were 84 Venipedia, n.d. 85 Fabio Carrera (Personal Communication) 61
83 able to make educated recommendations that could be considered when making changes to the current systems. 62
84 8. Works Cited 14 Years for Three Stops: Chancellor's Subway Line Opens in Berlin. (2009, Aug. 7). Retrieved 30 Oct., 2017, from ACTV. (2001). Analisi Strategica E Sviluppo Linee Guida Per La Pianificazione Strategica. Venezia, IT; Del Fabbro & Associati. ACTV. (2017, Nov. 6). Navigation Service Times. Retrieved from ACTV. (n.d.). Orario linea 4.1 dal 6 nov 2017_0.pdf. Retrieved from _0.pdf. ACTV. (n.d.). Orario linea 4.2 dal 6 nov 2017_0.pdf. Retrieved from _0.pdf. ACTV. (n.d.). Orario linea 5.1 dal 6 nov 2017_4.pdf. Retrieved from _4.pdf. ACTV. (n.d.). Orario linea 5.1 dal 27 maggio 2017_0.pdf. Retrieved from o%20linea%205.1%20%20dal%2027%20maggio%202017_0.pdf. ACTV. (n.d.). Orario linea 6 dal 6 nov 2017_0.pdf. Retrieved from 17_0.pdf. ACTV. (n.d.). Orario linea 6 dal 27 maggio 2017_0.pdf. Retrieved from o%20linea%20%206%20dal%2027%20maggio%202017_0.pdf. ACTV Home Page. (n.d.). Retrieved 1 Oct., 2017, from [ACTV Route 5.1 Map]. (n.d.). Retrieved 5 Dec., 2017, from AER TRE S.p.A. (2014). Treviso Airport - International Airport Treviso A. Canova (TSF). Retrieved 11 Oct., 2017, from Airport-Venice.com. (2017). Venice Marco Polo International Airport. Retrieved 11 Oct., 2017, from Amilcar, M., Bourgeois, A., Setalsingh, S., Tassinari, M. Mobility in the Floating City: A Study of Pedestrian Transportation (Undergraduate Interactive Qualifying Project No. E- project ). Retrieved from Worcester Polytechnic Institute Electronic 63
85 Projects Collection: Assaeroporti. (2017). Statistiche. Retrieved from AVM Holding. (n.d.). Parcheggi. Retrieved 26 Oct., 2017, from AVM Holding. (n.d.). Parcheggio S. Andrea. Retrieved 26 Oct., 2017, from AVM Holding. (n.d.). Parcheggio San Giuliano. Retrieved 26 Oct., 2017, from Bellingham, S., Davis, C., O Brien, C., Saari, E. Cruise control -- to further the understanding of the comprehensive impacts of cruise ships on the city of Venice (Undergraduate Interactive Qualifying Project No. E-project ). Retrieved from Worcester Polytechnic Institute Electronic Projects Collection: Black, K.M., Migdal, S.A., Morin, M.T., Rene, D.Q., Vitello, N.D. (2008). Urban Maintenance & Venetian Accessibility (Undergraduate Interactive Qualifying Project No. E-project ). Retrieved from Worcester Polytechnic Institute Electronic Projects Collection: Blanco, A., D Ambrosio, V., La Manna, A., Martin, K. (2014). Impacts of Tourism: Analyzing the Impacts of Tourism on the City of Venice (Undergraduate Interactive Qualifying Project No. E-project ). Retrieved from Worcester Polytechnic Institute Electronic Projects Collection: /unrestricted/VE14-TOUR_FinalReport.pdf. Boston Discovery Guide. Boston s Subway - The T. Retrieved 19 Sept from Bottazzo, F. (2006, Jan. 27). Sublagunare, la commissione <<frena>> il tunnel. Corriere del Veneto, pp. 7. Bramblett, R. (2015, May). Arriving in Venice by car. Retrieved 19 Sept. 2017, from Brofford, K., Larkins, R., Pernia-Rovayo, L., & Shea, A. (2013). Boats and Bottlenecks: Improving Mobility in Venice (Undergraduate Interactive Qualifying Project No. E- project ). Retrieved from Worcester Polytechnic Institute Electronic Projects Collection: Browning, R.C., Baker, E.A., Herron, J.A., & Kramer, R. (2006). Effects of obesity and sex on the energetic cost and preferred speed of walking. Journal of Applied Physiology, 100(2), doi: /japplphysiol
86 Bukowski, G., Dougherty, B.E., Morin, R.W., Renaud, P. (2006). CanalSpace -- managing the use of Venetian canals (Undergraduate Interactive Qualifying Project No. E-project ). Retrieved from Worcester Polytechnic Institute Electronic Projects Collection: Canestrelli, E., & Costa, P. (May 7, 1990). Tourist carrying capacity: A fuzzy approach. Annals of Tourism Research, 18(2), Retrieved from City of Venice. (2015). Yearbook of Tourism Data Retrieved 11 Oct., 2017, from 0Tourism.pdf. Comune di Venezia, Portale dei servizi. (2017). Mappa della Popolazione residente al giorno precedente [Data file]. Retrieved from Consorzio Motoscafi Venezia. (n.d.). Consorzio Motoscafi Venezia. Retrieved 20 Sept., 2017, from Cruise ship docking procedures. (n.d.). Retrieved 10 Oct., 2017, from Cudney, G. (2015). Parking Structure Cost Outlook for Retrieved 5 Dec., 2017, from Article.pdf. Daily Mail. (n.d.). Average wait time at leading tourist attractions in Europe in 2015 (in minutes). In Statista - The Statistics Portal. Retrieved 20 Sept., 2017, from Da Mosto, J., Morel T., Gibin, R., Tonin, S., Fracchia, F., et al. (2009). The Venice Report Retrieved 11 Oct., 2017, from Euro Inflation Calculator. (n.d.) euros in Retrieved 2 Nov., 2017, from Euro Inflation Calculator. (n.d.) euros in Retrieved 2 Nov., 2017, from Euro Inflation Calculator. (n.d.) euros in Retrieved 30 Oct., 2017, from Euro Inflation Calculator. (n.d.) euros in Retrieved 2 Nov., 2017, from Euro Inflation Calculator. (n.d.) euros in Retrieved 5 Dec., 2017, from Fast-forwarding to a future of on-demand urban air transportation. Uber Elevate
87 Garage San Marco Srl. (n.d.). Garage San Marco. Retrieved 27 Oct., 2017, from Fixr. (n.d.). Build a Parking Garage Cost. Retrieved 7 Dec., 2017, from Gonclaves, A.P., Jasinski, N.D., Pauwels, A.J., Tedesco, J.A. (2016). Increasing the Efficiency of Venetian Transport Systems for the Reduction of Moto Ondoso. (Undergraduate Interactive Qualifying Project No. E-project ). Retrieved from Worcester Polytechnic Institute Electronic Projects Collection: Google Maps. (2017). Map of Venice. Retrieved from Grandi Stazioni. (n.d.). Gruppo Ferrovie dello Stato. Retrieved 20 Sept., 2017, from f16f90aRCRD. Imboden, D. (n.d.,a). Venice Airport Buses ( ). Retrieved 20 Sept., 2017, from Imboden, D. (n.d.,b). Venice Water Taxis ( ). Retrieved 20 Sept., 2017, from Interparking Venezia. (n.d.). Interparking. Retrieved 26 Oct., 2017, from JCDeaux. (n.d.). The Mall Phenomenon. Retrieved 5 Dec., 2017, from enon.pdf. Kimes, S. E., Wirtz, J., & Noone, B. M. (2002). How long should dinner take? Measuring expected meal duration for restaurant revenue management [Electronic version]. Retrieved 5 Dec., 2017, from Cornell University, SHA School site: Levy, A. (2011, May 16). US Rail Construction Costs. Retrieved 2 Nov., 2017, from Levy, A. (2017, Oct. 13). Why are the NYC subway's operating costs so high? Retrieved 5 Dec., 2017, from Libardo, A., Nocera, S., Trabucco, D. A New Approach for the Freight Transportation System in Venice. Retrieved 15 Sept from Line 6 Water Bus Vaporetto in Venice [Digital image]. (n.d.). Retrieved 5 Dec., 2017, from 66
88 Mack, B. (2012, September 11). Tourism overwhelms vanishing Venice. Retrieved 10 Oct., 2017, from MacKechnie, C. (2017, July 10). What Is the Passenger Capacity of Different Modes of Transit? Retrieved from Map of Venice City Park and Green Park in Mestre. (n.d.). Retrieved 27 Oct., 2017, from F4Dy6qY7zNWz2rv0U&ll= %2C &z=18. Nessen, S. (2017, January 02). New York's Long-Awaited Second Avenue Subway Finally Leaves The Station. Retrieved 10 Sept., 2017, from Newzoo. (2017, April). Global Mobile Market Report. Retrieved 8 Dec., 2017, from Nodine, E.E., Jagannath, A.D., Chiu, D. (2002). Moto ondoso index -- assessing the effects of boat traffic in the canals of venice. Retrieved from Worcester Polytechnic Institute Electronic Projects Collection: Parking Options in Venice [Digital image]. (n.d.). Retrieved 12 Oct., 2017, from e31qlfjtee0&ll= %2c &z=15. Parking space map [Digital image]. (n.d.). Retrieved 12 Oct., 2017, from Pedrocco, P. (2000). Un Sistema Di Trasporti Metropolitani Per Venezia: Verso quale futuro? Venezia, IT: Ateneo Veneto. Pickrell, D.H. (1985). Estimates of Rail Transit Construction Costs. Transportation Research Record, Retrieved from [Potential Hyperloop Route from Rome to Mestre]. (2017, October 6). Retrieved 6 Oct., 2017, from EngibEc&ll= %2C &z=6. [Protestors in the Giudecca Canal]. (n.d.). Retrieved 10 Oct., 2017, from Venice-canal-to-block-cruise-ships.html. Railway Gazette. (2007, Oct. 4). Napoli awards 426m metro Line 6 contract. (n.d.). Retrieved 2 Nov., 2017, from Railway Gazette. (2010, Nov. 25). København Cityringen contractors selected. Retrieved 2 Nov., 2017, from 67
89 Rapaglia, J., Zaggia, L., Parnell, K., Lorenzetti, G., & Vafeidis, A. T. (2015). Ship-wake induced sediment remobilization: Effects and proposed management strategies for the Venice Lagoon. Ocean & Coastal Management, 110, Renzulli, M. (2017, June 12). What to See and Do When You Visit Venice. Retrieved September 20, 2017, from Scaramuzzi, I., Di Monte, G., Pedenzini, C., Santoro, G. (2009). Turismo Sostenibile A Venezia. Retrieved 11 Oct., 2017, from Spiegel J. Bus travel in italy: What you need to know. Italy Explained Web site. Retrieved Sept from Statista. (2017). Big Mac index - global prices for a Big Mac in January 2017, by country (in U.S. dollars). Retrieved 7 Nov., 2017, from Statista. (n.d.). Number of smartphone users worldwide Retrieved 5 Dec., 2017, from Sylvers, E. (2005, Feb. 23). Venice Underground. Retrieved 17 Sept., 2017, from Teruashvili, S., Chan, A. (2005). How Long Do The Subway Doors Stay Open? Retrieved 16 Nov., 2017, from Trading Economics. (n.d.). Italy Interest Rate. Retrieved 11 Dec., 2017, from Touropia. (2017, August 14). 10 Top Tourist Attractions in Venice. Retrieved 20 Sept., 2017, from Venezia Tourism.com. (n.d.). Venice Airports. Retrieved 22 Sept from Venice Airport.it (n.d.). Treviso Airport. Retrieved 18 Sept from Venice City Park. (n.d.). Venice City Park. Retrieved 27 Oct., 2017, from Venice Project Center. (n.d.). Isolario Interattivo [Data file]. Available from Venice Santa Lucia Train Station. (n.d.). Retrieved 20 Sept., 2017, from [Venice Water Taxi]. (n.d.). Retrieved 11 Oct., 2017, from Venipedia. (2015, January 26). Demographics. Retrieved 10 Oct., 2017, from 68
90 Vento di Venezia. (2012). Piano Della Fruzione Della Laguna per una Diportiistica Minore Sosenibile. Venice, IT: Sonino, A. XE. (n.d.). XE Currency Converter: ITL to EUR. Retrieved from XE. (n.d.). XE Currency Converter: USD to EUR. Retrieved 16 Nov., 2017, from YCharts. (n.d.). Europe Labor Cost Index Report. Retrieved from 69
91 Appendix A: Availability of Car Parking in the Historic City and Mestre Table 13: List of Parking Lots by Location, Ownership, and Capacity Name Location Ownership Car Capacity Park Costa Mestre Public 302 Piazzale Candiani Mestre Public 105 Da Verrazzano Mestre Public 102 SM of the Battui Mestre Public 105 Einaudi Mestre Public 126 Ex Umberto I Mestre Public 320 Forte Marghera Mestre Public 89 Piazzale L. DaVinci Mestre Public 93 S. Andrea car park Historic City Public 100 San Giuliano Historic City Public 633 Garage San Marco Venice Historic City Private 900 Venezia Tronchetto Parking Historic City Private 4000 Venice City Park Mestre Private 326 Green Park Mestre Private 222 Total
92 Table 14: Parking Area Sizes, Car Area Sizes, and Estimated Capacity of Venice City Park Shape on Map Area Shape on Map Area Parking Area ha 5 cars (spacing 1) ha Parking Area ha 5 cars (spacing 2) ha Parking Area ha 5 cars (spacing 3) ha Parking Area ha Total Area ha Parking Area ha # of Cars in Area 15 Parking Area ha Parking Area ha Total Parking Area ha # of Parking Spots

93 Figure 44. Screenshot of the Google My Maps file used to estimate the car capacity of Venice City Park in Mestre. In this image, the areas used to estimate the total parking area are shown in green and labeled with red numbers, and the areas used to estimate the area of an individual car are shown in black and labeled with white numbers. 72

94 Figure 45. Screenshot of the AutoCAD file used to estimate the number of parking spaces in Green Park In Figure 45, the red quadrilaterals, each of which represents a parking space, were drawn so that they were approximately the size of one car each. 73


95 Appendix B: Isochrone Generator and Subway Route Simulator Outputs, Including Hand-Drawn Isochrones Figure minute walking isochrone for the Rialto Bridge Figure minute walking isochrone for the Piazza San Marco at 12:00am 74


96 Figure Minute Isochrone from Piazza San Marco Figure minute isochrone from Piazzale Roma 75

97 Figure Minute Isochrone from Giuseppe Garibaldi Monument Figure Minute Isochrone from Venice Project Center 76


98 Figure Minute Isochrone from Marco Polo Airport with Subway from Airport to Lido Figure Minute Isochrone from Mestre with Subway from Mestre to Lido The following outputs were produced with the input at the top of each figure: 77


99 Figure 54 Figure 55 78


100 Figure 56 Figure 57 79

101 Figure 58 80
102 Appendix C: Cost Calculations for Potential Subway Routes Table 15: Unit Cost Estimate for a Subway System in Venice Using an Extension to Berlin s Subway System C j Berlin Subway System Extension 320,000, euro 1+f p-j L p L j S p S j Cp 8 years 1 km 1.8 km 184,180, euro Table 16: Unit Cost Estimate for a Subway System in Venice Using an Extension to Naples s Subway System C j Naples Line 6 Extension 107,000, euro 1+f p-j L p L j S p S j Cp 10 years 1 km 1.9 km 64,898, euro Table 17: Unit Cost Estimate for a Subway System in Venice Using Amsterdam s North- South Line C j Amsterdam North-South Line 3,100,000, euro 1+f p-j L p L j S p S j Cp 8 years 1 km 9.5 km 356,490, euro 81
103 Table 18: Unit Cost Estimate for a Subway System in Venice Using Copenhagen s Circle Line C j Copenhagen Circle Line 3,100,000, euro 1+f p-j L p L j S p S j Cp 7 years 1 km 15.5 km 207,669, euro Table 19: Unit Cost Estimate for a Subway System in Venice Using Paris s Metro Line 14 C j Paris Metro Line 14 1,130,000, euro 1+f p-j 24 years L p L j S p S j Cp 1 km 9 km 170,942, euro Table 20: Determination of the Unit Cost for the Comparison Method (see Table 15-Table 19) Average Cost Minimum Cost Maximum Cost Unit Cost to Use 196,836, /km 64,898, /km 356,490, /km 201,000, /km 82
104 Table 21: Rapid Transit Systems Analyzed by Pickrell (1985) City Project Two-Track Miles/Number of Stations Tunnel Surface Elevated Cleveland Initial Line Airport Extension - 0.3/0 14.9/15 3.8/3 - - Philadelphia Lindenwold Line Snyder-Pattison Extension - 1.2/1 14.5/ San Francisco BART System 20.0/ /7 24.0/13 Washington, D.C. Metrorail: Phases 1-IVA Phases V-VI 22.4/ /9 13.3/ /8 1.5/2 1.0/2 Atlanta Rail Phase A 5.5/8 5.8/7 2.4/2 Baltimore Metro Phase 1 4.5/6-3.2/3 Boston Red Line South Red Line Northwest Orange Line North - 3.2/4 1.0/2 9.5/5-4.4/ Miami Metrorail N-S Line - 1.7/0 19.3/20 New York 63 rd Street Tunnel 2 nd Avenue Tunnel 12.0/0 7.2/ Chicago Dan Ryan Line Milwaukee Extension O Hare Airport Extension - 1.2/2 0.6/1 9.4/9 3.9/4 6.6/3 Source: Pickrell, D.H. (1985). Estimates of Rail Transit Construction Costs. Transportation Research Record, Retrieved from 1.1/
105 Table 22: Determination of Railway and Station Unit Costs for the Unit Cost Method One mile of two-track rail One subway station Unit Costs (1983 USD) $103,000, $40,000, Inflation % % Unit Costs (2017 USD) $221,213, $85,908, Conversion Rate (euros/dollar) Unit Costs (2017 euros) 187,878, ,962, Italy Big Mac Index USA Big Mac Index Preliminary Total 170,154, ,079, Convert from two-track to one-track 1 N/A Convert miles to kilometers N/A Final Unit Cost 105,728, ,079, Table 23: Cost Calculations for Airport-Arsenale Route (Original Proposal) Using the Unit Cost Method Units Unit Cost Subtotal Two-track km ,728, ,383, Stations 7 66,079, ,555, Total 1,326,000,000.0 Table 24: Cost Calculations for a One-Track Version of the Airport-Arsenale Route (Original Proposal) Units Unit Cost Subtotal One-track km ,864, ,691, Stations 7 66,079, ,555, Total 894,000,000.0 Table 25: Cost Calculations for Murano - Ferrovia Route Using the Unit Cost Method Units Unit Cost Subtotal Two-track km ,728, ,624, Stations 2 66,079, ,159, Total 513,000,
106 Table 26: Cost Calculations for Airport - Lido Route (Addendum to original proposal) Using the Unit Cost Method Units Unit Cost Subtotal Two-track km ,728, ,274,034, Stations 4 66,079, ,317, Total 1,538,000,000.0 Table 27: Cost Calculations for Airport - F.te Nove - Ferrovia Route Using the Unit Cost Method Units Unit Cost Subtotal Two-track km ,728, ,008,655, Stations 6 66,079, ,476, Total 1,405,000,000.0 Table 28: Estimate of Maintenance Cost per Car-Mile Based on the PATH Transportation System Subway network PATH Cost per car-mile $ inflation 1 Time since data gathered 0 Italy Big Mac Index 4.8 Big Mac Index of original country 5.3 Unit length of new system 1 Unit length of original system 1 Cost of Venice subway/car-mile $
107 Table 29: Estimate of Maintenance Cost per Car-Mile Based on the Los Angeles Metro Rail Subway network Los Angeles Metro Rail Cost per car-mile $ inflation 1 Time since data gathered 0 Italy Big Mac Index 4.8 Big Mac Index of original country 5.3 Unit length of new system 1 Unit length of original system 1 Cost of Venice subway/car-mile $17.21 Table 30: Estimate of Maintenance Cost per Car-Mile Based on the Boston T Subway network Boston T Cost per car-mile $ inflation 1 Time since data gathered 0 Italy Big Mac Index 4.8 Big Mac Index of original country 5.3 Unit length of new system 1 Unit length of original system 1 Cost of Venice subway/car-mile $
108 Table 31: Estimate of Maintenance Cost per Car-Mile Based on the New York City Subway Subway network New York City Subway Cost per car-mile $ inflation 1 Time since data gathered 0 Italy Big Mac Index 4.8 Big Mac Index of original country 5.3 Unit length of new system 1 Unit length of original system 1 Cost of Venice subway/car-mile $13.68 Table 32: Estimate of Maintenance Cost per Car-Mile Based on the Miami Metrorail Subway network Miami Metrorail Cost per car-mile $ inflation 1 Time since data gathered 0 Italy Big Mac Index 4.8 Big Mac Index of original country 5.3 Unit length of new system 1 Unit length of original system 1 Cost of Venice subway/car-mile $
109 Table 33: Estimate of Maintenance Cost per Car-Mile Based on the Washington Metro Subway network Washington Metro Cost per car-mile $ inflation 1 Time since data gathered 0 Italy Big Mac Index 4.8 Big Mac Index of original country 5.3 Unit length of new system 1 Unit length of original system 1 Cost of Venice subway/car-mile $10.42 Table 34: Estimate of Maintenance Cost per Car-Mile Based on the Madrid Metro Subway network Madrid Metro Cost per car-mile $ inflation 1 Time since data gathered 0 Italy Big Mac Index 4.8 Big Mac Index of original country 4.34 Unit length of new system 1 Unit length of original system 1 Cost of Venice subway/car-mile $
110 Table 35: Estimate of Maintenance Cost per Car-Mile Based on Philadelphia s SEPTA Subway Subway network Philadelphia SEPTA subway Cost per car-mile $ inflation 1 Time since data gathered 0 Italy Big Mac Index 4.8 Big Mac Index of original country 5.3 Unit length of new system 1 Unit length of original system 1 Cost of Venice subway/car-mile $9.96 Table 36: Estimate of Maintenance Cost per Car-Mile Based on the Atlanta MARTA System Subway network Atlanta MARTA Cost per car-mile $ inflation 1 Time since data gathered 0 Italy Big Mac Index 4.8 Big Mac Index of original country 5.3 Unit length of new system 1 Unit length of original system 1 Cost of Venice subway/car-mile $
111 Table 37: Estimate of Maintenance Cost per Car-Mile Based on the Berlin U-Bahn Subway network Berlin U-Bahn Cost per car-mile $ inflation 1 Time since data gathered 0 Italy Big Mac Index 4.8 Big Mac Index of original country 4.45 Unit length of new system 1 Unit length of original system 1 Cost of Venice subway/car-mile $10.36 Table 38: Estimate of Maintenance Cost per Car-Mile Based on the Paris Metro Subway network Paris Metro and RER Cost per car-mile $ inflation 1 Time since data gathered 0 Italy Big Mac Index 4.8 Big Mac Index of original country 4.68 Unit length of new system 1 Unit length of original system 1 Cost of Venice subway/car-mile $
112 Table 39: Estimate of Maintenance Cost per Car-Mile Based on the London Underground Subway network London Underground Cost per car-mile $ inflation 1 Time since data gathered 0 Italy Big Mac Index 4.8 Big Mac Index of original country 4.11 Unit length of new system 1 Unit length of original system 1 Cost of Venice subway/car-mile $10.86 Table 40: Estimate of Maintenance Cost per Car-Mile Based on the Bay Area Rapid Transportation system Subway network BART Cost per car-mile $ inflation 1 Time since data gathered 0 Italy Big Mac Index 4.8 Big Mac Index of original country 5.3 Unit length of new system 1 Unit length of original system 1 Cost of Venice subway/car-mile $
113 Table 41: Estimate of Maintenance Cost per Car-Mile Based on the Chicago L Subway network Chicago L Cost per car-mile $ inflation 1 Time since data gathered 0 Italy Big Mac Index 4.8 Big Mac Index of original country 5.3 Unit length of new system 1 Unit length of original system 1 Cost of Venice subway/car-mile $7.25 Table 42: Estimate of Maintenance Cost per Car-Mile Based on Table 28 - Table 41 Average value obtained $12.15 Minimum value obtained $7.25 Maximum value obtained $27.17 Expected cost of Venice subway $13.84 Expected cost (euros)
114 Table 43: Cost and Revenue Calculations for the Airport - Arsenale Route (Original Proposal) Resident Fare 2.00 Tourist Fare 6.00 % of Tourists Using System 50% Locals Using System 15% A B C = A * B D = C * 50% E = A - C F = E * 30% G = 0.52 * (E + F) H = 6*D + 2*F Year # of People Using Airport % Tourists # of Tourist Arrivals # of Tourists Using System # of Local Arrivals # of Locals Using System Operating Cost Total Revenue % ,413,597 12,336, % ,456,004 12,706, % ,498,410 13,076, % ,540,818 13,446, % ,583,225 13,816, % ,625,632 14,186, % ,668,039 14,556, % ,710,446 14,926, % ,752,852 15,296, % ,795,260 15,666, % ,837,667 16,036, % ,880,074 16,406, % ,922,481 16,776, % ,964,887 17,147, % ,007,295 17,517, % ,049,702 17,887, % ,092,109 18,257, % ,134,516 18,627, % ,176,923 18,997, % ,219,330 19,367, % ,261,737 19,737,552 93
115 % ,304,144 20,107, % ,346,551 20,477, % ,388,958 20,847, % ,431,365 21,217, % ,473,772 21,587, % ,516,179 21,957, % ,558,586 22,328, % ,600,993 22,698, % ,643,400 23,068, % ,685,807 23,438, % ,728,214 23,808, % ,770,621 24,178, % ,813,028 24,548, % ,855,435 24,918, % ,897,842 25,288, % ,940,249 25,658, % ,982,656 26,028, % ,025,063 26,398, % ,067,470 26,768, % ,109,877 27,139, % ,152,284 27,509, % ,194,691 27,879, % ,237,099 28,249, % ,279,505 28,619, % ,321,913 28,989, % ,364,319 29,359, % ,406,726 29,729, % ,449,133 30,099, % ,491,540 30,469, % ,533,948 30,839, % ,576,355 31,209, % ,618,761 31,579,926 94
116 % ,661,168 31,950, % ,703,575 32,320, % ,745,983 32,690, % ,788,390 33,060, % ,830,797 33,430, % ,873,203 33,800, % ,915,611 34,170, % ,958,017 34,540, % ,000,425 34,910, % ,042,832 35,280,672 Table 44: Present Value Analysis for the Airport - Arsenale Route (Original Proposal), Excluding Cargo Transportation Year Construction Cost Maintenance Cost Present Value of Costs Ticket Revenue Cargo Revenue PV of revenue ,633,233, ,645,000, ,051,729 3,029, ,208,047 3,162, ,364,366 3,292, ,520,684 3,421, ,677,002 3,547, ,833,321 3,671, ,989,639 3,794, ,145,958 3,914, ,302,276 4,033, ,930,333 2,727,355 18,111,120 4,458,595 21,006, ,999,552 2,771,811 18,538,932 4,614,913 21,395, ,068,771 2,815,492 18,966,748 4,771,231 21,778, ,137,991 2,858,406 19,394,566 4,927,550 22,155, ,207,210 2,900,562 19,822,376 5,083,868 22,524, ,276,429 2,941,968 20,250,192 5,240,187 22,888, ,345,649 2,982,635 20,678,010 5,396,505 23,245, ,414,868 3,022,568 21,105,820 5,552,824 23,596, ,484,088 3,061,778 21,533,638 5,709,142 23,940, ,553,307 3,100,272 21,961,454 5,865,460 24,279, ,622,526 3,138,059 22,389,266 6,021,779 24,611,426 95
117 ,691,746 3,175,147 22,817,082 6,178,097 24,937, ,760,965 3,211,543 23,244,898 6,334,416 25,258, ,830,184 3,247,257 23,672,710 6,490,734 25,572, ,899,403 3,282,295 24,100,526 6,647,053 25,881, ,968,623 3,316,666 24,528,338 6,803,371 26,184, ,037,842 3,350,378 24,956,154 6,959,689 26,481, ,107,062 3,383,438 25,383,972 7,116,008 26,773, ,176,281 3,415,852 25,811,782 7,272,326 27,060, ,245,500 3,447,631 26,239,600 7,428,645 27,340, ,314,720 3,478,780 26,667,416 7,584,963 27,616, ,383,938 3,509,306 27,095,226 7,741,282 27,886, ,453,158 3,539,219 27,523,044 7,897,600 28,151, ,522,377 3,568,523 27,950,854 8,053,918 28,410, ,591,597 3,597,228 28,378,672 8,210,237 28,665, ,660,816 3,625,340 28,806,488 8,366,555 28,914, ,730,035 3,652,865 29,234,300 8,522,874 29,158, ,799,255 3,679,811 29,662,116 8,679,192 29,398, ,868,474 3,706,185 30,089,932 8,835,511 29,632, ,937,693 3,731,993 30,517,744 8,991,829 29,862, ,006,913 3,757,242 30,945,562 9,148,147 30,086, ,076,132 3,781,939 31,373,378 9,304,466 30,306, ,145,351 3,806,091 31,801,188 9,460,784 30,522, ,214,571 3,829,704 32,229,006 9,617,103 30,732, ,283,790 3,852,784 32,656,822 9,773,421 30,938, ,353,010 3,875,338 33,084,634 9,929,740 31,140, ,422,229 3,897,372 33,512,450 10,086,058 31,337, ,491,448 3,918,893 33,940,262 10,242,376 31,530, ,560,667 3,939,906 34,368,078 10,398,695 31,718, ,629,887 3,960,419 34,795,894 10,555,013 31,902, ,699,106 3,980,436 35,223,706 10,711,332 32,082, ,768,325 3,999,965 35,651,522 10,867,650 32,258, ,837,545 4,019,011 36,079,340 11,023,969 32,429, ,906,764 4,037,578 36,507,150 11,180,287 32,596, ,975,984 4,055,676 36,934,968 11,336,605 32,760, ,045,203 4,073,308 37,362,784 11,492,924 32,919, ,114,422 4,090,480 37,790,596 11,649,242 33,074, ,183,642 4,107,198 38,218,412 11,805,561 33,226, ,252,861 4,123,467 38,646,228 11,961,879 33,373, ,322,080 4,139,294 39,074,040 12,118,198 33,517, ,391,299 4,154,683 39,501,856 12,274,516 33,657,382 96
118 ,460,519 4,169,640 39,929,668 12,430,834 33,793, ,529,738 4,184,171 40,357,484 12,587,153 33,926, ,598,958 4,198,281 40,785,302 12,743,471 34,055,201 Total 1,827,427,12 0 1,580,363,36 3 Reven ue / Cost 86.48% Table 45: Cumulative Costs and Revenues for the Airport - Arsenale Route, Excluding Cargo Transportation Year Cumulative costs Cumulative revenue Overdraft Interest ,645,000,000 3,051,729 1,641,948,271 33,824, ,678,824,134 6,259,776 1,672,564,358 34,454, ,713,278,960 9,624,142 1,703,654,819 35,095, ,748,374,249 13,144,826 1,735,229,424 35,745, ,784,119,976 16,821,828 1,767,298,147 36,406, ,820,526,317 20,655,149 1,799,871,168 37,077, ,857,603,663 24,644,788 1,832,958,875 37,758, ,895,362,616 28,790,746 1,866,571,870 38,451, ,933,813,997 33,093,022 1,900,720,975 39,154, ,975,899,182 55,662,737 1,920,236,445 39,556, ,018,455,605 78,816,582 1,939,639,023 39,956, ,061,480, ,554,561 1,958,926,379 40,353, ,104,972, ,876,677 1,978,096,137 40,748, ,148,928, ,782,922 1,997,145,883 41,141, ,193,346, ,273,300 2,016,073,139 41,531, ,238,223, ,347,816 2,034,875,380 41,918, ,283,556, ,006,459 2,053,550,037 42,303, ,329,343, ,249,239 2,072,094,475 42,685, ,375,582, ,076,154 2,090,506,014 43,064, ,422,269, ,487,199 2,108,781,919 43,440, ,469,401, ,482,378 2,126,919,393 43,814, ,516,977, ,061,692 2,144,915,584 44,185, ,564,992, ,225,136 2,162,767,585 44,553, ,613,445, ,972,715 2,180,472,422 44,917, ,662,331, ,304,424 2,198,027,067 45,279, ,711,648, ,220,267 2,215,428,423 45,637, ,761,393, ,720,247 2,232,673,331 45,993, ,811,562, ,804,355 2,249,758,574 46,345,027 97
119 2046 2,862,153, ,472,600 2,266,680,856 46,693, ,913,161, ,724,979 2,283,436,822 47,038, ,964,584, ,561,487 2,300,023,052 47,380, ,016,418, ,982,131 2,316,436,041 47,718, ,068,659, ,986,903 2,332,672,228 48,053, ,121,303, ,575,812 2,348,727,963 48,383, ,174,348, ,748,856 2,364,599,532 48,710, ,227,789, ,506,029 2,380,283,144 49,033, ,281,622, ,847,338 2,395,774,924 49,352, ,335,843, ,772,780 2,411,070,918 49,668, ,390,449, ,282,353 2,426,167,099 49,979, ,445,435,408 1,004,376,063 2,441,059,345 50,285, ,500,797,363 1,045,053,907 2,455,743,456 50,588, ,556,531,029 1,086,315,879 2,470,215,150 50,886, ,612,632,032 1,128,161,988 2,484,470,045 51,180, ,669,095,906 1,170,592,231 2,498,503,675 51,469, ,725,918,091 1,213,606,605 2,512,311,486 51,753, ,783,093,936 1,257,205,113 2,525,888,824 52,033, ,840,618,694 1,301,387,751 2,539,230,943 52,308, ,898,487,519 1,346,154,524 2,552,332,995 52,578, ,956,695,466 1,391,505,431 2,565,190,034 52,842, ,015,237,486 1,437,440,469 2,577,797,017 53,102, ,074,108,430 1,483,959,641 2,590,148,789 53,357, ,133,303,040 1,531,062,950 2,602,240,090 53,606, ,192,815,950 1,578,750,387 2,614,065,563 53,849, ,252,641,684 1,627,021,960 2,625,619,724 54,087, ,312,774,653 1,675,877,668 2,636,896,985 54,320, ,373,209,154 1,725,317,507 2,647,891,647 54,546, ,433,939,363 1,775,341,479 2,658,597,884 54,767, ,494,959,340 1,825,949,587 2,669,009,754 54,981, ,556,263,021 1,877,141,824 2,679,121,197 55,189, ,617,844,217 1,928,918,196 2,688,926,021 55,391, ,679,696,612 1,981,278,699 2,698,417,913 55,587, ,741,813,759 2,034,223,336 2,707,590,423 55,776, ,804,189,080 2,087,752,109 2,716,436,971 55,958,602 98

120 Appendix D: Travel Times for Proposed Subway Lines Figure 59. Derivation for Equation 7. 99
Logistical Information
 Logistical Information In this file you will find logistical information on : 1. How to get to the City Centre: A. from the main airports, Venice Marco Polo Airport and Treviso San Giuseppe Airport B.
Logistical Information
 Logistical Information In this file you will find logistical information on : 1. How to get to the city centre: A. from the main airports, Venice Marco Polo Airport and Treviso Canova Airport B. from the
How to reach the Fourth Nanosafety School
 How to reach the Fourth Nanosafety School Dear Participant, Welcome to the fourth Nanosafety School! Here is some practical information to help make your stay in Venice as pleasant as possible. Arriving
HOW REACH VENICE LIDO PALAZZO
 HOW TO REACH VENICE LIDO PALAZZO DEL CASINO AERIAL VIEW Venice is known as "City of Water" in the sense that its urban fabric is not only crossed by waterways, but it is also completely surrounded by water.
EUCHIS 2009 Venice, Italy, May 23-26, Useful information. Meeting Venue
 EUCHIS 2009 Venice, Italy, May 23-26, 2009 Useful information Meeting Venue EUCHIS 2009 takes place at the San Servolo island in the Venetian lagoon (phone +39 041 2765001, http://www.sanservolo.provincia.venezia.it).
ALL ABOARD LABOR S LONG TERM PASSENGER TRANSPORT STRATEGY
 ALL ABOARD LABOR S LONG TERM PASSENGER TRANSPORT STRATEGY Revitalising Passenger Transport Increasing traffic congestion in our cities and a lack of transport services in our regional towns is frustrating
A. CONCLUSIONS OF THE FGEIS
 Chapter 11: Traffic and Parking A. CONCLUSIONS OF THE FGEIS The FGEIS found that the Approved Plan will generate a substantial volume of vehicular and pedestrian activity, including an estimated 1,300
Venice Convention Centre. Lido di Venezia
 Venice Convention Centre Lido di Venezia The City of Venice World culture capital Venice is considered one of the capital cities of art and architecture in the world. The city is renowned nationally and
Q: How many flights arrived and departed in 2017? A: In 2017 the airport saw 39,300 air transport movements.
 Southampton Airport Masterplan FAQ 4 October 2018 Background Southampton Airport Today Q: How many passengers currently use Southampton Airport and how has this changed over the last 5 years? A: Over the
Treasure Island Supplemental Information Report Addendum
 1 1 1 1 0 1 0 1 0 1 Treasure Island Supplemental Information Report Addendum Introduction Purpose The purpose of this Supplemental Information Report (SIR) Addendum is to determine if the current land
Potomac River Commuter Ferry Feasibility Study & RPE Results
 1.1 Introduction The Prince William County Department of Transportation conducted a route proving exercise (RPE) and feasibility study of a proposed commuter ferry service on the Potomac River between
Corporate Productivity Case Study
 BOMBARDIER BUSINESS AIRCRAFT Corporate Productivity Case Study April 2009 Marketing Executive Summary» In today's environment it is critical to have the right tools to demonstrate the contribution of business
Measuring Productivity for Car Booking Solutions
 Measuring Productivity for Car Booking Solutions Value Creation Study Rebecca Bartlett 20th January 2014 Table of Contents Executive Summary Introduction Method Productivity Analysis Scenario 1 Scenario
Submission to Infrastructure Victoria s Draft 30-Year Infrastructure Strategy
 Submission to Infrastructure Victoria s Draft 30-Year Infrastructure Strategy 1. Introduction This submission is a response to Infrastructure Victoria s assessment of the need to construct a heavy rail
American Airlines Next Top Model
 Page 1 of 12 American Airlines Next Top Model Introduction Airlines employ several distinct strategies for the boarding and deboarding of airplanes in an attempt to minimize the time each plane spends
V324 Laguna Terrazza INFORMATION PACK
 V324 Laguna Terrazza INFORMATION PACK Address Apt B2 Condominio Guidecca Mare Calle Michelangelo Giudecca Local contact and keyholder Marta Gallina Tel: +39 338 708 7614 English spoken? Fair Any local
SAMTRANS TITLE VI STANDARDS AND POLICIES
 SAMTRANS TITLE VI STANDARDS AND POLICIES Adopted March 13, 2013 Federal Title VI requirements of the Civil Rights Act of 1964 were recently updated by the Federal Transit Administration (FTA) and now require
HOW TO IMPROVE HIGH-FREQUENCY BUS SERVICE RELIABILITY THROUGH SCHEDULING
 HOW TO IMPROVE HIGH-FREQUENCY BUS SERVICE RELIABILITY THROUGH SCHEDULING Ms. Grace Fattouche Abstract This paper outlines a scheduling process for improving high-frequency bus service reliability based
APPENDIX B COMMUTER BUS FAREBOX POLICY PEER REVIEW
 APPENDIX B COMMUTER BUS FAREBOX POLICY PEER REVIEW APPENDIX B COMMUTER BUS FAREBOX POLICY PEER REVIEW The following pages are excerpts from a DRAFT-version Fare Analysis report conducted by Nelson\Nygaard
Thank you for participating in the financial results for fiscal 2014.
 Thank you for participating in the financial results for fiscal 2014. ANA HOLDINGS strongly believes that safety is the most important principle of our air transportation business. The expansion of slots
Interstate 90 and Mercer Island Mobility Study APRIL Commissioned by. Prepared by
 Interstate 90 and Mercer Island Mobility Study APRIL 2017 Commissioned by Prepared by Interstate 90 and Mercer Island Mobility Study Commissioned by: Sound Transit Prepared by: April 2017 Contents Section
V211 Palazzo Castello Terrazza INFORMATION PACK
 V211 Palazzo Castello Terrazza INFORMATION PACK Address Palazzo Grandiben Negri Calle Erizzo o de la Bela Dona 4003 Castello Venezia Local contact and keyholder Lorenza Savini Tel: (+39) 340 797 6425 English
2015 Independence Day Travel Overview U.S. Intercity Bus Industry
 2015 Independence Day Travel Overview U.S. Intercity Bus Industry Chaddick Institute for Metropolitan Development, DePaul University June 25, 2015 This Intercity Bus Briefing summarizes the Chaddick Institute
European city tourism Study Analysis and findings
 European city tourism 2015 Study Analysis and findings Vienna, November 2015 Contents Page A. Management summary 3 B. Study objective and approach 8 C. Study results 14 D. Selected city profiles 19. Roland
Response to the London Heathrow Airport Expansion Public Consultation
 Response to the London Heathrow Airport Expansion Public Consultation Summary This report sets out the response to the Heathrow Airport s consultation on airport expansion and airspace change. The consultation
Memorandum. Roger Millar, Secretary of Transportation. Date: April 5, Interstate 90 Operations and Mercer Island Mobility
 Memorandum To: From: The Honorable Dow Constantine, King County Executive; The Honorable Ed Murray, City of Seattle Mayor; The Honorable Bruce Bassett, City of Mercer Island Mayor; The Honorable John Stokes,
1.0 Project Background Mission Statement and Goals Objectives of this Sustainable Master Plan
 TABLE OF CONTENTS CHAPTER 1 INTRODUCTION 10 Project Background 1-1 11 Mission Statement and Goals 1-1 12 Objectives of this Sustainable Master Plan 1-2 CHAPTER 2 INVENTORY 20 Airport Background 2-1 201
TOURISM STATISTICS REPORT 2016 EAST REGION VISIT GREENLAND
 TOURISM STATISTICS REPORT 2016 EAST REGION VISIT GREENLAND INTRODUCTION In Q1 of 2015 Visit Greenland made its first regional tourism report based on data on air passengers, overnight stays in accommodations
Evaluation of Alternative Aircraft Types Dr. Peter Belobaba
 Evaluation of Alternative Aircraft Types Dr. Peter Belobaba Istanbul Technical University Air Transportation Management M.Sc. Program Network, Fleet and Schedule Strategic Planning Module 5: 10 March 2014
EUROPEAN VISION SUMMIT 2008 EXPLORATORY WORKSHOP
 EUROPEAN VISION SUMMIT 2008 EXPLORATORY WORKSHOP Towards the Future of European Vision Research Date: JUNE 16 th JUNE 17 th, 2008 Location: Meeting: VENICE, Italy Sala della Musica, Casino di Commercio,
Appendix B Ultimate Airport Capacity and Delay Simulation Modeling Analysis
 Appendix B ULTIMATE AIRPORT CAPACITY & DELAY SIMULATION MODELING ANALYSIS B TABLE OF CONTENTS EXHIBITS TABLES B.1 Introduction... 1 B.2 Simulation Modeling Assumption and Methodology... 4 B.2.1 Runway
Peer Performance Measurement February 2019 Prepared by the Division of Planning & Market Development
 2017 Regional Peer Review Peer Performance Measurement February 2019 Prepared by the Division of Planning & Market Development CONTENTS EXECUTIVE SUMMARY... 3 SNAPSHOT... 5 PEER SELECTION... 6 NOTES/METHODOLOGY...
2009 Muskoka Airport Economic Impact Study
 2009 Muskoka Airport Economic Impact Study November 4, 2009 Prepared by The District of Muskoka Planning and Economic Development Department BACKGROUND The Muskoka Airport is situated at the north end
5 Rail demand in Western Sydney
 5 Rail demand in Western Sydney About this chapter To better understand where new or enhanced rail services are needed, this chapter presents an overview of the existing and future demand on the rail network
REGION OF WATERLOO INTERNATIONAL AIRPORT AIRPORT MASTER PLAN EXECUTIVE SUMMARY MARCH 2017
 REGION OF WATERLOO INTERNATIONAL AIRPORT AIRPORT MASTER PLAN EXECUTIVE SUMMARY MARCH 2017 Contact: Chris Wood, Airport General Manager cwood@regionofwaterloo.ca (519) 648-2256 ext. 8502 Airport Master
The presentation was approximately 25 minutes The presentation is part of Working Group Meeting 3
 This is the presentation for the third Master Plan Update Working Group Meeting being conducted for the Ted Stevens Anchorage International Airport Master Plan Update. It was given on Thursday March 7
TABLE OF CONTENTS. General Study Objectives Public Involvement Issues to Be Resolved
 TABLE OF CONTENTS Description Page Number LIST OF ACRONYMS... a CHAPTER ONE INTRODUCTION General... 1-1 Study Objectives... 1-1 Public Involvement... 1-2 Issues to Be Resolved... 1-2 CHAPTER TWO EXISTING
Oakland A s Gondola Economic Impact
 January 2019 Oakland A s Gondola Economic Impact KEY FINDING: The proposed gondola system, which will connect the A s planned stadium to downtown Oakland, will generate $685 million in total economic benefit
Depeaking Optimization of Air Traffic Systems
 Depeaking Optimization of Air Traffic Systems B.Stolz, T. Hanschke Technische Universität Clausthal, Institut für Mathematik, Erzstr. 1, 38678 Clausthal-Zellerfeld M. Frank, M. Mederer Deutsche Lufthansa
CRUISE ACTIVITY IN BARCELONA. Impact on the Catalan economy and socioeconomic profile of cruise passengers (2014)
") CRUISE ACTIVITY IN BARCELONA Impact on the Catalan economy and socioeconomic profile of cruise passengers (2014) 2 CRUISE ACTIVITY IN BARCELONA 2014 Impact on the Catalan economy and socioeconomic profile
CRUISE ACTIVITY IN BARCELONA Impact on the Catalan economy and socioeconomic profile of cruise passengers (2014) 2 CRUISE ACTIVITY IN BARCELONA 2014 Impact on the Catalan economy and socioeconomic profile
Noise Mitigation Program
 Noise Mitigation Program Quick Facts 78% decrease year over year in complaints related to scheduled engine-run ups which is attributable to the new Ground Run-Up Enclosure (GRE) that went into operation
AGENDA GUEMES ISLAND FERRY OPERATIONS PUBLIC FORUM
 AGENDA GUEMES ISLAND FERRY OPERATIONS PUBLIC FORUM Wednesday, August 17, 211 6: p.m. Guemes Island Community Hall ~ 7549 Guemes Island Road Thank you for attending the second Annual Public Forum in 211.
RNP In Daily Operations
 RNP In Daily Operations Article 2 Paul Malott WestJet It was a dark and stormy night in the mountainous terrain of Kelowna, British Columbia. Suddenly, the noise of a jet airplane on final pierced the
Executive Summary. MASTER PLAN UPDATE Fort Collins-Loveland Municipal Airport
 Executive Summary MASTER PLAN UPDATE Fort Collins-Loveland Municipal Airport As a general aviation and commercial service airport, Fort Collins- Loveland Municipal Airport serves as an important niche
Application Decision. Application: PO Box 2687, Port Hardy BC V0N 2P0. Special Authorization:
 Application Decision Application: 83 11 Applicant Trade Names: Address: Principals: Special Authorization: Summary: 0825241 BC Ltd Town Taxi PO Box 2687, Port Hardy BC V0N 2P0 WIGARD, Gunnar John Passenger
ECONOMIC IMPACT REPORT
 ECONOMIC IMPACT 2017 REPORT How the Lyft community is increasing support for local economies, earning more supplemental income, and improving the health of their cities. A decade ago, Lyft embarked on
CRUISE TABLE OF CONTENTS
 CRUISE FLIGHT 2-1 CRUISE TABLE OF CONTENTS SUBJECT PAGE CRUISE FLIGHT... 3 FUEL PLANNING SCHEMATIC 737-600... 5 FUEL PLANNING SCHEMATIC 737-700... 6 FUEL PLANNING SCHEMATIC 737-800... 7 FUEL PLANNING SCHEMATIC
Union Station Queens Quay Transit Link Study
 Welcome Union Station in 1899. Image: City of Toronto Archives Union Station today. Image: Camil Rosiak Activity along Queens Quay. Image: Waterfront Toronto For more information or to comment, visit toronto.ca/waterfronttransit
Mr. Chairman, Members of the Committee, I am Chet Fuller, President GE Aviation
 Mr. Chairman, Members of the Committee, I am Chet Fuller, President GE Aviation Systems, Civil. Thank you for the opportunity to testify before the Subcommittee today on the issue of Area Navigation (RNAV)
Borders Railway: What is the impact two years on?
 STAR 2018 Borders Railway: What is the impact two years on? Rachel Thomas, Peter Brett Associates, Scott Leitham, Peter Brett Associates, and Rebecca Rossi, Transport Scotland 1 INTRODUCTION The Borders
Appendix 4.1 J. May 17, 2010 Memorandum from CTPS to the Inter Agency Coordinating Group
 Appendix 4.1 J May 17, 2010 Memorandum from CTPS to the Inter Agency Coordinating Group CTPS CENTRAL TRANSPORTATION PLANNING STAFF Staff to the Boston Region Metropolitan Planning Organization MEMORANDUM
FORT LAUDERDALE-HOLLYWOOD INTERNATIONAL AIRPORT ENVIRONMENTAL IMPACT STATEMENT DRAFT
 D.3 RUNWAY LENGTH ANALYSIS Appendix D Purpose and Need THIS PAGE INTENTIONALLY LEFT BLANK Appendix D Purpose and Need APPENDIX D.3 AIRFIELD GEOMETRIC REQUIREMENTS This information provided in this appendix
Florence (Marco Polo City Maps)
") Florence (Marco Polo City Maps) Venice ( Marco Polo) Airport, Italy (VCE) Guide & - Guide to Venice (Marco Polo) Click Map to Zoom In London City (1123 Km)(CO 2?) British Airways (BA Cityflyer) Florence
Florence (Marco Polo City Maps) Venice ( Marco Polo) Airport, Italy (VCE) Guide & - Guide to Venice (Marco Polo) Click Map to Zoom In London City (1123 Km)(CO 2?) British Airways (BA Cityflyer) Florence
CURRENT SHORT-RANGE TRANSIT PLANNING PRACTICE. 1. SRTP -- Definition & Introduction 2. Measures and Standards
 CURRENT SHORT-RANGE TRANSIT PLANNING PRACTICE Outline 1. SRTP -- Definition & Introduction 2. Measures and Standards 3. Current Practice in SRTP & Critique 1 Public Transport Planning A. Long Range (>
FORECASTING FUTURE ACTIVITY
 EXECUTIVE SUMMARY The Eagle County Regional Airport (EGE) is known as a gateway into the heart of the Colorado Rocky Mountains, providing access to some of the nation s top ski resort towns (Vail, Beaver
Airport Planning Area
 PLANNING AREA POLICIES l AIRPORT Airport Planning Area LOCATION AND CONTEXT The Airport Planning Area ( Airport area ) is a key part of Boise s economy and transportation network; it features a multi-purpose
Technical considerations on rapid transit mode selection BRT / LRT potentialities in France
 Technical considerations on rapid transit mode selection BRT / LRT potentialities in France François Rambaud - CERTU Washington September 2006 1 Certu s mission Statistics, observation Information letters
Date: 11/6/15. Total Passengers
 Total San Diego Metropolitan Transit System POLICY 42 PERFORMANCE MONITORING REPORT Page 1 of 6 OBJECTIVE Develop a Customer-Focused and Competitive System The following measures of productivity and service
CHAPTER 1 EXECUTIVE SUMMARY
 CHAPTER 1 EXECUTIVE SUMMARY 1 1 EXECUTIVE SUMMARY INTRODUCTION William R. Fairchild International Airport (CLM) is located approximately three miles west of the city of Port Angeles, Washington. The airport
FUTURE PASSENGER PROCESSING. ACRP New Concepts for Airport Terminal Landside Facilities
 FUTURE PASSENGER PROCESSING ACRP 07-01 New Concepts for Airport Terminal Landside Facilities In association with: Ricondo & Associates, TransSolutions, TranSecure RESEARCH Background Research Objective
All Door Boarding Title VI Service Fare Analysis. Appendix P.3
 All Door Boarding Title VI Service Fare Analysis Appendix P.3 Metro Board Report Los Angeles County Metropolitan Transportation Authority One Gateway Plaza 3rd Floor Board Room Los Angeles,
Passenger Facility Charge (PFC) Program: Eligibility of Ground Access Projects Meeting
 Program: Eligibility of Ground Access Projects Meeting") This document is scheduled to be published in the Federal Register on 05/03/2016 and available online at http://federalregister.gov/a/2016-10334, and on FDsys.gov [ 4910-13] DEPARTMENT OF TRANSPORTATION
This document is scheduled to be published in the Federal Register on 05/03/2016 and available online at http://federalregister.gov/a/2016-10334, and on FDsys.gov [ 4910-13] DEPARTMENT OF TRANSPORTATION
FY Year End Performance Report
 Overall Ridership Big Blue Bus carried 18,748,869 passengers in FY2014-2015, a 0.3% reduction from the year prior. This negligible reduction in ridership represents the beginnings of a reversal from a
WELLINGTON $422 MILLION $614 MILLION $83 MILLION 22% SPEND $1.9 BILLION
 WELLINGTON WELLINGTON $1.9 BILLION FORECAST TOTAL WELLINGTON INVESTMENT The Wellington region s transport challenges are dominated by the region s concentration of population in the metropolitan cities,
Lyft s Economic Impact 2015 REPORT
 Lyft s Economic Impact 2015 REPORT In more than 65 cities nationwide, Lyft has become a powerful vehicle of change and connectivity. We studied our seven most established markets to explore Lyft s positive
Airport analyses informing new mobility shifts: Opportunities to adapt energyefficient mobility services and infrastructure
 Airport analyses informing new mobility shifts: Opportunities to adapt energyefficient mobility services and infrastructure Alejandro Henao, Josh Sperling, Venu Garikapati, Yi Hou, Stan Young National
SPADE-2 - Supporting Platform for Airport Decision-making and Efficiency Analysis Phase 2
 - Supporting Platform for Airport Decision-making and Efficiency Analysis Phase 2 2 nd User Group Meeting Overview of the Platform List of Use Cases UC1: Airport Capacity Management UC2: Match Capacity
Lake Erie Commerce Center Traffic Analysis
 LOCATION: East of NYS Route 5 at Bayview Road Town of Hamburg Erie County, New York PREPARED BY: Wendel Companies 140 John James Audubon Parkway Suite 200 Amherst, New York 14228 January 2012 i ii Table
PUBLIC TRANSIT IN KENOSHA, RACINE, AND MILWAUKEE COUNTIES
 PUBLIC TRANSIT IN KENOSHA, RACINE, AND MILWAUKEE COUNTIES #118404v1 Regional Transit Authority June 19, 2006 1 Presentation Overview Existing Public Transit Transit System Peer Comparison Recent Transit
Senior Softball USA. Three Coins in a Fountain Venice, Florence, Pisa, Assisi & Rome. 12 days fully escorted, October 8 19, 2015 (Land Package only)
") Senior Softball USA Three Coins in a Fountain Venice, Florence, Pisa, Assisi & Rome 12 days fully escorted, October 8 19, 2015 (Land Package only) Day # 1 (D) Thursday Oct 8 Arrival in Venice, Marco Polo
Senior Softball USA Three Coins in a Fountain Venice, Florence, Pisa, Assisi & Rome 12 days fully escorted, October 8 19, 2015 (Land Package only) Day # 1 (D) Thursday Oct 8 Arrival in Venice, Marco Polo
2 YORK REGION TRANSIT MOBILITY PLUS 2004 SYSTEM PERFORMANCE REVIEW
 2 YORK REGION TRANSIT MOBILITY PLUS 2004 SYSTEM PERFORMANCE REVIEW The Joint Transit Committee and Rapid Transit Public/Private Partnership Steering Committee recommends the adoption of the recommendation
FLIGHT PATH FOR THE FUTURE OF MOBILITY
 FLIGHT PATH FOR THE FUTURE OF MOBILITY Building the flight path for the future of mobility takes more than imagination. Success relies on the proven ability to transform vision into reality for the betterment
Adventure On Italy Travel Itineraries 7 Days in Venice. Plan your trip of a lifetime like one of our expert guides. Copyright 2015 Adventure On, LLC
 Adventure On Italy Travel Itineraries 7 Days in Venice Plan your trip of a lifetime like one of our expert guides. Copyright 2015 Adventure On, LLC Disclaimer: Feel free to share this itinerary, but please
PARKING CAPACITY REQUIREMENTS
 PARKING CAPACITY REQUIREMENTS Presented to: Antaramian Development Corporation 365 5 th Avenue South Naples, Florida 34102 CONTENTS Page INTRODUCTION... 1 BACKGROUND... 2 EXISTING PARKING CONDITIONS...
Canada s Airports: Enabling Connectivity, Growth and Productivity for Canada
 Canada s Airports: Enabling Connectivity, Growth and Productivity for Canada 2018 Federal Budget Submission House of Commons Standing Committee on Finance Introduction The Canadian Airports Council is
Efficiency and Automation
 Efficiency and Automation Towards higher levels of automation in Air Traffic Management HALA! Summer School Cursos de Verano Politécnica de Madrid La Granja, July 2011 Guest Lecturer: Rosa Arnaldo Universidad
SRTA Year End Fixed Route Ridership Analysis: FY 2018
 SRTA Year End Fixed Route Ridership Analysis: FY 2018 2018 Contents Introduction... 1 A. Key Terms Used in this Report... 1 Key Findings... 2 A. Ridership... 2 B. Fare Payment... 4 Performance Analysis
WATERBORNE TRANSIT. April 21, 2010
 WATERBORNE TRANSIT CONCEPTS STUDY April 21, 2010 1 Overview: Summary of previous 2004/2005 Ferry Service analysis Results of recent study focusing on ferry service from Newport News Conclusions 2 2004/2005
Gold Coast. Rapid Transit. Chapter twelve Social impact. Chapter content
 Gold Coast Rapid Transit Chapter twelve Social impact Chapter content Social impact assessment process...235 Existing community profile...237 Consultation...238 Social impacts and mitigation strategies...239
Implementation of Real-Time Data into a Transport Simulation
 Implementation of Real-Time Data into a Transport Simulation Krain, Armin Johannes Deutschmann, Andreas Rudolph, Florian German Aerospace Center Abstract Within the framework project Optimode.net the German
Air Connectivity and Competition
 Air Connectivity and Competition Sainarayan A Chief, Aviation Data and Analysis Section, ATB Concept of Connectivity in Air Transport Movement of passengers, mail and cargo involving the minimum of transit
Compustat. Data Navigator. White Paper: Airline Industry-Specifi c
 Compustat Data Navigator White Paper: Airline Industry-Specifi c April 2008 Data Navigator: Airline Industry-Specific Data There are several metrics essential to airline analysis that are unavailable on
8 CROSS-BOUNDARY AGREEMENT WITH BRAMPTON TRANSIT
 8 CROSS-BOUNDARY AGREEMENT WITH BRAMPTON TRANSIT The Transportation Services Committee recommends the adoption of the recommendations contained in the following report dated May 27, 2010, from the Commissioner
Ocean County Brian Berkowitz (Partner Adam Nassr Monmouth County)
") Ocean County Brian Berkowitz (Partner Adam Nassr Monmouth County) 1. County Summary Ocean County, founded in 1850, is located along the Jersey Shore in the state of New Jersey and has been one of the fastest
Ocean County Brian Berkowitz (Partner Adam Nassr Monmouth County) 1. County Summary Ocean County, founded in 1850, is located along the Jersey Shore in the state of New Jersey and has been one of the fastest
WHERE SHOULD WE EXPAND AIRPORT CAPACITY IN METRO LA? December 11, Jacki Murdock, Transportation and Environmental Planner
 WHERE SHOULD WE EXPAND AIRPORT December 11, 2012 CAPACITY IN METRO LA? Jacki Murdock, Transportation and Environmental Planner OVERVIEW Trends in Air Travel Air Travel in SCAG Region Why Airport Expansion?
Table of Contents. Master Plan March 2014 TOC i Spokane International Airport
 Table of Contents Page Chapter 1 Inventory 1. Introduction... 1 1 1.1 Community Profile... 1 2 1.1.1 Location and Setting... 1 1 1.1.2 Climate... 1 2 1.1.3 Socioeconomic Conditions... 1 5 1.1.4 Area Land
Larry Leung. Anthony Loui
 Larry Leung Director Experience The Skies Anthony Loui Community Planner Federal Transit Administration, United States Department of Transportation Improving Intermodal Connectivity and Access at Airports
Westover Metropolitan Airport Master Plan Update
 Westover Metropolitan Airport Master Plan Update June 2008 INTRODUCTION Westover Metropolitan Airport (CEF) comprises the civilian portion of a joint-use facility located in Chicopee, Massachusetts. The
Sunshine Coast Airport Master Plan September 2007
 Sunshine Coast Airport Master Plan September 2007 Contents CONTENTS... I ACKNOWLEDGEMENT... II DISCLAIMER... III 1 EXECUTIVE SUMMARY...IV 1 INTRODUCTION... 1 2 AVIATION DEMAND FORECAST... 5 3 AIRCRAFT
Air Transport Association of Canada
 Document Presented by the Air Transport Association of Canada to the HOUSE OF COMMONS STANDING COMMITTEE ON TRANSPORT, INFRASTRUCTURE AND COMMUNITIES ATAC Comments Motion M-177 Instruction to the Standing
Air Transport Indicators
 Air Transport Indicators Brown Bag Lunch Presentation and Discussion 1. February 2006 Heinrich C. Bofinger and Peter Roberts Why Are Measures and Indicators For Air Transport Needed? To gain understanding
VI. ALTERNATIVES TO THE MASTER PLAN C. RENOVATED EAST BUILDING ALTERNATIVE
 VI. ALTERNATIVES TO THE MASTER PLAN C. RENOVATED EAST BUILDING ALTERNATIVE INTRODUCTION The Renovated East Building Alternative would include the continued use of the renovated West Building and the renovation
Appendix A: Summary of findings drawn from an analysis of responses to the questionnaire issued to all households in Trimley St Martin
 Transport and Works Act 1992 The Network Rail (Felixstowe Branch Line Improvements Level Crossing Closure) Order Trimley St Martin Parish Council Statement of Case The statement of Case of the Parish Council
USE OF 3D GIS IN ANALYSIS OF AIRSPACE OBSTRUCTIONS
 USE OF 3D GIS IN ANALYSIS OF AIRSPACE OBSTRUCTIONS A project by by Samuka D. W. F19/1461/2010 Supervisor; Dr D. N. Siriba 1 Background and Problem Statement The Airports in Kenya are the main link between
Exclusive transfer services to & from San Clemente Palace Kempinski
 Exclusive transfer services to & from San Clemente Palace 1 Summary BENVENUTI AL SAN CLEMENTE PALACE KEMPINSKI... 3 TRANSFERS AND IN-AIRPORT SERVICES FROM/TO VENICE MARCO POLO VCE INTERNATIONAL AIRPORT...
Airport Systems: Planning, Design, and Management
 Airport Systems: Planning, Design, and Management Richard de Neufville AmedeoR. Odoni McGraw-Hill New York Chicago San Francisco Lisbon London Madrid Mexico City Milan New Delhi San Juan Seoul Singapore
LIST OF FIGURES LIST OF GRAPHS
 LIST OF FIGURES Number of Figures TITLE Page No. 1 The map showing early expansion of Indus valley civilization 29 2 Geographical location of Gujarat in the world map 30 3 A historical map showing integration
Forest Hill Society response to the draft London and South East Route Utilisation Strategy (February 2011)
") Forest Hill Society response to the draft London and South East Route Utilisation Strategy (February 2011) 1. The Forest Hill Society represents residents in and around the Forest Hill and Honor Oak Park
Forest Hill Society response to the draft London and South East Route Utilisation Strategy (February 2011) 1. The Forest Hill Society represents residents in and around the Forest Hill and Honor Oak Park
Bumpy Skies. Report - October 2002
 Report - October 2002 Bumpy Skies In this report on New York's air transport industry, the Center illustrates that JFK and LaGuardia fared worse than most U.S. airports in the year after September 11th
AUGUST 2008 MONTHLY PASSENGER AND CARGO STATISTICS
 Inter-Office Memo Reno-Tahoe Airport Authority Date: October 2, 2008 To: Statistics Recipients From: Tom Medland, Director Air Service Business Development Subject: RENO-TAHOE INTERNATIONAL AIRPORT PASSENGER