Quarterly Highlight. Company Overview
|
|
|
- Jeremy Garrett
- 5 years ago
- Views:
Transcription
1 MBK Public Company Limited Key Performance 1H
2 Disclaimer This presentation is made, furnished and distributed for information purposes only. Nothing in this release should be construed as either an offer to sell or the solicitation of and offer to buy or sell share in any jurisdiction. This presentation may include information which is forward-looking in nature. Forward-looking involve risks, uncertainties and other factors which may impact on the actual outcomes, include economic conditions in the markets in which MBK operates and general achievement of MBK business forecasts, which will cause the actual results, performance or achievements of MBK to differ, perhaps materially, from the results, performance or achievements expressed or implied in this presentation. Please be advised that this presentation may contain expectations and assumptions that are subject to change at any time. Results and future performance are not guaranteed and may differ from expectations. 2
3 Content Quarterly Highlight Company Overview Profile and Key Performance - Shopping Center Business - Hotel & Tourism Business - Golf Business - Real Estate Development Business - Rice Business - Finance Business - Other Business CAPEX Financial Highlight 1H
4 Quarterly Highlight Revenue rises 7.2% YoY to 4,554 Mil for 1H 2012 Operating Profit Margin for 1H 2012 grows 4.9 % YoY to 38.4% ROE climbs 4.4% to 16.6%, and ROA rises 2.5% to 7.6% EPS rises 51.2% to 7.2 Baht per Share for 1H 2012
5 Company Overview 5
6 Corporate info Background Paid-Up Capital Established in 1974; relisted on the SET since 1994; changing its name to MBK in Bt1, Mil( million 10 baht) Market Cap. Bt17,637 Mil (93.50 Bt/share as of 30 July 2012) Dividend Policy Semi-Annually Major shareholders Patum Rice Mill and Granary Plc. (26%) Rating Thanachart Group (19.9%) State Street Bank and Trust Company For Australia (3.6%) Nortrust Nominees Ltd. (3%) A/Stable Outlook by Tris Rating. 6
7 Milestones Established 1974 Relisted on SET 1985 PPB Hotel opened 1994 Upcoming Pattaya properties 55 Market opened 2013 Paradise Park taken over 2012 formerly Seri Center 2011 Sheraton Krabi Beach Resort launched 2010 To develop first downtown condo Plan Estate acquired 2008 The Nine opened 2007 Layana acquired Invested in Maldives (Resort) Invested in ROH Mah Boon Krong Shopping Center opened Paradise Park relaunched Riverdale Golf Course opened T Leasing acquired Glas Haus Ratchada acquired Red Mountain Golf Course opened Apple Auto Auction operated Glas Haus Sukhumvit acquired Renewed lease agreement of MBK Invested In Siam Piwat Tinidee Hotel@ Ranong acquired Loch Palm Golf Course acquired 7
 Siam Center Siam Discovery Siam Tower Siam Paragon (50%) The Nine Center Glas Haus Sukhumvit Glas Haus Ratchada (34%) Pathumwan Princess Hotel Tinidee Hotel @ Ranong Tinidee Hotel @Phuket Layana")
8 Business Structure As of June 2012 Shopping Center Hotel & Tourism Golf Real Estate Rice Finance Development Other MBK Center Paradise Park (50%) Sheraton Krabi Beach Resort 50% Siam Piwat (30.7%) Siam Center Siam Discovery Siam Tower Siam Paragon (50%) The Nine Center Glas Haus Sukhumvit Glas Haus Ratchada (34%) Pathumwan Princess Hotel Tinidee Ranong Tinidee Layana Dusit Thani Maldives, MudhdhooIsland, Baa Atoll (30%) Royal Orchid Sheraton (29.8%) Dusit Thani (11.7%) Erawan Group (6.3%) Loch Palm Golf Course (72.6%) Red Mountain Golf Course (72.6%) Riverdale Golf Course Lam LukKa Golf and Country Club (26.9%) Plan Estate (72.6%) Crystal Lake (72.6%) Riverdale Residence RatchadaSoi17 Patum Rice Mill (74.5%) MBK-G T Leasing TCAP (9.9%) Max Asset (16.6%) Apple Auto Auction (50%) X-Gen (9%) (10%) (3%) (4%) (26%) (3%) Asset allocation by business (excl. 10% allocated to pooled asset for liquidity management purpose) M Racing 8
9 Key Properties by Geographic Location Bangkok Phuket Krabi 9
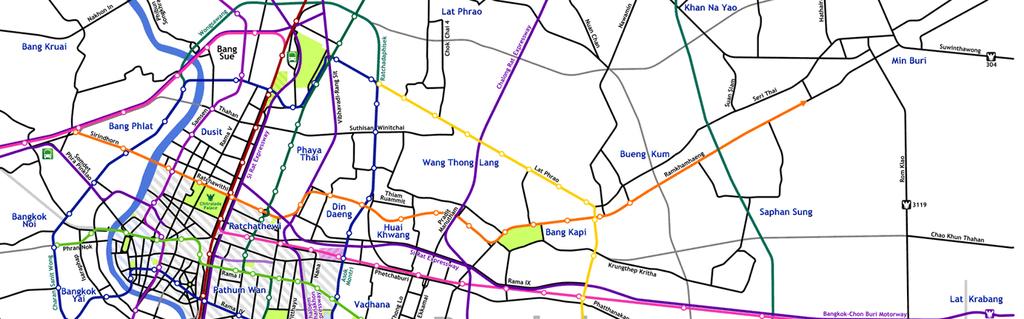
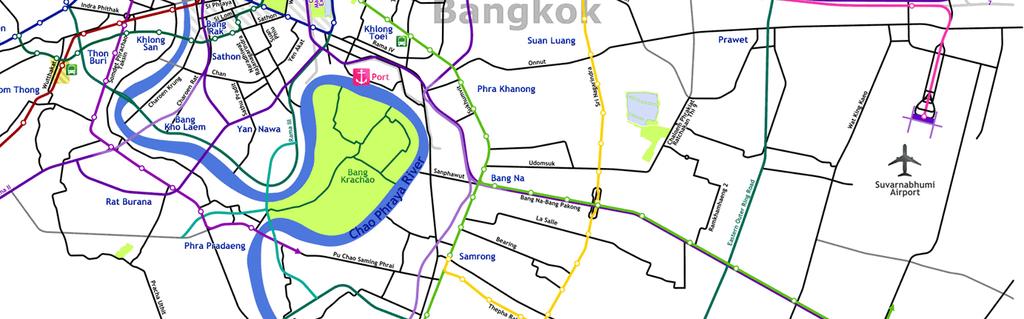


10 Key Properties in Bangkok Area 10
11 Key Properties in Phuket and Krabi 11
12 Profile and Key Performance 12
13 Shopping Center Business 13
14 Shopping Center Portfolio Property MBK's Net Stake (%) Retail (sq.m.) Office (sq.m.) MBK Center 100.0% 92,000 - MBK Tower 100.0% - 18,000 Paradise Park 65.4% 91,000 - The Nine Neighborhood Center 100.0% 12,000 9,000 Properties of Siam Piwat Siam Center 30.7% 19,000 - Siam Discovery & Tower 30.7% 23,200 30,700 Siam Paragon 15.4% 186,010 - Glas Haus Sukhumvit 100.0% - 13,500 Glas Haus Ratchada 100.0% - 8,200 Total 423,210 79,400 MBK's Net Stake 205,010 58,128 14


 8,159 1,365 1,200 Avg.")
15 Shopping Center Portfolio As of June 2012 Properties MBK Paradise Park The nine Type Shopping Center Shopping Center Community Mall Location Pathumwan Intersection Srinakarin Road Rama IX Road Tenure Leasehold ended 2033 Leasehold ended 2023 Freehold Lettable area (sq.m.) 92,000 (Retail) 91,000 12,000 (Retail) 18,000 (Office) 9,000 (Office) Storey MBK's Stake 100% 50% 100% Investment Size (Bt Mil) 8,159 1,365 1,200 Avg. OR (%) (@ 1H 2012) 100% 89% 99% Target Customer B and C A and B B 15
16 MBK Center The lease contracts of MBK Center tenants : to be expired in July-Dec 2012^ = ~6%* to be expired in 2013^ = ~55%* Note : ^ calendar year and * of total lettable space MBK's traffic (Visitors per day) H H 2012 Weekdays 84,516 85,715 87,562 84,883 Weekend 94,394 97,030 98,379 95,529 All days 87,453 89,273 90,973 88,258 Foreign visitors accounting for 42%. (1H 2012) 16
")


17 Related Investment Portfolio in Shopping Business MBK has a 31% investment in SPW which has a retail property portfolio as follows SPW's Stake (%) Business Retail (sq.m) Office (sq.m.) Branches Siam Center 100% Shopping center 19, Siam Discovery 100% Shopping center 23, Siam Tower 100% Office Building - 30,700 - Siam Paragon 50% Shopping center 186, Paradise Park 50% Shopping center 91, Loft 100% Gift shop
18 Contribution of SPW Bt Mil / / /11 2H H H 2012 Profit Sharing Dividend Book Value : Bt1,334.2 Mil (under equity method as of June 2012) 18
19 Office Buildings Properties Glas Haus Building Glas Has Ratchada Location Sukhumvit Rd. Ratchada Rd. Tenure Leasehold ended August 2020 Leasehold ended February 2024 Anchor Tenants TBANK, UOB, GHB and PST TBANK Lettable area (sq.m.) 13,500 8,200 Acquired June 2007 June 2010 Investment Size (Bt Mil) Avg. OR (%) 1H 2012) 62.4% 100.0% 19
20 Shopping Center Performance Average Occupancy Rate (Percent) 2009/ /11 2H H H 2012 Shopping center MBK Center (92,000 sq.m.) 99.9% 99.5% 100.0% 99.8% 99.9% Paradise Park (91,000 sq.m.) N/A 89.2% 90.6% 91.4% 88.5% The nine-retail (12,000 sq.m.) N/A N/A 99.6% N/A 98.6% Office buildings Total Group 99.9% 94.4% 95.6% 95.6% 94.5% MBK Tower (18,000 sq.m.) 100.0% 100.0% 100.0% 100.0% 100.0% The nine-office (9,000 sq.m.) N/A N/A 100.0% N/A 100.0% Gaus Haus Sukhumvit (13,500 sq.m.) 98.2% 97.9% 80.0% 98.1% 62.4% Glas Haus Ratchada (8,200 sq.m.) N/A 100.0% 100.0% 100.0% 100.0% Total Group 99.2% 99.3% 94.5% 99.4% 89.6% 20
21 Shopping Center Business Revenue Breakdown 1,731 million baht 1,868 million baht GLAS HAUS OFFICE 3.24% 1H 2011 SPW 6.56% THE NINE 5.27% GLAS HAUS OFFICE 2.87% 1H 2012 SPW 7.89% PDP 28.26% MBK 61.95% PDP 25.44% MBK 58.53% 21
22 Hotel & Tourism Business 22
 Krabi Province 246 Freehold 2003 Tinidee Hotel @ Ranong (TNDR) Ranong Province 138 Freehold 2002 Tinidee Hotel @ Phuket (TNDP) Loch Palm Golf Course, Phuket 45 Freehold 2010 Layana")
23 Hotel Portfolio Properties Location Room Operate/ Tenure Capacity (Keys) Acquire Pathumwan Princess Hotel (PPB) Pathumwan intersection, Bangkok 455 Leasehold ended Sheraton Krabi Beach Resorts (SKBR) Krabi Province 246 Freehold 2003 Tinidee Ranong (TNDR) Ranong Province 138 Freehold 2002 Tinidee Phuket (TNDP) Loch Palm Golf Course, Phuket 45 Freehold 2010 Layana Resort & Spa (LAYANA) Koh Lanta Yai Island, Krabi 50 Freehold

24 Related Investment Portfolio in Hotel Business Property Location Investment size : Room Capacity : : Dusit Thani Maldives, Mudhdhoo island, Baa Atoll : Located on Mudhdhoo Island in Baa Atoll. Only 35 minutes from the capital Male by seaplane and 10 minutes by speedboat from the new domestic airport in Baa Atoll 348 Bt Mil. 100 keys Tenure : 35 Years Leasehold ended 2044 Operate : March 2012 Stake : 30% 24
25 Related Investment Portfolio in Hotel Business 25
26 Related Investment Portfolio in Hotel Business 26
27 Related Investment Portfolio in Hotel Business 27
28 Other Investment Portfolio in Hotel Business As of June 2012 Properties MBK's Stake Market value Room Capacity (%) (Bt Mil) Dividend Proceeds ROH 29.8% Own 726 Keys Hotel for n.a. Property in Bangkok DTC 11.6% Own and operate 4,636 Keys in 19 properties in Thailand and Asia 337 n.a. ERW 6.3% Own 3,512 Keys in 14 properties nationwide 365 n.a. 28
29 Hotel Operating Performance Average Occupancy Rate (Percent) 2008/ / /11 2H H/2011 1H/2012 Patumwan Princess Bangkok (455 keys) 74.97% 57.09% 65.11% 77.53% 73.37% 75.67% Sheraton Krabi Beach Resort (246 keys) 43.32% 45.21% 53.40% 50.50% 53.11% 62.18% Tinidee Hotel Ranong (138 keys) 57.88% 62.30% 64.56% 48.76% 65.59% 52.24% Tinidee Hotel Phuket (45 keys) N/A N/A 8.05% 14.02% 10.16% 41.06% Layana Resort & Spa (50 keys) N/A N/A N/A 58.90% 66.77% 69.71% Total Group 60.98% 54.33% 58.86% 62.10% 63.48% 66.67% Average Room Rate (Baht/Room/Night) Patumwan Princess Bangkok 3,201 2,923 2,825 2,748 2,872 3,032 Sheraton Krabi Beach Resort 4,217 4,274 4,229 3,382 4,229 3,745 Tinidee Hotel Ranong Tinidee Hotel Phuket N/A N/A 1, , Layana Resort & Spa N/A N/A N/A 4,961 5,947 6,127 Total Group 3,004 2,837 2,798 2,737 2,999 3,044 Average RevPAR (Baht/Room/Night) Patumwan Princess Bangkok 2,399 1,669 1,839 2,131 2,107 2,295 Sheraton Krabi Beach Resort 1,827 1,933 2,258 1,708 2,246 2,329 Tinidee Hotel Ranong Tinidee Hotel Phuket N/A N/A Layana Resort & Spa N/A N/A N/A 2,922 3,971 4,271 Total Group 1,832 1,541 1,647 1,700 1,904 2,030 29
30 Hotel and Tourism Business Revenue Breakdown 484 million baht 565 million baht 1H H 2012 TNDR &TNDI 6.39% TNDP 0.25% LAYANA 8.91% TNDR &TNDI 5.33% TNDP 0.54% LAYANA 12.21% SKBR 28.89% PPB 49.95% SKBR 27.15% PPB 54.77% 30
31 Golf Business 31
 MBK's Stake (%) Loch Palm")
 Kratu")
 Muang Pathum Thani District, Pathum")
 Lam Luk Ka Klong 11, Pathum Thani 36-Hole")
32 Golf Business Profile As of June 2012 Properties Location Business Land (Rai) MBK's Stake (%) Loch Palm Golf Course (LPGC) Kratu District, Phuket 18-Hole Golf Course % Red Mountain Golf Course (RMGC) Kratu District, Phuket 18-Hole Golf Course % Riverdale Golf Course (RDGC) Muang Pathum Thani District, Pathum Thani 18-Hole Golf Course % Lam Luk Ka Golf Course (LLK) Lam Luk Ka Klong 11, Pathum Thani 36-Hole Golf Course 1, % 32
33 Golf Operating Performance No. of Golfer (Rounds) 2009/ /11 2H H H 2012 LPGC 44,432 39,271 17,040 22,416 20,953 RMGC 16,624 18,697 8,784 10,192 11,305 RDGC - 32,232 15,695 17,650 24,193 LLK N/A N/A 16,368 N/A 34,668 Avg. Green Fee per Golfer (Baht) 2009/ /11 2H H H 2012 LPGC 1,303 1,541 1,496 1,557 1,674 RMGC 2,922 2,934 2,957 3,057 3,081 RDGC - 1,149 1,292 1,389 1,371 LLK N/A N/A 917 N/A 1,047
34 Golf Business Revenue Breakdown 166 million baht 199 million baht 1H H2012 LLK 2.38% RDGC 29.18% LPGC LPGC RDGC 32.50% 38.84% 39.89% RMGC 31.98% RMGC 30.40%
35 Real Estate Development Business 35
36 Existing Residential Project Performance As of June 2012 Y ear Total Total Average % Remaining Remaining Projec t Name Launc hed Project Value Units Unit Pric e of Sold Unsold Unsold (Bt Mt) (Bt Mil) (Units) (Bt Mt) PST Baan Suan Loch Palm % 4 49 The Creek % 5 49 The Indy II % Pano % Sabai Village I % - - Planery Zone 2 (Land) % - - Planery Zone 6 (Land) % 5 51 Little Lake Front (Land) % 2 25 MBK-R Total 1, % Sabai Village II % RM 18A (Land) % Total % Grand Total 2, % 241 1,464 36
37 Existing Residential Project Performance As of June 2012 Project Name Presales 2008/ / /11 2H H H 2012 Baan Suan Loch Palm (Units) Indy I (Units) Indy II (Units) Sabai Village (Units) Sabai Village II (Units) Little Lake Front (Units) Total (Units) Baan Suan Loch Palm (Bt Mil) Indy I (Bt Mil) Indy II (Bt Mil) Sabai Village (Bt Mil) Sabai Village II (Bt Mil) Little Lake Front (Bt Mil) Total (Bt Mil) Transfers Project Name 2008/ / /11 2H H H 2012 Baan Suan Loch Palm (Units) Indy I (Units) Indy II (Units) Sabai Village (Units) Sabai Village II (Units) Little Lake Front (Units) Total (Units) Baan Suan Loch Palm (Bt Mil) Indy I (Bt Mil) Indy II (Bt Mil) Sabai Village (Bt Mil) Sabai Village II (Bt Mil) Little Lake Front (Bt Mil) Total (Bt Mil)
38 Finance Business 38
 (%) MBK Guarantee (MBK-G) Offering financing against 100.")
 Operating motorcycle hire 100.")
39 Finance Business Operating Company Company Business As of June 2012 MBK's Stake Portfolio size (Bt Mil) (%) MBK Guarantee (MBK-G) Offering financing against 100.0% 2,381 collateral in Bangkok and key tourist provinces with acceptable LTV T leasing (TLS) Operating motorcycle hire 100.0% 1,225 purchase in Bangkok and suburban area 39
40 MBK-G Interest Revenue Interest Revenue Bt Mil /11 1H H H /11 1H H H
41 T Leasing Hire Purchase Revenue Hire Purchase Revenue Bt Mil / /11 1H H H / /11 1H H H
42 Related Investment Portfolio in Finance Business Company Business Thanachart Capital Plc. (TCAP) Holding Company of Tbank and other related financial institutions Max Asset Management (Max Asset) Acquiring NPA and NPL from financial institutions to manage restructure the collection and foreclose mortgage As of June 2012 MBK's Stake Book Value (Bt Mil) (%) 9.9% 3,637 (at market value) 16.6% 254 (under equity method) 42
43 TCAP Dividend Dividend Bt Mi il / / /11 1H H H / / /11 1H H H
44 Contribution of Max Asset Bt Mil Profit Sharin ng Dividend / / /11 1H H H 2012 Profit Sharing Dividend 44
45 Other Business 45
46 Other Business Profile Company Location Business Investment size MBK's Stake (Bt Mil) (%) Apple Auto Auction (AAA) Bangna-Trad Km.4 Rd Car and motorcycle auction company with genuine on-line auction service 45 50% X-Gen Premium (X-GP) Bangkae Motorcycles dealer % M Racing (MRC) 8th floor MBK Center Motorcycle dealer, its parts sales and motorcycle repairing % 46
47 CAPEX Bt mil Business Total Shopping ,591 Hotel Golf Real estate 422 1,186 1,222 2,830 Others ,040 2,186 1,798 5,024 47
48 Future Projects A community mall next to PDP (50% JV) due to open in late 2013 To launch first downtown condo in late 2012 More Residential Projects in Phuket To launch Pattaya Property in mid
49 Financial Highlights 49
50 Ratio Analysis for Shareholders Financial Ratios Unit 2008/ /09 (Adj) 2009/ /11 2H H H 2012 Operating Profit Margin % 40.05% 40.05% 33.27% 32.82% 34.72% 33.47% 38.33%^^ ROE % 12.64% 14.64% 26.32%* 11.30% 10.98%** 12.14%** 16.53%** ROA % 5.75% 6.34% 10.82%* 4.70% 4.80%** 5.14**% 7.58%** Dividend Yield % 7.73% 7.73% 6.94% 5.11% 2.72%^ N/A N/A Price to book value Times Price to earnings Times ** 10.25** 6.94** Note: * Including gain on marketable securities sale ** Annualized ^ Interim payment only ^^ Excluding gain on asset sale
51 Summary: Balance Sheet Bt Mil 30,000 25,000 20,000 15,000 10,000 5, ,430 26,682 24,654 27,070 27,198 20,413 12,456 14,605 15,790 12,198 14,210 11,181 12,077 12,640 13,074 12,860 14,124 9,232 Jun-09 Jun-09 (Adj)* Jun-10 Jun-11 Dec-11 Jun-12 Asset Liabilities Shareholders'Equity Note: *For comparison purpose with previously reported only adjusted real estate investment from fair value to historical cost. ** 1H 2011/12 ended Dec 11, 1H 2012 ended June 12
52 Income Statement 9,000 8,000 7,000 6,000 6,434 8,573 2,233 8,337 Revenue 7% YoY EBITDA 32% YoY Net Profit 51% YoY 5,000 4,000 3,000 2,577 6,340 4,434 2,233 2,547 2,736 4,292 4,246 4, ,000 1, , /09 1,582 2, /10 1, /11 1, H , H ,869 4, , , H 2012 EBITDA Net Profit Gain on asset sale Gain on asset sale
53 Revenue breakdown 9,000 8,573 8,337 Gain on marketable securities sale Bt mil 8,000 7,000 6,000 5,000 4,000 3,000 6, , , , , Others Finance Real Estate Rice Golf Hotel & Tourism 4,292 4,246 4,554 Shopping Center ,000 1,000 2,520 2,323 3, / / /11 2H H H 2012
54 Revenue breakdown 1H H 2012 Real Estate 2% Finance 7% Others 3% Real Estate 5% Finance 9% Others 5% Golf 4% Rice 29% Hotel & Tourism 12% Shopping Center 43% Golf 5% Rice 20% Hotel & Tourism 13% Shopping Center 43% Total revenue = Bt4,246 million Total revenue = Bt4,554 Million
55 EBITDA Breakdown 4,500 4,434 Gain on marketable securities sale Others Finance 4,000 Real Estate Bt mil 3,500 3,000 2,500 2,000 1,500 1, , ,594 2, , , ,000 1, ,421 Rice Golf Hotel & Tourism Shopping Center 1, / / /11 2H H H 2012
56 EBITDA Breakdown 1H H 2012 Golf 5% Rice 3% Real Estate -1% Finance 7% Others 4% Golf 5% Hotel & Tourism Hotel & 12% Tourism Shopping 12% Shopping Center 70% Rice 1% Real Estate 2% Finance 11% Others 11% Center 58% Total EBITDA = Bt1,421 million Total EBITDA = Bt1,869 Million
57 Operating Profit Margin Operating Profit Margin (%) 60.00% 4.9% YoY 50.00% 40.00% 30.00% 40.05% 33.26% 32.82% 34.72% 33.47% 38.33% 20.00% 10.00% 0.00% 2008/ / /11 2H H H 2012
58 Return on Assets and Equity 30.00% Bt mil 25.00% 20.00% 15.00% 10.00% 5.00% 0.00% 12.64% 5.75% 6.34% 14.64% 6.72% 4.10% 17.27% 9.05% 11.30% 4.70% 4.80% 10.98% 12.14% 5.14% ROA 2.4% YoY ROE 4.4% YoY 7.58% 16.53% 2008/ /09 (adj)* 2009/ /11 2H 2011* 1H 2011* 1H 2012* ROA (%) ROE (%) Gain on marketable securities sale Note: * For comparison purpose with previously reported only adjusted real estate investment from fair value to historical cost. ** Annualized
59 EPS % YoY Baht / / /11 2H H H 2012 EPS Gain on sales (Marketable securities)
60 2008/ / /11 2H 2011 Dividend Baht H H 2012 DPS : interim DPS : final 60
61 Major shareholders As of March 16, 2012 Name Number of shares % 1. PATUM RICE MILL AND GRANARY PUBLIC COMPANY LIMITED GROUP 49,924, % PATUM RICE MILL AND GRANARY PUBLIC COMPANY LIMITED 47,424, % PRG. GRANARY COMPANY LIMITED 2,500, % 2. THANACHART CAPITAL PUBLIC COMPANY LIMITED GROUP 37,537, % THANACHART CAPITAL PUBLIC COMPANY LIMITED 18,856, % THANACHART LIFE INSURANCE CO.,LTD. 7,684, % THANACHART SECURITIES PUBLIC COMPANY LIMITED 7,560, % THANACHART INSURANCE CO.,LTD. 3,436, % 3. STATE STREET BANK AND TRUST COMPANY FOR AUSTRALIA 6,808, % 4. NORTRUST NOMINEES LTD. 5,686, % 5. MR.YONGSAK KANATHANAVANICH 4,421, % 6. THAI NVDR CO.,LTD 3,965, % 7. DBS BANK A/C DBS NOMINEES-PB Clients 3,598, % 8. AMERICAN INTERNATIONAL ASSURANCE COMPANY, LIMITED-APEX 3,086, % 9. THANACHART EMPLOYEE SAVINGS AND CREDIT COOPERATIVES.,LTD 2,700, % 10. MS. SINEE THIENPRASIDDHI 2,550, % 61
62 Thank You For further enquiries, Contact MBK Investor Relations : inv@mbk-center.co.th Tel : (66 66) Website : 62
MB M K B P ubli l c C o C mp m any y Limi m te t d Ke K y e y P e P r e f r o f r o m r a m n a ce c e 1H H 2011/12 Page 1
 MBK Public Company Limited Key Performance 1H 2011/1212 Page 1 Disclaimer This presentation is made, furnished and distributed for information purposes only. Nothing in this release should be construed
MB M K B P ubli l c C o C mp m any y Limi m te t d Ke K y e y P e P r e f r o f r o m r a m n a ce c e Q /12 Page 1
 MBK Public Company Limited Key Performance Q1 2011/1212 Page 1 Disclaimer This presentation is made, furnished and distributed for information purposes only. Nothing in this release should be construed
MB M K B P ubli l c C o C mp m any y Limi m te t d Ke K y e y P e P r e f r o f r o m r a m n a ce c e FY2010/11 Page 1
 MBK Public Company Limited Key Performance FY2010/1111 Page 1 Disclaimer This presentation is made, furnished and distributed for information purposes only. Nothing in this release should be construed
MBK Public Company Limited Key performance 1H/2015
 MBK Public Company Limited Key performance 1H/2015 1 Disclaimer This presentation is made, furnished and distributed for information purposes only. Nothing in this release should be construed as either
Fourth Quarter and Full Year 2009
 Investor and analyst meeting: Fourth Quarter and Full Year 29 25 th February 21 2 The views expressed here contain some information derived from publicly available sources that have not been independently
SIAM FUTURE DEVELOPMENT PUBLIC CO., LTD. Corporate Presentation Q4-15
 SIAM FUTURE DEVELOPMENT PUBLIC CO., LTD. Corporate Presentation Q4-15 Overview Financial Summary Project Update 2 Overview Founded: 1994 Staff: 80 Centers: 22 Vision Unlike other developers, we create
SET Opportunity Day #3/2011
 SET Opportunity Day #3/2011 2Q11 & 1H11 Performance & Outlook 18 August 2011 The views expressed here contain some information derived from publicly available sources that have not been independently verified.
SIAM FUTURE DEVELOPMENT PUBLIC CO., LTD. Corporate Presentation 2016
 SIAM FUTURE DEVELOPMENT PUBLIC CO., LTD. Corporate Presentation 2016 Overview Financial Summary Project Update 2 Overview Founded: 1994 Staff: 78 Centers: 22 Vision Unlike other developers, we create a
Quarterly Meeting# 4/2018
 Quarterly Meeting# 4/2018 3Q18 & 9M18 Performance & Outlook 14 November 2018 1 2016 ERAWAN. All rights reserved. The views expressed here contain some information derived from publicly available sources
ERW. 022/ ACC003/ th February Subject: Management's Discussion and Analysis period ending 31 st December 2012
 ERW. 022/ ACC003/56 26 th February 2013 Subject: Management's Discussion and Analysis period ending 31 st December 2012 Attention: The President, The Stock Exchange of Thailand Dear Sir, The Erawan Group
ERW. 083/ ACC012/ th November Subject: Management's Discussion and Analysis period ending 30 th September 2012
 ERW. 083/ ACC012/55 12 th November 2012 Subject: Management's Discussion and Analysis period ending 30 th September 2012 Attention: The President, The Stock Exchange of Thailand Dear Sir, The Erawan Group
Investor Meeting Presentation. 4 June 2014
 Investor Meeting Presentation 4 June 2014 COMPANY OVERVIEW 1Q2014 RESULTS OVERVIEW OPERATION HIGHLIGHTS Q&A 2 Founded in 1963, listed on the Singapore Exchange in 1964 Three core businesses: - Property
Quarterly Meeting# 1/2018
 Quarterly Meeting# 1/2018 4Q17 & FY17 Performance & Outlook 2 March 2018 1 2016 ERAWAN. All rights reserved. The views expressed here contain some information derived from publicly available sources that
Quarterly Meeting # 2/2014
 Quarterly Meeting # 2/2014 Performance & Outlook 15 May 2014 The views expressed here contain some information derived from publicly available sources that have not been independently verified. No representation
Minor International Public Company Limited
 Minor International Public Company Limited Management Discussion & Analysis MINT s financial performance as of 30th September 2008 Summary of Key Financial Performance 3Q08 Performance Minor International
Central Plaza Hotel Public Company Limited. OPPORTUNITY DAY: 2Q15, 01 September 2015
 Central Plaza Hotel Public Company Limited OPPORTUNITY DAY: 2Q15, 01 September 2015 Disclaimer This presentation contains certain forward looking statements. Such forward looking statements are not guarantees
Quarterly Meeting# 2/2017
 Quarterly Meeting# 2/2017 1Q17 Performance & Outlook 16 May 2017 1 2017 ERAWAN. All rights reserved. The views expressed here contain some information derived from publicly available sources that have
1Q13 R sults esentation
 1Q13 Results Presentation 14 May 2013 Disclaimer The presentation is dated the day it is given. The delivery of this presentation shall not, under any circumstances, create any implication that there has
Minor International Public Company Limited
 Minor International Public Company Limited Management Discussion & Analysis MINT s financial performance as of 30th June 2008 Summary of Key Financial Performance 2Q08 Performance Minor International Public
PAN PACIFIC HOTELS GROUP LIMITED 2010 FULL YEAR RESULTS BRIEFING 22 FEB 2011
 PAN PACIFIC HOTELS GROUP LIMITED 2010 FULL YEAR RESULTS BRIEFING 22 FEB 2011 2010 RESULTS OVERVIEW STRATEGIC & OPERATIONS HIGHLIGHTS NEO SOON HUP CHIEF FINANCIAL OFFICER 2 CONTENTS Focus and Highlights
Talaat Moustafa Group Holding 1Q08 Results Earnings Release
 Talaat Moustafa Group Holding Results Earnings Release Cairo, April 13 th 08 Talaat Moustafa Group Holding ( TMG Holding ) the leading Egyptian community real estate developer with over years of experience,
BANYAN TREE HOLDINGS LIMITED (Company Registration Number: H) 1H07 Results Snapshot (in S$million) : 2Q07 Results Snapshot (in S$million) :
 1H07 Results Snapshot (in S$million) : 2Q07 Results Snapshot (in S$million) :") BANYAN TREE HOLDINGS LIMITED (Company Registration Number: 200003108H) BANYAN TREE S HALF YEAR PROFITS UP 55% ON 23% REVENUE GAIN. Highlights: - 1H07 Revenue increased by 23% to S$187.9 million - 1H07
BANYAN TREE HOLDINGS LIMITED (Company Registration Number: 200003108H) BANYAN TREE S HALF YEAR PROFITS UP 55% ON 23% REVENUE GAIN. Highlights: - 1H07 Revenue increased by 23% to S$187.9 million - 1H07
Siam Future Development PLC
 Siam Future Development PLC 1 Content Company & Business Overview Project Operations & Development Financial Summary 2 Company & Business Overview 3 Company Overview 1994: Founded by two former Siam Cement
Central Plaza Hotel Public Company Limited - CENTEL. Q4/18 Opportunity Day Presentation
 Central Plaza Hotel Public Company Limited - CENTEL Q4/18 Opportunity Day Presentation Agenda Q4/18 summary performance Hotel business overview Food business overview CAPEX and guidance Appendix Consolidated
Cairo, May 21, TMG Holding reports EGP BN consolidated revenue, EGP 161 MN consolidated net profit
 First Quarter ending Earning Release Cairo, May 21, - reports EGP 1.139 BN consolidated revenue, EGP 161 MN consolidated net profit after minority and EGP 2.2 BN of new sales value for the first quarter
Central Plaza Hotel Pcl. Opportunity Day Presentation 13 June, 2016
 Central Plaza Hotel Pcl. Opportunity Day Presentation 13 June, 2016 1 Disclaimer This presentation contains certain forward looking statements. Such forward looking statements are not guarantees of future
Cairo, November 15, 2016 TMG holding reports EGP 3.9 BN consolidated revenues, EGP 616 MN consolidated net profit
 Nine Months and Third Quarter ending September 30, Earning Release Cairo, November 15, TMG holding reports EGP 3.9 BN consolidated revenues, EGP 616 MN consolidated net profit after minority and EGP 5.5
Cebu Air, Inc. 4 th Quarter and Full Year 2017 Results of Operations. cebupacificair.com
 Cebu Air, Inc. 4 th Quarter and Full Year 2017 Results of Operations cebupacificair.com Disclaimer The information provided in this presentation is provided only for your reference. Such information has
2012 Full Year Results Briefing. 28 February 2013
 2012 Full Year Results Briefing 28 February 2013 1 KEY FINANCIALS & STRATEGY BUSINESS REVIEW OUTLOOK Q&A 2 UOL GROUP LIMITED KEY FINANCIALS & STRATEGY GWEE LIAN KHENG GROUP CHIEF EXECUTIVE 3 S$m FY 2012
Summary of Results for the First Three Quarters FY2015/3
 Summary of Results for the First Three Quarters FY2015/3 February 10, 2015 Tokyu Corporation (9005) http://www.tokyu.co.jp/ Contents Ⅰ.Executive Summary 2 Ⅱ.Conditions in Each Business 5 Ⅲ.Details of Financial
Finnair Group Interim Report 1 January 30 September 2008
 Finnair Group Interim Report 1 January 30 September 2008 1 31/10/2008 Presentation name / Author Airline industry at a historical turning point Expensive fuel price in the beginning of 2008 has dramatical
4Q17 & FY17 Results Briefing
 4Q17 & FY17 Results Briefing 1 Disclaimer This document is provided to you for information only and should not be relied on or used as a basis for making any specific investment, business or commercial
Thank you for participating in the financial results for fiscal 2014.
 Thank you for participating in the financial results for fiscal 2014. ANA HOLDINGS strongly believes that safety is the most important principle of our air transportation business. The expansion of slots
Board of Directors and Management Structure
 COMPANY VISIT 1 Board of s and Management Structure Company Secretary COMPANY S STRUCTURE Board of s Managing Audit Committee Internal Audit* Board of s Position 1. Mr. Premon Pinskul Chairman, ID & AC
Welcome to Opportunity Day Financial Performance Result for the 9 months period ended Sep 30, 2018
 Welcome to Opportunity Day Financial Performance Result for the 9 months period ended Sep 30, 2018 Creating Perfect Cities where Possibilities Happen Disclaimer This document was prepared by Amata Corporation
Performance of Q1/2018
 Performance of Q1/2018 Business Overview FPT BAFS was founded in 1983 by the Cabinet Resolution to provide aircraft refueling system services. The scope of services comprises of : I. Aviation fuel storage
Airports of Thailand Public Company Limited
 Airports of Thailand Public Company Limited (AOT) 2 nd nd Quarter 2006 (January - March 2006) Agenda AOT Business Highlights Air Traffic Statistics Airport Capacity Suvarnabhumi Airport Recent Development
Copa Holdings Reports Net Income of $49.9 million and EPS of $1.18 for the Second Quarter of 2018
 Copa Holdings Reports Net Income of $49.9 million and EPS of $1.18 for the Second Quarter of 2018 Panama City, Panama --- Aug 8, 2018. Copa Holdings, S.A. (NYSE: CPA), today announced financial results
2016 Half-Yearly Results
 Presentation 29th July 2016 2016 Half-Yearly Review Underlying profit down 6% Commercial portfolio benefited from higher occupancy Steady contribution from mainland China residential business Profit attributable
Analyst Presentation Schiphol Group 2006 Interim Financial Results
 Analyst Presentation Schiphol Group 2006 Interim Financial Results 24 August 2006 Interim Results Disclaimer This release may contain certain forward-looking statements with respect to the financial condition,
Mr. Tasara Taksinapan Public Relations Manager Tel: +66 (0) ext Mobile: +66 (0)
 ext Mobile: +66 (0)") Media Contact: Ms. Yingrekha Langulasena Corporate Director New Media & Communications Dusit International Tel: +66 (0) 2200 9999 ext. 3320 Mobile: +66 (0)80 288 8277 Email: yingrekha.lg@dusit.com Mr.
Media Contact: Ms. Yingrekha Langulasena Corporate Director New Media & Communications Dusit International Tel: +66 (0) 2200 9999 ext. 3320 Mobile: +66 (0)80 288 8277 Email: yingrekha.lg@dusit.com Mr.
Performance of Q1 2017
 Performance of Q1 2017 Business Overview FPT BAFS was founded in 1983 by the Cabinet Resolution to provide aircraft refueling system services. The scope of services comprises of : I. Aviation fuel storage
HATTEN LAND LIMITED. Shaping the Future, Melaka and Beyond. FY2017 Results. Corporate Presentation 17 August 2017
 HATTEN LAND LIMITED Shaping the Future, Melaka and Beyond FY2017 Results Corporate Presentation 17 August 2017 Disclaimer Information in this presentation may contain forward-looking statements that reflect
Peppers Docklands, Melbourne
 Peppers Docklands, Melbourne Contents Mantra Group Overview State of Market 8 3 Australian Market Mantra Group 18 24 Mantra Salt, Kingscliff Peppers Noosa, Noosa Mantra Group* CBD - RevPAR (A$) Largest
Finnair Group Annual Report 1 January 31 December 2006
 Finnair Group Annual Report 1 January 31 December 2006 2006: A year for restructuring Scheduled Passenger Traffic transforming to meet Asian traffic demands Labour negotiations to cut 670 jobs 80 million
THAI AIRWAYS INTERNATIONAL Pcl. Fiscal Year 2007
 THAI AIRWAYS INTERNATIONAL Pcl. Fiscal Year 2007 (Oct 06-Sep 07) Relations Department Investor Relations Investor Relations Table of Contents 1. The Company 2. Statistic Information 3. Current Issue 4.
Finnair Group Interim Report 1 January 31 March 2008
 Finnair Group Interim Report 1 January 31 March 2008 1 29/04/2008 Presentation name / Author Outlook for the industry less positive Growth of demand declining due to uncertainty of global economy Growth
Overview. 2Q10 Performance. Minor International Public Company Limited. Favorable Economic Indicators against Lingering Political Dispute
 August 11, 2010 Minor International Public Company Limited M A N A G E M E N T DI DISCUSSION S C U S S I O N A AN N D ANA ANA L Y S I I S Overview Favorable Economic Indicators against Lingering Political
Highlights from the Annual Results December 2007
 Highlights from the Annual Results December 2007 Disclaimer The information in this document is taken from the BAA 2007 Annual Results ( the Results ) which were published on 11 March 2008 and other public
Positive rental reversions in Hong Kong portfolio. Rising contribution from Singapore office portfolio. Strong performance from Residential business
 2012 Review The Group performed well in 2012 Positive rental reversions in Hong Kong portfolio Rising contribution from Singapore office portfolio Strong performance from Residential business 2 Highlights
AerCap Holdings N.V. Keith Helming Chief Financial Officer. Wachovia Securities Equity Conference June 23, 2008
 AerCap Holdings N.V. Keith Helming Chief Financial Officer Wachovia Securities Equity Conference June 23, 2008 Forward Looking Statements & Safe Harbor This presentation contains certain statements, estimates
Sunway berhad. Q Results Briefing Pack. 26 February 2016
 Sunway berhad Q4 2015 Results Briefing Pack 26 February 2016 1 Full Year Profitability Maintained Despite SunCon Dilution 1) Full Year Performance PATMI is maintained at RM732.4 million in 2015 (2014:
Minor International Public Company Limited
 Minor International Public Company Limited Management Discussion & Analysis Financial Performance as of Dec 31 st, 2008 Economic Outlook and Industry Overview In 2008, the impact of the global economic
Disclaimer: The information contained in this presentation is for information purposes only and does not constitute an offer or invitation to sell or
 SPA FY15 SUMMARY Disclaimer: The information contained in this presentation is for information purposes only and does not constitute an offer or invitation to sell or the solicitation of an offer or invitation
PRIMED FOR GROWTH ROXY-PACIFIC HOLDINGS LIMITED. Results Announcement Half Year Ended 30 June st July 2018
 PRIMED FOR GROWTH ROXY-PACIFIC HOLDINGS LIMITED Results Announcement Half Year Ended 30 June 2018 31 st July 2018 Agenda 1 Financial Performance 2 Business Review 3 Group Borrowings 4 Outlook Financial
Forward-Looking Statements Statements in this presentation that are not historical facts are "forward-looking" statements and "safe harbor
 2017 Annual Meeting of Shareholders Presentation May 2017 Forward-Looking Statements Statements in this presentation that are not historical facts are "forward-looking" statements and "safe harbor statements"
Akiş REIT 3Q18 Performance Presentation (Nov 18) Akiş Gayrimenkul Yatırım Ortaklığı A.Ş. Akiş Real Estate Investment Trust 1
 Akiş Gayrimenkul Yatırım Ortaklığı A.Ş. Akiş Real Estate Investment Trust 1") Akiş Gayrimenkul Yatırım Ortaklığı A.Ş. Akiş Real Estate Investment Trust 1 1 Breaking News 2 Breakdown of Portfolio 3 Market & Portfolio Overview 4 Portfolio Performance 5 Planned Projects 6 Financials
Akiş Gayrimenkul Yatırım Ortaklığı A.Ş. Akiş Real Estate Investment Trust 1 1 Breaking News 2 Breakdown of Portfolio 3 Market & Portfolio Overview 4 Portfolio Performance 5 Planned Projects 6 Financials
Hilton Rotterdam Hotel, the Netherlands
 Executive Summary The Group and four other co-investors (the Consortium ) have acquired all of the issued shares in the capital of Hotelmaatschappij Rotterdam B.V. which owns the Hilton Rotterdam Hotel,
ANALYST MEETING 3Q2015
 ANALYST MEETING 3Q2015 November 12, 2015 DISCLAIMER The presentation is dated the day it is given. The delivery of this presentation shall not, under any circumstances, create any implication that there
BANYAN TREE HOLDINGS LIMITED (Company Registration Number: H)
") BANYAN TREE HOLDINGS LIMITED (Company Registration Number: 200003108H) 2 ND QTR RECORDED A SMALLER LOSS OF S7.0 MILLION Highlights: 2Q11: - Revenue increased 3% to S63.6 million; Operating Profit doubled
BANYAN TREE HOLDINGS LIMITED (Company Registration Number: 200003108H) 2 ND QTR RECORDED A SMALLER LOSS OF S7.0 MILLION Highlights: 2Q11: - Revenue increased 3% to S63.6 million; Operating Profit doubled
OPERATING AND FINANCIAL HIGHLIGHTS
 Copa Holdings Reports Financial Results for the Fourth Quarter of 2018 Excluding special items, adjusted net profit came in at $44.0 million, or Adjusted EPS of $1.04 Panama City, Panama --- February 13,
Presentation Results. 4th March 2016
 Presentation 4th March 2016 2015 Review Sound result in 2015 Continued strong performance from commercial portfolio Entry into Shanghai with prime mixed-use site Stable asset values 1 Highlights 2014 2015
Summary of Results for the First Quarter of FY2015/3
 Summary of for the First Quarter of FY2015/3 August 8, 2014 Tokyu Corporation (9005) http://www.tokyu.co.jp/ Contents Ⅰ.Executive Summary 2 Ⅱ.Conditions in Each Business 4 Ⅲ.Details of Financial for the
Opportunity Day Presentation 4Q13/ FY13. Central Plaza Hotel Public Company Limited March 24, 2014
 Opportunity Day Presentation 4Q13/ FY13 Central Plaza Hotel Public Company Limited March 24, 2014 Disclaimer This presentation contains certain forward looking statements. Such forward looking statements
Minor International Public Company Limited
 Minor International Public Company Limited Management Discussion & Analysis Financial Performance as of March 31, 2009 1Q09 Performance Minor International Pcl. ( MINT ) reported 1Q09 performance with
Investor Briefings First-Half FY2016 Financial Results
 Cedar Woods Properties Limited Investor Briefings First-Half FY2016 Financial Results 26 February 2016 Cedar Woods Presentation 2 Snapshot of Achievements in FY2016 Extensive portfolio of residential estates
2017 Half-Yearly Results
 2017 Half-Yearly Results Presentation 4th August 2017 Agenda Speakers: Robert Wong, Chief Executive & Simon Dixon, Chief Financial Officer 1. 2017 Half-Yearly Highlights 2. Investment Properties 3. Development
LVMH reaches an agreement with Belmond to increase its presence in the ultimate hospitality world
 LVMH reaches an agreement with Belmond to increase its presence in the ultimate hospitality world DECEMBER 14, 2018 DISCLAIMER 2 This document may contain certain forward looking statements which are based
Investment Highlights
 Third Quarter 2014 Investment Highlights 1 Mexican airport portfolio positioned to take full advantage of global growth. 2 Diversified business model contributing to earnings resilience. 3 Well-defined
Investor Relations Center, Tel: (662) , Fax (662)
 , Fax (662)") 1 Airports of Thailand Plc. For The fiscal Year 2011 (October 2010 September 2011) Investor Relations Center, E-mail: aotir@airportthai.co.th, Tel: (662) 535-5900, Fax (662) 535-5909 Disclaimer This presentation
1 Airports of Thailand Plc. For The fiscal Year 2011 (October 2010 September 2011) Investor Relations Center, E-mail: aotir@airportthai.co.th, Tel: (662) 535-5900, Fax (662) 535-5909 Disclaimer This presentation
AMATA VN Public Company Limited
 AMATA VN Public Company Limited Welcome to Opportunity Day Financial Results for the period ended December 31, 2017 1 Disclaimer This document was prepared by Amata VN Public Company Limited in good faith
Opportunity Day Presentation 3Q13 Central Plaza Hotel Public Company Limited
 Opportunity Day Presentation 3Q13 Central Plaza Hotel Public Company Limited November 25, 2013 Disclaimer This presentation contains certain forward looking statements. Such forward looking statements
2017 Results. Presentation. 9 March 2018
 2017 Results Presentation 9 March 2018 Agenda Speakers: Robert Wong, Chief Executive & Simon Dixon, Chief Financial Officer 1. 2017 Results Highlights 2. Investment Properties 3. Development Properties
Opportunity Day Presentation 3Q13
 Opportunity Day Presentation 3Q13 Central Plaza Hotel Public Company Limited November 25, 2013 Disclaimer This presentation contains certain forward looking statements. e ts. Such forward looking statements
Press release February 21, 2014
 Press release February 21, 2014 2013 earnings Recurrent ent net income per share up +1.2%, with NAV per share growth of +1.7% Significant improvement in the financial occupancy rate and rental margin Recurrent
Investment Highlights
 Second Quarter 2014 Investment Highlights 1 Mexican airport portfolio positioned to take full advantage of global growth. 2 Diversified business model contributing to earnings resilience. 3 Well-defined
Investor Relations Update January 25, 2018
 General Overview Investor Relations Update Accounting Changes On January 1, 2018, the company adopted two new Accounting Standard Updates: (ASUs): ASU 2014-9: Revenue from Contracts with Customers (the
Q1 Fiscal 2018 Statistics
 Q1 Fiscal 2018 Statistics FedEx Corporation Financial and Operating Statistics First Quarter Fiscal 2018 September 19, 2017 This report is a statistical supplement to FedEx s interim financial reports
Duangiai Kraus Engel & Volkers
 GREATER PHUKET CHAPTER PROPERTY REPORT SOUTH EAST ASIA Duangiai Kraus Engel & Volkers Hua Hin s Property Market 2011 Residential Condominium AMCHAM Property Event Holiday Inn Patong Phuket April 29 th
4Q 2016 BUSINESS PERFORMANCE
 4Q 2016 BUSINESS PERFORMANCE DISCLAIMER This material has been prepared for investors convenience, based on 4Q16 financial statements that have not yet been officially audited, which could alter final
Air China Limited Interim Results. August Under IFRS
 Air China Limited 21 Interim Results Under IFRS August 21 1 Agenda 21 Interim Results Overview Business Overview Financial Overview Outlook 2 2 2 21 Interim Results 3 21 Interim Results Overview 4 4 4
1H2017 Financial Results. 4 August 2017
 1H2017 Financial Results 4 August 2017 COMPANY OVERVIEW 1H2017 RESULTS OVERVIEW OPERATION HIGHLIGHTS 2 Founded in 1963, listed on the Singapore Exchange in 1964 Three core businesses: - Property development
OPERATING AND FINANCIAL HIGHLIGHTS. Subsequent Events
 Copa Holdings Reports Net Income of $103.8 million and EPS of $2.45 for the Third Quarter of 2017 Excluding special items, adjusted net income came in at $100.8 million, or EPS of $2.38 per share Panama
Copa Holdings Reports Net Income of $57.7 million and EPS of $1.36 for the Third Quarter of 2018
 Copa Holdings Reports Net Income of $57.7 million and EPS of $1.36 for the Third Quarter of 2018 November 14, 2018 PANAMA CITY, Nov. 14, 2018 /PRNewswire/ -- Copa Holdings, S.A. (NYSE: CPA), today announced
Copa Holdings Reports Net Income of $136.5 million and EPS of $3.22 for the First Quarter of 2018
 Copa Holdings Reports Net Income of $136.5 million and EPS of $3.22 for the First Quarter of 2018 May 9, 2018 PANAMA CITY, May 9, 2018 /PRNewswire/ -- Copa Holdings, S.A. (NYSE: CPA), today announced financial
Company Report May 6, 2014 BUY CENTARA HOTELS PCL (CENTEL) Recovery play
 Recovery play") Jan-12 Apr-12 Jul-12 Oct-12 Jan-13 Apr-13 Jul-13 Oct-13 Jan-14 Apr-14 Jul-14 Oct-14 Company Report CENTARA HOTELS PCL (CENTEL) Recovery play We initiate the coverage of CENTEL with a LONG-TERM BUY recommendation.
Jan-12 Apr-12 Jul-12 Oct-12 Jan-13 Apr-13 Jul-13 Oct-13 Jan-14 Apr-14 Jul-14 Oct-14 Company Report CENTARA HOTELS PCL (CENTEL) Recovery play We initiate the coverage of CENTEL with a LONG-TERM BUY recommendation.
1HFY2012 RESULTS PRESENTATION
 1HFY2012 RESULTS PRESENTATION 21st February 2012 AWARD WINNING PROPERTY DEVELOPER Listed 1994, consistently profitable, always paid dividends Strategically located and diverse residential portfolio Urban
1 st ANNUAL GENERAL MEETING. 28 th SEPTEMBER 2017
 KIP Real Estate Investment Trust 1 st ANNUAL GENERAL MEETING 28 th SEPTEMBER 2017 CORPORATE MILESTONE Commencement of operations at KiP Mart Tampoi, Johor Bahru with total lettable area of 137,474 sq feet
Investor Relations Update October 25, 2018
 General Overview Investor Relations Update Revenue The company expects its fourth quarter total revenue per available seat mile (TRASM) to be up approximately 1.5 to 3.5 percent year-over-year. Fuel Based
Presentation to Investors 8 December 2017
 Table of Contents The Philippine Economy Corporate structure Description of Businesses: - Real estate Metro Manila Tagaytay Highlands / Midlands Land held for development - APC Group, Inc. - Gaming: Premium
Analyst and Investor Conference Call Q Ulrik Svensson, CFO and Member of the Executive Board
 Analyst and Investor Conference Call Q2 2017 Ulrik Svensson, CFO and Member of the Executive Board Frankfurt, 2 August 2017 Disclaimer The information herein is based on publicly available information.
Financial Results 1 st Quarter Mar/2016 (FY2015) 30 July, 2015
 30 July, 2015") Financial Results Mar/2016 (FY2015) 30 July, 2015 Today s Topics P.2 P.3 P.15 1 Overview of FY Mar/2016 Financial Results Operating Revenue Operating Profit 320 307.0 +4.9Bn (+1.6%) 312.0 50 +17.6Bn (+94.6%)
Financial Results Mar/2016 (FY2015) 30 July, 2015 Today s Topics P.2 P.3 P.15 1 Overview of FY Mar/2016 Financial Results Operating Revenue Operating Profit 320 307.0 +4.9Bn (+1.6%) 312.0 50 +17.6Bn (+94.6%)
M ANAGEMENT D ISCUSSION AND A NALYSIS
 Thursday, 25 February 2010 Minor International Public Company Limited M ANAGEMENT D ISCUSSION AND A NALYSIS Overview Recovery Begins in 4Q09 Having been negatively affected by financial and political uncertainty
THAI AIRWAYS INTERNATIONAL PCL
 THAI AIRWAYS INTERNATIONAL PCL PHATRA SECURITIES PCL Thai Tourism Day July 4, 2013 1 http://www.thaiairways.com/about-thai/investor-relations/en/investor.html DISCLAIMER The information contained herein
Preliminary Figures FY 2016
 February 14, 2017 Preliminary Figures FY 2016 Capital Markets Day 2017 Tom Blades (CEO) Disclaimer This presentation has been produced for support of oral information purposes only and contains forwardlooking
S$ million 2Q2012 2Q2011 Change 1H2012 1H2011 Change Revenue % % Gross Profit % % Gross Profit Margin
 Roxy-Pacific Holdings Limited NEWS RELEASE ROXY-PACIFIC ACHIEVES 8% INCREASE IN NET PROFIT TO S$17.7 MILLION IN 2Q2012 - Revenue rises 13% to S$52.7 million - 18% surge in revenue from Property Development
2010 Full Year Results Briefing. 22 February 2011
 2010 Full Year Results Briefing 22 February 2011 1 2010 IN SUMMARY RESULTS OVERVIEW PERFORMANCE REVIEW GOING FORWARD Q&A 2 UOL GROUP LIMITED 2010 IN SUMMARY RESULTS OVERVIEW GWEE LIAN KHENG GROUP CHIEF
Centurion Corporation Limited
 Centurion Corporation Limited Corporate Presentation 6 January 2014 Disclaimer This presentation and the accompanying presentation materials (if any) ("Presentation") are made for informational purposes,
Investor Relations Department
 THAI AIRWAYS INTERNATIONAL Plc. (Year 2008) 1 Table of Contents 1. The Company 2. Statistical Information 3. Tentative Aircraft Delivery 4. Financial Performance 5. Going Forward 2 1. The Company 3 The
The participation in the acquisition by CDL and Tai Tak together with the Group is an endorsement of the Group s expansion plan.
 Executive Summary The Group, in partnership with its two key shareholders, City Developments Limited ( CDL ) and Tai Tak Estates Sendirian Berhad ( Tai Tak ), has through a joint venture partnership on