CHAPTER 4 GROWTH DYNAMICS IN CHENNAI METROPOLITAN AREA
|
|
|
- Leonard Morton
- 5 years ago
- Views:
Transcription
1 107 CHAPTER 4 GROWTH DYNAMICS IN CHENNAI METROPOLITAN AREA 4.1 INTRODUCTION Chennai Metropolitan Area has experienced over 7% decadal increase in the population growth rate during During the same decade, the rest of CMA area has experienced about 22 % increase in the population growth rate. The factual details of the CMA like population, land use, physical constraints and plans and policies during are dealt in the previous chapter. The detailed analysis of population growth and land use change in CMA since 1971 is carried out in the present chapter. The emergence of villages with population growth during different decades and the reasons behind the growth dynamics are dealt with. This chapter gives an insight on the trend of urban growth and identifies the variables which have highly influenced in shaping the growth of CMA Decadal Growth Rate of Population The rate of growth of decadal population over the past four decades from followed a decreasing trend in the State, Chennai City, CUA and CMA as well as evident from Table 3.2 in the previous chapter. This trend did not continue into rate of growth of population. During this decade, there is a considerable increase of 3.88 %, %,
2 % and 22.91% in case of the State, CUA, CMA and rest of CMA respectively (Directorate of Census Operations, Tamil Nadu 2011). At this juncture it is significant to mention that Tamil Nadu State along with Chattisgarh and Puducherry alone have shown increasing decadal growth rates during Figure 4.1 gives a comparative line chart of the decadal population growth rates. Figure 4.1 Decadal growth rate of population of Tamil Nadu, Chennai city, CUA, CMA and rest of CMA during the year Source: Constructed using Census of Tamil Nadu ( ), Second Master Plan for CMA-2026 (2008) and websites < >[ ] and < pdf> [ ]. Based on decadal population growth rate, the villages in CMA are broadly categorized as high growth, medium growth, low growth and decreasing growth settlements during the years and (Table 4.1). The proportion of each of the categories in CMA is represented in Figure 4.2. The distributions of the villages in CMA based on decadal rate of population growth during the above two decades are shown in Figure 4.3 and Figure 4.4. Some of the prominent villages under each of the categories are
3 109 listed out in Table 4.3. The high growth rate and medium growth rate settlements during the year constitute 43% of the CMA. 36% of the settlements are experiencing low growth rate. During , the high growth settlements have increased by 25%. The medium, low and decreasing growth settlements have decreased by 5%, 10% and 12% respectively. The high and medium growth settlements, i.e., settlements with more than 20% decadal population growth rate, constitute 63% of the CMA. Table 4.1 Categorization of villages in CMA based on decadal population growth rate during the year Category of villages based on decadal population growth High growth Decadal population growth rate Number of villages under each category during * >100 % >50 % 27 (21%) 58 (46%) Medium growth >20 % to <50 % 54 (22%) 41(17%) Low growth >0-20 % 91 (36%) 63 (26%) Decreasing growth <0 % 52 (21%) 22 (09%) Source:Constructed using Census of Tamil Nadu, 1991, 2001 & (* excluding St.Thomas Mt & Pallavaram Contonments) High growth rate of population 21% of the villages have experienced high growth rates of population during Out of the 52 villages in this category, only 10 of them lie on the northern part of CMA, i.e., on the northern side of Chennai- Arakonam Railway Line. On the southern part of CMA, villages along major transportation corridors viz., Old Mahabalipuram Road (OMR), East Coast Road (ECR), Velachery Main Road, Grand Southern Trunk Road (GST Road - NH45), Poonamallee Bye Pass Road and Poonamallee High Road or Grand
 1991-2001 & (b) 2001-2011 Source: Compiled from Census of")
4 110 Western Trunk (GWT - NH 4) Road have exhibited high growth rate of population during (a) (b) Figure 4.2 Proportion of villages in CMA under each category of decadal population growth during the year (a) & (b) Source: Compiled from Census of Tamil Nadu 2001 and 2011.
5 111 During , 46% of the settlements fall under this category. Similar to the earlier decade, the concentration of this category of settlements is seen in the western and southern parts of CMA than in the northern CMA (Figure 4.4). Many settlements continue to be present in this category since earlier decade. The settlements along the IT corridor, GWT Road and CTH Road have experienced high growth rates. One of the case study areas, namely Sholinganallur, selected from the high growth category continues to be in the same category, with higher growth rate of % (Table 4.2) Medium growth rate of population In CMA, 22% of the villages have exhibited medium growth rates during The villages present immediately along the Chennai City boundary on the northern and central CMA and those along major transportation corridors on southern side fall under this category. During , many new additions from the low growth category find place in the medium growth category. Settlements along GST Road, CTH Road and parts of northern CMA fall under this category. The percentage of settlements under this category has reduced to 17% against 22% during One of the case study areas in the western CMA, namely Thirumazhisai has moved from the low growth category (12.0%) to the medium growth category (21.1%) during this decade.
6 112 Figure 4.3 Decadal growth rate of population in CMA during the year Source: Census of Tamil Nadu 1991 and 2001.
7 113 Figure 4.4 Decadal growth rate of population in CMA during the year Source: Census of Tamil Nadu 2001 and 2011.
8 114 Table 4.2 Decadal population growth rate of some of the villages in CMA during & High Growth Rate Medium Growth Rate Low Growth Rate Village % Village % Village % Pallikkaranai Porur 48.3 Thirumudivakkam 17.8 Vengaivasal Varadharajapuram 47.5 Kottivakkam 17.1 Okkiamthorapakkam Karapakkam 46.7 Padianallur 16.3 Nandambakkam Karanodai 45.5 Nemam 15.7 Perungudi Kathirvedu 43.4 Chinnasekkadu 15.6 Nolambur Jalladianpet 43.0 Thirumazhisai 12.0 Neelankarai Karambakkam 42.8 Pakkam 11.9 Manapakkam Adayalampattu 42.1 Palanthandalam 10.9 Vanagaram 96.8 Nedungundram 39.2 Nazarathpettai 8.0 Injambakkam 96.4 Vandalur 38.5 Thiruneermalai 7.2 Mugalivakkam 95.8 Madipakkam 35.9 Tirusulam 7.2 Sholinganallur 82.5 Puzhal 30.1 Perungalathur 74.4 Sholavaram 29.3 Peerkankaranai 63.1 Thandalam 29.2 Athipattu 62.3 Madanandapuram 22.3 Chitalapakkam 59.2 Minjur 21.8 Thiruninravur 51.9 Mangadu Semmancheri Ambattur 49.9 Minjur 19.4 Mathur Chitlapakkam 49.7 Thiruvottiyur 17.5 Ayyappanthangal Pallavaram 49.0 Naravarikuppam 14.3 Medavakkam Polichalur 48.4 Padianallur 13.8 Okkiamthorapakkam Kottivakkam 45.6 Alandur 12.4 Nolambur Karambakkam 43.0 Kathivakkam 12.4 Mudichur Sholavaram 39.0 Adayalampattu 8.0 Karapakkam Thirumudivakkam 34.9 St.Thomas Mount 3.9 Sholinganallur Athipattu 29.6 Vanagaram Alamathi 27.7 Kundrathur Kuthambakkam 27.7 Sembakkam Chinnasekkadu 27.3 Injambakkam Tambaram 26.7 Thiruverkadu Thiruninravur 26.5 Pakkam 98.9 Karanodai 26.3 Maduravoyal 97.7 Vandalur 26.0 Puzhal 53.4 Manali 23.3 Anakaputhur 50.5 Thirumazhisai 21.1 Source: Constructed based on Census of Tamil Nadu 2001 & 2011.
9 Low growth rate of population During , 91 villages have shown a decadal population growth of less than or equal to 20% accounting for 36% of villages in CMA and these villages are spread along the outer boundary of the CMA area. During , there is a 10% decrease of settlements under this category. Most of these villages in this category lie on the northern part of CMA. The case study area, Minjur had slid down from medium growth category (21.8%) to low growth category (19.4%) by a marginal difference of 2.4% Decreasing growth rate of population 21% villages in CMA show a negative growth in population, the decrease ranging from 0% to -100% during These villages are equally distributed throughout northern and southern CMA, mostly along the periphery of CMA boundary. This category has witnessed a 12% decrease of number of settlements with a decreasing growth rate of population during They are present sparsely in CMA Population Density As it is seen from Table 3.2, the density in the CMA and the rest of CMA were as less as 59 persons per hectare (5900 persons per sq.km) and 27 persons per hectare (2700 persons per sq.km.) respectively during During 2011, the density of CMA has risen to 75 persons per hectare and that of the rest of CMA has risen to 42 persons per hectare which indicates huge scope for accommodating higher population density as against the already denser Chennai city. The density of Chennai City has grown from 247 persons per hectare during 2001 to 264 persons per hectare in Based on the density of population, the villages in the rest of CMA area, i.e., excluding the Chennai city are categorised as extremely dense, very
10 116 high dense, high dense, medium dense, low dense and very low dense (Table 4.3). The distribution of villages under different categories at each time period is depicted in the graph in Figure 4.5. The population density during the year 2011 in the villages in CMA is shown in Figure 4.6. Table 4.3 Categorization of villages in CMA based on population density during the year Categorization of villages based on population density Density of population (persons per sq.km.) Number of villages under each category during the year Extremely dense > Very high dense High dense Medium dense Low dense Very less dense Source: Constructed using Census of Tamil Nadu (2001 & 2011) and Second Master Plan for Chennai Metropolitan Development Area (2008) YEAR Extremely dense Very high dense High dense Medium dense Low dense Very less dense Figure 4.5 Graph showing distribution of villages in CMA based on population density during Source: Constructed using Census of Tamil Nadu (2001 & 2011) and Second Master Plan for Chennai Metropolitan Area (2008).
11 117 Figure 4.6 Distribution of villages in CMA based on population density during 2011 Source: Census of Tamil Nadu The number of villages with a density of more than 5000 persons per square kilometer has increased from 1 during 1971 to 30 during 2001 and 55 during During 2011, the villages with extremely high population density over 5000 persons per square kilometer are present abutting the Chennai city and along Thiruvottiyur High Road, GNT road on the northern
12 118 side of CMA, CTH Road and GWT Road on the western side, GST Road and East Coast Road on the southern side of CMA. Followed by the villages under extremely dense category, very high dense and high dense categories of villages are present. Most of the villages in the periphery of CMA fall under the low dense and very low dense category. The case study area Minjur falls under the high density category and the case study areas Sholinganallur and Thirumazhisai fall under the medium density category Inference from Demographic Analysis The detailed analysis of the demographic characteristics viz., population size, decadal population growth rate, population density and the emergence of villages at different points of time based on population size reveal the following: (i) Villages along the boundary of the city and major transportation corridors viz., Thiruvottiyur High Road, GNT Road, CTH Road and GST Road had picked up growth as early as 1971 following a circular and a radial cum half-circle pattern of development. They also remain as the extremely dense or very high dense settlements since (ii) Unlike other transportation corridors, villages along GWT Road, ECR and OMR have picked up growth only in 1991 and In fact the entire southern part of CMA along OMR and ECR has emerged only during (iii) Villages emerged during are experiencing low to medium growth rates.
13 EMERGENCE OF VILLAGES AT DIFFERENT POINTS OF TIME The Census of India uses population size of more than 5000 as one of the criteria to determine an area as an urban area. Analyzing the urbanization trend in CMA constituting 250 villages with a criterion of population size exceeding 5000 would be too ambiguous and distinct observations could not be made. In this research, in order to understand the pattern of urbanization that took place in CMA at different decades since the year 1971, a yard stick in the form of population size over 10,000 has been fixed. A total of 15 villages in CMA had population more than 10,000 during the year 1971; the most populous among them was Thiruvottiyur Municipality with a population of over 82,000. Nine other villages emerged, each of them crossing a population of 10,000 during the year 1981 with Thiruvottiyur Municipality upholding the position with a population over 134,000. However Ambattur Municipality emerged as the most populous one during the year 1991 and 2001 with a population of about 215,000 and 311,000 respectively. Sixteen villages emerged during 1991 and three more villages emerged during 2001 with a population of over 10,000. Table 4.4 indicates the emergence of villages along the different transportation corridors during Figure 4.7 shows the emergence of villages from 1971 to It is interesting to note that the villages present immediately abutting the city boundary viz., Thiruvottiyur, Madhavaram, Ambattur, Valasaravakkam, St. Thomas Mount Contonement and Alandur had picked up developments as early as Also, these villages lie along the major transportation corridors viz., Thiruvottiyur High Road, GNT Road, CTH Road and GST Road and picked up growth during 1971 following a circular and a finger type pattern of development. They also remain as the
14 120 extremely dense or very high dense settlements since Ullagaram Puzhuthivakkam had shown emergence during Nerkundram, Ramapuram, Manapakkam, Kottivakkam and Palavakkam had emerged during Unlike other transportation corridors, villages along GWT Road, ECR and OMR have picked up growth only in 1991 and In fact the entire southern part of CMA along OMR and ECR has emerged only during During 2001, the villages along Old Mahabalipuram Road viz., Perungudi, Okkiyamthorapakkam, Sholinganallur and those along East Coast Road viz., Neelankarai and Injambakkam had emerged in a contiguous fashion. Only one village in the northern part of CMA, namely, Vallur along Thiruvottiyur Ponneri Panchetty Road (TPP Road) had emerged with a population crossing 10,000 during the year However the developments did not happen contiguously over the successive decades in the villages along these corridors. This kind of non-contiguous development is a resultant of the growth dynamics that is due to varying combinations of different factors influencing development, in each of those villages. Therefore it is imperative to identify the factors responsible for the growth dynamics and to understand their complex combinations which influence the growth of each of the villages.
15 121
16 122


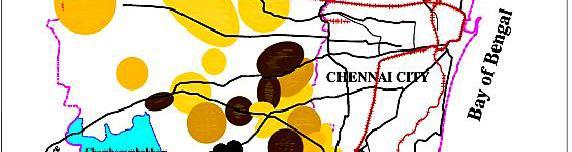
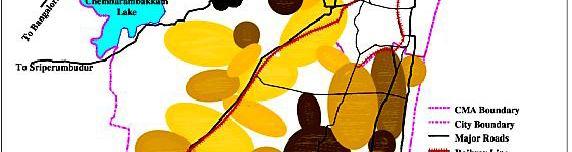
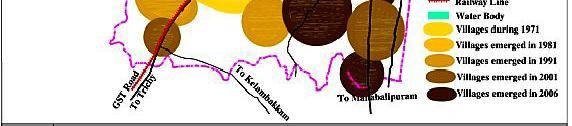
17 123 Figure 4.7 Emergence of villages in Chennai Metropolitan Area during Source: Kanchanamala & Sekar 2011
18 REASONS FOR EMERGENCE OF VILLAGES WITH POPULATION GROWTH i. The elaborate discussion on the population aspect has already revealed that the population growth and population density are on the higher side along the transportation corridors, i.e., wherever there was good accessibility to transportation network. ii. During , villages immediately along the boundary of the Chennai city grew mainly because of the spillover of the urban activities with the annexure of the villages Kanagam, Tharamani, Thiruvanmiyur, Velacheri, Kodambakkam (part), Virugambakkam, Saligramam, Koyambedu, Thirumangalam, Villivakkam, Erukkancheri, Kolathur and Kodungaiyur with the city during the year 1977 and the impetus created in the neighbouring villages. iii. Pallavaram and Tambaram villages, quite far away from the city boundary had also shown development as early as 1971 in a non-contiguous fashion along the GST Road and the southern line of Chennai sub-urban Railway. Electrical, leather, timber, cosmetics and pharmaceutical industries, educational institutions, access to road and rail network were the locational advantages of Pallavaram. Similarly, Sub-urban Railway terminal, residential quarters, educational institutions such as Madras Christian College and Air Force Station were present in Tambaram. iv. Areas close to industries, industrial estates had recorded early population growth. Industries such as Carborundum Universal Ltd, WIMCO Match Factory, ITC Ltd., Enfield, MRF, KCP
19 125 India Ltd., were present in Thiruvottiyur village in the northern CMA which picked up growth in Similarly, Kathivakkam village in northern CMA emerged in the year 1971 after the commissioning of the Ennore Thermal Power Station in the year 1970 with residential quarters for the employees. v. The Ambattur Industrial Estate commissioned in the year 1964 hosts major Companies like Britannia, TI Cycles of India, Dunlop, and TVS. Textile industries such as Ambattur Clothing Limited and Bombay Fashions are located in this estate. The Heavy Vehicles Factory, which manufactures military tanks, is 5 km from this place, in Avadi Municipality. Both Ambattur and Avadi located along the CTH Road quite away from the city boundary but housed with industries had emerged during At the same time, Korattur and Padi villages lying close to the city boundary just along the city boundary continued with agriculture activities and they lacked internal roads and land for development. These villages had picked up development with industries and residences only during 1981 after the extension of Chennai city limit. vi. After Thiruvottiyur and Kathivakkam which were in emergence in 1971, Minjur in the extreme end along these corridors emerged in the year 1981 leaving behind villages such as Manali, Vaikkadu, Kadapakkam, Vellivoyal, Vallur, Ennore, Athipattu and Nandiyambakkam. All these villages lacked good accessibility to road network. Manali remains an industrial village and it picked up development only during 1991 after the development of Inner Ring Road. Buckingham canal, Ennore Creek and Kosathalaiar River were constraints
20 126 on development in this stretch as there were no connectivity by bridges/culverts and so they lack transportation facilities. Also there were agricultural activities as well as salt pans which prevented new developments. However, Minjur present after these villages possessed facilities such as high schools, health centre, banks, connectivity to the neighbouring places, veterinary hospital, Block Development Office and theatres which helped in the emergence of the village in the year vii. Vallur village present even before Minjur village along TPP Road had emerged only in the year 2001 after the commissioning of the North Chennai Thermal Power Station in the year 1994, widening of the TPP Road and Athipattu Main Road and the commencement of Ennore Port works. viii. Over 70 % of the villages crossing the mark of population more than 10,000 emerged during 2001 and Among these villages Mathur and Chinnasekkadu villages lie in the northern CMA along IRR. CMDA and Tamil Nadu Housing Board had implemented housing schemes in Mathur. The villages along OMR, ECR, Velachery Tambaram Road, Medavakkam Sholinganallur Road and Pallavaram- Thorapakkam Road (MMRD Road). The development of IT corridor, the boom in the IT industry, and improvements to the major roads like Velachery Tambaram Road, Medavakkam Sholinganallur Road, Pallavaram-Thorapakkam Road and Poonamallee Bye Pass Road took place during this period. These activities have led to the growth of even the farthest villages in CMA like Semmencheri. ix. Availability of approved residential plots for development during , was about 1461 Hectare in CMA (CMDA,
21 ). These plots, approved by CMDA, were mainly distributed in the western and southern CMA. Similarly, during about 1393 Hectare of residential plots were approved by CMDA (< [ ]). In both the above time periods, the plots were distributed in most of the villages in the southern CMA and about 75% of the villages in western CMA. In northern CMA approved layouts are present only along the transportation corridors. x. More industries are present in northern and western CMA which are of special and hazardous nature creating pollution in these areas (Second Master Plan for CMA, 2008). In contrast, number of buildings for Information Technology (IT) and Information Technology Enabled Services (ITES), have come in the southern CMA, mainly along the OMR IT corridor (Rajiv Gandhi Salai). Further many of the industries in Ambattur and Guindy Industrial Estates are undergoing transformation into IT and ITES offices inviting more developments in the western part of CMA. xi. During , in tune with the IT & ITES development, large scale residential developments are coming up in the western and southern CMA even in places where there are lack of transportation and other infrastructure facilities. These developments are most sought after for the purpose of investment and rental income. The reasons for the emergence of villages in CMA listed above are summarized in Table 4.5.
22 128
23 129
24 SUMMARY From the analysis of growth trend, it is observed that during , Chennai city has experienced a decreasing trend in the growth rate of population whereas the State, CUA, CMA and rest of CMA have experienced an increasing trend in the growth rate of population. Therefore this exercise has assisted in understanding the growth trend of the CMA and the reasons behind such trend and has given an indication on the possible future trend so that the planning process for future development could take off in the right direction. The factors which influence urban land use change in different urban areas are already studied and synthesized in Chapter 2. The analysis on the emergence of villages in CMA with a population crossing 10,000 during the decades has shown that the growth has taken place mainly along the transportation corridors, where industries, institutions and other work places are present. Further, the agricultural lands along the transportation corridors had transformed to urban areas as evident from the land use maps given in the previous chapter. The villages in which development / improvement projects are implemented have also shown substantial growth. On the other hand, the villages with physical constraints have not shown significant growth. It is therefore evident that the factors such as accessibility to transportation corridors, proximity to work places, availability of land for development, physical constraints for development, plans and policies of the Government and private agencies have played a significant role in shaping the land use of CMA. The analysis of emergence of villages during different periods of time and the study of land use changes in CMA have thus given a clear understanding on the key factors or the variables, which have highly influenced the population growth. The actual
25 131 selection of variables which play key role in bringing out the land use change in CMA is carried out in Chapter 5. The classification of villages based on the growth rate of population during has helped in selection of three case study areas. Totally three case study areas, one each representing the categories of high growth, medium growth and low growth have been selected to represent the entire CMA for simulation of land use changes, which is dealt in Chapter 6. The CA based model for simulation of land use changes is applied for these three case study areas for paucity of time. However, as the model has been validated for all the three categories of case study areas, it is only time and resource to be spent adopting the very same methodology of this thesis for simulation of land use changes for the city and CMA as a whole.
Connectivity continues to remain one of the biggest concerns for north Chennai residents with thousands of commuters struggling every day
 Employment North Chennai is primarily an industrial area and is governed by business and trader community, locomotive workshops, government offices and port related activities. Chennai Port and Ennore
CHENNAI INSTITUE OF TECHNOLOGY Transport Department Bus Routes
 Route: 1 Thiruvottiyur 1 Thiruvottiur (Ajax) 5.50 2 Toll Gate 5.57 3 Tondiarpet-Apollo 6.02 4 Kasimedu 6.05 5 Parrys corner 6.10 6 Chintatiripet 6.18 7 Egmore 6.20 8 KMC 6.25 9 Amanjikarai 6.30 10 Anna
CHENNAI INSTITUE OF TECHNOLOGY Transport Department Bus Route THIRUVOTTIYUR
 Route: 1 THIRUVOTTIYUR 1 Thiruvottiur (Ajax) 5.50 2 Toll Gate 5.57 3 Tondiarpet-Apollo 6.02 4 Maharani 6.05 5 Mint 6.10 6 Beach Station 6.15 7 Simpson 6.18 8 Pudhupet 6.20 9 Egmore 6.22 10 KMC 6.25 11
DETAILS OF FILLING STATIONS. 1 I Neithal Nagar Neithal Nagar 3 P.Vijayanirmala
 Sl. Area Filling Point Address of 1 I Neithal Nagar Neithal Nagar 3 P.Vijayanirmala 8144930836 2 I Ramasamy Nagar HW Ramasamy Nagar HW 2 P.Vijayanirmala 8144930836 3 I Ernavoor Kathivakkam High Road 2
QuikrHomes December Chennai Realty Cityscape.
 QuikrHomes December- 2016 Chennai Realty Cityscape http://www.quikr.com/homes Executive Summary Chennai, generally known as the Gateway to southern India, is well known for its temples, port centric business,
Singapore Styled Condominium. With Suspended Plunge Pool on the Terrace For the first time in India
 Singapore Styled Condominium With Suspended Plunge Pool on the Terrace For the first time in India " The air up there in the clouds is very pure and fine, bracing and delicious. And why shouldn't it be?
Route Map. Contact for any Queries: PROGRAM ORGANIZERS: Dr.S.Soundararajan, Mr.L.K.Vijaybharath FOR HOSTEL ACCOMMODATION:
 Contact for any Queries: PROGRAM ORGANIZERS: Dr.S.Soundararajan, 9841355782 Mr.L.K.Vijaybharath 9841027588 FOR HOSTEL ACCOMMODATION: Mr.Elangovan 7904994756 Ms.Sivagami 9710899698 FOR TRANSPORT (Both College
New Growth Centre in South Chennai
 Colliers Radar Chennai Office 28 11 2017 New Growth Centre in South Chennai Pallavaram Thoraipakkam Road All Set for Real Estate Race in Chennai Surabhi Arora Senior Associate Director Research India surabhi.arora@colliers.com
Chennai: From Resilience to Growth
 Chennai: From Resilience to Growth Real estate growth led by Infrastructure, Investments and Industries February 2019 In Association with 2 3 Table of contents 04 06 10 Foreword Chennai: An Overview Chennai:
ADYAR: Areas covered by this Dispensary are as follows:
 ADYAR: On the north starting from the junction of Adyar river and Gandhi Mandapam proceed east along the river up the its junction with Sea coast proceed south along the sea coast up to its junction with
LEGAL OPINIONS FOR TITLE CLEARANCE Sl.No. Property Type Extent Village /Taluk Customer type
 LEGAL OPINIONS FOR TITLE CLEARANCE Sl.No. Property Type Extent Village / Customer type 1 Agricultural land 359.65 Acres Govindaperi Ambasamudram 2 Agricultural land 22.71 Acres + 2.47 5 Acres + 21.215
VELAMMAL INSTITUTE OF TECHNOLOGY BUS ROUTES
 VELAMMAL INSTITUTE OF TECHNOLOGY BUS ROUTES - 2015-2016 :1 Tambaram 6.00 : 2 Keelkattalai 6.00 :3 Kottivakkam 6.00 Sl.no. Boarding Point a.m Sl.no. Boarding Point a.m Sl.no. Boarding Point a.m 1 Tambaram
Dr. Dimitris P. Drakoulis THE REGIONAL ORGANIZATION OF THE EASTERN ROMAN EMPIRE IN THE EARLY BYZANTINE PERIOD (4TH-6TH CENTURY A.D.
 Dr. Dimitris P. Drakoulis THE REGIONAL ORGANIZATION OF THE EASTERN ROMAN EMPIRE IN THE EARLY BYZANTINE PERIOD (4TH-6TH CENTURY A.D.) ENGLISH SUMMARY The purpose of this doctoral dissertation is to contribute
*******************************************************************
 ADYAR:- On the north starting from the junction of Adyar river and Gandhi Mandapam proceed east along the river up the its junction with Sea coast proceed south along the sea coast up to its junction with
All SCHOOLS VELAMMAL GROUP OF KINDERGARTEN SCHOOLS CHENNAI V KIDS A CONCEPT SCHOOL VKIDS -NURSERY & PRIMARY SCHOOL. 8/16 Bharathi Salai,
 All SCHOOLS VELAMMAL GROUP OF KINDERGARTEN SCHOOLS CHENNAI V KIDS A CONCEPT SCHOOL 8/16 Bharathi Salai, Mugappair West, Chennai 600037 Ph : 044-60505777 / 26534634 http://www.velammaltrust.com/kinderschool_vkids.html
Figure 1.1 St. John s Location. 2.0 Overview/Structure
 St. John s Region 1.0 Introduction Newfoundland and Labrador s most dominant service centre, St. John s (population = 100,645) is also the province s capital and largest community (Government of Newfoundland
PREFACE. Service frequency; Hours of service; Service coverage; Passenger loading; Reliability, and Transit vs. auto travel time.
 PREFACE The Florida Department of Transportation (FDOT) has embarked upon a statewide evaluation of transit system performance. The outcome of this evaluation is a benchmark of transit performance that
2. Introduction to Kurunegala Area : 2.1 Location and History : 2.2 Regional Aspects :
 2. Introduction to Kurunegala Area : 2.1 Location and History : Kurunegala town is the capital of Kurunegala district as well as the capital of North Western Province (Fig 2.1). It has been administered
SAMTRANS TITLE VI STANDARDS AND POLICIES
 SAMTRANS TITLE VI STANDARDS AND POLICIES Adopted March 13, 2013 Federal Title VI requirements of the Civil Rights Act of 1964 were recently updated by the Federal Transit Administration (FTA) and now require
Australian Journal of Basic and Applied Sciences. Why to Introduce Flat Fare System in Janmarg, Ahmedabad, Gujarat A Case Study
 AENSI Journals Australian Journal of Basic and Applied Sciences ISSN:1991-8178 Journal home page: www.ajbasweb.com Why to Introduce Flat Fare System in Janmarg, Ahmedabad, Gujarat A Case Study 1 Jaynila
CHENNAI REAL ESTATE MARKET
 SALES KIT CHENNAI REAL ESTATE MARKET Chennai is a flourishing market for real estate. It has witnessed massive growth and city expansion in a very short period. And the very important aspect of Chennai
Percentage Share Total Workers Main Workers 29.5 Marginal Workers 2.22 Non-Workers Source: Census of India, 2001.
 4.0 LOCAL ECONOMY 4.1 WORKFORCE Working population of Udaipur comprises about 32% of total population (UMC) of city, of this 93% population constitutes main workers whereas rest 7% fall under marginal
Provincial Review 2016: KwaZulu-Natal KwaZulu-Natal
 Provincial Review 2016: KwaZulu-Natal KwaZulu-Natal KwaZulu-Natal has a strong role in South Africa s manufacturing and agriculture, and has its largest port and main North-South freight corridor. Its
0CTOBER 2009 CHENNAI A GROWING OPPORTUNITY IN RESIDENTIAL REAL ESTATE
 0CTOBER 2009 CHENNAI A GROWING OPPORTUNITY IN RESIDENTIAL REAL ESTATE 1 THE GATEWAY TO SOUTH INDIA... 2 3 Chennai, the commercial and cultural capital of South India, has managed to retain its traditional
COUNTRY CASE STUDIES: OVERVIEW
 APPENDIX C: COUNTRY CASE STUDIES: OVERVIEW The countries selected as cases for this evaluation include some of the Bank Group s oldest (Brazil and India) and largest clients in terms of both territory
Alternatives Study of Alignment
 Project: 4-lanning of Barhi Rajauli Section of NH-31 Sheet: 1 of 6 Alternatives Study of Alignment 1 Objectives The following objectives were kept in view while locating the alternative bypass alignments:
Workplace Population: Key Facts
 : Key Facts May 2014 Introduction Friday 23 rd May saw release 5.2 of 2011 Census data. Included in this release were the first statistics on the workplace population and the first data provided at the
East West Rail Consortium
 East West Rail Consortium EWR Wider Economic Case: Refresh 18 th November 2015 Rupert Dyer Rail Expertise Ltd Rail Expertise Ltd. Tel: 01543 493533 Email: info@railexpertise.co.uk 1 Introduction 1.1 The
Census Rationale. Census Objectives
 Census Rationale The Dhaka Transport Coordination Board (DTCB) has identified ten major corridors in Dhaka city to be transformed into NMT free corridors. After the withdrawal of NMT from the first corridor,
PRE-FEASIBILITY STUDY FOR TAMIL NADU
 TAMIL NADU INFRASTRUCTURE FUND MANAGEMENT CORPORATION PRE-FEASIBILITY STUDY FOR TAMIL NADU COMMERCE, HUB Located on Anna Salai, Chennai FINAL REPORT APRIL 2018 Internal Ref: 2018_MAR_ADV_CHE_27 A. PROJECT
HOUSEHOLD TRAVEL SURVEY
 HOUSEHOLD TRAVEL SURVEY Household Travel Survey i TABLE OF CONTENTS Page 1.0 INTRODUCTION... 1 2.0 SUMMARY OF TRAVEL... 2 2.1 All-Day Travel Patterns... 2 2.1.1 Automobile Availability... 2 2.1.2 Trip
DHANALASKHMI COLLEGE OF ENGINEERING SL.NO BOARDING POINT TIME (AM) 1 BHARATHIYAR NAGAR LIFT GATE ITC WINCO AJAX 6.
 1 BHARATHIYAR NAGAR LIFT GATE ITC WINCO AJAX 6.") DHANALASKHMI COLLEGE OF ENGINEERING ROUTE : 01 ENNORE (AM) 1 BHARATHIYAR NAGAR 6.00 2 LIFT GATE 6.02 3 ITC 6.05 4 WINCO 6.12 5 AJAX 6.15 6 PERIYAR NAGAR 6.18 7 TVT MARKET 6.20 8 THERADI 6.21 9 ELLAIMMAN
DHANALASKHMI COLLEGE OF ENGINEERING ROUTE : 01 ENNORE (AM) 1 BHARATHIYAR NAGAR 6.00 2 LIFT GATE 6.02 3 ITC 6.05 4 WINCO 6.12 5 AJAX 6.15 6 PERIYAR NAGAR 6.18 7 TVT MARKET 6.20 8 THERADI 6.21 9 ELLAIMMAN
According to FAA Advisory Circular 150/5060-5, Airport Capacity and Delay, the elements that affect airfield capacity include:
 4.1 INTRODUCTION The previous chapters have described the existing facilities and provided planning guidelines as well as a forecast of demand for aviation activity at North Perry Airport. The demand/capacity
SYNOPSIS OF INFORMATION FROM CENSUS BLOCKS AND COMMUNITY QUESTIONNAIRE FOR TONOPAH, NEVADA
 TECHNICAL REPORT UCED 93-04 SYNOPSIS OF INFORMATION FROM CENSUS BLOCKS AND COMMUNITY QUESTIONNAIRE FOR TONOPAH, NEVADA UNIVERSITY OF NEVADA, RENO i Synopsis of Information from Census Blocks and Community
THE RIVERSIDE MALL ON OMR
 P R E S E N T I N G T H E B I G G E S T R E T A I L O P P O R T U N I T Y I N S O U T H C H E N N A I THE RIVERSIDE MALL ON OMR Chennai's 1,830,000 largest "mixed - use" development sq.ft....to ensure
A DECADE OF PROMISE. AN ETERNITY OF PROGRESS. 4TH EDITION
 A DECADE OF PROMISE. AN ETERNITY OF PROGRESS. 4TH EDITION DLF CYBERCITY CHENNAI A HOLISTIC WORKPLACE ECOSYSTEM True to its mission of Building India, DLF has transformed the face of conventional corporate
Population analysis of North West London for John Lyon s Charity
 Population analysis of North West London for John Lyon s Charity This note summarises the findings of our population analysis for the eight north west London boroughs in which John Lyon s Charity is active.
Visual and Sensory Aspect
 Updated All Wales LANDMAP Statistics 2017 Visual and Sensory Aspect Final Report for Natural Resources Wales February 2018 Tel: 029 2043 7841 Email: sw@whiteconsultants.co.uk Web: www.whiteconsultants.co.uk
Knowledge of homemakers regarding base materials used for cooking utensils
 RESEARCH ARTICLE ADVANCE RESEARCH JOURNAL OF SOCIAL SCIENCE Volume 5 Issue 2 December, 2014 175-179 e ISSN 2231 6418 DOI: 10.15740/HAS/ARJSS/5.2/175-179 Visit us : www.researchjournal.co.in Knowledge of
Provincial Review 2016: Limpopo
 Provincial Review 2016: Limpopo Limpopo s growth since 2003 has been dominated by the mining sector, especially platinum, and by national construction projects. As a result, the provincial economy grew
No.262 kamarajar salai ramakrishna nagar alwarthirunagar chennai- 87
 Organic Stores 1 Dhanyam organic super store No.24 North boag road T.nagar chennai - 17 Mr.ram 9159808169 2 Organic green store No.30/2,I block 1st avenue annanagar east chennai - 102 Mrs.hemalatha 9840867190
How much did the airline industry recover since September 11, 2001?
 Catalogue no. 51F0009XIE Research Paper How much did the airline industry recover since September 11, 2001? by Robert Masse Transportation Division Main Building, Room 1506, Ottawa, K1A 0T6 Telephone:
APPENDIX 8. Leeds Socio-Economic Baseline Report. Report. July Metro and Leeds City Council
 APPENDIX 8 Leeds Socio-Economic Baseline Report Report July 2009 Prepared for: Prepared by: Metro and Leeds City Council Steer Davies Gleave West Riding House 67 Albion Street Leeds LS1 5AA +44 (0)113
HEATHROW COMMUNITY NOISE FORUM
 HEATHROW COMMUNITY NOISE FORUM 3Villages flight path analysis report January 216 1 Contents 1. Executive summary 2. Introduction 3. Evolution of traffic from 25 to 215 4. Easterly departures 5. Westerly
Whangarei Airport. Prepared by Carine Andries 10/20173
 Whangarei Airport Prepared by Carine Andries 10/20173 March 2010 TABLE OF CONTENTS 1 2 3 INTRODUCTION... 3 AIRPORT ROLE AND FUNCTION... 3 AIRPORT FEATURES AND CAPACITY... 3 3.1 3.2 3.3 3.4 3.5 3.5.1 3.5.2
MARKET OUTLOOK. 01 Walkability & Accessibility 02 Infrastructure & Employment 03 Demographics 04 Residential Analysis 06 Rental Analysis
 MARKET OUTLOOK EAST LEPPINGTON Located within the rapidly expanding South West Growth Centre of Sydney, the East Leppington Precinct is well positioned to benefit from the region s strong infrastructure
HEALTH SECTOR ECONOMIC INDICATORS REPORT
 HEALTH SECTOR ECONOMIC INDICATORS REPORT For: Mid North Coast Local Health District Report prepared by: April 2013 Table of Contents Introduction 3 Executive Summary 4 Output 5 Value-Added 7 Workforce
5 Rail demand in Western Sydney
 5 Rail demand in Western Sydney About this chapter To better understand where new or enhanced rail services are needed, this chapter presents an overview of the existing and future demand on the rail network
HEATHROW COMMUNITY NOISE FORUM. Sunninghill flight path analysis report February 2016
 HEATHROW COMMUNITY NOISE FORUM Sunninghill flight path analysis report February 2016 1 Contents 1. Executive summary 2. Introduction 3. Evolution of traffic from 2005 to 2015 4. Easterly departures 5.
Date: 11/6/15. Total Passengers
 Total San Diego Metropolitan Transit System POLICY 42 PERFORMANCE MONITORING REPORT Page 1 of 6 OBJECTIVE Develop a Customer-Focused and Competitive System The following measures of productivity and service
Building Completion. Statistics. Second Quarter. Building Completion Statistics I Second Quarter 2011
 Building Completion Statistics Building Completion Statistics I Second Quarter 211 Second Quarter Date of Release: March 212 1 Contents 1. Introduction... 2 2. Summary of Results.. 4 3. Distribution of
BEFORE THE NATIONAL GREEN TRIBUNAL SOUTHERN ZONE, CHENNAI. Application No.180 of 2016 (SZ) Vs.
 Vs.") BEFORE THE NATIONAL GREEN TRIBUNAL SOUTHERN ZONE, CHENNAI In the matter of Application No.180 of 2016 (SZ) 1. Mr.P.Varatharajan 4/196, Pillayar Kovil Street, Moovarasampet, Chennai 600091 Vs... Applicant
BEFORE THE NATIONAL GREEN TRIBUNAL SOUTHERN ZONE, CHENNAI In the matter of Application No.180 of 2016 (SZ) 1. Mr.P.Varatharajan 4/196, Pillayar Kovil Street, Moovarasampet, Chennai 600091 Vs... Applicant
Draft Western District Plan
 Powered by TCPDF (www.tcpdf.org) Draft Western District Plan Submission_id: 31732 Date of Lodgment: 15 Dec 2017 Origin of Submission: Online Organisation name: APP Corporation Pty Ltd Organisation type:
Tbilisi Crane Index Q4, KPMG Deal Advisory
 Tbilisi Crane Index Q4, 2017 KPMG Deal Advisory Overview of the Crane Index (1/3) The Crane Index is a tool utilized across the world in order to monitor the activity in the construction sector. By physically
Newbury Population ,071 1,941 3,719 4,038 5,337 5,611 5,805
 CHAPTER 3 DEMOGRAPHICS Demographic Profile Population Demographic information can provide essential insights into the composition of a community. As a result, it is a basic element of land use planning
Industry Report,
 China High-speed Railway a and Subway Industry Report, 2009-2010 China high-speed railway has stepped into rapid development in recent years. Up to the end of May, 2010, there have been 13 in- service
Department Achievement
 Department Achievement Events Conducted/Organized by Department S.No. Name of the Event Date 1 2 3 4 National Conference on Emerging Research and advances in Mechanical Sciences (ERAMS-2015), Sponsored
1, Kaliamman Koil Street, Near Koyambedu Bus Stand, Koyambedu, CHENNAI Chennai
 S.no Area Address City/Region 1 Koyambedu 1, Kaliamman Koil Street, Near Koyambedu Bus Stand, Koyambedu, Chennai - 600107 2 Velachey 41A/3, Velachery Main Road, Vijaya Nagar Bus stop, Velachey, Chennai
MAPPING UNSHELTERED HOMELESSNESS IN INDIANAPOLIS ISSUE C17-20 NOVEMBER 2017
 MAPPING UNSHELTERED HOMELESSNESS IN INDIANAPOLIS ISSUE C17-20 NOVEMBER 2017 AUTHOR Chris Holcomb, Graduate Student, School of Public and Environmental Affairs, IUPUI 334 N. Senate Avenue, Suite 300 Indianapolis,
THE NETHERLANDS ANTILLES: TRADE AND INTEGRATION WITH CARICOM (REVISITED)
") GENERAL LC/CAR/G.763 2 December 2003 ORIGINAL: ENGLISH THE NETHERLANDS ANTILLES: TRADE AND INTEGRATION WITH CARICOM (REVISITED) T a b le o f contents Introduction... 1 Trends in the Netherlands Antilles
GENERAL LC/CAR/G.763 2 December 2003 ORIGINAL: ENGLISH THE NETHERLANDS ANTILLES: TRADE AND INTEGRATION WITH CARICOM (REVISITED) T a b le o f contents Introduction... 1 Trends in the Netherlands Antilles
ANNEX V. List of Abbreviations
 ANNEX V List of Abbreviations SEE R&D EU TEN-T GROSEE FP NUTS LAU ESPON Cohesion SMART SWOT MEGA FUA GDP PUSH PIA TRACC RO BG GR EUROSTAT BBU OTP FYROM EC FMA FOCI ECR2 South East Europe Research and Development
A. CONCLUSIONS OF THE FGEIS
 Chapter 11: Traffic and Parking A. CONCLUSIONS OF THE FGEIS The FGEIS found that the Approved Plan will generate a substantial volume of vehicular and pedestrian activity, including an estimated 1,300
Trail Use in the N.C. Museum of Art Park:
 Trail Use in the N.C. Museum of Art Park: New Connections, New Visitors Jacqueline MacDonald Gibson, PhD Daniel Rodriguez, PhD Taylor Dennerlein, MSEE, MCRP, EIT Jill Mead, MPH Evan Comen University of
MT - GEOGRAPHY - (73) - SEMI PRELIM - I : PAPER - 6
 - SEMI PRELIM - I : PAPER - 6") 08 00 MT MT - GEOGRAPHY - (73) - SEMI PRELIM - I : PAPER - 6 Time : Hours (Model Answer Paper) Max. Marks : 0 Q.. Fill in the blank choosing the correct alternative : (a) In India, there has been a slight
08 00 MT MT - GEOGRAPHY - (73) - SEMI PRELIM - I : PAPER - 6 Time : Hours (Model Answer Paper) Max. Marks : 0 Q.. Fill in the blank choosing the correct alternative : (a) In India, there has been a slight
Ex post analysis of the new air procedures implemented on 6 February 2014 in the Brussels metropolitan area. Final Report
 Université Libre de Bruxelles (ULB) Faculty of Science Institute for Environmental Management and Land-use Planning (IGEAT) Ex post analysis of the new air procedures implemented on 6 February 2014 in
EXPO 88 IMPACT THE IMPACT OF WORLD EXPO 88 ON QUEENSLAND'S TOURISM INDUSTRY QUEENSLAND TOURIST AND TRAVEL CORPORATION GPO BOX 328, BRISBANE, 4001
 EXPO 88 IMPACT THE IMPACT OF WORLD EXPO 88 ON QUEENSLAND'S TOURISM INDUSTRY QUEENSLAND TOURIST AND TRAVEL CORPORATION GPO BOX 328, BRISBANE, 4001 Prepared by The National Centre for Studies in Travel and
Honorable Minister for Industries inspection at CMRL Metro Stations from AG-DMS to Washermanpet
 VOLUME - 10 Dec 2018 Honorable Minister for Industries inspection at CMRL Metro Stations from AG-DMS to Washermanpet T h e H o n b l e M i n i s t e r f o r I n d u s t r i e s, Thiru.M.C.Sampath inspected
Economic Impact of Tourism in Hillsborough County September 2016
 Economic Impact of Tourism in Hillsborough County - 2015 September 2016 Key findings for 2015 Almost 22 million people visited Hillsborough County in 2015. Visits to Hillsborough County increased 4.5%
Airport Planning Area
 PLANNING AREA POLICIES l AIRPORT Airport Planning Area LOCATION AND CONTEXT The Airport Planning Area ( Airport area ) is a key part of Boise s economy and transportation network; it features a multi-purpose
Ocean County Brian Berkowitz (Partner Adam Nassr Monmouth County)
") Ocean County Brian Berkowitz (Partner Adam Nassr Monmouth County) 1. County Summary Ocean County, founded in 1850, is located along the Jersey Shore in the state of New Jersey and has been one of the fastest
Ocean County Brian Berkowitz (Partner Adam Nassr Monmouth County) 1. County Summary Ocean County, founded in 1850, is located along the Jersey Shore in the state of New Jersey and has been one of the fastest
Proof of Concept Study for a National Database of Air Passenger Survey Data
 NATIONAL CENTER OF EXCELLENCE FOR AVIATION OPERATIONS RESEARCH University of California at Berkeley Development of a National Database of Air Passenger Survey Data Research Report Proof of Concept Study
Tamil Nadu's New Paradigm in Industrial Infrastructure: Industrial Corridors, Parks and Investment Regions
 Tamil Nadu's New Paradigm in Industrial Infrastructure: Industrial s, Parks and Investment Regions 1 Event Background Tamil Nadu is one of India's most industrialized and urbanized economies. It is among
ARRIVAL CHARACTERISTICS OF PASSENGERS INTENDING TO USE PUBLIC TRANSPORT
 ARRIVAL CHARACTERISTICS OF PASSENGERS INTENDING TO USE PUBLIC TRANSPORT Tiffany Lester, Darren Walton Opus International Consultants, Central Laboratories, Lower Hutt, New Zealand ABSTRACT A public transport
Scrappage for Equality
 Scrappage for Equality Calls continue to be made for the Government to sponsor a vehicle scrappage scheme to remove the most polluting vehicles from the parc. Previous RAC Foundation research has revealed
FUTENMA REPLACEMENT FACILITY BILATERAL EXPERTS STUDY GROUP REPORT. August 31, 2010
 FUTENMA REPLACEMENT FACILITY BILATERAL EXPERTS STUDY GROUP REPORT August 31, 2010 MANDATE AND SCOPE OF WORK: In order to achieve the earliest possible relocation of Marine Corps Air Station Futenma, the
2009 Muskoka Airport Economic Impact Study
 2009 Muskoka Airport Economic Impact Study November 4, 2009 Prepared by The District of Muskoka Planning and Economic Development Department BACKGROUND The Muskoka Airport is situated at the north end
Statistical Picture of Aboriginal and Torres Strait Islander School Students in Australia
 Chapter 2 Statistical Picture of Aboriginal and Torres Strait Islander School Students in Australia Statistical Picture The Australian Bureau of Statistics (ABS) reported that the estimated resident Aboriginal
Lansdowne Wetton BRT Public Transport Corridor Trunk Route: Planning Analysis
 Lansdowne Wetton BRT Public Transport Corridor Trunk Route: Planning Analysis 1. Introduction The purpose of this report is to detail the planning evaluation for the trunk route alignment alternatives
National Passenger Survey Spring putting rail passengers first
 National Passenger Survey putting rail passengers first What is Passenger Focus? Passenger Focus is the independent national rail consumer watchdog. Our mission is to get the best deal for Britain s rail
Economic Impact of Tourism in South Dakota, December 2017
 Economic Impact of Tourism in South Dakota, 2017 December 2017 1) Key findings 1) Growth continues in 2017 but pales against the event driven years of 2015 and 2016 in South Dakota Key facts about South
Cedar Rapids Area Convention and Visitors Bureau Visitor Study
 Cedar Rapids Area Convention and Visitors Bureau Visitor Study 2003-2004 University of Northern Iowa Sustainable Tourism & The Environment Program www.uni.edu/step Project Directors: Sam Lankford, Ph.D.
Gold Coast: Modelled Future PIA Queensland Awards for Planning Excellence 2014 Nomination under Cutting Edge Research category
 Gold Coast: Modelled Future PIA Queensland Awards for Planning Excellence 2014 Nomination under Cutting Edge Research category Jointly nominated by SGS Economics and Planning and City of Gold Coast August
Housing in Hobart: an overview of the data. Richard Eccleston, Lisa Denny, Julia Verdouw & Kathleen Flanagan University of Tasmania May 2018
 Housing in Hobart: an overview of the data Richard Eccleston, Lisa Denny, Julia Verdouw & Kathleen Flanagan University of Tasmania May 2018 Informing the Housing Debate Tasmania is facing significant housing
Estimation of Tourism Employment through Tourism Satellite Account Indian Experience
 Estimation of Tourism Employment through Tourism Satellite Account Indian Experience Dr. R. N. Pandey Additional Director General Ministry of Tourism Govt. of India E-Mail: rajnath56.pandey@gmail.com Importance
The Economic Impact of Tourism in North Carolina. Tourism Satellite Account Calendar Year 2015
 The Economic Impact of Tourism in North Carolina Tourism Satellite Account Calendar Year 2015 Key results 2 Total tourism demand tallied $28.3 billion in 2015, expanding 3.6%. This marks another new high
Table of Contents. Overview Objectives Key Issues Process...1-3
 Table of Contents Chapter One Introduction Overview...1-1 Objectives...1-1 Key Issues...1-2 Process...1-3 Chapter Two Inventory of Existing Conditions Airport Setting...2-1 Locale...2-1 Airport Surroundings...2-5
LOCATION ANALYSIS PURVA ATTRIA. March 2013
 LOCATION ANALYSIS PURVA ATTRIA March 2013 Contents 1 Bangalore City Overview 1 2 3 Micro-market Overview Key Residential & Commercial Development & Social Infra 2 3 4 Infrastructure Initiatives 4 4 5 5
REIMBURSEMENT WILL BE AS PER CGHS RATES ONLY
 LIST OF APPROVED HOSPITALS FOR INPATIENT AND OUTPATIENT SERVICES IN AND AROUND CHENNAI BY CLRI AS ON 07-04-2017 REIMBURSEMENT WILL BE AS PER CGHS RATES ONLY Sl.N Name of the Hospitals Address 1. Amrit
Palmerston North Retailing
 Palmerston North Retailing Introduction and General Experience My name is Peter Crawford and I am the Economic Policy Advisor for Palmerston North City Council. My qualifications include a BA (geography
1.0 Project Background Mission Statement and Goals Objectives of this Sustainable Master Plan
 TABLE OF CONTENTS CHAPTER 1 INTRODUCTION 10 Project Background 1-1 11 Mission Statement and Goals 1-1 12 Objectives of this Sustainable Master Plan 1-2 CHAPTER 2 INVENTORY 20 Airport Background 2-1 201
Economic Impact of Tourism in South Dakota, December 2018
 Economic Impact of Tourism in South Dakota, 2018 December 2018 1) Key Findings Growth rebounds in 2018 as a strong hunting season drives tourism growth Key facts about South Dakota s tourism sector Key
ECONOMIC PROFILE PARK CITY & SUMMIT COUNTY, UTAH
 ECONOMIC PROFILE PARK CITY & SUMMIT COUNTY, UTAH Prepared by the Park City Chamber of Commerce & Visitors Bureau PO Box 1630, Park City, UT 84060 1.800.453.1360 Economic Profile Packet Sections 1. Introduction
Future Economy. Future Econo. Conditions for Growth. Conditions for Growth. Growth for Business. Growth for Business. Isles of Scilly.
 Isles of Scilly Evidence Base Future Economy Future Economy Conditions for Growth Conditions for Growth Growth for Business Growth for Business Future Econo CONTENTS Introduction... 3 Economic Overview...
AUSTRALIAN TRAVEL TIME METRIC 2017 EDITION
 AUSTRALIAN TRAVEL TIME METRIC 217 EDITION For more information please contact: Brendan Lyon Chief Executive Officer Infrastructure Partnerships Australia Suite 3.3, Level 3, 9 Pitt Street Sydney NSW 2
STRATA DATA. Residential Strata in NSW A summary analysis. Issue 3, March City Futures Research Centre
 Governing the compact city STRATA DATA Residential Strata in NSW A summary analysis Issue 3, March 2011 City Futures Research Centre Cover photograph: Bruce Judd, 2010 Governing the Compact City Strata
TOURISM SPENDING IN ALGONQUIN PROVINCIAL PARK
 TOURISM SPENDING IN ALGONQUIN PROVINCIAL PARK Margaret E. Bowman 1, Paul F.G. Eagles 2 1 Ontario Parks Central Zone, 451 Arrowhead Park Road, RR3, Huntsville, ON P1H 2J4, 2 Department of Recreation and
PERMANENT MISSION OF BELIZE TO THE UNITED NATIONS
 PERMANENT MISSION OF BELIZE TO THE UNITED NATIONS 675 Third Ave. Suite 1911 New York, New York 10017 Tel: (212) 986-1240/(212) 593-0999 Fax: (212) 593-0932 E-mail: blzun@belizemission.com STATEMENT DELIVERED
Caravan & Camping Park Sector Annual Report 2011
 W Scottish Accommodation Occupancy Surveys Caravan & Camping Park Sector Annual Report 211 211 TNS UK Limited JN218761 May 212 211 TNS UK Ltd P a g e Contents Executive summary p. 1 Survey method p. 3
Sunshine Coast Airport Master Plan September 2007
 Sunshine Coast Airport Master Plan September 2007 Contents CONTENTS... I ACKNOWLEDGEMENT... II DISCLAIMER... III 1 EXECUTIVE SUMMARY...IV 1 INTRODUCTION... 1 2 AVIATION DEMAND FORECAST... 5 3 AIRCRAFT
The results of the National Tourism Development Strategy Assessments
 The results of the National Tourism Development Strategy Assessments - 2012 (I) The assessment tool In 2012 the Sustainable Tourism Working Group of the CEEweb for Biodiversity prepared a guidance for