Future Economy. Future Econo. Conditions for Growth. Conditions for Growth. Growth for Business. Growth for Business. Isles of Scilly.
|
|
|
- Sylvia Wilcox
- 6 years ago
- Views:
Transcription


1 Isles of Scilly Evidence Base Future Economy Future Economy Conditions for Growth Conditions for Growth Growth for Business Growth for Business Future Econo
2 CONTENTS Introduction... 3 Economic Overview... 4 Businesses... 4 Businesses - local units Businesses - local units Workplace- based employment size... 5 Workplace-based employment size band... 5 Economic activity... 6 Economic activity Economic activity Employment... 7 Employment by sector Employment by sector change Travel to work... 9 Travel to work 2011 (16-74)... 9 Hours worked...10 Hours worked 16-74, Hours worked Hours worked - change...11 Qualifications...12 Qualifications (All usual residents aged 16 and over)...12 Qualifications (All usual residents aged 16-74)...12 Jobseekers Allowance (JSA) data...13 Job Seekers Allowance...13 Isles of Scilly Transport Connections - Summary...14 Isles of Scilly Connectivity...14 Mainland Links...14 Mainland Connections...14 St Mary s Airport Series of projects to achieve the following:...15 Grid Connection...15 St Mary s Harbour...15 On Island Transport...15 Inter Island Connectivity
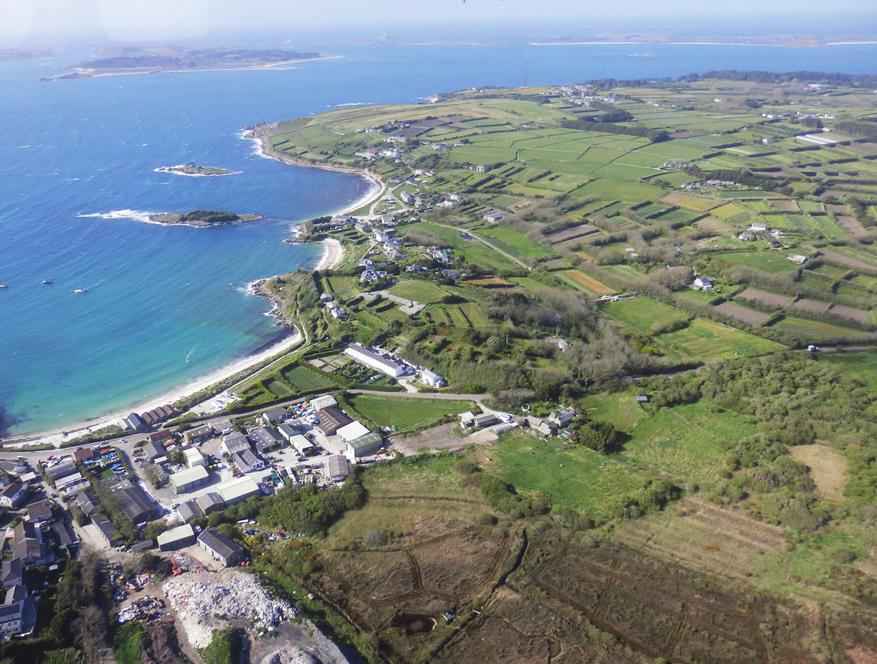
3 Introduction The Isles of Scilly lie 28 miles of the mainland and incorporate 5 inhabited islands. The islands have a population of 2,203. Resident numbers are relatively stable but with a slight increase from the 2001 total of 2,136. The population is ageing. The Island s economy is heavily reliant upon tourism and agriculture. It is clear that tourism provides the bulk of the jobs but also the critical mass for services such as the airport, quays, inter island boat services and the ferry and planes. Business size is dominated by micro and small businesses. Other economic trends are: - High levels of self employment - treble that of the South West and rest of England - A higher percentage of people working at or from home than that of the South West and rest of England - Some local resident have a number of part-time or seasonal jobs, but there is also considerable underemployment, reflecting the limited career opportunities available and the seasonal nature of employment. - Incomes significantly lower than the national and regional average due to the preponderance of low paid, part time, and/or seasonal jobs. - High costs of living are associated with scarcity of accommodation and transportation of freight to the islands 1 1 Source: Porthcressa Masterplan (2009), Roger Tym and Partners, Council of the Isles of Scilly 3
4 Economic Overview Businesses A total of 240 units 2 in 2011, most of which 90% - are defined as micros. Main sectors Agriculture, forestry and fishing and Accommodation and food services with 50 each, followed by Transportation and storage 30 and Wholesale at 25. Businesses - local units 2011 Industry Total Micro (0 to 9) Small (10 to 49) A : Agriculture, forestry and fishing B : Mining and quarrying C : Manufacturing D : Electricity, gas, steam and air conditioning supply E : Water supply; sewerage, waste management and remediation activities F : Construction G : Wholesale and retail trade; repair of motor vehicles and motorcycles H : Transportation and storage I : Accommodation and food service activities J : Information and communication K : Financial and insurance activities L : Real estate activities M : Professional, scientific and technical activities N : Administrative and support service activities O : Public administration and defence; compulsory social security P : Education Q : Human health and social work activities R : Arts, entertainment and recreation S : Other service activities Column Total Source: ONS, UK Business Counts - Local units, A local unit consists of each site where economic activity takes place. An Enterprise is the smallest combination of legal units under common ownership. It may consist of one or more local units. 4
5 As would be expected the Isles of Scilly is a small business economy with no medium sized or large units. Businesses - local units 2011 IoS UK Sizeband No's No's Micro (0 to 9) 215 2,109,590 Small (10 to 49) ,840 Medium-sized (50 to 249) 0 75,740 Large (250+) 0 11,665 Total 240 2,547,835 Sizeband % % Micro (0 to 9) Small (10 to 49) Medium-sized (50 to 249) Large (250+) Total Source: ONS, UK Business Counts - Local units. Workplace- based employment size Reflecting the size distribution of businesses, employment in the Isles of Scilly is largely based in micro and small businesses. Data for 2011 shows that 75% of employees work in these businesses. In contrast, the share across Great Britain is 44%. Note: this information is sourced from ONS, BRES. It is known that the Isles of Scilly have two medium sized companies ( employees) operating on the Islands (Tresco and the Isles of Scilly Steamship Company) which do not appear within this data set. Workplace-based employment size band Isles of Scilly Employment Sizeband No's No's No's Micro (0 to 9) Small (10 to 49) Medium-sized (50 to 249) Large (250+) Total 1,000 1,100 1,200 Isles of Scilly Employment Sizeband % % % Micro (0 to 9) Small (10 to 49) Medium-sized (50 to 249) Large (250+) Total Employment Sizeband
6 Great Britain % % % Micro (0 to 9) Small (10 to 49) Medium-sized (50 to 249) Large (250+) Total Source: ONS, BRES. Economic activity Comparing the 2001 and 2011 census data shows that the number of people aged is down but economically active numbers up as are the numbers employed. Biggest change is in the number and hence percentage of employees up from 50% to 54%. Unemployed numbers down. Economic activity No's No's ALL PEOPLE 1,631 1,622 Economically Active : Total 1,299 1,331 Employed ,306 Employee Economically Active : Self-employed Economically Active : Unemployed Economically Active : Full- time Student 12 7 Economically Inactive : Total Economically Inactive : Retired Economically Inactive : Student Economically Inactive : Other Source: ONS, Census 2001 and Economic activity % % ALL PEOPLE Economically Active : Total Employed Employee Economically Active : Self-employed Economically Active : Unemployed 2 1 Economically Active : Full- time Student 1 0 Economically Inactive : Total Economically Inactive : Retired Economically Inactive : Student 1 1 Economically Inactive : Other 6 4 Source: ONS, Census 2001 and
7 Employment Main sectors for employment in 2011 Accommodation and food services (23.9%), Wholesale and retail (10.2%), and Transport and storage (10%). [The data indicates which sectors residents are employed in, not where they work]. Employment by sector 2011 Sector No's % A Agriculture, forestry and fishing B Mining and quarrying C Manufacturing D Electricity, gas, steam and air conditioning supply E Water supply; sewerage, waste management and remediation activities F Construction G Wholesale and retail trade; repair of motor vehicles and motor cycles H Transport and storage I Accommodation and food service activities J Information and communication K Financial and insurance activities L Real estate activities M Professional, scientific and technical activities N Administrative and support service activities O Public administration and defence; compulsory social security P Education Q Human health and social work activities R, S, T, U Other All categories: Industry 1, Source: ONS, Census
8 The total number employed rose slightly between 2001 and The largest increases were in Real estate, renting and business activities; Transport, storage and communications and Education. Biggest falls in Wholesale and retail, and Agriculture etc. Employment by sector change Year Sector No s % No s % A, B. Agriculture; hunting and forestry; fishing C, E. Mining and quarrying; electricity; gas and water supply D Manufacturing F Construction G Wholesale and retail trade; repairs H Hotels and restaurants I Transport storage and communications J. Financial Intermediation K. Real estate; renting and business activities L. Public administration and defence; social security M. Education N. Health and social work O; P; Q. Other Total 1, , Source: ONS, Census 2001 and Sectors altered to fit 2001 categories. Employee numbers by workplace are also available. These show a small increase over time, in line with the census changes. From 900 in 2001 to 1,200 in [A problem here in that most agricultural employment is excluded from 2009 to 2011, hence totals for these years are underestimates]. 8
9 Employee numbers - BRES 1,400 1,200 1,000 No's Year Source: ONS, Business Register and Employment Survey. Travel to work The data below is from the census (alternative) travel to work data. Percentages reflect all those in work. A third of those in the Isles of Scilly work mainly at or from home with a quarter getting to work by walking and one in seven by bicycle. All of these figures are higher than the average for England. In contrast less than one in five drive to work in a car or van compared to over half across England. Travel to work 2011 (16-74) Isles of England Scilly No's % No's % Work mainly at or from home 2,678, Underground, metro, light rail, tram 991, Train 1,292, Bus, minibus or coach 1,836, Taxi 120, Motorcycle, scooter or moped 199, Driving a car or van 13,515, Passenger in a car or van 1,228, Bicycle 719, On foot 2,456, Other method of travel to work 122, All 25,162, , Source: ONS, Census
10 Hours worked The census shows that in 2001 three-quarters of people worked full-time, one quarter part-time, very similar to the English average. Hours worked 16-74, 2001 Area Isles of Scilly England No's % No's % Part-time: Total ,531, Part-time: 15 hours or less worked ,866,211 8 Part-time: 16 to 30 hours worked ,664, Full-time: Total ,910, Full-time: 31 to 48 hours worked ,256, Full-time: 49 or more hours worked ,653, All categories: Hours worked 1, ,441, Source: ONS, Census, The census shows that in 2011 the Isles of Scilly situation was similar to that in 2001 with three-quarters of people working full-time, one quarter part-time, however, across England 29% worked part-time with 71% fulltime. Hours worked Area Isles of Scilly England No's % No's % Part-time: Total ,307, Part-time: 15 hours or less worked ,418, Part-time: 16 to 30 hours worked ,888, Full-time: Total ,855, Full-time: 31 to 48 hours worked ,502, Full-time: 49 or more hours worked ,352, All categories: Hours worked 1, ,162,
11 Interestingly between 2001 and 2011, the percentage working part and full-time changed marginally whereas across England there was a significant increase in part-time working and consequent decline in fulltime working. However, amongst those working full-time in the Isles of Scilly there was also a dramatic fall in the percentage working for 49 hours or more a week, down from 26% in 2001 to 19% in Hours worked - change 2001 Isles of Scilly England % % Part-time: Total Part-time: 15 hours or less worked 8 8 Part-time: 16 to 30 hours worked Full-time: Total Full-time: 31 to 48 hours worked Full-time: 49 or more hours worked All categories: Hours worked Isles of Scilly England % % Part-time: Total Part-time: 15 hours or less worked 7 10 Part-time: 16 to 30 hours worked Full-time: Total Full-time: 31 to 48 hours worked Full-time: 49 or more hours worked All categories: Hours worked & Change Isles of Scilly England % % Part-time: Total 1 18 Part-time: 15 hours or less worked Part-time: 16 to 30 hours worked Full-time: Total 0-6 Full-time: 31 to 48 hours worked 16-2 Full-time: 49 or more hours worked Source: ONS, Census 2001 and
12 Qualifications A higher percentage of residents are qualified to Level 4 and above than on average across England, while a lower percentage have no qualifications. Although comparisons with 2001 are difficult due to a change in the age group covered, the figures suggest a definite improvement in skills with a rise in those with Level 3 and Level 4 and above and a fall in those without qualifications. Qualifications (All usual residents aged 16 and over) Isles of Scilly England No's % % None Level Level Apprenticeship Level Level 4 and above Other All categories 1, Source: ONS, Census Qualifications (All usual residents aged 16-74) Isles of Scilly England No's % % No Level Level Level Level 4/ Other / level unknown All categories 1, Source: ONS, Census
13 Jobseekers Allowance (JSA) data JSA rates are well below those of the UK. The average for 2013 being 0.8% compared to 3.7% for the UK. The Isles of Scilly also displays a very seasonal trend with higher rates in the winter and lower in the summer. This is expected with due to the high level of dependence on tourism. JSA rate % IoS UK Month Source: NOMIS, Jobcentre Plus. JSA rates are now similar to those in the early noughties, though above the lows reached between 2005 and Job Seekers Allowance Year UK Isles of Scilly % No's % Source: NOMIS, Jobcentre Plus. 13
14 Data not available at an IoS level Earnings data is not available at an Isle of Scilly level. Isles of Scilly Transport Connections - Summary Transport connections to the Isles of Scilly have experienced very difficult challenges in There is a need to secure long term connectivity to the Isles and address inter island travel. Capital investment in this vital infrastructure makes the links commercially viable without revenue subsidy in the short to medium term. The Islands cannot sustain the cost of capital investment without the support. Isles of Scilly Connectivity Mainland Links The Isles of Scilly comprise over 190 rocky islets lying 28 miles to the west of Land s End with the five inhabited islands, with a permanent population of 2,200. Tourism accounts for approximately 83% of the economy with over 100,000 visitors per annum. There are currently two transport links from the mainland to the islands; The ferry that operates in the summer season only; Airlinks by fixed wing to St Mary s Airport The airport with sustainable and affordable air transport is vital to the islands so that they can have fast reliable and frequent connection to the mainland, for the movement of visitors to and from the islands and for the export of goods from the islands. In the winter the connection to the mainland is only available by air, and therefore St Mary s Airport is vital infrastructure for the islands. The main freight for the Islands and the summer passenger vessel enters St Mary s via the St Mary s Harbour this is owned by the Duchy of Cornwall (as is much of the Islands outside of Hugh Town), and has an 8m development plan this is hoped to be funded in the current programme Mainland Connections The Islands also need improved facilities in the mainland embarkation points to the Islands therefore we support investment in Harbours in Cornwall especially Penzance, and in the 2 Cornish Airport NQY and specifically Lands End which is wholly dedicated to the Islands and is owned and managed by the IOSSCo and carries the bulk of island bound air passengers. The IOSSCo also fly to Exeter which with NQY are important transit points. 14
15 The islands also support and require improved links through Cornwall especially the railways and A30 road improvements. St Mary s Airport Series of projects to achieve the following: Operate at improved efficiency and reliability; Support and assist with an increase in tourist activity; Provide an increased reliability to the mainland link for the general population; Improve customer service and experience Provide an improved cargo service for businesses Grid Connection The islands have mains electricity with a sub sea cable from the mainland, the Islands also have a small diesel power station for emergency use. WPD are looking at greening the Isles of Scilly and are trialling Smart Grid technology on the Islands. To ensure we can make the best use of the significant wave potential around the Islands, the islands electricity infrastructure will need to be reviewed. St Mary s Harbour Series of projects to improve passenger and freight handling on the Quay The Quay is operated by the Duchy of Cornwall, with the vessels being delivered by the Isles of Scilly Steamship Company (IOSSCo) The infrastructure needs improvement to give a greater draught to allow a wider choice of vessels, protection for freight and better passenger facilities for those waiting to Board the vessel. There is also a need to mitigate people and vehicle conflict on the quay as the quay is used by thousands of people a day in the summer not only from the Scillonian, but off island boats, visiting yachts and over 40 cruise ships a year. On Island Transport The Islands have a very small adopted road network but an increasing number of on island vehicles support is required for better, safer and more cycle routes (Scilly has one of the highest bicycle usages in the country). Improved pedestrian access and general road improvements will allow the Islands to work better and offer the tourists improved facilities. There are opportunities for testing and trialing electric vehicles this has already started with a electric dial a ride vehicle, freight vehicles and a roadworthy electric buggy hire centre on St Mary s. 15
16 Inter Island Connectivity The other inhabited islands are serviced by the Off Island Boat Services, St Agnes Boating, Bryher Boating and St Martin s Boating and in the summer visitors based on St Mary s are serviced by the St Mary s Boatmen s Association. The inter island transport is unsubsidised apart from a small freight subsidy provided by the Council of the Isles of Scilly, the system is also very expensive (a one mile journey for an individual can cost over 40 especially in winter). Pensioners are supported on the off islands with a number of concessionary fares funded by the Council of the Isles of Scilly. 16
DUNOON PROFILE May 2014
 www.hie.co.uk DUNOON PROFILE May 2014 DUNOON PROFILE INTRODUCTION The Dunoon profile uses 2011 Census data and other available data sources to present an up-to-date analysis of its population and labour
Business Register and Employment Survey 2016 Update Final March 2016
 Business Register and Employment Survey 2016 Update Final March 2016 Jamie.watson@coast2capital.org.uk EXECUTIVE SUMMARY The Business Register and Employment Survey (BRES) update has shown that the Coast
Inverness, Culloden and Suburbs Settlement Economic Overview
 Strategic planning and research Economic information December 2007 Inverness, Culloden and Suburbs Settlement Economic Overview Summary Between 2001 and 2006, the population of Inverness, Culloden and
SHETLAND AREA PROFILE
 www.hie.co.uk SHETLAND AREA PROFILE May 2014 SHETLAND AREA PROFILE INTRODUCTION The Shetland area profile uses 2011 Census data and other available data sources to present an up-to-date analysis of its
East Lothian. Skills Assessment January SDS-1154-Jan16
 East Lothian Skills Assessment January 2016 SDS-1154-Jan16 Acknowledgement The Regional Skills Assessment Steering Group (Skills Development Scotland, Scottish Enterprise, the Scottish Funding Council
St. Austell travel to work profile
 St. Austell travel to work profile Cornwall Settlement Travel to Work Profiles 2015 1 CONTENTS Contents Introduction 1 Key findings 2 Key flows from St Austell Map 1 Main flows out - locations Chart 1
HEALTH SECTOR ECONOMIC INDICATORS REPORT
 HEALTH SECTOR ECONOMIC INDICATORS REPORT For: Mid North Coast Local Health District Report prepared by: April 2013 Table of Contents Introduction 3 Executive Summary 4 Output 5 Value-Added 7 Workforce
Penzance Heliport Ltd.
 Penzance Heliport Ltd. Penzance Heliport Ltd is planning to reinstate the popular scheduled helicopter service between Penzance and the Isles of Scilly. To operate the service, it proposes to build a new
North Lanarkshire. Skills Assessment January SDS-1163-Jan16
 North Lanarkshire Skills Assessment January 2016 SDS-1163-Jan16 Acknowledgement The Regional Skills Assessment Steering Group (Skills Development Scotland, Scottish Enterprise, the Scottish Funding Council
Industry and occupation of population in Montenegro
 MONTENEGRO STATISTICAL OFFICE R E L A S E 197 No Podgorica, 20 July 2012 Name the source when using the data Industry and occupation of population in Montenegro Census of Population, Households, and Dwellings
Travel & Tourism Sector Ranking United Kingdom. Summary of Findings, November 2013
 Travel & Tourism Sector Ranking United Kingdom Summary of Findings, November 2013 Introduction Sector Ranking Analysis In order to better understand the importance of the Travel & Tourism industry in a
Scotland's Business Base - Facts and Figures
 SPICe Briefing Pàipear-ullachaidh SPICe Scotland's Business Base - Facts and Figures Alison O'Connor GDP and employment have long been recognised as the major indicators of economic success. Yet, a key
City employment: An overview from the Business Register & Employment Survey (BRES)
") employment September 2012 employment: An overview from the Business Register & Employment Survey (BRES) Rachel Smith, September 2012 On 28 September, the latest employment estimates for 2011, taken from
employment September 2012 employment: An overview from the Business Register & Employment Survey (BRES) Rachel Smith, September 2012 On 28 September, the latest employment estimates for 2011, taken from
CAMPBELTOWN PROFILE May 2014
 www.hie.co.uk CAMPBELTOWN PROFILE May 2014 CAMPBELTOWN PROFILE INTRODUCTION The Campbeltown profile uses 2011 Census data and other available data sources to present an up-to-date analysis of its population
ISRAEL- COUNTRY FACTS
 ISRAEL- COUNTRY FACTS ISRAEL-NEIGHBOURING COUNTRIES AND POLITICAL MAP Area: 22,072 sq. km Land area: 21,643 sq. km. Fast Facts Area of lakes: 429 sq. km. (Sea of Galilee 164 sq. km., the Dead Sea - 265
The Economic Impact of Tourism in North Carolina. Tourism Satellite Account Calendar Year 2013
 The Economic Impact of Tourism in North Carolina Tourism Satellite Account Calendar Year 2013 Key results 2 Total tourism demand tallied $26 billion in 2013, expanding 3.9%. This marks another new high
2. Industry and Business
 72 Statistical Yearbook of Abu Dhabi 2016 2. Industry and Business Business Enviroment Manufacturing Oil and Gas Petrochemicals Electricity and Water Construction Transport Information and Communication
Introduction on the Tourism Satellite Account
 Mr. Peter Laimer Directorate Spatial Statistics UNWTO/DG GROW TSA-Workshop Agenda Item 2 Introduction on the Tourism Satellite Account Framework, tables and benefits Brussels, 29/30 November 2017 www.statistik.at
Regional Tourism Satellite Accounts (RTSA) in Austria
 in Austria") Peter Laimer Directorate Spatial Statistics CIS countries and Georgia Workshop III (Session 1) 10-12 June 2013 Baku/Azerbaijan Regional Tourism Satellite Accounts (RTSA) in Austria Methods, data sources,
Peter Laimer Directorate Spatial Statistics CIS countries and Georgia Workshop III (Session 1) 10-12 June 2013 Baku/Azerbaijan Regional Tourism Satellite Accounts (RTSA) in Austria Methods, data sources,
Contents Manningham at a Glance... 6 Location and Area... 6 Manningham Activity Centres... 6 Manningham Suburbs... 6 Population... 8 Forecast... 9 For
 Contents Manningham at a Glance... 6 Location and Area... 6 Manningham Activity Centres... 6 Manningham Suburbs... 6 Population... 8 Forecast... 9 Forecast 2011 2036... 9 Population Forecast... 9 Gross
The Economic Impact of Tourism Brighton & Hove Prepared by: Tourism South East Research Unit 40 Chamberlayne Road Eastleigh Hampshire SO50 5JH
 The Economic Impact of Tourism Brighton & Hove 2013 Prepared by: Tourism South East Research Unit 40 Chamberlayne Road Eastleigh Hampshire SO50 5JH CONTENTS 1. Summary of Results 1 1.1 Introduction 1 1.2
Tourism Satellite Account Calendar Year 2010
 The Economic Impact of Tourism in Georgia Tourism Satellite Account Calendar Year 2010 Highlights The Georgia visitor economy rebounded in 2010, recovering 98% of the losses experienced during the recession
The Economic Impact of Tourism Eastbourne Prepared by: Tourism South East Research Unit 40 Chamberlayne Road Eastleigh Hampshire SO50 5JH
 The Economic Impact of Tourism Eastbourne 2016 Prepared by: Tourism South East Research Unit 40 Chamberlayne Road Eastleigh Hampshire SO50 5JH CONTENTS Page 1. Summary of Results 1 1.1 Introduction 1 1.2
Travel & Tourism Sector Ranking South Korea
 Travel & Tourism Sector Ranking South Korea Summary of Findings, November 2013 Introduction Sector Ranking Analysis In order to better understand the importance of the Travel & Tourism industry in a global
Workplace Population: Key Facts
 : Key Facts May 2014 Introduction Friday 23 rd May saw release 5.2 of 2011 Census data. Included in this release were the first statistics on the workplace population and the first data provided at the
The Economic Impact of Tourism in Maryland. Tourism Satellite Account Calendar Year 2015
 The Economic Impact of Tourism in Maryland Tourism Satellite Account Calendar Year 2015 MD tourism economy reaches new peaks The Maryland visitor economy continued to grow in 2015; tourism industry sales
Employment and Skills Briefing (January 2015)
") Neil Brown Policy and Intelligence Officer t: 0115 854 1313 e: neilb@emfec.co.uk The following information summarises the DWP (Central England Group) State of the Group Report January 2015 and provides
Neil Brown Policy and Intelligence Officer t: 0115 854 1313 e: neilb@emfec.co.uk The following information summarises the DWP (Central England Group) State of the Group Report January 2015 and provides
Key Stats. 2.6 Percentage points. 1,050 New Jobs Filled Since launch 0.7% 17.7% 35.5% 230 Since last year 2.2% 14.8% Economy. Labour Market and Skills
 Key Stats Economy Employment rate % Get Oldham Working 2.6 Percentage points Labour Market and Skills Level 3 Qualifications % NEET % 1,050 New Jobs Filled Since launch Business 0.7% New businesses in
East Dunbartonshire Area Profile
 East Dunbartonshire Area Profile May 2014 Contents Executive Summary.. page 3 Introduction.. page 6 Population page 7 Age Structure. page 9 Population Projections page 11 Life Expectancy page 12 Ethnicity.
The Economic Contribution of Cruise Tourism to the Southeast Asia Region in Prepared for: CLIA SE Asia. September 2015
 BREA Business Research & Economic Advisors The Economic Contribution of Cruise Tourism to the Southeast Asia Region in 2014 Prepared for: CLIA SE Asia September 2015 Business Research & Economic Advisors
The Yorke & Mid North (State Govt) Region. Workforce Wizard Region Report
 Region. Workforce Wizard Region Report") The Yorke & Mid North (State Govt) Region Workforce Wizard Region Report Table of Contents Executive Summary 3 Population and Social Characteristics 4 Current Population 4 Age Groups 4 Key Populations
The Yorke & Mid North (State Govt) Region Workforce Wizard Region Report Table of Contents Executive Summary 3 Population and Social Characteristics 4 Current Population 4 Age Groups 4 Key Populations
Economic Impact of Tourism. Cambridgeshire 2010 Results
 Economic Impact of Tourism Cambridgeshire 2010 Results Produced by: Tourism South East Research Department 40 Chamberlayne Road, Eastleigh, Hampshire, SO50 5JH sjarques@tourismse.com http://www.tourismsoutheast.com
The Economic Base of Colfax County, NM. PREPARED BY: The Office of Policy Analysis at Arrowhead Center, New Mexico State University.
 The Economic Base of Colfax County, NM PREPARED BY: The Office of Policy Analysis at Arrowhead Center, New Mexico State University DATE: July 2016 The Economic Base of Colfax County, New Mexico Introduction
Priority Sector Report: Experience Industries
 Priority Sector Report: Experience Industries Göran Lindqvist, Stockholm School of Economics Sergiy Protsiv, Stockholm School of Economics 17 October 2011 Deliverable D09-6 Executive summary Experience
Regional Universities Network. Introduction. Regional Universities Network. Economic Impact of the Universities in the Regional Universities Network
 Regional Universities Network Economic Impact of the Universities in the Regional Universities Network Introduction The Regional Universities Network (RUN) is a network of six universities with headquarters
Major Groups. Food & beverages Percentage Change. Dec-12. Sep-13. Jun-13. Mar-13 SEPTEMBER 2013 QTR KEY POINTS
 2.5 2.0 1.5 1.0 0.5 0.0-0.5-1.0 Movement of Consumer Price Index Sep-12 Dec-12 Mar-13 Jun-13 Sep-13 Major Groups QTR on QTR YR on YR %Change Food & Beverage -0.3 3.4 Alcohol, tobacco & betel nut -2.0 1.9
RIGA FACTS & FIGURES 2018 RIGA FACTS & FIGURES 2018
 RIGA FACTS & FIGURES 2018 1 WHY RIGA? Riga in 2030 will be internationally recognizable Northern European metropolis. The full membership of the Riga in the Northern European Metropolises family based
Economic Impact Analysis. Tourism on Tasmania s King Island
 Economic Impact Analysis Tourism on Tasmania s King Island i Economic Impact Analysis Tourism on Tasmania s King Island This project has been conducted by REMPLAN Project Team Matthew Nichol Principal
Where did London s jobs go? Paul Convery LEPU October 11 th 2005
 Where did London s jobs go? Paul Convery LEPU October 11 th 2005 Summary! Strong economic growth for most of decade! Jobs growth has turned down! Productivity outstripping labour supply! High value-added,
The Economic Impact of Tourism Brighton & Hove Prepared by: Tourism South East Research Unit 40 Chamberlayne Road Eastleigh Hampshire SO50 5JH
 The Economic Impact of Tourism Brighton & Hove 2014 Prepared by: Tourism South East Research Unit 40 Chamberlayne Road Eastleigh Hampshire SO50 5JH CONTENTS 1. Summary of Results 1 1.1 Introduction 1 1.2
2016 October - December
 2016 October - December TOURIST ARRIVAL QUARTERLY REPORT Research and Statistics Department Ministry of Tourism, Economic Development, Investment & Energy Statistics Division 1 P a g e Foreword This report
CONTENTS 03 BIG PICTURE 15 BARS & RESTAURANTS 05 OFFICE 16 EMPLOYMENT 07 EDUCATION ART AND CULTURE 18 TRANSPORT AND ACCESS 9 TOURISM AND HOTELS
 CONTENTS 3 BIG PICTURE 5 OFFICE 15 BARS & RESTAURANTS 16 EMPLOYMENT 7 EDUCATION ART AND CULTURE 18 TRANSPORT AND ACCESS 9 TOURISM AND HOTELS 12 RETAIL 2 CITY LIVING 23 SOURCE INTRODUCTION Norwich The City
APPENDIX 8. Leeds Socio-Economic Baseline Report. Report. July Metro and Leeds City Council
 APPENDIX 8 Leeds Socio-Economic Baseline Report Report July 2009 Prepared for: Prepared by: Metro and Leeds City Council Steer Davies Gleave West Riding House 67 Albion Street Leeds LS1 5AA +44 (0)113
Economic Impact of Tourism. Norfolk
 Economic Impact of Tourism Norfolk - 2009 Produced by: East of England Tourism Dettingen House Dettingen Way, Bury St Edmunds Suffolk IP33 3TU Tel. 01284 727480 Contextual analysis Regional Economic Trends
St. Mary s Harbour. Port Waste Management Plan
 DUCHY of CORNWALL St. Mary s Harbour Port Waste Management Plan Harbour Master: 01720 422768 hm@stmarys-harbour.co.uk The Harbour Office The Quay, St. Mary s, Isles of Scilly, TR21 0HU. - 1 - CONTENTS.
MINING IN TASMANIA: DINOSAUR OR DELIVERER?
 MINING IN TASMANIA: DINOSAUR OR DELIVERER? PRESENTATION TO A FORUM HOSTED BY THE ACADEMY OF TECHNOLOGICAL SCIENCES AND ENGINEERING (ATSE) FOR NATIONAL SCIENCE WEEK RACV APARTMENT HOTEL, HOBART 3 RD AUGUST
Regional summary - Wellington
 Regional summary Wellington Regional summary - Wellington This is a summary of data relevant to transportation in this region, viewed from a Land Transport NZ perspective. It s purpose is to inform the
Produced by: Destination Research Sergi Jarques, Director
 Produced by: Destination Research Sergi Jarques, Director Economic Impact of Tourism Oxfordshire - 2016 Economic Impact of Tourism Headline Figures Oxfordshire - 2016 number of trips (day & staying) 27,592,106
Manawatu District Economic Profile
 Manawatu District Economic Profile Our community Population has grown by 1,000 residents since 2014 to reach 29,800. Population is 86.4% European, with Maori 14.3% of the population. This compares with
PORTREE PROFILE May 2014
 www.hie.co.uk PORTREE PROFILE May 2014 PORTREE PROFILE INTRODUCTION The Portree profile uses 2011 Census data and other available data sources to present an up-to-date analysis of its population and labour
Tourist satellite account for Poland for the years 2005 simplified version
 Tourist satellite account for Poland for the years 2005 simplified version Department of Tourism Ministry of Sport and Tourism of Poland - In 2005 tourism consumption within the economic territory of Poland
Produced by: Destination Research Sergi Jarques, Director
 Produced by: Destination Research Sergi Jarques, Director Economic Impact of Tourism North Norfolk District - 2016 Contents Page Summary Results 2 Contextual analysis 4 Volume of Tourism 7 Staying Visitors
Produced by: Destination Research Sergi Jarques, Director
 Produced by: Destination Research Sergi Jarques, Director Economic Impact of Tourism Norfolk - 2016 Contents Page Summary Results 2 Contextual analysis 4 Volume of Tourism 7 Staying Visitors - Accommodation
The Economic Impact of Tourism in North Carolina. Tourism Satellite Account Calendar Year 2015
 The Economic Impact of Tourism in North Carolina Tourism Satellite Account Calendar Year 2015 Key results 2 Total tourism demand tallied $28.3 billion in 2015, expanding 3.6%. This marks another new high
KANGAROO ISLAND WATERGAP PROJECT
 KANGAROO ISLAND WATERGAP PROJECT 1. BACKGROUND Although Kangaroo Island is only 112km from Adelaide, it is economically and socially disadvantaged by its 16km watergap separation from the mainland. There
Introduction 3. Accommodation 4. Ireland Market 5. Activity Providers, Attractions, Retail, Restaurants and Transport 6. Overseas Market Performance 7
 Wave 2 September Contents Page No: Introduction Accommodation 4 Ireland Market 5 Activity Providers, Attractions, Retail, Restaurants and Transport 6 Overseas Market Performance 7 Prospects 8 Factors Impacting
Provincial Review 2016: Limpopo
 Provincial Review 2016: Limpopo Limpopo s growth since 2003 has been dominated by the mining sector, especially platinum, and by national construction projects. As a result, the provincial economy grew
FirstGroup plc South Western
 FirstGroup plc South Western Rail franchise award Monday 27 March 2017 Overview Delighted to be selected by the Department for Transport (DfT) to operate the South Western franchise for at least seven
The Economic Impact of Tourism in Jacksonville, FL. June 2016
 The Economic Impact of Tourism in Jacksonville, FL June 2016 Highlights Visitor spending surpassed $2.0 billion in 2015, growing 4.4%. As this money flowed through Duval County, the $2.0 billion in visitor
Fiji s Tourism Satellite Accounts
 Asia-Pacific Economic Statistics Week Bangkok 2 4 May 2016 Fiji s Tourism Satellite Accounts Mr. Bimlesh Krishna Divisional Manager Economic Statistics Fiji s Tourism Satellite Introduction The Tourism
DINGWALL PROFILE May 2014
 www.hie.co.uk DINGWALL PROFILE May 2014 DINGWALL PROFILE INTRODUCTION The Dingwall profile uses 2011 Census data and other available data sources to present an up-to-date analysis of its population and
Queensland Economic Update
 Queensland Economic Update Chamber of Commerce & Industry March 2018 cciq.com.au Queensland Economic Update: Summary National Accounts GDP expanded 2.3% during calendar year 2017. QLD state final demand
Employment Characteristics of Tourism Industries, 2011
 Employment Characteristics of Tourism Industries, 2011 Coverage: UK Date: 22 March 2013 Geographical Area: UK Theme: Labour Market Theme: People and Places Theme: Travel and Transport Theme: Economy Key
Produced by: Destination Research Sergi Jarques, Director
 Produced by: Destination Research Sergi Jarques, Director Economic Impact of Tourism Norfolk - 2017 Contents Page Summary Results 2 Contextual analysis 4 Volume of Tourism 7 Staying Visitors - Accommodation
February 2016 Employment and Skills Briefing
 The following information summarises the DWP (Central England Group) State of the Group Report (February 2016) and provides a focus on East Midlands through District level, local authority, and LEP data.
Economic Impacts of Campgrounds in New York State
 Economic Impacts of Campgrounds in New York State June 2017 Report Submitted to: Executive Summary Executive Summary New York State is home to approximately 350 privately owned campgrounds with 30,000
VALUE OF TOURISM. Trends from
 VALUE OF TOURISM Trends from 2005-2015 March 2017 TABLE OF CONTENTS 1. Overview... 2 Key highlights in 2015... 2 2. Contributions to the economy... 4 TOURISM REVENUE... 5 Total revenue... 5 Tourism revenue
The Economic Impact of Travel in Kansas. Tourism Satellite Account Calendar Year 2013
 The Economic Impact of Travel in Kansas Tourism Satellite Account Calendar Year 2013 Who we are Tourism Economics Union of industry expertise and economic disciplines Real world insights based on quantitative
ECONOMIC IMPACT STUDY OF CALIFORNIA AIRPORTS
 ECONOMIC IMPACT STUDY OF CALIFORNIA AIRPORTS MARCH 1, 2013 Prepared for California Airports Council Prepared by Applied Development Economics 100 Pringle Avenue, Suite 560 Walnut Creek, California 94596
Self Catering Holidays in England Economic Impact 2015
 Self Catering Holidays in England Economic Impact 2015 An overview of the economic impact of self catering holidays in England Published by The South West Research Company Ltd March 2017 Contents Page
THE 2006 ECONOMIC IMPACT OF TRAVEL & TOURISM IN INDIANA
 THE 2006 ECONOMIC IMPACT OF TRAVEL & TOURISM IN INDIANA A Comprehensive Analysis Prepared by: In Partnership with: PREPARED FOR: Carrie Lambert Marketing Director Indiana Office of Tourism Development
Economic Impact of Tourism in South Dakota, December 2018
 Economic Impact of Tourism in South Dakota, 2018 December 2018 1) Key Findings Growth rebounds in 2018 as a strong hunting season drives tourism growth Key facts about South Dakota s tourism sector Key
The performance of Scotland s high growth companies
 The performance of Scotland s high growth companies Viktoria Bachtler Fraser of Allander Institute Abstract The process of establishing and growing a strong business base is an important hallmark of any
Figure 1.1 St. John s Location. 2.0 Overview/Structure
 St. John s Region 1.0 Introduction Newfoundland and Labrador s most dominant service centre, St. John s (population = 100,645) is also the province s capital and largest community (Government of Newfoundland
July 2016 Employment and Skills Briefing
 The following information summarises the DWP: (Central England Group) State of the Group Report (July 2016) and provides a focus on East Midlands through District level, local authority, and LEP data.
Economic Contribution of Tourism to NSW
 Economic Contribution of Tourism to NSW 2015-16 Tourism is a significant part of the NSW economy. In 2015-16, tourism contributed $38.1 billion (Tourism Consumption) to the NSW economy and employed 261,100
August Briefing. Why airport expansion is bad for regional economies
 August 2005 Briefing Why airport expansion is bad for regional economies 1 Summary The UK runs a massive economic deficit from air travel. Foreign visitors arriving by air spent nearly 11 billion in the
A TRANSPORT SYSTEM CONNECTING PEOPLE TO PLACES
 THE MAYOR'S VISION FOR TRANSPORT A TRANSPORT SYSTEM CONNECTING PEOPLE TO PLACES VISION We will build a transport system that works for everyone, connecting people to the places they want to go within the
5 Demography and Economy
 5 Demography and Economy Demography People have probably lived on Great Barrier Island (Aotea) since the 13 th century. There are few written observations about the number of Maori settled here but these
Quarterly Bulletin of Statistics
 QUARTERLY BULLETIN OF STATISTICS 2nd Quarter Q2 GOVERNMENT OF BERMUDA Department of Statistics Quarterly Bulletin of Statistics Q2 Highlights Imports The value of imports decreased 15.8 per cent to $299.1
Magnetic Heart of Queensland
 Shaping Townsville s Destiny to be the... Magnetic Heart of Queensland A design for future Townsville by Vee Design : 9point9 Architects : Milford Planning : Meter : Szczepan Urbanowicz shaping Townsville
Tourism Industry Council Tasmania Community Survey 2018 Research Report. May 2018
 Tourism Industry Council Tasmania Community Survey 2018 Research Report May 2018 This report has been prepared by Enterprise Marketing and Research Services 60 Main Road, Moonah TAS 7009 All enquiries
Otago Economic Overview 2013
 Final report May 2014 www.berl.co.nz Background Author(s): Mark Cox, Hugh Dixon and Masrur Alam Khan DISCLAIMER All work is done, and services rendered at the request of, and for the purposes of the client
West London Economic Assessment
 West London Economic Assessment A baseline analysis of the West London economy An Executive Summary PBA were commissioned in October 2015 to complete an economic assessment of West London to refresh the
The Economic Impact of Tourism on Calderdale Prepared by: Tourism South East Research Unit 40 Chamberlayne Road Eastleigh Hampshire SO50 5JH
 The Economic Impact of Tourism on Calderdale 2015 Prepared by: Tourism South East Research Unit 40 Chamberlayne Road Eastleigh Hampshire SO50 5JH CONTENTS 1. Summary of Results 1 2. Table of Results Table
Employment and Skills Briefing (March 2015)
") Neil Brown Policy and Intelligence Officer t: 0115 854 1313 e: neilb@emfec.co.uk The following information summarises the DWP (Central England Group) State of the Group Report March 2015 and provides a
Neil Brown Policy and Intelligence Officer t: 0115 854 1313 e: neilb@emfec.co.uk The following information summarises the DWP (Central England Group) State of the Group Report March 2015 and provides a
00: Not for broadcast or publication before 00:01 Hrs Monday 20th June 2011
 Press Release Embargoed until: 00:01 20.06.11 Not for broadcast or publication before 00:01 Hrs Monday 20th June 2011 This is the Halifax review of economic and price performance at a local level. The
Policy Research Corporation
 Policy Research Corporation SOUND SOLUTIONS BASED ON SCIENTIFIC RESEARCH The role of Maritime Clusters to enhance the strength and development of maritime sectors Country report Malta INTRODUCTION TO COUNTRY
Chapter 1: The Population of NHS Greater Glasgow and Clyde
 Population Estimate (thousands) Chapter 1: The Population of NHS Greater Glasgow and Clyde Population Trends and Projections National Records of Scotland estimated (NRS SAPE) 1 the 2013 NHS Greater Glasgow
Palmerston North Retailing
 Palmerston North Retailing Introduction and General Experience My name is Peter Crawford and I am the Economic Policy Advisor for Palmerston North City Council. My qualifications include a BA (geography
Benchmarking Travel & Tourism in United Arab Emirates
 Benchmarking Travel & Tourism in United Arab Emirates How does Travel & Tourism compare to other sectors? Summary of Findings, November 2013 Sponsored by: Outline Introduction... 3 UAE summary...... 8
The Economic Impact of Tourism on Scarborough District 2014
 The Economic Impact of Tourism on Scarborough District 2014 Prepared by: Tourism South East Research Unit 40 Chamberlayne Road Eastleigh Hampshire SO50 5JH CONTENTS 1. Summary of Results 1 2. Table of
Report of. Transport Key Performance Indicators
 Report of Transport Key Performance Indicators August 2008 CONTENTS 1) INTRODUCTION 2 2) RELIABILITY OF SHETLANDS TRANSPORT NETWORK 3 3) STANDARD OF ROAD MAINTENANCE 5 4) FUEL CONSUMPTION LEVELS 6 5) MARKET
The Economic Impact of Tourism New Forest Prepared by: Tourism South East Research Unit 40 Chamberlayne Road Eastleigh Hampshire SO50 5JH
 The Economic Impact of Tourism New Forest 2008 Prepared by: Tourism South East Research Unit 40 Chamberlayne Road Eastleigh Hampshire SO50 5JH CONTENTS Glossary of terms 1 1. Summary of Results 4 2. Table
Produced by: Destination Research Sergi Jarques, Director
 Produced by: Destination Research Sergi Jarques, Director Economic Impact of Tourism Oxfordshire - 2015 Economic Impact of Tourism Headline Figures Oxfordshire - 2015 Total number of trips (day & staying)
Average annual compensation received by full-time spa employees.
 1 Introduction This report presents the findings from the employee compensation and benefits section of the 2017 U.S. Spa Industry Study. The study was commissioned by the International SPA Association
BREA. Contribution of Cruise Tourism to the Economies of Europe 2011 Country Report Germany. The European Cruise Council.
 BREA Business Research Economic Advisors Contribution of Cruise Tourism to the Economies of Europe 2011 Country Report Prepared for The European Cruise Council July 2012 participates in all aspects of
URBAN DYNAMICS WESTERN CAPE 67
 URBAN DYNAMICS WESTERN CAPE 67 5. SOCIO-ECONOMIC CONTEXT 5.1 Demographic Profile 5.1.1 Introduction The demographic information contained in the synopsis is derived from the supposedly inaccurate 2001
Facts about Business in Stockholm. Statistics for 2014
 Facts about Business in Stockholm Statistics for 2014 Content Economy Business Sector Workforce and Population Infrastructure In this publication the Stockholm Region is defined as the counties; Stockholms
Introduction 3. Accommodation 4. Ireland Market 5. Activity Providers, Attractions, Retail and Transport 6. Overseas Market Performance 7.
 Contents Page No: Introduction 3 Accommodation 4 Ireland Market 5 Activity Providers, Attractions, Retail and Transport 6 Overseas Market Performance 7 Prospects 8 Factors Impacting on Performance 9 Operational