GUYANA TOURISM STATISTICAL DIGEST 2015
|
|
|
- Everett Austin
- 6 years ago
- Views:
Transcription


1 GUYANA TOURISM STATISTICAL DIGEST 2015


2 GUYANA TOURISM STATISTICAL DIGEST 2015 EDITION National Exhibition Centre Sophia, Greater Georgetown Guyana, South America. Tel: (592) Website: PAGE II
3 FOREWORD This Statistical Digest is a compilation of Visitor Arrivals to Guyana for the period 2010 to 2015 based on analysis of data from the Embarkation/Disembarkation (E/D) Cards from the four main ports of entry. The digest was prepared by the staff of the Guyana Tourism Authority (GTA). The Caribbean Tourism Organisation (CTO) is sincerely acknowledged for their assistance towards making this publication possible. Any recommendations, comments and inquiries regarding the contents of this publication can be forwarded to: GUYANA TOURISM AUTHORITY National Exhibition Centre Sophia, Greater Georgetown Guyana, South America. Tel: (592) Fax: (592) info@guyana-tourism.com Website: Published: December 2016 PAGE III
4 CONTENTS DESCRIPTION INTRODUCTION ANALYSIS Visitor Arrivals by Months Visitor Arrivals by Main Markets Visitor Arrivals by Main Markets and Months Visitor Arrivals by Markets and Birth Place 2015 Visitor Arrivals from USA Visitor Arrivals from Canada Visitor Arrivals from Europe Visitor Arrivals from Caribbean Visitor Arrivals from South and Central America Visitor Arrivals by Ports of Entry Visitor Arrivals by Carrier, Land Border and Sea Visitor Arrivals by Purpose of Visit Visitor Arrivals by Type of Accommodation 2015 Visitor Arrivals by Length of Stay Visitor Arrivals by Gender Visitor Arrivals by Age Range 2015 TABLES Table 1: Monthly Visitor Arrivals Table 2: Visitor Arrivals by Main Markets Table 3: Visitor Arrivals by Main Markets and Month 2015 Table 4: Visitor Arrivals by Market and Birth Place 2015 Table 5: Visitor Arrivals from USA by Top 10 States Table 6: Visitor Arrivals from USA by All States Table 7: Visitor Arrivals from Canada by Top 9 Province, Table 8: Visitor Arrivals from Canada by All Province, Table 9: Visitor Arrivals from Europe by Top 9 Countries Table 10: Visitor Arrivals from Europe by All Countries Table 11: Visitor Arrivals from the Caribbean by Top 9 Countries Table 12: Visitor Arrivals from the Caribbean by All Countries Table 13: Visitor Arrivals from South and Central America by Top 9 Countries Table 14: Visitor Arrivals from South and Central America by All Countries Table 15: Visitor Arrivals by Port of Entry (Comparison 2014 vs 2015) Table 16: Visitor Arrivals via CJIA PAGE PAGE IV
5 Table 17: Visitor Arrivals via Lethem Table 18: Visitor Arrivals via Moleson Creek Table 19: Visitor Arrivals via EFCIA Table 20: Visitor Arrivals by Carrier, Land Border and Sea 2015 Table 21: Visitor Arrivals by Purpose of Visit Table 22: Visitor Arrivals and Type of Accommodation-2015 Table 23: Visitor Arrivals by Length of Stay 2015 Table 24: Visitor Arrivals by Gender 2015 Table 25: Visitor Arrivals by Age Group 2015 CHARTS Chart 1: Visitor Arrivals by Month Chart 2: Visitor Arrivals by Main Markets Chart 3: Visitor Arrivals by Main Markets (Percentage Share) 2015 Chart 4: Visitor Arrivals by Purpose of Visit 2015 Chart 5: Visitor Arrivals by Gender and Main Markets PAGE V
6 INTRODUCTION Objective of the Digest The main objective of this digest is to provide critical tourism information and statistics to Government Ministries and Agencies, Tourism Stakeholders, Existing and Potential Investors, Students and the General Public. This digest will most importantly help to guide policy decision making, marketing strategies, product development and investment opportunities in the tourism industry. Information and statistics are included on Visitor arrivals by Month, Main Markets, Ports of Entry, Purpose of Visit, Birthplace, Countries, States, and Provinces, Accommodation, Length of Stay, Gender, Age Group, Carrier, Land Border and Sea. Geographic Scope Data was collected from the four main ports of entry of Guyana, namely Cheddi Jagan International Airport (CJIA), Eugene F. Correia International Airport (EFCIA), Moleson Creek (Guyana/Suriname Border Crossing) and Lethem (Guyana/Brazil Border Crossing). Data Sources and Methodology The methodology employed for the production of this digest involved the use of the data from the Embarkation/Disembarkation (E/D) Cards collected from four main ports of entry and the Management Information System for Tourism (MIST). N.B. E/D Cards were collected from Lethem and Moleson Creek beginning in 2013 and from Eugene F. Correia International Airport from The data from the E/D cards were inputted by the Tourism Information Clerks into MIST, after which analysed reports were generated on a monthly basis. Data files and reports were submitted to the Caribbean Tourism Organisation's (CTO's) Statistical Department for analysis to ensure accuracy of reports produced by the GTA. Tables and charts were generated based on information provided on the E/D cards by visitors as well as from samples of digest produced by sister Caribbean countries; all of whom used MIST to generate visitor arrival information. Assistance was sought from the CTO in deriving the statistics for length of stay. It must be noted that MIST has been upgraded to the Tourism Information Management System (TIMS) and Guyana has already signed onto to the new agreement. Based on the new agreement. Guyana's database will be hosted at the CTO's headquarters in Barbados. -TIMS includes technological advancements in hardware and software that will allow for improved function, management and maintenance of the application. Definitions The following are definitions adopted by the United Nations World Tourism Organisation (UNWTO): A visitor is a traveller taking a trip to a main destination outside his/her usual environment, for less than a year, for any main purpose (business, leisure or other personal purpose) other than to be employed by a resident entity in the country or place visited. A visitor (domestic, inbound or outbound) is classified as a tourist (or overnight visitor), if his/her trip includes an overnight stay, or as a same-day visitor (or excursionist) otherwise. PAGE 1
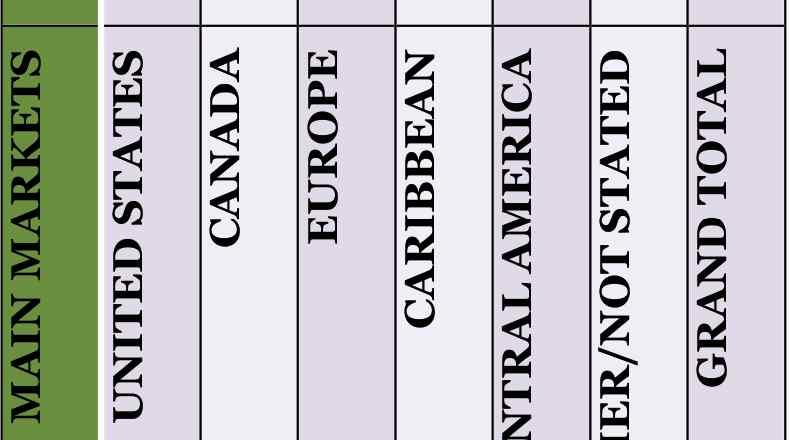
7 Visitor Arrival figures in this digest represent non-residents. As such, Guyanese living in Guyana and those who travel aboard for the purposes of holiday, business, study or for temporary work are not included in these figures. There were high levels of E/D Cards submitted without pertinent data, such as length of stay, place of residence, purpose of visit and type of accommodation. Abbreviations Used CTO E/D GTA MIST TIMS UNWTO EFCIA CJIA VFR MICE Caribbean Tourism Organisation Embarkation/Disembarkation Guyana Tourism Authority Management Information System for Tourism Tourism Information Management System United Nations World Tourism Organisation Eugene F. Correia International Airport Cheddi Jagan International Airport Visiting Friends/Relatives Meetings, Incentives, Conferences & Exhibitions Overview for the last Five Years Visitor arrivals for the year 2015 were recorded as 206,819. This showed an increase of 36.1% from the 2010 figure of 151,926 and 0.5% from the 2014 figure of 205,824. From the year 2010 to 2015 there has been an average steady increase between 5% and 6% of Visitor Arrivals to Guyana. PAGE 2
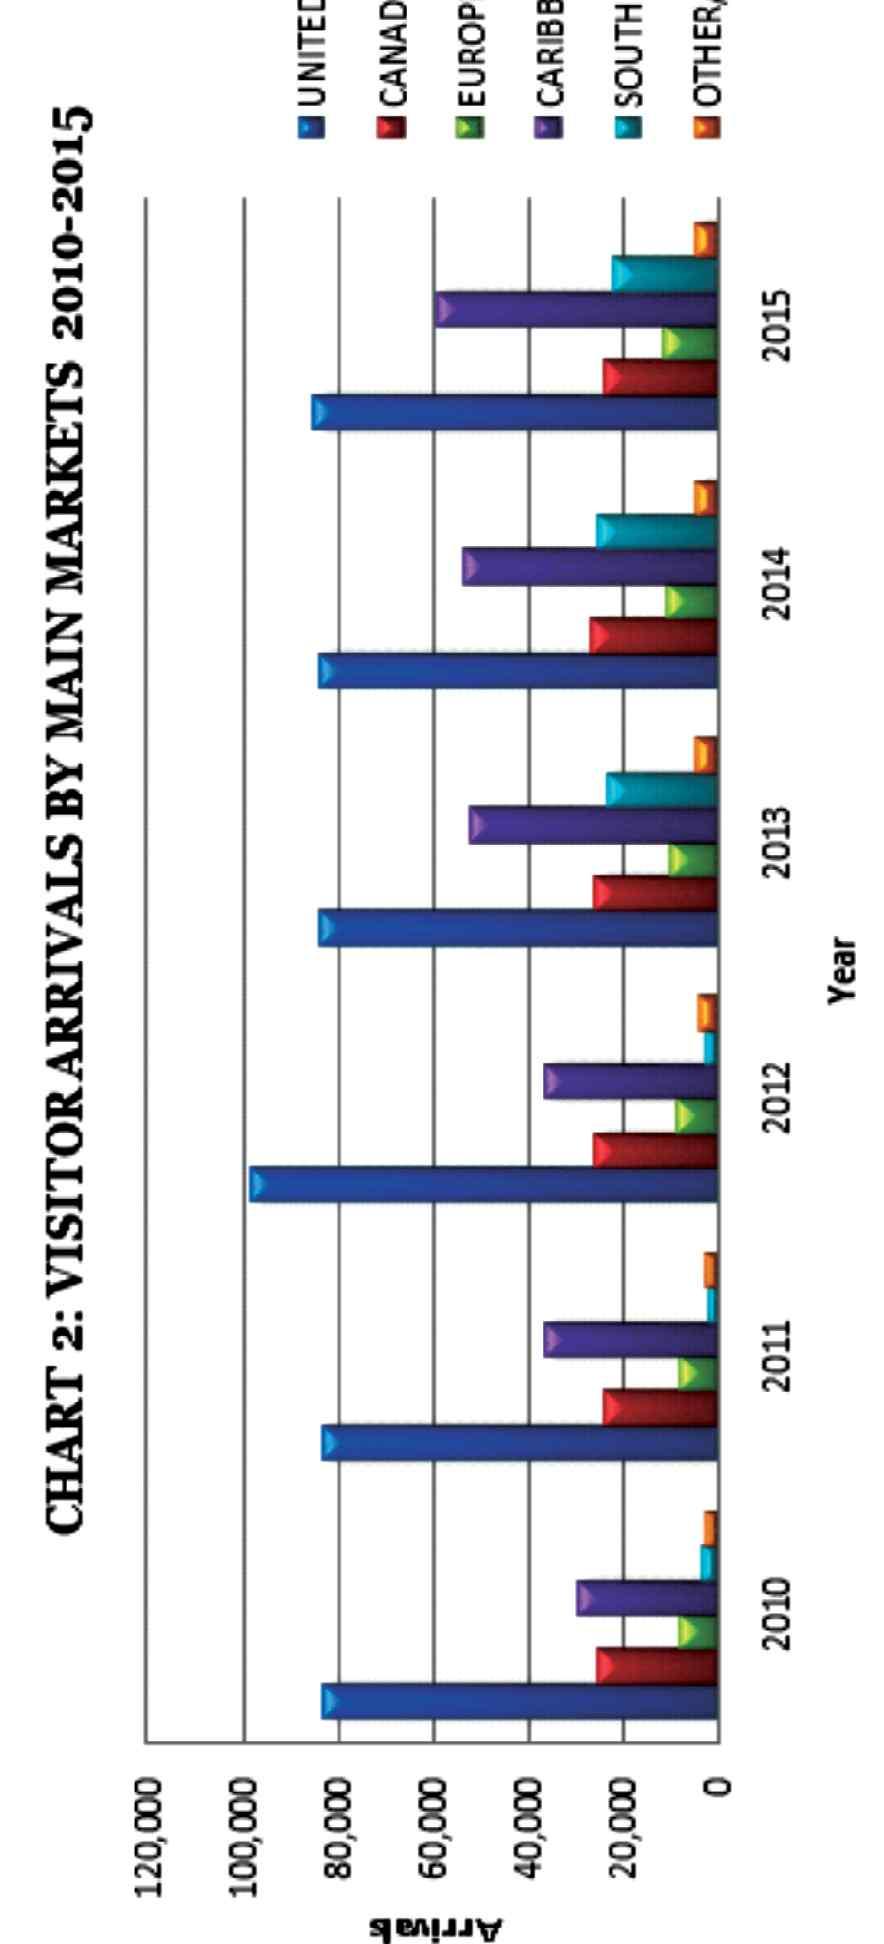
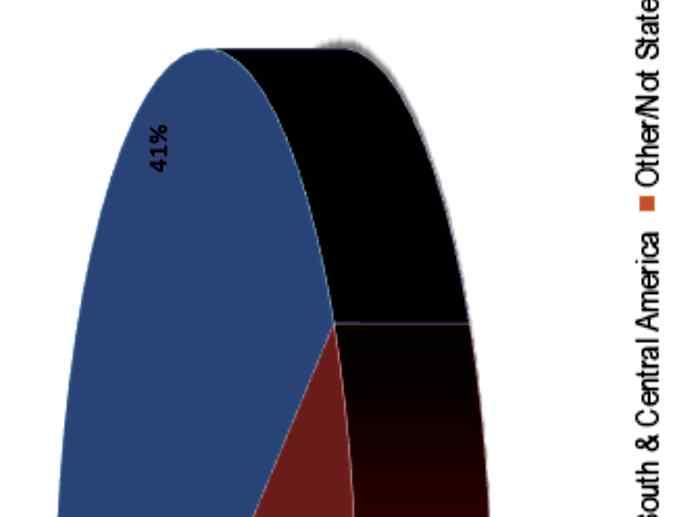
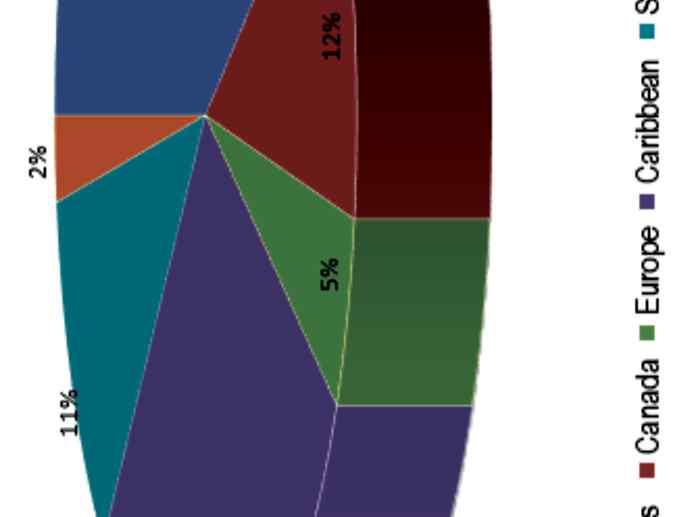
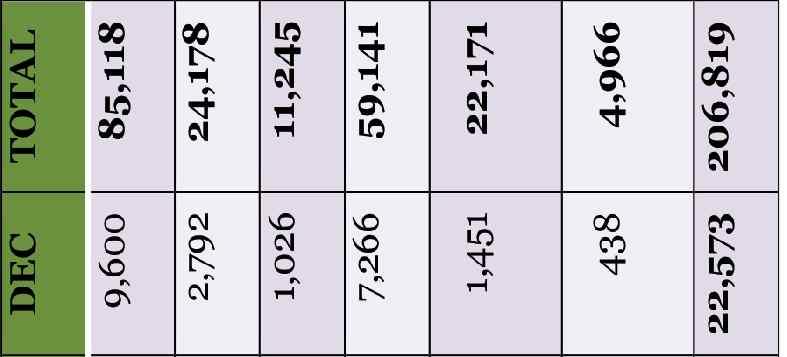
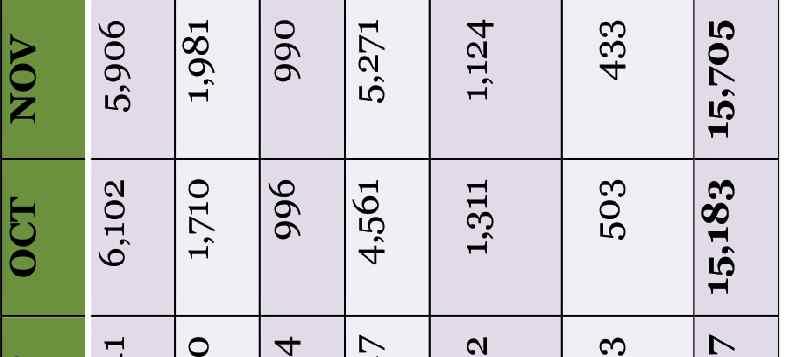
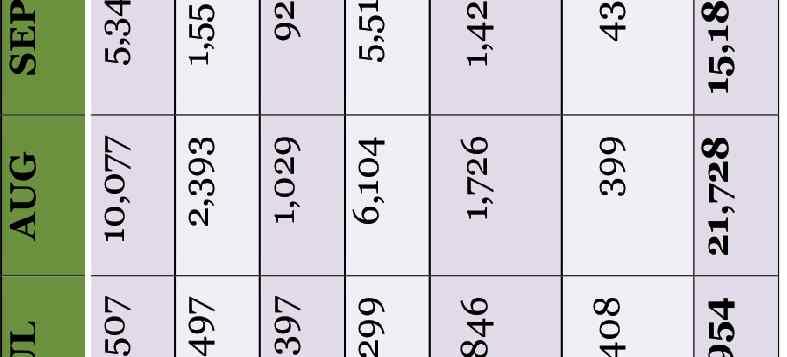
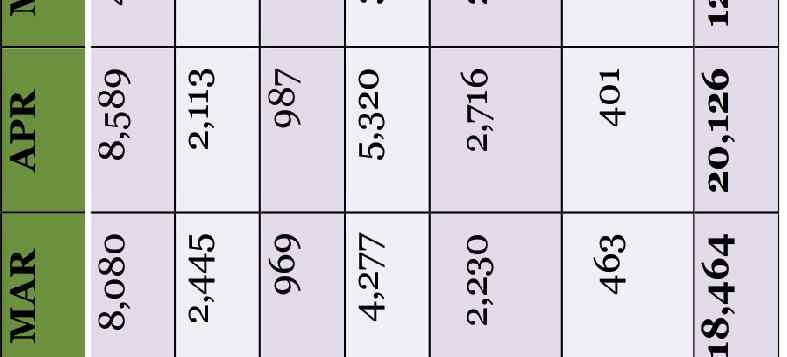
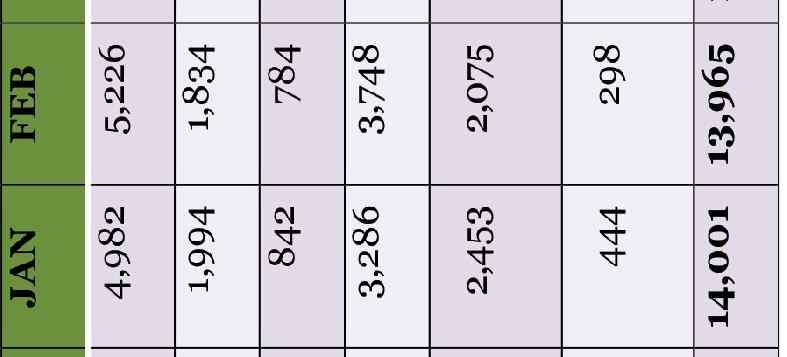
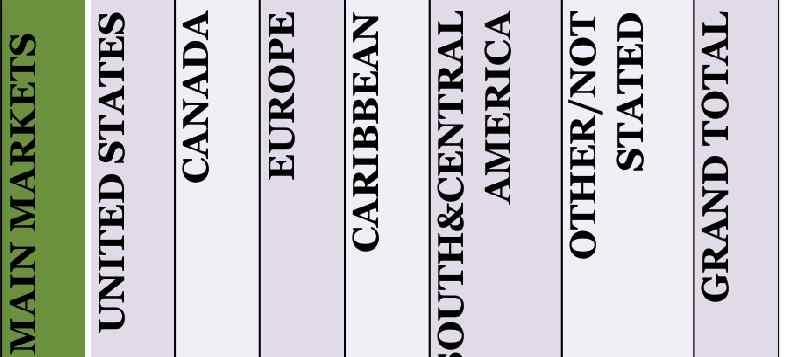
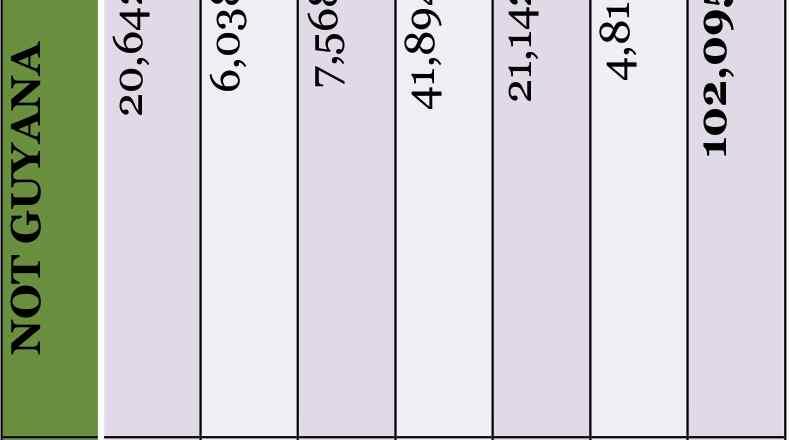
8 ANALYSIS VISITOR ARRIVALS BY MONTHS 2010 to 2015 As seen in Table 1 and Chart 1, the months of March, April, July, August and December consistently recorded the highest visitor arrivals, as such these months are referred to as peak periods. In 2015 April, July, August and December recorded 42.2% of total visitor arrivals for the year followed by March, September, October and November with 31.2% and January, February, May and June with 26.5%. VISITOR ARRIVALS BY MAIN MARKETS 2010 to 2015 Table 2 and Chart 2 show visitor arrivals trend by main markets for the period 2010 to The USA market has consistently recorded high figures over the said period with the highest figure being recorded in The Caribbean figures have consistently increased over the period with a slight decline in Visitor arrivals from Canada have fluctuated over the period, while South and Central America figures sharply increased from Europe had continued increases with the exception of Guyana's main markets with percentage share as shown in Chart 3 are the United States of America (USA) with 41.2%, the Caribbean with 28.6%, Canada with 11.7%, South and Central America with 10.7%, Europe with 5.4% and Other/Not Stated with 2.4%. VISITOR ARRIVALS BY MAIN MARKETS AND MONTHS 2015 As shown in Table 3 total visitor arrivals from the USA was recorded as 85,118 followed by the Caribbean with 59,141, Canada with 24,178, South and Central America with 22,171, Europe with 11,245 and Other/ Not Stated with 4,966 visitors. Most Visitors from USA, Canada, the Caribbean and Europe came to Guyana during the months of July, August and December. Most South and Central America visitors came during the January to May and September to October periods. VISITOR ARRIVALS BY MARKETS AND BIRTH PLACE 2015 As can be seen in Tables 4, 50.3% of total visitors were born in Guyana; 49.4% were not born in Guyana and 0.3% did not state their place of birth. The highest number of Guyanese came from USA and Canada, while the highest number of visitors not born in Guyana came from the Caribbean and USA. VISITOR ARRIVALS FROM USA 2010 to 2015 As seen in Tables 5 and 6, the top ten USA states are New York, Florida, New Jersey, Maryland, Georgia, Texas, Connecticut, Pennsylvania, California and Virginia. For 2015 New York accounted for 60.8% of total visitors from the USA followed by Florida with 10.6%, New Jersey with 7.5%, Maryland with 2.9%, Georgia with 2.5%, Texas with 1.7%, Connecticut with 1.4%, Pennsylvania with 1.3%, California with 1.1%, Virginia with 0.9% and the rest of the states accounted for 9.3%. VISITOR ARRIVALS FROM CANADA 2010 to 2015 For 2015 (see Tables 7 and 8) Ontario recorded the highest figures for Canada with a percentage share of 92. Ontario was followed by Alberta with 2.2%, Quebec with 1.9%, British Columbia with 1.3%, Manitoba with 0.8%, Nova Scotia with 0.3%, New Foundland with 0.2%, Saskatchewan with 0.2%, New Brunswick with 0.1% and the rest of the provinces accounted for 1%. PAGE 3
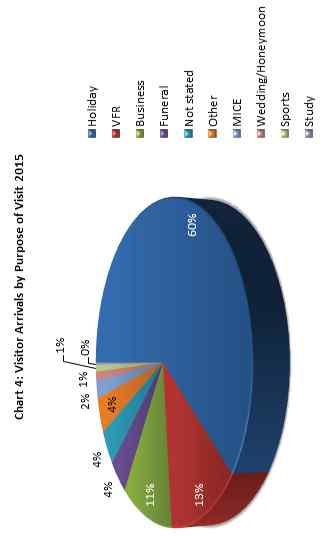
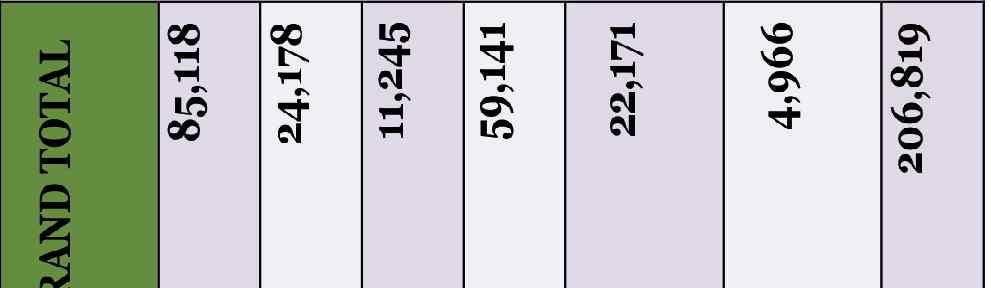
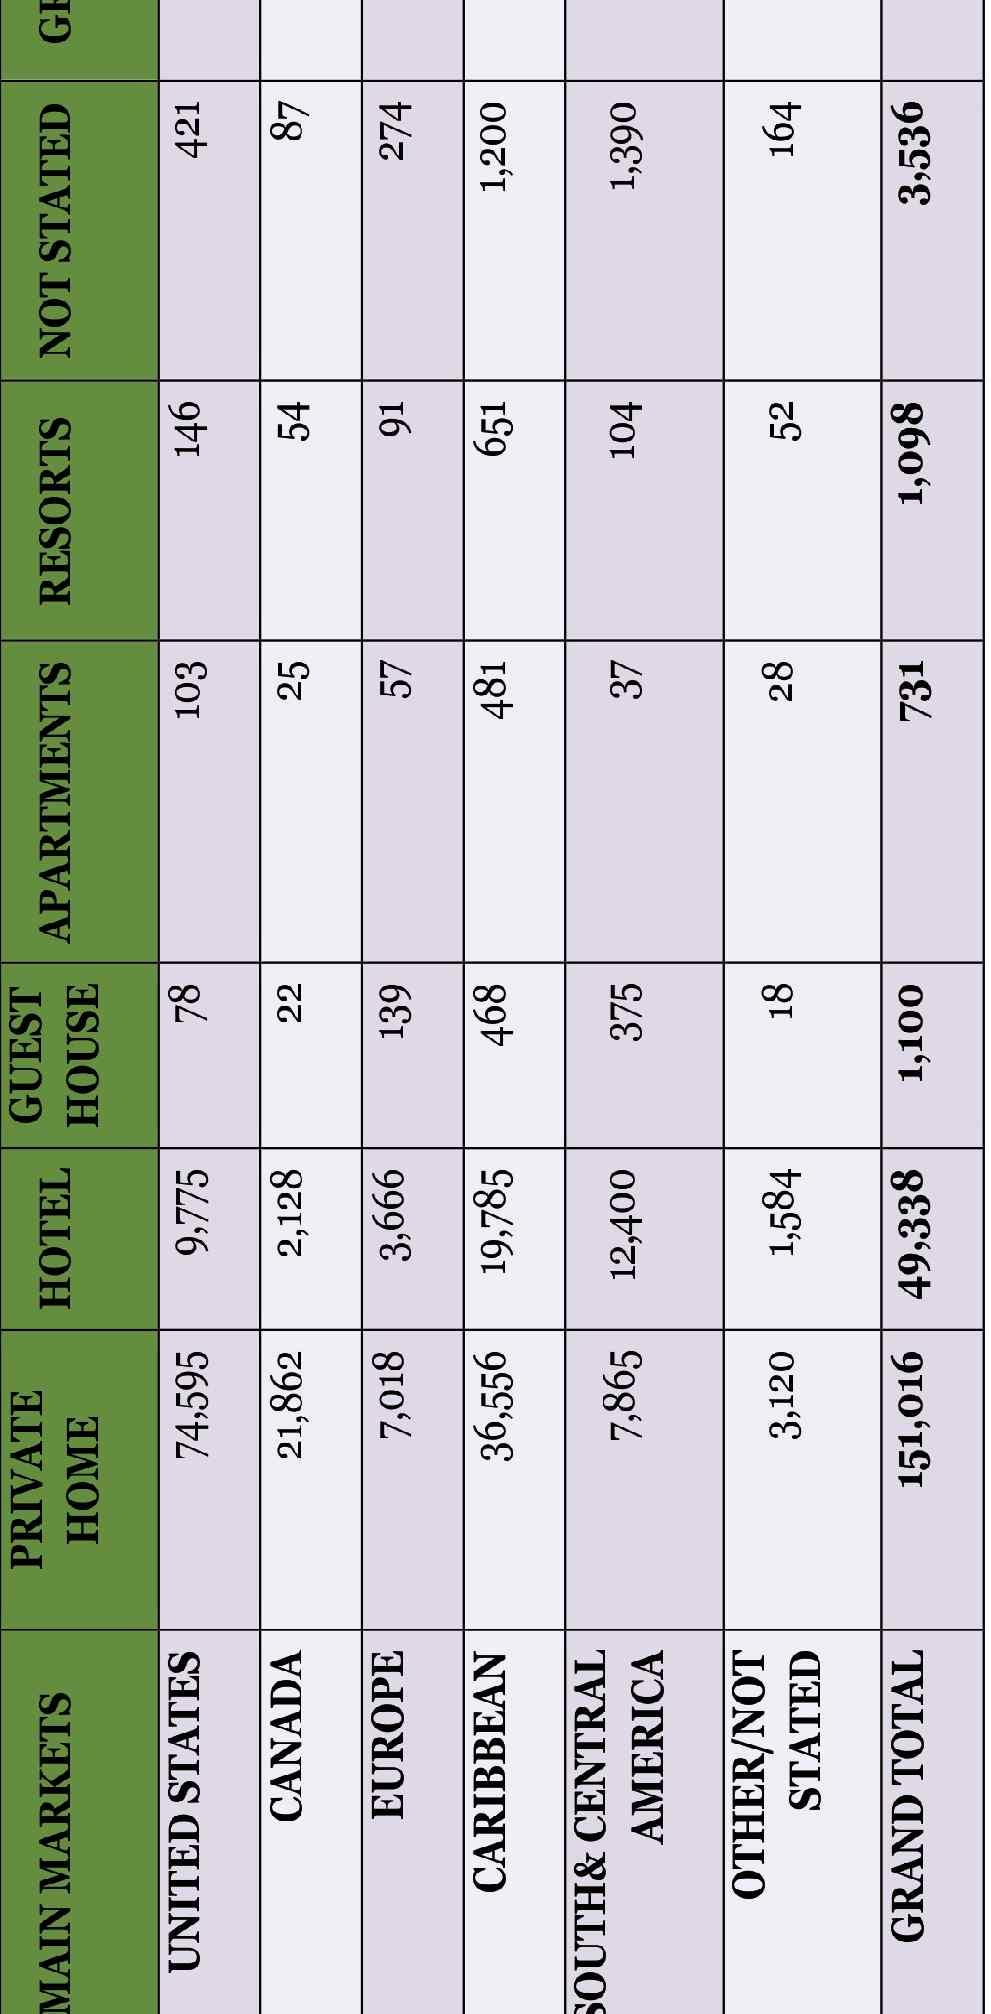
9 VISITOR ARRIVALS FROM EUROPE 2010 to 2015 For 2015 (see Tables 9 and 10) United Kingdom (UK) recorded the highest figures for Europe with a 57.2 percentage share. The UK was followed by Holland with 16.3%, Russian Federation with 4%, Germany with 3.8%, France with 3.8%, Belgium with 1.7%, Switzerland with 1.4%, Denmark with 1.4%, Sweden with 1.2% and the rest of Europe with 9.2%. VISITOR ARRIVALS FROM THE CARIBBEAN 2010 to 2015 For 2015 (see Tables 11 and 12) Suriname recorded the highest figures for the Caribbean with a percentage share of Suriname was followed by Trinidad and Tobago with 28.6%, Barbados with 11.5%, Cuba with 9%, Jamaica with 4.1%, Antigua and Barbuda with 3.5%, St. Lucia with 2%, British Virgin Islands with 1.6%, St. Maarten with 1.5% and the rest of the Caribbean with 9.6%. VISITOR ARRIVALS FROM SOUTH AND CENTRAL AMERICA 2010 to 2015 For 2015 (see Table 13 and 14) Brazil recorded the highest figures for South and Central America with a percentage share of Brazil was followed by Venezuela with 19.6%, Peru with 10%, French Guiana with 7.2%, Colombia with 1.4%, Panama with 1.2%, Mexico with 1%, Costa Rica with 1%, Chile with 0.9% and the rest of South and Central America with 7.2%. VISITOR ARRIVALS BY PORTS OF ENTRY 2010 to 2015 For 2015 (see Table 15) CJIA accounted for 76.9% of total visitors followed by Moleson Creek with 11.4%, 7% for Ogle and 4.7% for Lethem. Tables 16, 17, 18 and 19 shows visitor arrivals from four main ports of entry along with their percentage change over the period. The Cheddi Jagan International Airport recorded a 1.6% increase in 2015 over 2014, Lethem recorded a 6.3 decrease over 2014, Moleson Creek recorded a 15.4 decrease over 2014 and Eugene F. Correia International Airport recorded a 31.6% increase over VISITOR ARRIVALS BY CARRIER, LAND BORDER AND SEA 2015 Table 20 shows visitor arrivals by aircraft, land border and sea. A total of 173,400 or 84% of total arrivals were by aircraft. Caribbean Airlines accounted for 61% of the arrivals by aircraft; followed by Dynamic Air, Fly Jamaica, LIAT and COPA with 30% and Insel Air, Suriname Airways, Gum Air, CONVIASA, Other Carrier and Delta Airlines with 9%. A total of 9,791 or 5% of total arrivals were made through land border crossing, while 23,628 or 11% of total arrivals were by sea. VISITOR ARRIVALS BY PURPOSE OF VISIT 2015 For 2015 (as shown in Table 21 and Chart 4) a total of 124,700 or 60% of visitors came to Guyana for Holiday, 24% for Visiting Friends and Relatives and Business, 12% for Funeral, Other/ Not Stated, and 4% for MICE, Wedding/Honeymoon, Sports and Study. VISITOR ARRIVALS BY TYPE OF ACCOMMODATION 2015 Private Homes accounted for 73% of total visitors who used accommodation, 23.9% used Hotels, 1.7% did not state where they stayed, 0.5% used Guest Houses, 0.5% used Resorts and 0.4% stayed in Apartments. As seen in Table 22 most USA, Canadian, Caribbean, European and Other visitors stayed at Private Homes, while most South and Central America visitors stayed at Hotels. PAGE 4
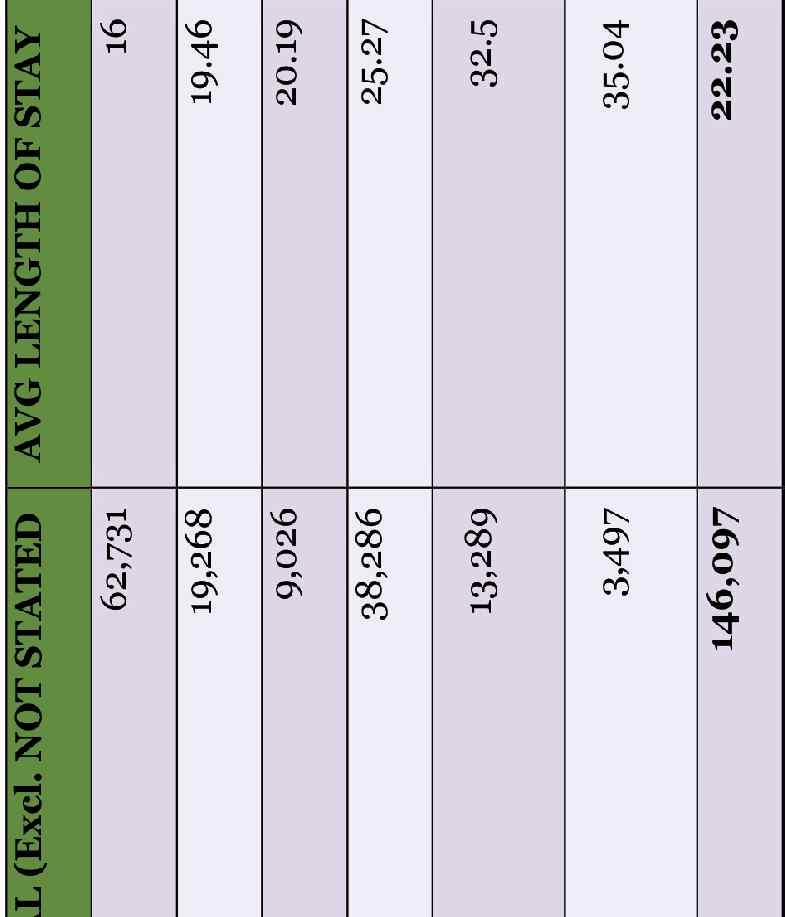
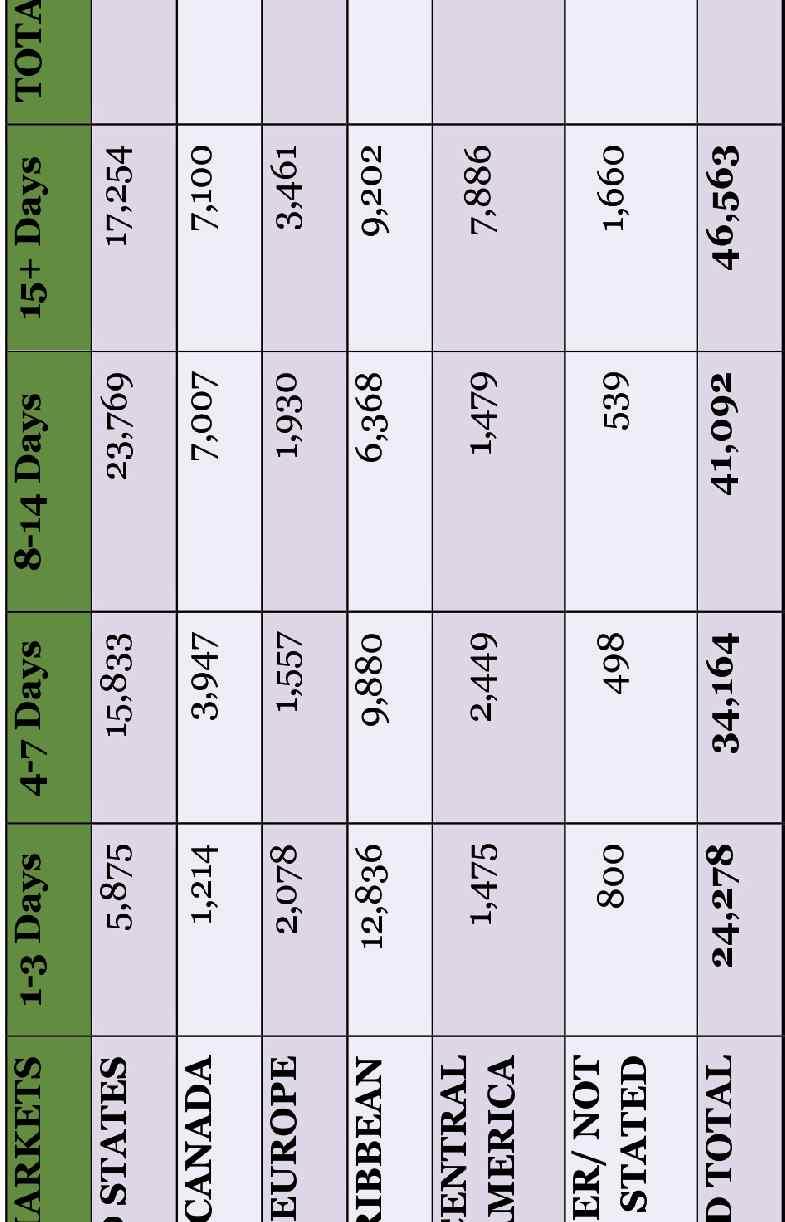
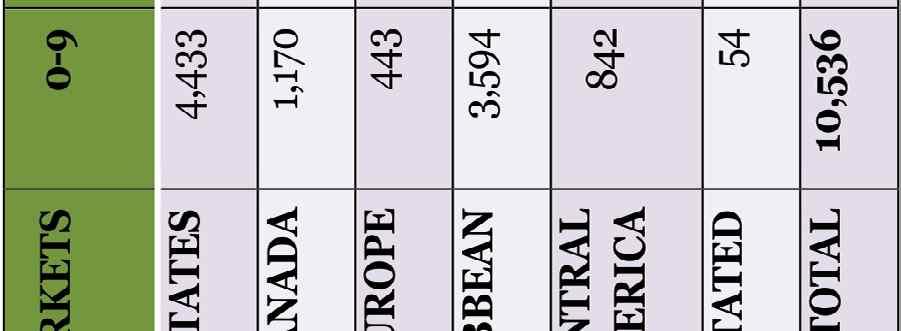
10 VISITOR ARRIVALS BY LENGTH OF STAY 2015 Length of stay is obtained by dividing the number of overnight stays by the number of arrivals. Total length of stay excluding Not Stated and Same Day visitors in 2015 (see Table 23) was recorded as 146,097 days with average length of stay being 22 days. Average length of stay was highest for South and Central America with 33 days, the Caribbean with 25 days, Europe with 20 days, Canada with 19 days and USA with 16 days. VISITOR ARRIVALS BY GENDER AND AGE RANGE 2015 For 2015 (as shown in Table 24 and Chart 5), 54.7% of the visitors were males, while 45.2% were females. For 2015 (as shown in Table 25) a total of 144,039 or 70% of the visitors were between the ages of 30 and 69, 12% were between 20 and 29, 6% between 10 and 19, 5% between 0 and 9, 5% between 70 and 79 and 2% were between 80 and 99 and not stated. PAGE 5


11 PAGE 6
12 CHART 1: VISITOR ARRIVALS BY MONTH TABLE 2: VISITOR ARRIVALS BY MAIN MARKETS PAGE 7

13 PAGE 8


14 PAGE 9
15 TABLE 5: VISITOR ARRIVALS FROM USA BY TOP 10 STATES PAGE 10
16 PAGE 11 TABLE 6: VISITOR ARRIVALS FROM USA BY ALL STATES


17 TABLE 6: VISITOR ARRIVALS FROM USA BY ALL STATES Cont'd PAGE 12
18 TABLE 7: VISITOR ARRIVALS FROM CANADA BY TOP 9 PROVINCES TABLE 8: VISITOR ARRIVALS FROM CANADA BY ALL PROVINCES PAGE 13
19 TABLE 9: VISITOR ARRIVALS FROM EUROPE BY TOP 9 COUNTRIES TABLE 10: VISITOR ARRIVALS FROM EUROPE BY ALL COUNTRIES PAGE 14
20 PAGE 15 TABLE 10: VISITOR ARRIVALS FROM EUROPE BY ALL COUNTRIES Cont'd
21 TABLE 11: VISITOR ARRIVALS FROM THE CARIBBEAN BY TOP 9 COUNTRIES PAGE 16

22 TABLE 12: VISITOR ARRIVALS FROM THE CARIBBEAN BY ALL COUNTRIES PAGE 17
23 TABLE 12: VISITOR ARRIVALS FROM THE CARIBBEAN BY ALL COUNTRIES cont'd TABLE 13: VISITOR ARRIVALS FROM SOUTH AND CENTRAL AMERICA BY TOP 9 COUNTRIES PAGE 18
24 PAGE 19 TABLE 14: VISITOR ARRIVALS FROM SOUTH AND CENTRAL AMERICA BY ALL COUNTRIES

25 TABLE 15: VISITOR ARRIVALS BY PORTS ON ENTRY (2014 vs 2015) TABLE 16: VISITOR ARRIVALS VIA CJIA BY MAIN MARKETS PAGE 20

26 TABLE 17: VISITOR ARRIVALS VIA LETHEM BY MAIN MARKETS TABLE 18: VISITOR ARRIVALS VIA MOLESON CREEK BY MAIN MARKETS TABLE 19: VISITOR ARRIVALS VIA EFCIA BY MAIN MARKETS PAGE 21


27 PAGE 22


28 PAGE 23

29 PAGE 24
30 PAGE 25 TABLE 24:VISITOR ARRIVALS BY GENDER 2015


31 PAGE 26

32
33 NOTES
GUYANA TOURISM STATISTICAL DIGEST
 GUYANA TOURISM STATISTICAL DIGEST 2016 EDITION GUYANA TOURISM AUTHORITY National Exhibition Centre Sophia, Greater Georgetown 413741 Guyana, South America. Tel: (592) 219-0094-6 E-mail: info@guyana-tourism.com
TOURIST ARRIVALS REPORT
 No. of Arrivals TOURIST ARRIVALS REPORT Stay Over Arrivals by Market (, 217) 16, 14, 12, 1, 8, 6, 4, 2, USA UK Caribbean Canada Rest of Europe Germany France Rest of World 216 13,454 5,969 4,154 5,881
TOURIST ARRIVALS REPORT
 No. of Arrivals TOURIST ARRIVALS REPORT Stay Over Arrivals by Market (March, 217) 18, 16, 14, 12, 1, 8, 6, 4, 2, USA UK Caribbean Canada Rest of Europe Germany France Rest of World 216 15,61 6,61 5,57
TOURIST ARRIVALS REPORT
 No. of Arrivals TOURIST ARRIVALS REPORT Stay Over Arrivals by Market (June, 217) 18, 16, 14, 12, 1, 8, 6, 4, 2, USA UK Caribbean Canada Rest of Europe Germany France Rest of World 216 15,24 3,941 4,425
VISITOR ARRIVALS REPORT
 No. of Arrivals VISITOR ARRIVALS REPORT Stay Over Arrivals by Market (September, 217) 9, 8, 7, 6, 5, 4, 3, 2, 1, USA UK Caribbean Canada Rest of Europe Germany France 216 7,91 3,874 4,36 1,134 374 6 114
TABLE 1 VISITOR ARRIVALS. Total Visitor Arrivals +/ Month / / /18
 TABLE 1 VISITOR ARRIVALS Stopover Arrivals +/ Cruise Passengers +/ Total Visitor Arrivals +/ Month 2018 2019 2019/18 2018 2019 2019/18 2018 2019 2019/18 January 194,609 216,509 11.3% 249,635 249,239 0.2%
2016 October - December
 2016 October - December TOURIST ARRIVAL QUARTERLY REPORT Research and Statistics Department Ministry of Tourism, Economic Development, Investment & Energy Statistics Division 1 P a g e Foreword This report
TOURIST (Stopover Arrivals) Europe. United States. Canada. Latin America. Monthly Statistical Report
 Europe. United States. Canada. Latin America. Monthly Statistical Report") J 2018 V XXV, I 1 Monthly Statistical Report IN 2018 Stopover arrivals up 4.7% US Market up 7.2% Canada up 2.0% Europe up 0.7% Cruise Passenger up by 21.3% TOURIST (Stopover Arrivals) Stopover arrivals
J 2018 V XXV, I 1 Monthly Statistical Report IN 2018 Stopover arrivals up 4.7% US Market up 7.2% Canada up 2.0% Europe up 0.7% Cruise Passenger up by 21.3% TOURIST (Stopover Arrivals) Stopover arrivals
TOURIST (Stopover Arrivals) Europe. United States. Canada. Latin America. Monthly Statistical Report
 Europe. United States. Canada. Latin America. Monthly Statistical Report") J 2017 V XXV, I 1 Monthly Statistical Report IN 2017 Stopover arrivals up 3.5% US Market up 1.9% Canada up 6.3% Europe up 7.8% Cruise Passenger up by 10.2% TOURIST (Stopover Arrivals) Stopover arrivals
J 2017 V XXV, I 1 Monthly Statistical Report IN 2017 Stopover arrivals up 3.5% US Market up 1.9% Canada up 6.3% Europe up 7.8% Cruise Passenger up by 10.2% TOURIST (Stopover Arrivals) Stopover arrivals
CARIBBEAN TOURISM STATISTICAL REPORT Edition
 CARIBBEAN TOURISM STATISTICAL REPORT 2016 Edition CARIBBEAN TOURISM ORGANIZATION Seventh Floor, Baobab Tower Warrens, St Michael, BB22026 Barbados Tel.: (246) 427-5242 Website: www.onecaribbean.org E-mail:
3rd QUARTER STATISTICAL REPORT
 3rd QUARTER STATISTICAL REPORT RESEARCH DEPARTMENT 2015 OVERVIEW OF SOURCE MARKETS For the 3rd Quarter of 2015, some 129,050 tourists visited the shores of Barbados. This represented a 14.9% increase or
TOURIST (Stopover Arrivals) Europe. United States. Latin America. Canada. Monthly Statistical Report
 Europe. United States. Latin America. Canada. Monthly Statistical Report") F 2017 V XXV, I 2 Monthly Statistical Report IN FEBRUARY 2017 Stopover arrivals up 0.8% US Market flat -0.4% Canada up 2.6% Europe down 1.4% Cruise Passenger down by 2.4% TOURIST (Stopover Arrivals) Stopover
F 2017 V XXV, I 2 Monthly Statistical Report IN FEBRUARY 2017 Stopover arrivals up 0.8% US Market flat -0.4% Canada up 2.6% Europe down 1.4% Cruise Passenger down by 2.4% TOURIST (Stopover Arrivals) Stopover
TOURIST (Stopover Arrivals) Europe. United States. Latin America. Canada. Monthly Statistical Report USA 64.4% Canada 16.9% UK 9.4% All Other 2.
 Europe. United States. Latin America. Canada. Monthly Statistical Report USA 64.4% Canada 16.9% UK 9.4% All Other 2.") N 2017 V XXV, I 11 Monthly Statistical Report IN NOVEMBER 2017 Stopover arrivals up 14.7% US Market up 18.6% Canada up 12.5% Europe up 5.2% Cruise Passenger up by 47.2% TOURIST (Stopover Arrivals) Stopover
N 2017 V XXV, I 11 Monthly Statistical Report IN NOVEMBER 2017 Stopover arrivals up 14.7% US Market up 18.6% Canada up 12.5% Europe up 5.2% Cruise Passenger up by 47.2% TOURIST (Stopover Arrivals) Stopover
TOURIST (Stopover Arrivals) Europe. United States. Canada. Latin America. Monthly Statistical Report USA 66.5% Canada 16.5% UK 8.2% All. Other 2.
 Europe. United States. Canada. Latin America. Monthly Statistical Report USA 66.5% Canada 16.5% UK 8.2% All. Other 2.") J 2018 V XXV, I 7 Monthly Statistical Report IN JULY 2018 Stopover arrivals up 3.4% US Market up 4.6% Canada down 2.0% Europe down 0.2% Cruise Passenger down by 5.4% TOURIST (Stopover Arrivals) Stopover
J 2018 V XXV, I 7 Monthly Statistical Report IN JULY 2018 Stopover arrivals up 3.4% US Market up 4.6% Canada down 2.0% Europe down 0.2% Cruise Passenger down by 5.4% TOURIST (Stopover Arrivals) Stopover
TOURIST ARRIVAL: QUARTERLY REPORT
 2016 Jul-Sept TOURIST ARRIVAL: QUARTERLY REPORT Research and Statistics Department Ministry of Tourism, Economic Development, Investment & Energy Statistics Division 1 P a g e Foreword This report provides
TOURIST (Stopover Arrivals) Europe. United States. Canada. Latin America. Monthly Statistical Report USA 66.0% Canada 15.9% UK 8.8% All Other 2.
 Europe. United States. Canada. Latin America. Monthly Statistical Report USA 66.0% Canada 15.9% UK 8.8% All Other 2.") N 2018 V XXV, I 11 Monthly Statistical Report IN NOVEMBER 2018 Stopover arrivals up 5.1% US Market up 9.0% Canada down 6.5% Europe up 4.6% Cruise Passenger down by 26.1% TOURIST (Stopover Arrivals) Stopover
N 2018 V XXV, I 11 Monthly Statistical Report IN NOVEMBER 2018 Stopover arrivals up 5.1% US Market up 9.0% Canada down 6.5% Europe up 4.6% Cruise Passenger down by 26.1% TOURIST (Stopover Arrivals) Stopover
TOURIST (Stopover Arrivals) Europe. United States. Latin America. Canada. Monthly Statistical Report USA 64.2% Canada 17.2% UK 9.3% All Other 2.
 Europe. United States. Latin America. Canada. Monthly Statistical Report USA 64.2% Canada 17.2% UK 9.3% All Other 2.") D 2017 V XXV, I 12 Monthly Statistical Report IN DECEMBER 2017 Stopover arrivals up 9.3% US Market up 9.4% Canada up 10.5% Europe up 9.0% Cruise Passenger up by 14.2% TOURIST (Stopover Arrivals) Stopover
D 2017 V XXV, I 12 Monthly Statistical Report IN DECEMBER 2017 Stopover arrivals up 9.3% US Market up 9.4% Canada up 10.5% Europe up 9.0% Cruise Passenger up by 14.2% TOURIST (Stopover Arrivals) Stopover
TOURIST (Stopover Arrivals) Europe. United States. Latin America. Canada. Monthly Statistical Report USA 65.0% Canada 16.7% UK 9.2% All Other 2.
 Europe. United States. Latin America. Canada. Monthly Statistical Report USA 65.0% Canada 16.7% UK 9.2% All Other 2.") S 2017 V XXV, I 9 Monthly Statistical Report IN SEPTEMBER 2017 Stopover arrivals up 9.2% US Market up 3.2% Canada up 25.6% Europe up 20.5% Cruise Passenger up by 54.1% TOURIST (Stopover Arrivals) Stopover
S 2017 V XXV, I 9 Monthly Statistical Report IN SEPTEMBER 2017 Stopover arrivals up 9.2% US Market up 3.2% Canada up 25.6% Europe up 20.5% Cruise Passenger up by 54.1% TOURIST (Stopover Arrivals) Stopover
TOURIST ARRIVALS REPORT
 No. of Arrivals TOURIST ARRIVALS REPORT Stay Over Arrivals by Market (February 2016) 16,000 14,000 12,000 10,000 8,000 6,000 4,000 2,000 0 USA UK Caribbean Canada Rest of Europe Germany France Rest of
TOURIST (Stopover Arrivals) Europe. United States. Canada. Latin America. Monthly Statistical Report USA 66.4% Canada 15.8% UK 8.6% All Other 2.
 Europe. United States. Canada. Latin America. Monthly Statistical Report USA 66.4% Canada 15.8% UK 8.6% All Other 2.") S 2018 V XXV, I 9 Monthly Statistical Report IN SEPTEMBER 2018 Stopover arrivals up 2.7% US Market up 11.0% Canada down 16.7% Europe down 7.4% Cruise Passenger down by 36.5% TOURIST (Stopover Arrivals)
S 2018 V XXV, I 9 Monthly Statistical Report IN SEPTEMBER 2018 Stopover arrivals up 2.7% US Market up 11.0% Canada down 16.7% Europe down 7.4% Cruise Passenger down by 36.5% TOURIST (Stopover Arrivals)
TOURIST ARRIVALS REPORT
 No. of Arrivals TOURIST ARRIVALS REPORT Stay Over Arrivals by Market (May 2016) 16,000 14,000 12,000 10,000 8,000 6,000 4,000 2,000 0 USA UK Caribbean Canada Rest of Europe Germany France Rest of World
Tourism Snapshot. A focus on the markets that the CTC and its partners are active in. July 2011 Volume 7, Issue 7.
 Tourism Snapshot Echo Valley Ranch and Spa, British Columbia A focus on the markets that the CTC and its partners are active in www.canada.travel/corporate July 2011 Volume 7, Issue 7 Key highlights In
DEVELOPMENT AID AT A GLANCE
 DEVELOPMENT AID AT A GLANCE STATISTICS BY REGION 3. AMERICA 2018 edition All the data in this report are available at: http://www.oecd.org/dac/financing-sustainable-development/ 3.1. ODA TO AMERICA - SUMMARY
Tourism snapshot Canadian Tourism Commission
 Canadian Tourism Commission Commission canadienne du tourisme Tourism snapshot www.canada.travel A focus on the markets that the CTC and its partners are active in Volume 5, Issue 04 Key highlights Following
Tourism Snapshot A focus on the markets that the CTC and its partners are active in
 Tourism Snapshot A focus on the markets that the CTC and its partners are active in Nahanni National Park, NWT www.canada.travel/corporate February 2012 Volume 8, Issue 2 Key highlights Following through
Tourism Snapshot A focus on the markets that the CTC and its partners are active in
 Tourism Snapshot A focus on the markets that the CTC and its partners are active in www.canada.travel/corporate February 2011 Volume 7, Issue 2 Key highlights In the first two months of 2011 overnight
Monthly Update - Aruba s Tourism Industry: November 2016 and Year to Date 2016
 Summary Highlights. MONTHLY UPDATE - ARUBA S TOURISM INDUSTRY November 2016 and Year to Date 2016 The total number of stopovers visiting Aruba decreased by 28.7% in November, from 110,307 in November 2015
Monthly Update - Aruba s Tourism Industry: October 2016 and Year to Date 2016
 Summary Highlights. MONTHLY UPDATE - ARUBA S TOURISM INDUSTRY October 2016 and Year to Date 2016 The total number of stopovers visiting Aruba decreased by 29.8% in October, from 109,024 in October 2015
Tourism Snapshot A focus on the markets that the CTC and its partners are active in Ontario June 2011 Volume 7, Issue 6
 Tourism Snapshot Ontario A focus on the markets that the CTC and its partners are active in www.canada.travel/corporate June 2011 Volume 7, Issue 6 Key highlights In June 2011, overnight travel to Canada
Tourism Snapshot A focus on the markets that the CTC and its partners are active in
 Tourism Snapshot A focus on the markets that the CTC and its partners are active in Newfoundland and Labrador www.canada.travel/corporate October 2011 Volume 7, Issue 10 Key highlights In October 2011,
Tourism Snapshot. A focus on the markets in which the CTC and its partners are active. October 2012 Volume 8, Issue 10.
 Tourism Snapshot Niagara Helicopters Tour A focus on the markets in which the CTC and its partners are active www.canada.travel/corporate October 2012 Volume 8, Issue 10 Total arrivals from CTC s international
Monthly Update - Aruba s Tourism Industry: August 2017 and 2017 YTD. MONTHLY UPDATE - ARUBA S TOURISM INDUSTRY August 2017 and Year to Date 2017.
 MONTHLY UPDATE - ARUBA S TOURISM INDUSTRY August 2017 and Year to Date 2017. Total stopovers fell by 5.7% in August. Summary Highlights. The total number of stopovers visiting Aruba fell by 5.7% in August
Tourism Snapshot. June 2015 Volume 11, Issue 6. A focus on the markets in which Destination Canada (DC) and its partners are active.
 and its partners are active.") Tourism Snapshot Tourism PEI / Paul Baglole A focus on the markets in which Destination Canada (DC) and its partners are active. www.destinationcanada.com June Volume 11, Issue 6 Key highlights Over the
Tourism Snapshot Tourism PEI / Paul Baglole A focus on the markets in which Destination Canada (DC) and its partners are active. www.destinationcanada.com June Volume 11, Issue 6 Key highlights Over the
DEVELOPMENT AID AT A GLANCE
 DEVELOPMENT AID AT A GLANCE STATISTICS BY REGION 3. AMERICA 26 edition 3.. ODA TO AMERICA - SUMMARY 3... Top ODA receipts by recipient USD million, net disbursements in 24 3..3. Trends in ODA Colombia
Published by the Caribbean Tourism Organization (CTO), All rights reserved.
, All rights reserved.") Copyright 2016, Caribbean Tourism Organization (CTO) Published by the Caribbean Tourism Organization (CTO), 2016. All rights reserved. The designations employed and the presentation of material in this
Copyright 2016, Caribbean Tourism Organization (CTO) Published by the Caribbean Tourism Organization (CTO), 2016. All rights reserved. The designations employed and the presentation of material in this
Tourism Snapshot A focus on the markets in which the CTC and its partners are active
 Tourism Snapshot A focus on the markets in which the CTC and its partners are active www.canada.travel/corporate June Volume 1, Issue 6 Key highlights CTC s overseas markets leaped 1% over the same month
Monthly Update - Aruba s Tourism Industry: October 2017 and 2017 YTD. MONTHLY UPDATE - ARUBA S TOURISM INDUSTRY October 2017 and Year to Date 2017.
 MONTHLY UPDATE - ARUBA S TOURISM INDUSTRY October 2017 and Year to Date 2017. Summary Highlights. Total stopovers grew by 6.5% in October. The total number of stopovers visiting Aruba grew by 6.5% in October
TOURIST ARRIVAL: YEAR IN REVIEW
 215 TOURIST ARRIVAL: YEAR IN REVIEW Research and Statistics Department Ministry of Tourism, Economic Development, Investment & Energy Statistics Division Page 1 Foreword This report provides a quantitative
Tourism Snapshot. A focus on the markets in which the CTC and its partners are active. February 2015 Volume 11, Issue 2.
 Tourism Snapshot Tourism Whistler/Mike Crane A focus on the markets in which the CTC and its partners are active www.canada.travel/corporate February Volume 11, Issue 2 Key highlights The strong beginning
Statistical Overview of the Canadian Honey Industry 2013
 Statistical Overview of the Canadian Honey Industry 2013 Prepared by: Market Analysis and Information Section Horticulture and Cross Sectoral Division Agriculture and Agri-Food Canada September 2014 Her
Latin America and the Caribbean: Fact Sheet on Economic and Social Indicators
 Latin America and the Caribbean: Fact Sheet on Economic and Social Indicators Dindi R. Robinson Barbara Salazar Torreon May 30, 2013 CRS Report for Congress Prepared for Members and Committees of Congress
Fieldwork Dates AmericasBarometer
 Fieldwork Dates AmericasBarometer 2004-2014 This document contains information regarding fieldwork s for the AmericasBarometer project, 2004-2014. Some information may be incomplete and we will up the
Global Arrival Levels
 INTRODUCTION Current status - globally and regionally State of the major economies Individual market performance and prospects Cruise Activity in the Caribbean Hotel Performance Airline Capacity Prognosis
Tourism Snapshot A focus on the markets in which the CTC and its partners are active
 Tourism Snapshot A focus on the markets in which the CTC and its partners are active www.canada.travel/corporate January 214 Volume 1, Issue 1 Key highlights Total arrivals from CTC s international markets
Tourism Snapshot A Monthly Monitor of the Performance of Canada s Tourism Industry
 Tourism Snapshot A Monthly Monitor of the Performance of Canada s Tourism Industry December Volume 12, Issue 12 Michelle Valberg www.destinationcanada.com Tourism Snapshot December 1 KEY HIGHLIGHTS With
Airline Capacity in the Caribbean. Michael Lum Air Service Strategy and Development Consultant Sixel Consulting Group, Inc.
 Airline Capacity in the Caribbean Michael Lum Air Service Strategy and Development Consultant Sixel Consulting Group, Inc. October 2013 2 Today's Discussion How has airline capacity in the Caribbean changed
Tourism Snapshot A focus on the markets in which the CTC and its partners are active
 Tourism Snapshot A focus on the markets in which the CTC and its partners are active www.canada.travel/corporate April Volume 1, Issue 4 Key highlights Total arrivals from CTC s international markets improved
A. Library s Collection Development Objectives B. Curricular Program Description C. New and Expanding Areas of Interest D. Areas of Specialization
 HISTORY COLLECTION GUIDELINES CLASS IFICATION F I. Purpose and Program Description A. Library s Collection Development Objectives The primary purpose of the collection is to support teaching and research
For authorization of the reproduction of CTO works, please contact the CTO at the address and above.
 Copyright 2018, Caribbean Tourism Organization (CTO) Published by the Caribbean Tourism Organization (CTO), 2018. All rights reserved. The designations employed and the presentation of material in this
Tourism Snapshot A focus on the markets in which the CTC and its partners are active
 Tourism Snapshot A focus on the markets in which the CTC and its partners are active www.canada.travel/corporate May Volume 1, Issue 5 Key highlights Total arrivals from CTC s international markets improved
Tourism Snapshot Year-in-review. Facts & Figures 5th edition.
 Tourism Snapshot 2010 Year-in-review Facts & Figures 5th edition www.canada.travel/corporate Tourism highlights In 2010, international visitors made15.9 million overnight trips to Canada, up 1.8% compared
Tourism Snapshot A Monthly Monitor of the Performance of Canada s Tourism Industry
 Tourism Snapshot A Monthly Monitor of the Performance of Canada s Tourism Industry February 2017 Volume 13, Issue 2 www.destinationcanada.com Tourism Snapshot February 2017 1 KEY HIGHLIGHTS Canada welcomed
Appendix A. PHYSICAL, SOCIAL, AND ECONOMIC STATISTICS
 Appendix A. PHYSICAL, SOCIAL, AND ECONOMIC STATISTICS FOR THE CARIBBEAN REGION TABLE A1. CORAL REEF AREA IN THE WIDER CARIBBEAN Estimates of Coral Reef Area Reefs at Risk in the World Atlas of Coral Reefs
For authorization of the reproduction of CTO works, please contact the CTO at the address and above.
 Copyright 2018, Caribbean Tourism Organization (CTO) Published by the Caribbean Tourism Organization (CTO), 2018. All rights reserved. The designations employed and the presentation of material in this
Tourism Snapshot A Monthly Monitor of the Performance of Canada s Tourism Sector
 Tourism Snapshot A Monthly Monitor of the Performance of Canada s Tourism Sector December Volume 14, Issue 12 www.destinationcanada.com Tourism Snapshot December 1 Newfoundland and Labrador Tourism KEY
CARIBBEAN TOURISM ORGANIZATION LATEST STATISTICS 2008
 CARIBBEAN TOURISM ORGANIZATION LATEST STATISTICS 2008 December 9, 2008 Table 1: Tourist (Stop-over) Arrivals in 2008 Period Tourist Arrivals % Change Overall Winter# Summer# Anguilla Jan-Aug 53,077-10.8-13.9-7.0
CARIBBEAN TOURISM ORGANIZATION LATEST STATISTICS December 4, 2014
 CARIBBEAN TOURISM ORGANIZATION LATEST STATISTICS 2014 December 4, 2014 FINAL Destination Table 1: Tourist (Stop-over) Arrivals in 2014 Period Tourist Arrivals % Change Overall Winter# Summer# Anguilla
TABLE OF CONTENTS. Definitions
 TABLE OF CONTENTS TABLE NO. PAGE Definitions iv Introduction v - vi An Overview of 2017 vii - xxvii Summary of Main Indicators 1 1 Visitor Arrivals to Jamaica 2003-2017 2 2 Total Stopover Arrivals by Month
CTO State of the Industry Report Dissecting the Numbers Presented By Ryan Skeete, Director of Research & IT (ag) February 16 th, 2016
 February 16 th, 2016") CTO State of the Industry Report 2015 - Dissecting the Numbers Presented By Ryan Skeete, Director of Research & IT (ag) February 16 th, 2016 Overview: I am going to discuss the Caribbean tourism performance
CTO State of the Industry Report 2015 - Dissecting the Numbers Presented By Ryan Skeete, Director of Research & IT (ag) February 16 th, 2016 Overview: I am going to discuss the Caribbean tourism performance
BC JOBS PLAN ECONOMY BACKGROUNDER. Current statistics show that the BC Jobs Plan is working: The economy is growing and creating jobs.
 We know that uncertainty continues to remain in the global economy and we expect to see some monthly fluctuations in jobs numbers. That is why we will continue to create an environment that is welcoming
Tourism Snapshot A Monthly Monitor of the Performance of Canada s Tourism Industry
 Tourism Snapshot A Monthly Monitor of the Performance of Canada s Tourism Industry October 2018 Volume 14, Issue 9 Brian Caissie www.destinationcanada.com Tourism Snapshot October 2018 1 KEY HIGHLIGHTS
Tourism Snapshot A Monthly Monitor of the Performance of Canada s Tourism Industry
 Tourism Snapshot A Monthly Monitor of the Performance of Canada s Tourism Industry December 2015 Volume 11, Issue 12 www.destinationcanada.com Tourism Snapshot December 2015 1 2 Tourism Snapshot December
Organisation of Eastern Caribbean States Secretariat OECS EXTERNAL MERCHANDISE TRADE ANNUAL REPORT 1998
 Organisation of Eastern Caribbean States Secretariat OECS EXTERNAL MERCHANDISE TRADE ANNUAL REPORT 1998 December 1999 ii PREFACE After a hiatus during which the OECS Secretariat underwent significant changes
Sprint Real Solutions VPN SDS International Rates from the U.S. Mainland, Hawaii, Puerto Rico, and the U.S. Virgin Islands 1*
 1* The international rates below apply to calls from the U.S. Mainland, Hawaii, Puerto Rico, and the U.S. Virgin Islands where available. The rates, which are shown below in full minute increments, are
Caribbean Tourism Review
 Thousands PERCENTAGE Caribbean Tourism Review 1. Global Performance Worldwide international arrivals in the first eight months reached 781 million, 36 million more than in the same period of 2013 according
Tourism Snapshot A Monthly Monitor of the Performance of Canada s Tourism Industry
 Tourism Snapshot A Monthly Monitor of the Performance of Canada s Tourism Industry January 2017 Volume 13, Issue 1 Edmonton Tourism www.destinationcanada.com Tourism Snapshot January 2017 1 KEY HIGHLIGHTS
CARIBBEAN TRENDS IN THE HOTEL INDUSTRY TWELFTH EDITION SAMPLE
 CARIBBEAN TRENDS IN THE HOTEL INDUSTRY TWELFTH EDITION - 2017 Maps Table of Contents Map of the Caribbean Region 5 One Step Back 6 Caribbean Hospitality Industry Updates Airbnb in the Caribbean 8 How Currency
Tourism in Alberta. A Summary Of Visitor Numbers, Revenue & Characteristics Research Resolutions & Consulting Ltd.
 Tourism in Alberta A Summary Of Visitor Numbers, Revenue & Characteristics 2001 Alberta North Canadian Rockies Edmonton & Area Alberta Central Calgary & Area Policy & Economic Analysis Alberta South March
Exports of Canadian Grain and Wheat Flour
 Canadian Grain Commission Commission canadienne des grain JANUARY CROP YEAR 2011 Exports of Canadian Grain and Wheat Flour date Tonnes (millions) 8.0 7.0 6.0 5.0 4.0 3.0 2.0 1.0 0.0 4.0 3.5 3.0 2.5 2.0
Tourism Snapshot A Monthly Monitor of the Performance of Canada s Tourism Industry
 Tourism Snapshot A Monthly Monitor of the Performance of Canada s Tourism Industry May 2018 Volume 14, Issue 4 Greg Funnell www.destinationcanada.com Tourism Snapshot May 2018 1 KEY HIGHLIGHTS Note: This
Tourism in Alberta. A Summary of 2011 Visitor Numbers and Characteristics. June 2013
 Tourism in Alberta 2011 A Summary of 2011 Visitor Numbers and Characteristics June 2013 Due to methodological changes to the 2011 Travel Survey of Residents of Canada, there is a historical break in the
Tourism in Alberta. A Summary Of Visitor Numbers, Revenue & Characteristics 2004
 Tourism in Alberta A Summary Of Visitor Numbers, Revenue & Characteristics 2004 Alberta North Based on the 2004 Canadian & International Travel Surveys (Statistics Canada) Canadian Rockies Edmonton & Area
Chris Jones. Director - Strategic Initiatives Department of Economic Development and Tourism October 25, 2018
 Chris Jones Director - Strategic Initiatives Department of Economic Development and Tourism October 25, 2018 World Tourism Economy - 2017 1.33 Billion Intl Tourist Arrivals (+7%) highest increase since
Tourism Snapshot A Monthly Monitor of the Performance of Canada s Tourism Industry
 Tourism Snapshot A Monthly Monitor of the Performance of Canada s Tourism Industry July 2018 Volume 14, Issue 6 www.destinationcanada.com Tourism Snapshot July 2018 1 KEY HIGHLIGHTS IMPORTANT: The July
IMO/IHO World-Wide Navigational Warning Service NAVAREA IV / XII
 UNCLASSIFIED IMO/IHO World-Wide Navigational Warning Service NAVAREA IV / XII 10 December 2015 The World-Wide Navigational Warning Service (WWNWS) is the internationally and nationally coordinated service
Exports of Canadian Grain and Wheat Flour
 Canadian Grain Commission Commission canadienne des grain FEBRUARY CROP YEAR 2012 Exports of Canadian Grain and Wheat Flour date Tonnes (millions) 10.0 9.0 8.0 7.0 6.0 5.0 4.0 3.0 2.0 1.0 0.0 6.0 5.5 5.0
Tourism Snapshot. A focus on the markets in which the CTC and its partners are active. January 2013 Volume 9, Issue 1.
 Tourism Snapshot Nathan Phillips Square Skating Rink at City Hall Francisco Pardo A focus on the markets in which the CTC and its partners are active www.canada.travel/corporate January 2013 Volume 9,
ORGANIZATION OF AMERICAN STATES
 ORGANIZATION OF AMERICAN STATES CONTRIBUTIONS TO OAS' FUNDS BY DONOR Members: 2006 Prior Years FEMCIDI OAS Specific Funds Trust for the Americas Antigua & Barbuda $ 7,450 $ - $ 6,988 $ - $ - $ 14,438 Argentina
Tourism Snapshot A Monthly Monitor of the Performance of Canada s Tourism Industry
 Tourism Snapshot A Monthly Monitor of the Performance of Canada s Tourism Industry September Volume 14, Issue 8 Tourism Toronto www.destinationcanada.com Tourism Snapshot September 1 KEY HIGHLIGHTS IMPORTANT
Exports of Canadian Grain and Wheat Flour
 Canadian Grain Commission Commission canadienne des grain JULY CROP YEAR 2012 Exports of Canadian Grain and Wheat Flour date Tonnes (millions) 14.0 12.0 10.0 8.0 6.0 4.0 2.0 0.0 9.0 8.0 7.0 6.0 5.0 4.0
Tourism Snapshot Year-in-review. Facts & Figures 6th edition.
 Tourism Snapshot 2011 Year-in-review www.canada.travel/corporate Facts & Figures 6th edition Tourism in the Canadian Economy Tourism Demand (2011) $ billions 11/10 % Total demand 78.8 7.5 Domestic 63.7
For authorization of the reproduction of CTO works, please contact the CTO at the address and above.
 Copyright 2018, Caribbean Tourism Organization (CTO) Published by the Caribbean Tourism Organization (CTO), 2018. All rights reserved. The designations employed and the presentation of material in this
Tourism Snapshot A Monthly Monitor of the Performance of Canada s Tourism Industry
 Tourism Snapshot A Monthly Monitor of the Performance of Canada s Tourism Industry March Volume 14, Issue 2 Tourism Saskatoon / Carey Shaw www.destinationcanada.com Tourism Snapshot March 1 KEY HIGHLIGHTS
TECHNICAL SEMINAR ON TOURISM INVESTMENTS IN THE AMERICAS Asuncion, Paraguay. May 17-18, 2011
 TECHNICAL SEMINAR ON TOURISM INVESTMENTS IN THE AMERICAS Asuncion, Paraguay May 17-18, 2011 STRUCTURE OF PRESENTATION CONTEXT TOURISM IN THE AMERICAS ROLES OF INSTITUTIONS FOCUS ON OAS AS A MULTILATERAL
Tourism Snapshot A Monthly Monitor of the Performance of Canada s Tourism Industry
 Tourism Snapshot A Monthly Monitor of the Performance of Canada s Tourism Industry April 2018 Volume 14, Issue 3 www.destinationcanada.com Tourism Snapshot April 2018 1 KEY HIGHLIGHTS Following an exceptionally
Tourism Snapshot A Monthly Monitor of the Performance of Canada s Tourism Industry
 Tourism Snapshot A Monthly Monitor of the Performance of Canada s Tourism Industry February Volume 14, Issue 1 www.destinationcanada.com Tourism Snapshot February 1 KEY HIGHLIGHTS After a slow start in
Exports of Canadian Grain and Wheat Flour
 Canadian Grain Commission Commission canadienne des grain MAY 2011 CROP YEAR Exports of Canadian Grain and Wheat Flour date Tonnes (millions) 14.0 12.0 10.0 8.0 6.0 4.0 2.0 0.0 7.0 6.0 5.0 4.0 3.0 2.0
Caribbean EVDO & CDMA Roaming Market: Potential Revenue:
 Caribbean EVDO & CDMA Roaming Market: Potential Revenue: 2005 2010 Jose F. Otero Signals Telecom Consulting CDMA Roaming Forum Rio de Janeiro, Brazil April 18, 2005 Prepared for: About Signals Founded
Outlook on Leisure Travel - Canada
 University of Massachusetts Amherst ScholarWorks@UMass Amherst Travel and Tourism Research Association: Advancing Tourism Research Globally 2013 Marketing Outlook Forum - Outlook for 2014 Outlook on Leisure
UN-GGIM:Americas. UN-GGIM Expanded Bureau Meeting 7-9 December 2016, UN Headquarters New York. Rolando Ocampo President of UN-GGIM:Americas
 UN-GGIM:Americas UN-GGIM Expanded Bureau Meeting 7-9 December 2016, UN Headquarters New York Rolando Ocampo President of UN-GGIM:Americas Antigua and Barbuda 38 Member States Argentina Bahamas Belize Bolivia
Exports of Canadian Grain and Wheat Flour
 Canadian Grain Commission Commission canadienne des grain SEPTEMBER CROP YEAR -2010 Exports of Canadian Grain and Wheat Flour - -2010 date Tonnes (millions) 4.0 2.0 3.5 3.0 1.5 2.5 2.0 1.0 1.5 1.0 0.5
INTERNATIONAL TRAVEL AND TOURISM
 INTERNATIONAL TRAVEL AND TOURISM YEAR 2014 1. INTRODUCTION This issue of the Economic and Social Indicators presents data on International Travel and Tourism for the year 2014. A brief on the compilation
GoToBermuda.com. Q4 Arrivals and Statistics at December 31 st 2015
 Q4 Arrivals and Statistics at December 31 st 1 Q4 Total Vacation Visitor Arrivals Q4 Arrivals Air - Vacation 23,770 23,125-2.7% -645 141,509 139,820-1.2% -1,689 Cruise 39,118 48,344 23.6% 9,226 355,880
APPENDIX B AUTHORIZED SECTIONS of the SOCIETY OF MOTION PICTURE AND TELEVISION ENGINEERS with GEOGRAPHICAL BOUNDARIES (Revised )
") APPENDIX B AUTHORIZED SECTIONS of the SOCIETY OF MOTION PICTURE AND TELEVISION ENGINEERS with GEOGRAPHICAL BOUNDARIES (Revised 12-12-2008) ATLANTA SECTION - Southern Region Alabama (Part) by choice Florida
APPENDIX B AUTHORIZED SECTIONS of the SOCIETY OF MOTION PICTURE AND TELEVISION ENGINEERS with GEOGRAPHICAL BOUNDARIES (Revised 12-12-2008) ATLANTA SECTION - Southern Region Alabama (Part) by choice Florida
(A) Comparative Summary of Canadian Grain Exports (A) Comparative Summary of Canadian Grain Exports
 Comparative Summary of Canadian Grain Exports (A) Comparative Summary of Canadian Grain Exports") (A) Comparative Summary of Canadian Grain Exports 3 Wheat Amber Durum Oat Barley Rye Flax Canola Soybeans Peas Corn Lentil Total, 2013 947.0 318.7 52.9 103.3 3.3 29.2 685.5 8.3 323.2 18.9 8.3 2,498.5 February,
(A) Comparative Summary of Canadian Grain Exports 3 Wheat Amber Durum Oat Barley Rye Flax Canola Soybeans Peas Corn Lentil Total, 2013 947.0 318.7 52.9 103.3 3.3 29.2 685.5 8.3 323.2 18.9 8.3 2,498.5 February,
Tourism in Alberta. A Summary of 2012 Visitor Numbers and Characteristics. June 2014
 Tourism in Alberta 2012 A Summary of 2012 Visitor Numbers and Characteristics June 2014 Introduction Whether to see their friends and relatives, for business, or for pleasure, 33.1 million total visits
Emerging trends regarding trade and cooperation initiatives in the CARICOM region
 Regional Dialogue on Promoting Services Development and Trade in Latin America and the Caribbean 12 13 November 2013 Room Raul Prebish, ECLAC, Santiago Emerging trends regarding trade and cooperation initiatives
TRIPS OF BULGARIAN RESIDENTS ABROAD AND ARRIVALS OF VISITORS FROM ABROAD TO BULGARIA IN NOVEMBER 2018
 TRIPS OF BULGARIAN RESIDENTS ABROAD AND ARRIVALS OF VISITORS FROM ABROAD TO BULGARIA IN NOVEMBER 2018 In November 2018, the number of the trips of Bulgarian residents abroad was 426.3 thousand (Annex,