INNOVATION REQUIRED: MOVING MORE PEOPLE WITH LESS TRAFFIC
|
|
|
- Gabriella Stephens
- 5 years ago
- Views:
Transcription


1 INNOVATION REQUIRED: MOVING MORE PEOPLE WITH LESS TRAFFIC How to improve Highway 101 in San Mateo County, save millions, and give commuters more choices KPC LLC Kott Planning Consultants
2 CONTENTS I. Introduction: We Can t Build our Way Out of Congestion... 3 II. Overview of this Paper... 4 III. HOV and HOT Lanes... 8 IV. Existing Conditions... 9 V. Future Conditions VI. Scenario Planning: Three Future Scenarios VII. Future Mode Shift Efforts VIII. Results of Scenario Planning IX. Comparative Analysis of Scenarios X. Recommendations Appendix TransForm, 2013 ACKNOWLEDGEMENTS Jeff Hobson and Joseph Kott are co-authors of the paper. Joseph Kott, Principal with Kott Planning Consultants and formerly ( ) the Transportation Planning and Programs Manager for the City/County Association of Governments of San Mateo County, planned and executed the analysis at the heart of the paper. Jeff Hobson, TransForm s Deputy Director, was the project manager, conceptualized the analysis, and contributed significantly to the analysis and writing of the paper. Clarrissa Cabansagan, TransForm s Community Planner, contributed to research, editing, and photography, and designed the final document. Cullen McCormick designed the infographic. Additional credit is due to Stuart Cohen for key advice throughout the process and to Shannon Tracey for final editing. TransForm gratefully acknowledges the Climate Change Public Education Program of the Resources Legacy Fund for supporting the analysis that lies at the heart of this report, as well as for production and distribution. We would also like to thank our donors and those foundations that have made our regional transportation work possible this year: The California Endowment, Clarence E. Heller Charitable Foundation, Ford Foundation, The Health Trust, James Irvine Foundation, Flying J Foundation, Kaiser Permanente Northern California Community Benefit Program, San Francisco Foundation, Silicon Valley Community Foundation, Surdna Foundation and the William and Flora Hewlett Foundation. page 2
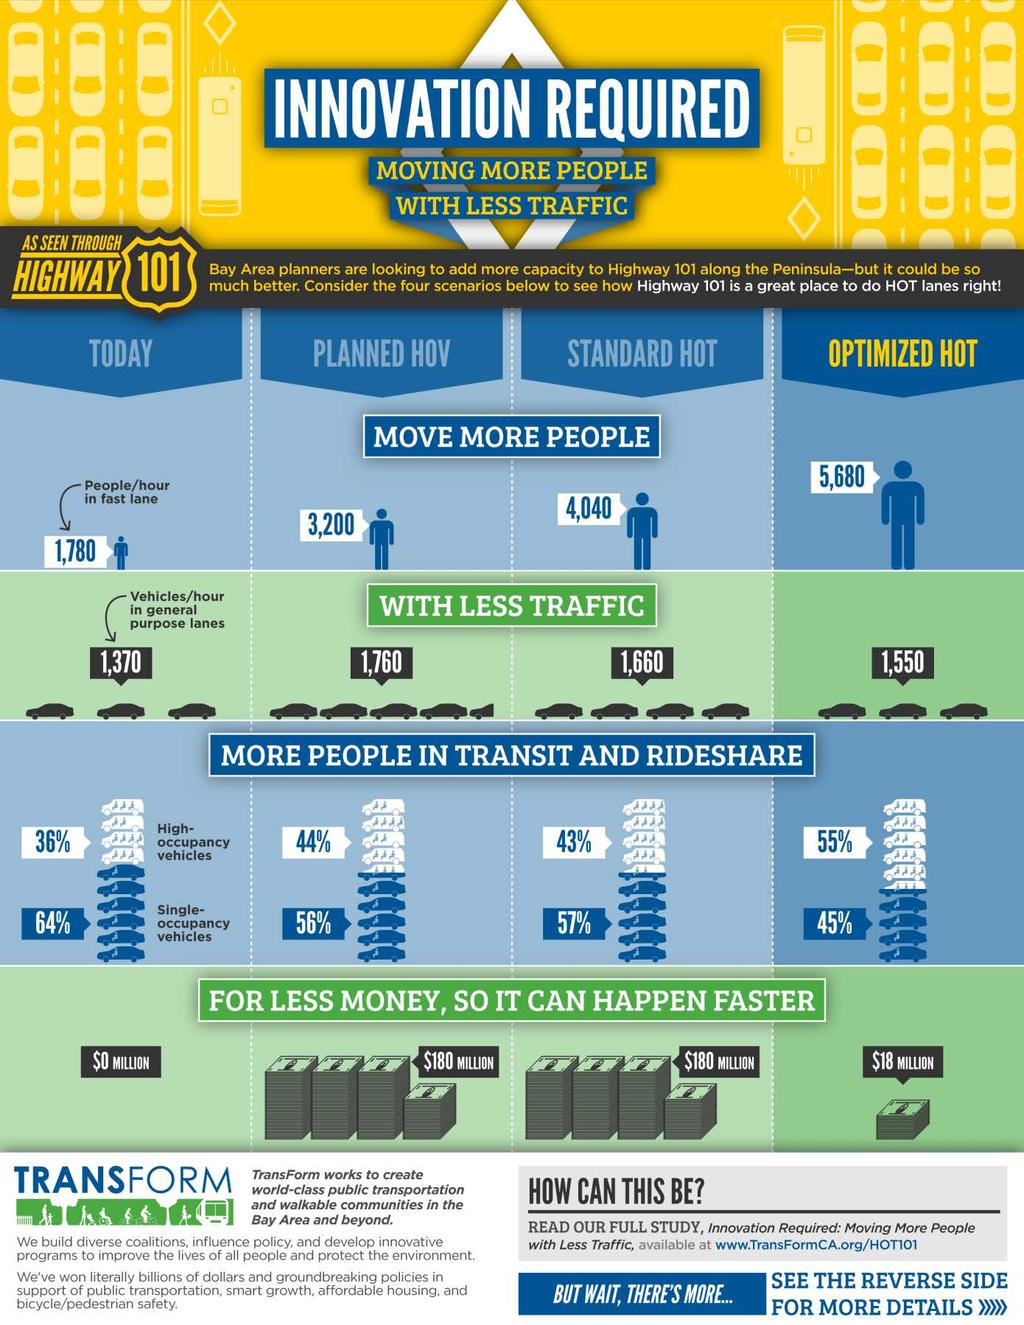
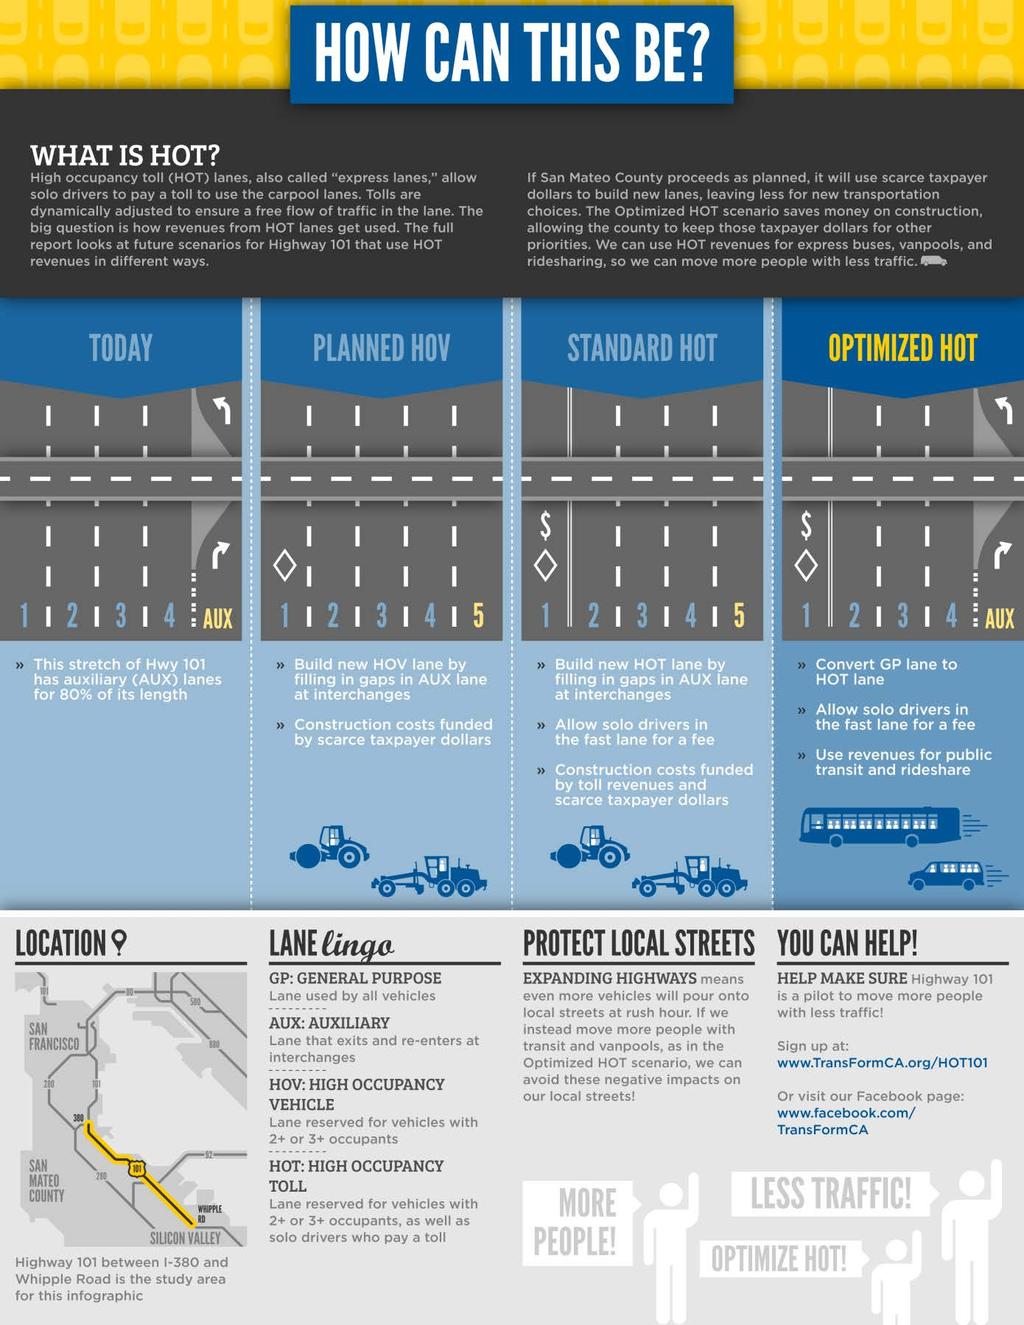
3 I. Introduction: We Can t Build our Way Out of Congestion San Mateo County has a traffic problem. And if we don t pursue innovative solutions, traffic will get worse. With ongoing economic growth and a rising population, more and more people are driving farther and farther. We already have massive congestion on Highway 101, overcrowding on Caltrain, and complaints from businesses that their employees can t reliably get to work on time. In the past, government agencies have responded by building bigger highways. But after decades of widening our highways, we now know that we can t build our way out of congestion. When we build wider highways, at first traffic flows faster. But new drivers soon fill that space, especially in congested corridors such as Highway 101. Within a few years, traffic is just as bad as it ever was. This new traffic pours onto local roads and clogs them too. To top if off, spending hundreds of millions of dollars on new highway lanes leaves little to invest in public transit, vanpools, and other alternatives. People want more and better transportation choices. Caltrain ridership has boomed since the introduction of the Baby Bullet. As the smartphone replaces the car as the teenager s must-have possession, fewer young people are getting their driver s licenses. Employers, particularly tech companies such as Google and Genentech, now run private transit systems to meet their employees demands. But those company shuttles, some carrying as many as 70 people, are stuck in the same traffic as solo drivers. Meanwhile, our cars remain the biggest emitters of both local air pollution and greenhouse gas pollution. We need better solutions. San Mateo County has major transportation assets: Highway 101, Caltrain, and Samtrans. The question is how to best use those assets to solve our traffic problems, reduce greenhouse gas and local air pollution, and make the most cost-effective use of limited taxpayer dollars. But so far, county transportation agencies and Caltrans are stuck in the building bigger highways rut. Their proposal to expand Highway 101 would spend $150 million or more to add a high-occupancy vehicle (HOV) lane in each direction, without funding additional transportation choices. That will make traffic worse than it is now while still leaving unused space in the HOV lane. At some point, they may also allow solo drivers to opt into this HOV lane for a fee, to make it into a high-occupancy toll (HOT) or express lane. But if the lane is created by widening Highway 101, the high cost of construction will use up the revenues that instead could fund more transportation choices. This paper analyzes a new option that will make the best use of our highway lanes and simultaneously fund transportation choices to truly reduce congestion. We call it the Optimized HOT scenario. Instead of expansion, the county would spend just $18 million to convert the existing left-most general purpose lane into an HOT lane. The county would use the money saved through lower construction costs and the revenue generated by the HOT lane to fund a dramatic expansion of public transit, vanpools, and other alternatives to solo driving in the corridor, potentially including expanded Caltrain service. The following two pages are an infographic (also available as a free-standing document) summarizing how the Optimized HOT scenario outperforms other future scenarios. This is the kind of innovative solution San Mateo County should try. However, antiquated state policy is in the way. We need the state to allow this innovation. This will not only address San Mateo County s problem, it can also set an important model for the rest of the Bay Area as the region prepares to create an HOT network over the next twenty years. If we do things right, we can move more people with less traffic, put solutions in place more quickly than the agency s standard solutions would allow, and spend less money up front. Let s get to work. page 3
4 page 4
5 page 5
 lanes.")
6 II. Overview of this Paper The San Mateo County Transportation Authority (TA), in cooperation with the City/County Association of Governments of San Mateo County (C/CAG) will soon embark on a detailed study of the feasibility and cost of expanding Highway 101 to create high occupancy vehicle (HOV) lanes. 1 These lanes would be an extension of the HOV lane that already runs along Highway 101 through Santa Clara County to Whipple Avenue in Redwood City. But it is no longer clear this is the best solution for San Mateo County. The use of HOV lanes varies greatly across the region. In some places the lanes are full and threaten to no longer offer a time advantage. In others the lanes carry fewer vehicles, leaving a lot of unused capacity, even when nearby general purpose lanes are congested. That is why another alternative is emerging in the Bay Area and across the country. Express lanes, or High Occupancy Toll (HOT) lanes, are carpool lanes that allow non-carpool vehicles to pay to use them when there is excess capacity. The region is forging ahead with an Figure 1. Express lane sign over I-680 in Alameda County. Photo Credit: Noah Berger extensive network, and Santa Clara County is leading the way. Express lanes are already in operation connecting I-880 to SR-237 and along I-680 over the Sunol grade. Many more are in the planning stages, including along Highway 101 in Santa Clara County and into San Mateo County up to the Whipple Avenue interchange. Express lanes hold promise for increasing the number of people, not just vehicles, using Highway 101, but only if they are designed to optimize how many high-occupancy vehicles use the lanes. Some of the region s network, including parts of Highway 101, will be created by converting existing carpool lanes to HOT lanes. These conversions are cost-effective: if done alone, they would expand travel choices by expediting bus, vanpool and carpool trips and creating a buy-in option for those who wish to remain in their solo vehicles but also benefit from using the high occupancy lanes. In turn, the revenue stream created by payments from these drivers can be usedto fund improved transit and vanpool alternatives for others. But the region also plans to spend billions of dollars to expand hundreds of miles of highways. This new construction would use up the revenues generated by the rest of the system and leave nothing left for more transportation choices or for mitigations for low-income families. There is even a chance that a poorly-designed lane could end up carrying even fewer people than an existing lane! This is why instead of spending $150 million-plus to widen Highway 101, policymakers should consider the dramatically less capital-intensive alternative of the Optimized HOT scenario : convert an existing general purpose lane to HOT and use the HOT revenues plus the money saved in lower construction costs to invest in better transportation choices. We should also use those funds to ensure low-income families receive equitable benefits from these transportation investments. This paper conducted some basic analyses to illustrate the potential benefits of this Optimized HOT approach in San Mateo County. The analyses found that the Optimized HOT scenario would: move more people, have less traffic in the general purpose lanes, cost less to put in place and be completed sooner, give more people the option to escape traffic and ride in the fast lane, and make more efficient use of our highway infrastructure than any of the other alternatives. page 6
7 Now is a perfect time and place to try this innovative approach that can set a critical precedent for the Bay Area.We also hope the conclusions of this paper inspire state-level policy changes that would be needed to allow this innovation and efficiency to move forward. This focus on moving more people, not just moving vehicles, is gaining traction at all levels. For example, the secretaries of four California state agencies recently sent a letter to the U.S. Secretary of Transportation recommending that Person Throughput per Lane Mile be used as a performance measure for the National Highway System. 2 Moving More People with Less Traffic describes different ways to create high-occupancy lanes along one stretch of Highway 101 in San Mateo County. This is followed by a discussion of existing conditions on Highway 101 in San Mateo County and three alternative scenarios for this freeway: The Planned HOV scenario is the county s current plan: to create an HOV lane by widening some portions of the highway and using existing auxiliary lanes in other places. The Standard HOT scenario is the likely evolution of the county s current plans: it would involve converting the HOV lane created in the first scenario into an HOT lane. The Optimized HOT scenario is a proposed new option that uses express lane revenues, and savings from less expensive highway construction, to support aggressive investments in transit, vanpools, and other alternatives to solo driving. The report emphasizes the importance of accommodating high occupancy vehicle demand and of robust transportation demand management efforts along the Highway 101 corridor. Moving More People with Less Traffic offers estimates of future traffic on 101 by lane type and by mode, including solo occupant vehicles, carpools with two passengers, carpools having three or more passengers, vanpools, and buses. Finally, we present a list of recommendations to support moving more people with less traffic by providing more choices on Highway 101 in San Mateo County. page 7
8 III. HOV and HOT Lanes High occupancy vehicle (HOV) or carpool lanes are intended to help maximize the people-carrying (as opposed to the vehicle-carrying) capacity of a roadway segment by limiting the use of one or more lanes to buses, vanpools, and carpools with a minimum number of occupants. 3 High occupancy toll (HOT), also frequently called express lanes, allow solo drivers to use the carpool lanes by paying a toll that can be adjusted dynamically based on congestion. 4 Notable California examples of HOT lanes are on I-15 in San Diego and I-680 in Alameda and Santa Clara counties. 5 By current state law, HOT lanes may be implemented as newly constructed lanes or from conversion of existing HOV lanes. 6 There were more than 150 HOV and/or HOT facilities in the United States in The Bay Area is developing an extensive HOT or express lane system, beginning with a 550-mile backbone network. 8 TransForm previously published Moving People, Not Just Cars with detailed recommendations for how to ensure choice, equity, and innovation in MTC s Express Lane Network. 9 MTC s proposed network includes a short segment on Highway 101 in San Mateo County from the Santa Clara County Line to the Whipple Avenue interchange, but it does not include any portion of Highway 101 north of Whipple. The Standard HOT and Optimized HOT scenarios in this paper explore two ways San Mateo County could expand that express lane network to more of Highway 101, largely or wholly using existing infrastructure. Legal authority for HOT lanes is evolving in the U.S., as many regions experiment with ways to manage highway demand and raise revenue to maintain aging highway networks. The Bay Area network s legal authority is based on several different parts of state law. 10 None of these authorities allows conversion of general purpose lanes to an HOT lane, which is part of the solution this paper proposes as the Optimized HOT scenario. Agencies may create an HOT lane by converting an existing HOV lane, but AB 798 prohibits converting an existing non-tolled general purpose lane to an HOT lane. 11 Federal law may also apply, stating that federal funds may be used to create an HOT lane only if the project increases highway capacity or if the project is a conversion of an existing HOV lane. This restriction, however, only applies if a project intends to use federal funds. 12 These state and federal restrictions, if left unchanged, pose barriers to the Optimized HOT solution recommended by this paper. See Section X: Recommendations for ways to address these barriers. HOT lanes based on dynamic, congestion-based tolls have potential to generate revenues above and beyond what may be needed to pay for the costs of creating and maintaining these facilities. If designed and operated well, they have the potential to generate net revenues. If net revenues are generated, an agency can amplify the beneficial effects of reduced bus and van travel times by distributing these net revenues to higher occupancy mode services, including express bus transit and vanpool programs, as well as to robust travel demand management efforts targeted to the express lane corridor. This can promote further mode shift to higher occupancy vehicles and can create a virtuous circle of greater demand for higher occupancy travel, resulting in more efficient provision of HOV travel, which in turn leads to more supply, spurring higher demand. This can only happen, however, if the costs of creating and maintaining the HOT lanes can be contained well enough to allow net revenues. This paper does not delve into the significant potential equity impacts of congestion tolling that need to be considered by policymakers. 13 It is important to note that availability of better transit options is a benefit across the socio-economic spectrum, especially for lower-income households without access to reliable private motor vehicle transport. Nor does this paper address in any way the complexities of operating express lanes or the difficulties in predicting revenues. Instead, this paper simply focuses on comparing the creation of an HOV lane to two possible ways of creating an express lane along one corridor in San Mateo County, and of optimizing the peoplecarrying capacity of the roadway. page 8

9 IV. Existing Conditions Highway 101 in San Mateo County is a limited access facility, typically comprising four general purpose through lanes and significant sections of auxiliary lanes in each direction between the San Francisco County Line to Whipple. There are four general purpose through lanes and one HOV lane in each direction from Whipple to the Santa Clara County line. 14 See Figure 2 for a map of the corridor, showing the study area for proposed scenarios discussed below: the portion of Highway 101 from Whipple north to the I-380 interchange. Figure 2. Map of Highway 101 Corridor LEGEND Study Area Table 1 displays existing vehicle volumes for this stretch of road, along with existing mode choice characteristics and the number of people carried by the current facility. These data are derived from the technical analysis prepared for C/CAG based on 2009 data collected along the corridor, but with one change: this paper assumes that there has been an increase in the share of bus transit vehicles, based on the reported increase in private transit vehicles since page 9
10 For simplicity, this paper presents estimates for one direction of AM peak period travel, based on average traffic across five locations along the corridor. This simplification is used because the directional split of traffic is roughly even, with similar levels of traffic going northbound and southbound during both AM and PM peak periods. Further, the mode split in each direction is also roughly similar. Further details are included in the Appendix. A more complete analysis of these scenarios would require more detailed calculations, considering AM and PM peak periods separately for each direction and considering different traffic levels at different locations. Based on these estimates and simplifications, the average vehicle occupancy rate (VOR) for existing conditions is 1.30 persons/vehicle (33,920 people / 26,040 vehicles). Table 1: Mode Choice, Existing Conditions AM Peak Period, Average of Both Directions 15 Person or Vehicle Trips Solo Occupant 2-Person Carpools 3+ Person Carpool Bus Vanpools Motorcycles Trucks Total % Vehicles 79.5% 15.5% 1.1% 0.4% 0.5% 0.5% 2.5% # Vehicles 20,700 4, ,040 % Persons 61.0% 23.8% 3.0% 6.6% 3.1% 0.5% 2.1% # Persons 20,700 8,070 1,000 2,230 1, ,920 page 10
11 V. Future Conditions Future Vehicle Demand Peak-period traffic is projected to be 31,000 vehicles during the AM peak period, as an average of both directions of travel. PM peak period traffic is projected to grow by similar proportions, representing a roughly 19% growth in traffic from 2005 to Future Roadway Configurations An analysis of HOV feasibility completed for C/CAG in June, 2012 identified five alternative future roadway configurations: Baseline (no change), Full Hybrid HOV Lane, Staged Hybrid HOV Lane, 16 Add HOV Lane, and Convert Mixed Flow Lane to HOV Lane. Hybrid refers to the strategy of starting with existing auxiliary lanes, 17 and supplementing this with sections of new pavement at interchanges where the auxiliary lane exits, to complete a new continuous general-purpose lane, and then converting the left lane to a high-occupancy vehicle lane. The Full Hybrid option would create HOV lanes from the Whipple interchange to the San Mateo County / San Francisco County line, a distance of approximately 19 miles. The Staged Hybrid option would begin with the section from the Whipple interchange to the I-380 interchange, about 14 miles in extent. The Add HOV Lane option would create an entirely new lane, although there is no description of precisely how and where room for this additional lane will be created. The Convert Mixed Flow Lane option would designate an existing lane for high vehicle occupancy use. 18 The preliminary cost estimates for these options vary enormously, as displayed in Table 2: Table 2: Cost Estimates for High-Occupancy Facilities on Highway 101 in San Mateo County 19 Convert Mixed Flow Lane Staged Hybrid HOV Full Hybrid HOV Lane Add HOV Lane $18 Million $156 - $180 Million $285 - $325 Million $426 Million The effects of each option also vary. The three options that add a fourth continuous lane would result in a 4 7% increase in vehicle miles of travel, and a proxy for greenhouse gas emissions on Highway 101, while under the Convert Mixed Flow Lane option, VMT would fall by a projected 4%. Importantly, several factors that could have a significant impact on the performance of the options were not considered in the analysis prepared for C/CAG. The analysis did not consider the potential impact of managing traffic in the high-occupancy lane by operating it as an HOT lane. Moreover, there was no forecast of public and private bus transit demand under each option, nor any consideration of either the effects of future transportation demand management efforts along the 101 corridor or any traffic shift from parallel facilities such as El Camino Real and I-280 onto Highway 101. A more complete analysis would take account of the four convergences that take place with increased highway capacity: from other passenger transportation modes, from off-peak to peak times, from other routes, and from non-travel to travel. 20 As of fall 2013, C/CAG is moving forward with design plans for the Staged Hybrid HOV construction plan. No decision has yet been made to incorporate the resulting HOV lane into the growing Bay Area network of express lanes. But if the rest of the Bay Area s planned express lane network moves forward, it seems likely that this new HOV lane would eventually be incorporated into it, so it is worthwhile investigating different options that include an express lane along this corridor. page 11


12 VI. Scenario Planning: Three Future Scenarios A sketch Scenario Planning 21 framework can provide a more complete picture of the potential of HOV/HOT lanes on Highway 101. This sketch Scenario planning approach is meant to illustrate potential, so is a thought experiment intended to inform policy in advance of detailed program development and travel demand forecast modeling. This analysis considers three future scenarios: Planned HOV scenario is based on the current focus of planning for Highway 101 in San Mateo County, the Staged Hybrid HOV plan. In this scenario, the county would spend $ million to build an HOV lane along the corridor, as described above in Section V: Future Conditions of Highway 101 in San Mateo County. This scenario assumes public funds would pay for construction costs. This scenario does not assume any other efforts to shift mode share, beyond the baseline level of mode shift defined in Section VII: Future Mode Shift Efforts. Standard HOT scenario is based on the same physical change as in the Planned HOV scenario. The difference is that the county would operate that new high-occupancy lane as an HOT lane. This scenario further assumes that express lane revenues would be dedicated to construction costs, as is the case with MTC s existing plans for the overall Bay Area Express Lane Network. As a result, this scenario assumes the same baseline level of mode shift defined in Section VII: Future Mode Shift Efforts. Optimized HOT scenario is a new approach proposed in this paper. In this scenario, the county would spend $18 million to convert the existing general purpose lane to an HOT lane, described as Convert Mixed Flow Lane above in Section V. In this scenario, the county would also use the money saved through lower construction costs and the revenue generated by the HOT lane to include a dramatic expansion of new transit service, vanpools, and other alternatives to solo driving, the aggressive level of mode shift effort defined in Section VII: Future Mode Shift Efforts. page 12
13 This paper assumes that in a 2030 horizon year, for all scenarios, high-occupancy lanes will be open to vehicles with 3+ passengers. This is in keeping with regional assumptions about operation of the future express lane network. 22 By necessity, this sketch scenario planning does not use the type of travel modeling detail that San Mateo County transportation agencies could and should use to evaluate these proposed scenarios. But at this sketchlevel, the results are very compelling and clearly point to the need for more detailed analysis. page 13
14 VII. Future Mode Shift Efforts Baseline Mode Shift Effort The Planned HOV and Standard HOT scenarios both assume that there is no new public investment and only a modest private investment in transit, vanpools, and other alternatives to solo driving. But there will still be a natural mode shift due to the availability of a high-occupancy lane and the associated travel time savings potential for higher occupancy modes of travel. New carpools with three or more passengers and new vanpools will form, and some employers will add new bus transit capacity. This paper refers to those changes collectively as the Baseline mode shift effort. The term Baseline is used to represent the likely effects of high-occupancy lanes without robust mode shift efforts to induce additional use of these lanes by buses, vanpools, and carpools with three or more passengers. With only these Baseline efforts, the benefits of the HOV lanes will degrade over time. This is because there will be a convergence of vehicles from both parallel routes and off-peak travel times onto Highway 101 in San Mateo County in response to an initial rise in average vehicle occupancy, which will open up road space. In the absence of aggressive new transportation demand management efforts, the gains in average vehicle occupancy will erode. This paper estimates that the Baseline mode shift will include a substantial increase in the mode share for HOV 3+ vehicles, in large part from people moving from 2-person carpools to 3+ carpools, resulting in an equal portion of 2-person and 3+ carpools. The Baseline mode shift also assumes an increase of 15 vanpools per hour and 15 transit vehicles per hour. The resulting mode shift efforts are shown in Table 4. Aggressive Mode Shift Effort By contrast, the Optimized HOT scenario includes an Aggressive mode shift effort, building on top of the Baseline effort described above. Table 3 shows three hypothetical elements that could be included in this program to induce mode shift within a scenario planning framework for future Highway 101 express lane development: Table 3: An Aggressive Mode Shift Effort on Highway 101 in San Mateo County New Bus Transit Services 30 private, 30 public buses per hour, each direction, peak period New Vanpool Formation 60 new vanpools per hour, each direction, peak period Added Annual TDM Program Investment 23 $6.6 M The Aggressive mode shift assumes for scenario planning one new public or private bus per minute in each direction and one new vanpool per minute in each direction: for a total of 30 new private and 30 new public buses per hour in each direction and 60 new vanpools per hour in each direction, over and above the Baseline effort. For buses, this is similar to the existing public bus service along I-80 westbound in Alameda County in the morning peak period. For private buses, this new service would represent roughly a two-fold increase over current conditions. Private transit already provides a significant share of the transit service along the corridor. As of 2012, Google alone provided 1.8 million trips on their employee shuttles, making it the 6 th -largest bus-only operator in the Bay Area. Genentech s gride was close behind, with 1.3 million riders in While Google provides the most rides, many other companies run significant fleets, including Genentech, Facebook, Apple, Yahoo, ebay, Electronic Arts, and others. 25 All this transit is providing significant environmental benefits by adding another transit option that allows commuters to get to work without driving. 26 page 14


15 Figure 3. Two corporate shuttles and one public transit vehicle stuck in traffic during the AM peak period on Highway 101. Demand for these private transit services is growing and has the potential to grow even more if Highway 101 were to have a traffic-free high-occupancy lane. The estimate for the Aggressive mode shift is based on correspondence with several transportation managers at major technology companies along the corridor. In fact, these conversations suggest this two-fold increase may be a conservative estimate that is, that the continuing growth of the tech sector and increased reliance on private transit may yield a much larger growth in the number of private transit vehicles. However, for the purpose of this scenario analysis, we are using this conservative assumption based on the uncertain impacts of future improvements to Caltrain and public bus competitors to private bus services on the corridor. 27 The aggressive mode shift efforts also include a Transportation Demand Management (TDM) program operated according to TDM best practices. 28 The impact of the TDM program investment would be intended not only to support mode shift to buses, vanpools, and carpools, but also to prevent convergence from other modes, times, routes, or non-travel onto Highway 101 in response to any vacant roadway space created by reductions in solo occupant travel. The capital costs of public transit service expansion are estimated at $29-33 million, with annual operating subsidies estimated at $13-16 million. Additional funds would likely be needed for an expansion of park and ride lots, both to support ride-sharing and public/private transit. Detail on assumptions for these estimates is shown in the Appendix. Earlier HOT revenue estimates suggest that HOT revenue generated by the corridor would greatly exceed the public investment required to implement the bus, vanpool, and TDM program for this aggressive mode shift effort, but a more complete analysis with up-to-date revenue estimates would be needed to confirm this conclusion. See Appendix for details. Figure 4. A corporate shuttle sailing down Highway 101 in a carpool lane during the AM peak period. Impact of Mode Shift Efforts Table 4 displays the potential impact of these Baseline and Aggressive mode shift efforts, in both number of vehicle trips and number of passengers served. See Appendix for details. page 15
16 Table 4: New High Occupancy Vehicles Supply and Demand, Two Levels of Mode Shift Effort, Each Direction, AM Peak Period Mode Shift Effort Baseline Aggressive New Buses Trips/Passengers New Vanpools Trips/Passengers New 3+ Carpools Trips/Passengers Total New HOVs Trips/Passengers 60 / 1, / 480 2,290 / 8,000 2,410 / 9, / 6, / 2,400 3,150 / 11,040 3,750 / 19,850 page 16
17 VIII. Results of Scenario Planning The results of this scenario planning are presented below. For each scenario, we estimate the total vehicle volume, predicted mode shares for vehicles and people, traffic levels in high-occupancy, general purpose, and auxiliary lanes, and the number of people and vehicles in the high-occupancy lane. Results were estimated for the AM peak period traffic conditions forecast for the year 2030, based on the demand projections developed for C/CAG for the HOV feasibility study described above. Detailed calculations, methodology, and references for these estimates are shown in the Appendix. Total Vehicle Volumes Table 5 shows total vehicle volume for each future scenario, including the percent change from current conditions. This shows significant differences among the scenarios. The Planned HOV scenario has the future vehicle volume predicted by current planning studies, a 19% increase above 2009 levels. The Standard HOT scenario has an even higher volume, fueled by induced demand in response to the HOT lane s ability to absorb more traffic. The Optimized HOT scenario has the fewest vehicles, as some drivers switch to transit and vanpools provided by the aggressive mode shift efforts. Table 5: Total Vehicle Volumes, Existing Conditions & AM Peak Period, Average of Both Directions Scenario Total Vehicle % Increase from Volume Current Conditions Existing Conditions 26,040 n/a Planned HOV 30,960 19% Standard HOT 32,290 24% Optimized HOT 28,570 10% Mode Choices whole highway Tables 6-8 display estimated 2030 modal choice distributions for the three future scenarios. Tables 6 and 7, showing the Planned HOV and Standard HOT scenarios, assume the Baseline shift in HOV use. Table 8 shows the Optimized HOT scenario, including the Aggressive mode shift effort. In all cases, distributions are presented for both people and vehicles in the AM peak period. page 17
18 Table 6: 2030 Mode Choice, Planned HOV Scenario 30 Solo 2-Person 3+ Person Driver Carpool 31 Carpool 32 Bus Vanpool Motorcycle Truck Total # Vehicles 24,490 2,570 2, ,960 % Vehicles 79.1% 8.3% 8.3% 0.6% 0.7% 0.5% 2.5% # Persons 24,490 5,150 9,000 3,930 1, ,340 % Persons 54.1% 11.3% 19.9% 8.7% 3.8% 0.4% 1.9% Solo Driver Table 7: 2030 Mode Choice, Standard HOT Scenario 2-Person Carpool 3+ Person Carpool Bus Vanpool Motorcycle Truck Total # Vehicles 25,580 2,690 2, ,290 % Vehicles 79.2% 8.3% 8.3% 0.6% 0.7% 0.5% 2.4% # Persons 25,580 5,370 9,410 3,930 1, ,070 % Persons 54.4% 11.4% 20.0% 8.4% 3.7% 0.4% 1.8% Table 8: 2030 Mode Choice, Optimized HOT Scenario Solo 2-Person 3+ Person Bus Vanpool Motorcycle Truck Total Driver Carpool Carpool # Vehicles 21,800 1,520 3, ,570 % Vehicles 76.3% 5.3% 12.0% 1.5% 1.6% 0.5% 2.7% # Persons 21,800 3,040 12,040 9,060 3, ,630 % Persons 43.0% 6.0% 23.8% 17.9% 7.2% 0.4% 1.7% Levels of Traffic Table 9 shows estimated future traffic flows in the three scenarios: vehicle volumes per hour and per lane in the relevant types of lanes in each scenario. Table 9: Vehicle Volumes, Existing Conditions & Average Vehicles per Lane per Hour during AM Peak Period Scenario HOV / HOT Auxiliary Lane General Purpose Lanes Lane (HOT only) Total Facility Existing Conditions n/a 1,370 1,040 6,510 Planned HOV 700 1,760 n/a 7,740 Standard HOT 1,410 1,660 n/a 8,070 Optimized HOT 1,320 1,550 1,180 7,140 To put this in context, C/CAG defines freeway capacity as 2,200 vehicles per hour for a freeway cross-section like that of Highway 101 in San Mateo County. 34 In contrast, however, the Bay Area HOV Network Study Final Report describes the useful capacity threshold for general purpose lanes as 1,600 vehicles per hour, corresponding to stable flow traffic. 35 All three of these scenarios are well within C/CAG s definition of freeway capacity. The Optimized HOT scenario shows the lowest level of traffic in the general purpose lanes, with a page 18
19 traffic volume very close to MTC s definition of the lane s useful capacity. The Standard HOT scenario has higher traffic while the Planned HOV scenario has the worst expected traffic volumes in the general purpose lanes. It is also important to note that while Table 9 shows average traffic levels, morning peak hour traffic along Highway 101 in San Mateo County can vary by more than 30%, depending on location, direction, and hour. 36 The range for 15-minute peaks can be even greater. Vehicles & People in the High-Occupancy Lane Finally, Table 10 shows, for each of the future scenarios, the number of vehicles and people in the #1 or furthest-left lane of the highway, the high-occupancy vehicle lane. 37 For comparison purposes, Table 10 also includes the number of people estimated to be travelling in the furthest-left lane for existing conditions, based on the average vehicle occupancy for the highway as a whole. Table 10: Total People Travelling in Left Lane, Average Peak Hour, Existing & Future Scenarios 38 Scenario # of Vehicles # of People Existing Conditions 1,370 1,780 Planned HOV 700 3,200 Standard HOT 1,410 4,040 Optimized HOT 1,320 5,680 page 19
20 IX. Comparative Analysis of Scenarios This analysis shows that the Optimized HOT scenario can move more people, with less traffic. It succeeds because it makes more efficient use of the high-occupancy lane by filling it with more carpools, vanpools, and buses, while still allowing access to solo drivers that generates revenue and makes efficient use of the roadway. Moving More People The Optimized HOT scenario carries 50% more total people than Existing Conditions (50,630 people vs. 33,920), and 8-12% more people than the Planned HOV (45,340) or Standard HOT (47,060) scenarios. Figure 5 shows this study s estimate for how many people would be traveling during the AM peak period. Figure 5: Projected number of people using Highway 101 during AM Peak Period 50,000 40,000 30,000 20,000 Existing Conditions Planned HOV Standard HOT Optimized HOT Less Traffic The Optimized HOT scenario has less traffic (1,550 vehicles/hour) in its general purpose lanes than either the Planned HOV (1,760) or Standard HOT (1,660) scenarios. Figure 6 shows the estimated traffic in the general purpose lanes for each of the future scenarios, averaged across the AM peak period. Figure 6: Traffic in General Purpose Lanes (vehicles/hour) 1,800 1,700 1,600 1,500 1,400 Planned HOV Standard HOT Optimized HOT page 20
21 More People in Carpools, Buses, and Vanpools In the Optimized HOT scenario, aggressive mode share efforts make it possible for more people to avoid traffic in the adjacent lanes by riding in carpools, buses, and vanpools. Figure 7 shows that the share of people traveling as solo drivers declines sharply across the three scenarios, from 61% in existing conditions to just 43% in the Optimized HOT scenario. The Optimized HOT scenario is the only one in which the majority of people on the highway are traveling in high-occupancy vehicles. Figure 7: People traveling as Solo Drivers vs. in Carpools, Buses, and Vanpools 70% 60% 50% 40% 30% 20% 10% 0% SOVs HOVs SOVs HOVs SOVs HOVs SOVs HOVs Existing Conditions Planned HOV Standard HOT Optimized HOT More People in the Fast Lane Putting all these factors together results in many more people traveling in the fast lane, getting the time-savings benefits of the high-occupancy lane. Figure 8 shows the number of people traveling in the fast lane the far-left lane for existing conditions and the high-occupancy lane for the future scenarios. The results are dramatic in the Optimized HOT scenario the fast lane carries more than three times as many people as in existing conditions (1,780), and 41%-78% more people than in the Standard HOT and Planned HOV scenarios. 6,000 5,000 4,000 3,000 2,000 1,000 Figure 8: People/hour in the Far-Left Lane 0 Existing Conditions Planned HOV Standard HOT Optimized HOT page 21
22 More Efficient Use of the Whole Highway The result is a much more efficient use of the highway. Figure 9 shows the change in average vehicle occupancy, or number of persons per vehicle, from existing conditions to the future scenarios. The average vehicle occupancy rate (VOR) rises modestly, from 1.30 in Existing Conditions to 1.46 in the Planned HOV and Standard HOT scenarios. In contrast, the Optimized HOT scenario results in a dramatic increase in vehicle occupancy rate to 1.77 people per vehicle, an increase of more than one-third over existing conditions. Figure 9: Average Vehicle Occupancy (persons/vehicle) Existing Conditions Planned HOV Standard HOT Optimized HOT page 22

23 X. Recommendations The Optimized HOT scenario for Highway 101 would: move more people, have less traffic in the general purpose lanes, cost less to put in place and be completed sooner, give more people the option to escape traffic and ride in the fast lane, and make more efficient use of our highway infrastructure than any of the other alternatives. Unfortunately, it is also prohibited by state law. This section describes the needed changes in order to allow San Mateo County to try the innovation of the Optimized HOT scenario. Lift State Restrictions on Innovation As described in Section III, AB 798 (Nava), passed in 2009, prohibits converting an existing non-tolled general purpose lane to a tolled lane, although conversions of HOV lanes are allowed. The California Legislature should remove this prohibition, at least for a few demonstration projects, to test the Optimized HOT scenario. There are likely numerous other places across the state where Optimized HOT may be the best solution. And in some places the Optimized HOT approach may be the only way to provide a high-occupancy lane. These places should be allowed to innovate. Such legislation should be designed to require demonstration projects to test the complete Optimized HOT solution. TransForm recommends that legislation specify that at least 50% of the corridor s HOT revenue be spent on transportation choices, over and above previously-existing service. Lift State Restrictions on Innovation The California Legislature should allow a limited number of demonstration projects to test the Optimized HOT scenario. These demonstration projects would be allowed to convert existing non-tolled general purpose lanes to HOT if and only if the project also includes a simultaneous dramatic increase in transit, vanpools, and other transportation choices along the same corridor. The projects should have initial timelimitations and require detailed studies before being made permanent. San Mateo County Should Lead the Way While state law currently prevents San Mateo County s transportation agencies from implementing the Optimized HOT solution on its own, there are some steps the county should take, even in the absence of a change in state law. The county should conduct a more detailed evaluation of the Optimized HOT scenario, including both the conversion of a general purpose lane and using HOT revenues to invest in transportation choices. This should be done as part of the county s upcoming feasibility study of Figure 10. Commuters boarding Google shuttle in San Francisco. Photo Credit: Liz Hafalia, The Chronicle page 23
24 a Highway 101 HOV lane. This evaluation should include forecasting the effects of future public and private transit and vanpool services on Highway 101. C/CAG s previous study of this corridor was not good enough it only analyzed the possibility of converting a general purpose lane to an HOV lane, without consideration of the synergistic effects of an aggressive effort to support new choices and significant mode shift. The study also needs to give careful consideration to equity in HOV/HOT policy-making: do the HOV/HOT lanes result in greater choice in travel options, especially for disadvantaged groups? Or are these groups made less well-off due to HOV/HOT policy? The county should consider incorporating a low-income mitigation program to ensure that low-income families receive an equitable share of the benefits and do not bear a disproportionate share of the burden of the HOT lane. Mitigations may include access to the network itself, as well as investments in transportation choices. San Mateo County Should Lead the Way SMCTA and C/CAG should express support for the state (and, if necessary, federal) legislative changes described in this section. SMCTA and C/CAG, with support from MTC, should conduct a detailed evaluation of the Optimized HOT scenario for Highway 101 in San Mateo County, including both the conversion of a general purpose lane, simultaneous investments in transportation choices funded at least in part by HOT revenues, and low-income mitigations. Regional Support for Innovation This analysis also demonstrates that this Optimized HOT scenario could help the region create express lanes more quickly and more efficiently than is currently conceived through the Bay Area Express Lane network. Recent actions by MTC show that Bay Area transportation decision-makers are ready to look at this scenario. The final Plan Bay Area, the 25-year combined transportation and land use plan adopted by MTC and the Association of Bay Area Governments (ABAG), includes a provision stating that MTC will study the benefits and impacts of converting general purpose lanes to express lanes in order to inform implementation of the express lane network. 39 And in public conversations leading up to the vote, Commissioners sought and received verbal assurance that these analyses would look at how HOT revenues are used, how the lanes impact people of different incomes, and what MTC could do with HOT revenues to offset the consequences of converting general purpose lanes to HOT lanes. 40 But the written provision in Plan Bay Area does not expressly state that MTC or any relevant county agency will study the full Optimized HOT solution as a package. If MTC only studies converting a general purpose lane to an HOV/HOT lane, without including the synergistic effects of adding transit at the same time, it will not show the same benefits as looking at the full package together. While this segment of Highway 101 is not currently part of MTC s Express Lane Network, San Mateo County s study will be the first to analyze of a high-occupancy lane expansion since the passage of Plan Bay Area in July As MTC conducts, or supports county agencies to conduct, other studies across the region to follow up on the commitments made in Plan Bay Area, those studies should use this Optimized HOT scenario approach page 24
25 convert an existing general purpose lane and simultaneously invest in transportation choices along the same corridor. Regional Support for Innovation MTC should express support for the state (and, if necessary, federal) legislative changes described in this section. MTC should replicate this paper s proposed Optimized HOT strategy in more detail using traffic modeling tools for other highway segments anywhere that new construction is proposed to create either an HOT or an HOV lane. These segments should include any proposed construction of new lanes in the Bay Area Express Lane Network. MTC should also look at optimizing lanes on any highway corridor that has at least 8 mixed-flow lanes and no HOV lanes, such as Highway 24 or 880 through Oakland, even if the corridor is not currently part of the region s proposed HOT network. Don t Let Federal Restrictions Get in the Way Federal law may also apply, stating that federal funds may be used to create an HOT lane only if the project increases highway capacity or if the project is a conversion of an existing HOV lane. This restriction, however, only applies if a project intends to use federal funds. As described in Section III, federal funds are not currently allowed to be used to implement the Optimized HOT solution. For Highway 101 in San Mateo County, this may not be a problem for this project. The Optimized HOT scenario has a small-enough capital cost that it should be possible to complete without using any federal funds, particularly given ongoing cuts in federal funding. Over the long-term, however, it may be necessary to secure federal approval of demonstration projects as proposed above for the state of California or a permanent change in law to allow federal funds to be used to implement the Optimized HOT scenario. Don't Let Federal Restrictions Get in the Way Congress should support state and local innovation by allowing a limited number of federally-funded Optimized HOT demonstration projects or by permanently expanding the definition of allowable uses of federal funds. page 25
26 Appendix The following provides methodological notes about relevant sections in the paper above. Section headers in this appendix refer to sections in the paper above. Existing Conditions (Section IV) Existing Vehicle Demand Existing conditions are largely based on the San Mateo US-101 Freeway Corridor Technical Analysis for Corridor System Management Plan, completed in 2010 by Dowling Associates for San Mateo C/CAG. 41 Total daily bi-direction traffic volumes range from 110,000 to 190,000 vehicles depending on location. 42 Peak-period bi-direction traffic varies from 49,000 to 54,000 vehicles during the 4-hour morning peak to 56,000 to 61,000 in the 5-hour evening peak. 43 This analysis makes several simplifying assumptions. These include: Analyze only one direction of travel, because the directional split along this stretch of Highway 101 is roughly even, as shown on Table A-1. The mode splits in each direction are also roughly similar to each other. 44 That is, there is about the same amount of traffic, with about the same mix of vehicles, going northbound and southbound, in both the AM and PM peak periods. Analyze AM peak period only. The AM peak period, 6 AM to 10 AM, is chosen because it is a more realistic representation of peak period conditions than data available for the PM peak period, which was defined in C/CAG s study as 2:30 PM to 7:30 PM. Analyze the corridor based on an average traffic volume averaged across five locations along the corridor. Table A-1: Directional Split on Highway 101 in San Mateo County 45 Time/Direction NB SB AM 42-53% 47-58% PM 46-52% 48-54% Average AM peak period vehicle volume for 2009 was 26,037 vehicles per direction. 46 Existing Mode Choice Table 1 presents the average mode choice in existing conditions for the AM Peak Period, using an average of both directions. 47 Mode choices presented are a straight average of observed mode splits for 3 different locations, in AM and PM peak periods, for both directions of travel. This paper makes two revisions from those straight-line averages: the fraction of both buses and vanpools in 2013 is assumed to be slightly higher than what was observed in 2009, due to the reported increase in private transit use. As a simplifying assumption, this paper assumes that this very modest shift towards transit and vanpools comes from the share of solo occupant vehicles. All data are rounded to the nearest ten vehicles or people or to the nearest tenth of a percent. The number of people is based on average vehicle occupancy rates shown in Table A-2: page 26
27 Table A-2: Average Vehicle Occupancy Rates Mode # People / Vehicle Single-occupancy person carpool carpool Bus Vanpool Motorcycle Trucks Note that for Highway 101 in San Mateo County, this may be a very low vehicle occupancy assumption for buses. Private transit vehicle load factors are often much higher than the standard industry assumptions used here some tech companies routinely operate buses with 40 and 50 people aboard. A comprehensive summary of 33 HOV facilities nationwide found an average bus vehicle occupancy rate of 35 persons/bus. Since a higher bus VOR would accentuate the benefits of the Optimized HOT scenario, this relatively low VOR is a conservative assumption for the purpose of this analysis. Existing Traffic Levels, by Lane Existing traffic levels in each lane are calculated by taking the total vehicle demand and distributing it across the existing highway geometry, with demand absorbed by general purpose and auxiliary lanes based on standard industry assumptions. This stretch of Highway 101 has four general purpose lanes for the entire length of the corridor and auxiliary lanes for 80% of the directional miles, based on a visual inspection of the map of auxiliary lanes. 53 One directional mile of auxiliary lanes is assumed to absorb 95% as much capacity as a through lane. 54 As a result, the existing auxiliary lane on this stretch of Highway 101 is assumed to absorb 76% as much traffic as a full-length general purpose lane (76% = 80% x 95%). Applying that capacity to the existing vehicle volumes produces the per-lane traffic levels reported in Table 9. Future Conditions (section VI) Future Vehicle Demand Baseline future conditions are based on the same San Mateo US-101 Freeway Corridor Technical Analysis for Corridor System Management Plan as was used for existing conditions, using the same simplifying assumptions. Using those same assumptions, the predicted 2030 average vehicle volume for the AM peak period is 30,994 vehicles. 55 This volume is based on an average, across five locations, of the predicted 2030 bi-directional vehicle volumes, divided by two to provide predicted vehicle volumes for one direction of travel. Bi-directional traffic is projected to vary from 57,000 to 70,000 vehicles in the 6 AM to 10 AM morning peak and from 75,000 to 91,000 in the 2 PM to 7 PM afternoon/evening peak, depending on location. These represent morning and afternoon/evening peak period growth rates from 15 26% for 2005 to 2030, and 4-10% growth from 2015 to Future Mode Shift Efforts (section VII) Aggressive Mode Shift Effort Estimated capital and operating costs of the new public transit and vanpool services are estimated as follows: Capital Costs page 27
Memorandum. Fund Allocation Fund Programming Policy/Legislation Plan/Study Capital Project Oversight/Delivery Budget/Finance Contract/Agreement Other:
 Memorandum Date: March 23, 2018 To: Transportation Authority Board From: Eric Cordoba Deputy Director Capital Projects Subject: 4/10/18 Board Meeting: San Francisco Freeway Corridor Management Study Update
San Mateo County Transportation Authority Board Meeting November 2, 2017 Item #10 1
 San Mateo County Transportation Authority Board Meeting November 2, 2017 Item #10 1 OVERVIEW Brief recap from October Traffic Analysis Findings Draft Environmental Document Summarized Outcomes Questions
Arlington County Board Meeting Project Briefing. October 20, 2015
 Arlington County Board Meeting Project Briefing October 20, 2015 Project Map 2 Project Context Only Interstate in the Country limited to HOV only traffic during rush hours Stoplight at the end of I-66
San Mateo 101 Corridor Strategies:
 San Mateo 101 Corridor Strategies: An Innovative Partnership in the Making June 25, 2015 This is NOT 1976 Santa Monica LA Times 7/20/76 LA Times 6/11/76 LA Times 8/23/76 Many innovative strategies available
Interstate 90 and Mercer Island Mobility Study APRIL Commissioned by. Prepared by
 Interstate 90 and Mercer Island Mobility Study APRIL 2017 Commissioned by Prepared by Interstate 90 and Mercer Island Mobility Study Commissioned by: Sound Transit Prepared by: April 2017 Contents Section
Public Information Meetings. October 5, 6, 7, and 15, 2015
 Public Information Meetings October 5, 6, 7, and 15, 2015 Project Map 2 Project Context Only Interstate in the Country limited to HOV only traffic during rush hours Stoplight at the end of I-66 eastbound
Memorandum. Roger Millar, Secretary of Transportation. Date: April 5, Interstate 90 Operations and Mercer Island Mobility
 Memorandum To: From: The Honorable Dow Constantine, King County Executive; The Honorable Ed Murray, City of Seattle Mayor; The Honorable Bruce Bassett, City of Mercer Island Mayor; The Honorable John Stokes,
McLean Citizens Association Transportation Committee Project Briefing
 McLean Citizens Association Transportation Committee Project Briefing November 10, 2015 Project Map 2 Project Context Only Interstate in the Country limited to HOV only traffic during rush hours Stoplight
5.1 Traffic and Transportation
 5.1 When it opens in 2009, the Bellevue Nickel Improvement Project will increase the number of vehicles able to travel through the study area, improve travel speeds, and improve safety by reducing the
Selection of a Locally Preferred Alternative for the Interstate 405 Improvement Project Between State Route 55 and Interstate 605.
 ORANGE COUNTY TRANSPORTATION AUTHORITY Selection of a Locally Preferred Alternative for the Interstate 405 Improvement Project Between State Route 55 and Interstate 605 PowerPoint San Diego Freeway (Interstate
What We ve Learned About Highway Congestion
 What We ve Learned About Highway Congestion BY PRAVIN VARAIYA THERE ARE 26,000 SENSORS buried under the pavements of California freeways. Every thirty seconds, those sensors send data to our computers
Word Count: 3,565 Number of Tables: 4 Number of Figures: 6 Number of Photographs: 0. Word Limit: 7,500 Tables/Figures Word Count = 2,250
 Katherine F. Turnbull, Ken Buckeye, Nick Thompson 1 Corresponding Author Katherine F. Turnbull Executive Associate Director Texas Transportation Institute Texas A&M University System 3135 TAMU College
Appendix 4.1 J. May 17, 2010 Memorandum from CTPS to the Inter Agency Coordinating Group
 Appendix 4.1 J May 17, 2010 Memorandum from CTPS to the Inter Agency Coordinating Group CTPS CENTRAL TRANSPORTATION PLANNING STAFF Staff to the Boston Region Metropolitan Planning Organization MEMORANDUM
SAMTRANS TITLE VI STANDARDS AND POLICIES
 SAMTRANS TITLE VI STANDARDS AND POLICIES Adopted March 13, 2013 Federal Title VI requirements of the Civil Rights Act of 1964 were recently updated by the Federal Transit Administration (FTA) and now require
Treasure Island Supplemental Information Report Addendum
 1 1 1 1 0 1 0 1 0 1 Treasure Island Supplemental Information Report Addendum Introduction Purpose The purpose of this Supplemental Information Report (SIR) Addendum is to determine if the current land
HOV LANE PERFORMANCE MONITORING: 2000 REPORT EXECUTIVE SUMMARY
 Final Report Research Project Agreement No. T1803, Task 4 HOV Monitoring V HOV LANE PERFORMANCE MONITORING: 2000 REPORT EXECUTIVE SUMMARY by Jennifer Nee TRAC Research Engineer John Ishimaru TRAC Senior
DRAFT PLAN & DRAFT EIR
 DRAFT PLAN & DRAFT EIR April 27, 2017 Transportation Authority of Marin Meeting Matt Maloney, MTC Principal Planner Plan Bay Area 2040 establishes a 24-year regional vision for growth and investment. Image
DISTRICT EXPRESS LANES ANNUAL REPORT FISCAL YEAR 2017 JULY 1, 2016 JUNE 30, FloridaExpressLanes.com
 DISTRICT EXPRESS LANES ANNUAL REPORT FISCAL YEAR 2017 JULY 1, 2016 JUNE 30, 2017 FloridaExpressLanes.com This page intentionally left blank. TABLE OF CONTENTS List of Figures... ii List of Tables.... ii
APPENDIX J MODIFICATIONS PERFORMED TO THE TOR
 APPENDIX J MODIFICATIONS PERFORMED TO THE TOR This appendix summarizes the modifications that were performed in years 2012 and 2017 to rectify calculation errors that were observed in the data presented
TransAction Overview. Introduction. Vision. NVTA Jurisdictions
 Introduction Vision NVTA Jurisdictions In the 21 st century, Northern Virginia will develop and sustain a multimodal transportation system that enhances quality of life and supports economic growth. Investments
LOS ANGELES COUNTY CONGESTION REDUCTION DEMONSTRATION INITIATIVE
 One Gateway Plaza Los Angeles, CA 90012-2952 213-922.2000 Tel metro.net 35 REGULAR BOARD MEETING JULY 24, 2008 SUBJECT: ACTION: LOS ANGELES COUNTY CONGESTION REDUCTION DEMONSTRATION INITIATIVE AMEND THE
MEMORANDUM. Open Section Background. I-66 Open Section Study Area. VDOT Northern Virginia District. I-66 Project Team. Date: November 5, 2015
 MEMORANDUM To: VDOT Northern Virginia District From: I-66 Project Team Date: November 5, 2015 Subject: Open Section Background The purpose of this technical memorandum is to provide narrative and technical
Federal Subsidies to Passenger Transportation December 2004
 U.S. Department of Transportation Bureau of Transportation Statistics Federal Subsidies to Passenger Transportation December 2004 Federal Subsidies to Passenger Transportation Executive Summary Recent
DRAFT Service Implementation Plan
 2017 Service Implementation Plan October 2016 SECTION NAME 2017 Service Implementation Plan October 2016 2017 SERVICE IMPLEMENTATION PLAN TABLE OF CONTENTS Table of Contents... I List of Tables... III
Draft SamTrans Service Plan Public Outreach Presentation
 Draft SamTrans Service Plan Public Outreach Presentation Main Street Park, Half Moon Bay October 16, 2012 Meeting Agenda Introduction Project Information & Background Proposed route changes Next Steps
Eleven things you should know about the carpool lanes in Los Angeles County.
 Eleven things you should know about the carpool lanes in Los Angeles County. Los Angeles County Metropolitan Transportation Authority One Gateway Plaza Los Angeles, CA 912 COMPANY NAME Street Address City,
Tolling in Washington State. Craig J. Stone, P.E. Assistant Secretary, Toll Division
 Tolling in Washington State Craig J. Stone, P.E. Assistant Secretary, Toll Division Connecticut Department of Transportation Bridgeport, CT June 4, 2014 Tolling in Washington State Tolling is part of Washington
Fast Lanes Study Phase III Telephone Survey Results
 Fast Lanes Study Phase III Telephone Survey Results Methodology 2012 Fast Lanes Study 6/7/12 2 194,000 196,000 651,000 Adults (18+) 261,000 Methodology Areas in Mecklenburg & Union Counties defined by
MEMORANDUM. for HOV Monitoring on I-93 North and the Southeast Expressway, Boston Region MPO, November, 2011.
 MEMORANDUM Date: January 12, 2012 To: Congestion Management Process Files From: Seth Asante, Ryan Hicks, and Efi Pagitsas MPO Staff Re: Historical Trends: Travel Times and Vehicle Occupancy Levels for
MEMORANDUM. Lynn Hayes LSA Associates, Inc.
 MEMORANDUM To: Lynn Hayes LSA Associates, Inc. Date: May 5, 217 From: Zawwar Saiyed, P.E., Senior Transportation Engineer Justin Tucker, Transportation Engineer I Linscott, Law & Greenspan, Engineers LLG
Research Report Agreement T4118, Task 24 HOV Action Plan HOV ACTION PLAN
 Research Report Agreement T4118, Task 24 HOV Action Plan HOV ACTION PLAN by John M. Ishimaru Senior Research Engineer Duane Wright Systems Analyst Programmer Mark E. Hallenbeck Director Jaime Kang Research
I-405 Express Toll Lanes Coming in 2015
 I-405 Express Toll Lanes Coming in 2015 Jennifer Charlebois Roadway Toll Systems PE, Toll Division Anne Broache Public Information, I-405/SR 167 Lynn Peterson Secretary of Transportation Market Neighborhood
Congestion Pricing The Latest Weapon the U.S. War on Traffic Congestion. Darren Henderson, AICP
 Congestion Pricing The Latest Weapon the U.S. War on Traffic Congestion Darren Henderson, AICP Today s s Discussion How bad is congestion? What has been done about it? What else can be done? How Bad is
Appendix B Ultimate Airport Capacity and Delay Simulation Modeling Analysis
 Appendix B ULTIMATE AIRPORT CAPACITY & DELAY SIMULATION MODELING ANALYSIS B TABLE OF CONTENTS EXHIBITS TABLES B.1 Introduction... 1 B.2 Simulation Modeling Assumption and Methodology... 4 B.2.1 Runway
REGION OF WATERLOO INTERNATIONAL AIRPORT AIRPORT MASTER PLAN EXECUTIVE SUMMARY MARCH 2017
 REGION OF WATERLOO INTERNATIONAL AIRPORT AIRPORT MASTER PLAN EXECUTIVE SUMMARY MARCH 2017 Contact: Chris Wood, Airport General Manager cwood@regionofwaterloo.ca (519) 648-2256 ext. 8502 Airport Master
FNORTHWEST ARKANSAS WESTERN BELTWAY FEASIBILITY STUDY
 FNORTHWEST ARKANSAS WESTERN BELTWAY FEASIBILITY STUDY EXECUTIVE SUMMARY The 2030 Northwest Arkansas Regional Transportation Plan developed by the Northwest Arkansas Regional Planning Commission (NWARPC)
Oakland A s Gondola Economic Impact
 January 2019 Oakland A s Gondola Economic Impact KEY FINDING: The proposed gondola system, which will connect the A s planned stadium to downtown Oakland, will generate $685 million in total economic benefit
A. CONCLUSIONS OF THE FGEIS
 Chapter 11: Traffic and Parking A. CONCLUSIONS OF THE FGEIS The FGEIS found that the Approved Plan will generate a substantial volume of vehicular and pedestrian activity, including an estimated 1,300
De luchtvaart in het EU-emissiehandelssysteem. Summary
 Summary On 1 January 2012 the aviation industry was brought within the European Emissions Trading Scheme (EU ETS) and must now purchase emission allowances for some of its CO 2 emissions. At a price of
8 CROSS-BOUNDARY AGREEMENT WITH BRAMPTON TRANSIT
 8 CROSS-BOUNDARY AGREEMENT WITH BRAMPTON TRANSIT The Transportation Services Committee recommends the adoption of the recommendations contained in the following report dated May 27, 2010, from the Commissioner
Lake Erie Commerce Center Traffic Analysis
 LOCATION: East of NYS Route 5 at Bayview Road Town of Hamburg Erie County, New York PREPARED BY: Wendel Companies 140 John James Audubon Parkway Suite 200 Amherst, New York 14228 January 2012 i ii Table
Metro ExpressLanes April 5, 2011 Community Meeting re: Adams Blvd Improvements
 Metro ExpressLanes April 5, 2011 Community Meeting re: Adams Blvd Improvements Jan Perry Councilwoman, District 9 Welcome Remarks Arthur T. Leahy Chief Executive Officer, Metro Metro ExpressLanes Overview
Project Deliverable 4.1.3d Individual City Report - City of La Verne
 Pomona Valley ITS Project Project Deliverable 4.1.3d Individual City Report - City of La Verne Prepared by: April 19, 2002 099017000.1 Copyright 2002, Kimley-Horn and Associates, Inc TABLE OF CONTENTS
The San Diego Region s Air Transportation Future
 The San Diego Region s Air Transportation Future June 22, 2006 1 Ryan N. Hall, Airport System Planner II San Diego County Regional Airport Authority Presentation Overview 1. The law 2. The ballot measure
I-95/395 HOV/Bus/HOT Lanes Project Overview
 I-95/395 HOV/Bus/HOT Lanes Project Overview 2 I-95/395 HOV/Bus/HOT Lanes Meetings Agenda 7 p.m. to 9 p.m. Open House Information Stations and Q&A With Project Staff 7:30 p.m. and 8:30 p.m. Project Overview
Establishes a fare structure for Tacoma Link light rail, to be implemented in September 2014.
 RESOLUTION NO. R2013-24 Establish a Fare Structure and Fare Level for Tacoma Link MEETING: DATE: TYPE OF ACTION: STAFF CONTACT: PHONE: Board 09/26/2013 Final Action Ric Ilgenfritz, Executive Director,
Director King County Department of Transportation. King County Department of Transportation
 Tolling in Washington State t Harold S. Taniguchi Director Why tolling Why Tolling? Gas tax down Electric collection technology Reduce peak demand and greenhouse gas emissions Tolling today in Washington
A Tour Across America s Managed Lanes Mike Heiligenstein, Executive Director Central Texas Regional Mobility Authority
 A Tour Across America s Managed Lanes Mike Heiligenstein, Executive Director Central Texas Regional Mobility Authority IBTTA Global Tolling Summit; Salzburg, Austria September 6, 2018 The Rise of Managed
WCCTAC BOARD OF DIRECTORS SPECIAL MEETING NOTICE AND AGENDA: REGIONAL HOT LANE NETWORK
 El Cerrito WCCTAC BOARD OF DIRECTORS SPECIAL MEETING NOTICE AND AGENDA: REGIONAL HOT LANE NETWORK Hercules Pinole Richmond DATE & TIME: LOCATION: Monday, July 13, 2009, 8:00 a.m. City of San Pablo, Council
FIRST WEEK UPDATE: 66 EXPRESS LANES INSIDE THE BELTWAY Data from first four days shows faster, more reliable trips on I-66
 FOR IMMEDIATE RELEASE Tuesday, December 12, 2017 CONTACT: Michelle T. Holland 703-586-0487 (C) Michelle.Holland@vdot.virginia.gov Jennifer McCord 571-230-2926 Jennifer.McCord@vdot.virginia.gov FIRST WEEK
NORTH FRASER PERIMETER ROAD WEST CORRIDOR DEFINITION STUDY
 NORTH FRASER PERIMETER ROAD WEST CORRIDOR DEFINITION STUDY MAY 2011 SW1132SWD NORTH FRASER PERIMETER ROAD WEST CORRIDOR DEFINITION STUDY TABLE OF CONTENTS 1.0 INTRODUCTION... 1 2.0 CURRENT TRAVEL PATTERNS
HDR itrans Consulting Inc. 100 York Blvd., Suite 300 Richmond Hill, ON L4B 1J8 Tel: (905) Fax: (905)
 Fax: (905)") !" # $ !" # $ Consulting Inc. 100 York Blvd., Suite 300 Richmond Hill, ON L4B 1J8 Tel: (905) 882-4100 Fax: (905) 882-1557 www.itransconsulting.com November 2009 %&'('$&$ 1. West Brampton Road Network...
!" # $ !" # $ Consulting Inc. 100 York Blvd., Suite 300 Richmond Hill, ON L4B 1J8 Tel: (905) 882-4100 Fax: (905) 882-1557 www.itransconsulting.com November 2009 %&'('$&$ 1. West Brampton Road Network...
APPENDIX B COMMUTER BUS FAREBOX POLICY PEER REVIEW
 APPENDIX B COMMUTER BUS FAREBOX POLICY PEER REVIEW APPENDIX B COMMUTER BUS FAREBOX POLICY PEER REVIEW The following pages are excerpts from a DRAFT-version Fare Analysis report conducted by Nelson\Nygaard
FIRST WEEK UPDATE: 66 EXPRESS LANES INSIDE THE BELTWAY Data from first four days shows faster, more reliable trips on I-66
 Subject: FIRST WEEK UPDATE: 66 EXPRESS LANES INSIDE THE BELTWAY From: VDOT-News To: Time: Tuesday, December 12, 2017 9:05:36 AM -08:00 RELEASE: IMMEDIATE Michelle Holland,
Like many transit service providers, the Port Authority of Allegheny County (Port Authority) uses a set of service level guidelines to determine
 uses a set of service level guidelines to determine") Transit service consists of two fundamental elements: frequency (how often service operates) and service span (how long service runs during the day). Combined, these two factors measure how much service
Transit service consists of two fundamental elements: frequency (how often service operates) and service span (how long service runs during the day). Combined, these two factors measure how much service
Toronto 2015 Pan Am/Parapan Am Games Temporary Traffic By-law Amendments for High Occupancy Vehicle Lanes (Supplementary Report)
") STAFF REPORT ACTION REQUIRED Toronto 2015 Pan Am/Parapan Am Games Temporary Traffic By-law Amendments for High Occupancy Vehicle Lanes (Supplementary Report) Date: March 25, 2015 To: From: Wards: Reference
STAFF REPORT ACTION REQUIRED Toronto 2015 Pan Am/Parapan Am Games Temporary Traffic By-law Amendments for High Occupancy Vehicle Lanes (Supplementary Report) Date: March 25, 2015 To: From: Wards: Reference
SAMTRANS SERVICE PLAN
 Agenda Overview Part I: Key Findings Market Assessment Service Evaluation Part II: Service Development Framework Metrics Criteria Part III: Next Steps SAMTRANS SERVICE PLAN Preliminary Analysis and Criteria
PREFACE. Service frequency; Hours of service; Service coverage; Passenger loading; Reliability, and Transit vs. auto travel time.
 PREFACE The Florida Department of Transportation (FDOT) has embarked upon a statewide evaluation of transit system performance. The outcome of this evaluation is a benchmark of transit performance that
Economic Impact of Tourism in Hillsborough County September 2016
 Economic Impact of Tourism in Hillsborough County - 2015 September 2016 Key findings for 2015 Almost 22 million people visited Hillsborough County in 2015. Visits to Hillsborough County increased 4.5%
Playa Vista Ability2Change Webinar
 Playa Vista Ability2Change Webinar Aaron Gaul Director UrbanTrans North America Hi, I m Aaron. I m a transportation nerd. 1 PROJECT CONTEXT Playa Vista Community Overview 5,100+ employees 49% growth in
Ideas + Action for a Better City learn more at SPUR.org. tweet about this #FarePolicy
 Ideas + Action for a Better City learn more at SPUR.org tweet about this event: @SPUR_Urbanist #FarePolicy Regional Fare Policy & Clipper 2.0 Arielle Fleisher, Senior Transportation Policy Associate October
ALL ABOARD LABOR S LONG TERM PASSENGER TRANSPORT STRATEGY
 ALL ABOARD LABOR S LONG TERM PASSENGER TRANSPORT STRATEGY Revitalising Passenger Transport Increasing traffic congestion in our cities and a lack of transport services in our regional towns is frustrating
METROBUS SERVICE GUIDELINES
 METROBUS SERVICE GUIDELINES In the late 1990's when stabilization of bus service was accomplished between WMATA and the local jurisdictional bus systems, the need for service planning processes and procedures
Update on the I-680 Transit Corridor Improvement Project HOV on/off Ramps Environmental Impact Report Community Engagement Plan
 Update on the I-680 Transit Corridor Improvement Project HOV on/off Ramps Environmental Impact Report Community Engagement Plan Presentation Overview Introductions Susan Miller, Director of Projects, Contra
Parkland County Municipal Development Plan Amendment Acheson Industrial Area Structure Plan
 Parkland County Municipal Development Plan Amendment Acheson Industrial Area Structure Plan New Plan Acheson Industrial Area Structure Plan Amendment Parkland County Municipal Development Plan Board Reference
This report recommends two new TTC transit services in southwest Toronto.
 Report for Action New TTC Services - Southwest Toronto Date: March 20, 2018 To: TTC Board From: Chief Customer Officer Summary This report recommends two new TTC transit services in southwest Toronto.
Design Public Hearing
 Design Public Hearing Monday, March 7, 2016 Washington-Lee High School Cafeteria 1301 N. Stafford Street, Arlington, VA 22201 Tuesday, March 8, 2016 Eagle Ridge Middle School Cafeteria 42901 Waxpool Road,
FY Transit Needs Assessment. Ventura County Transportation Commission
 FY 18-19 Transit Needs Assessment Ventura County Transportation Commission Contents List of Figures and Appendices.. 2 Appendices... 1 Chapter 1: Introduction What is the Ventura County Transportation
THIRTEENTH AIR NAVIGATION CONFERENCE
 International Civil Aviation Organization AN-Conf/13-WP/22 14/6/18 WORKING PAPER THIRTEENTH AIR NAVIGATION CONFERENCE Agenda Item 1: Air navigation global strategy 1.4: Air navigation business cases Montréal,
5 Rail demand in Western Sydney
 5 Rail demand in Western Sydney About this chapter To better understand where new or enhanced rail services are needed, this chapter presents an overview of the existing and future demand on the rail network
DUFFERIN ELEMENTARY PLANNING STUDY SCHOOL DISTRICT 68 (NANAIMO-LADYSMITH)
") DUFFERIN ELEMENTARY PLANNING STUDY SCHOOL DISTRICT 68 (NANAIMO-LADYSMITH) April 2006 Report Consultants Matrix Planning Associates Unit 2, 933 Meares Street Victoria, British Columbia Canada V8V 5B8 Telephone:
DUFFERIN ELEMENTARY PLANNING STUDY SCHOOL DISTRICT 68 (NANAIMO-LADYSMITH) April 2006 Report Consultants Matrix Planning Associates Unit 2, 933 Meares Street Victoria, British Columbia Canada V8V 5B8 Telephone:
Transform66 Transportation Management Plan: Transit & TDM Strategies
 Transform66 Transportation Management Plan: Transit & TDM Strategies Commuter Connections Committee November 15, 2016 1 Transforming I-66 A short introduction. http://outside.transform66.org/meetings/video_recordings.asp
This page intentionally left blank
 This page intentionally left blank Prepared for: Nevada Department of Transportation Prepared by: July 2015 This page intentionally left blank Table of Contents Executive Summary... ES-1 ES.1. HOV System
Mount Pleasant (42, 43) and Connecticut Avenue (L1, L2) Lines Service Evaluation Study Open House Welcome! wmata.com/bus
 and Connecticut Avenue (L1, L2) Lines Service Evaluation Study Open House Welcome! wmata.com/bus") Mount Pleasant (42, 43) and Connecticut Avenue (L1, L2) Lines Service Evaluation Study Open House Welcome! Study Overview and Timeline Phase 1: Collect and Analyze Data Project Kickoff, September 2017
Mount Pleasant (42, 43) and Connecticut Avenue (L1, L2) Lines Service Evaluation Study Open House Welcome! Study Overview and Timeline Phase 1: Collect and Analyze Data Project Kickoff, September 2017
Traffic Analysis Final Report
 SR-71 Widening Project Project Approval/Environmental Documentation Traffic Analysis Final Report Prepared for Caltrans District 7 August 2012 6 Hutton Centre Drive, Suite 700 Santa Ana, California 92707
All Door Boarding Title VI Service Fare Analysis. Appendix P.3
 All Door Boarding Title VI Service Fare Analysis Appendix P.3 Metro Board Report Los Angeles County Metropolitan Transportation Authority One Gateway Plaza 3rd Floor Board Room Los Angeles,
2015 Independence Day Travel Overview U.S. Intercity Bus Industry
 2015 Independence Day Travel Overview U.S. Intercity Bus Industry Chaddick Institute for Metropolitan Development, DePaul University June 25, 2015 This Intercity Bus Briefing summarizes the Chaddick Institute
CHAPTER 5: Operations Plan
 CHAPTER 5: Operations Plan Report Prepared by: Contents 5 OPERATIONS PLAN... 5-1 5.1 Proposed Service Changes... 5-2 5.1.1 Fiscal Year 2017... 5-2 5.1.2 Fiscal Year 2018... 5-6 5.1.3 Fiscal Year 2019...
1.2 Corridor History and Current Characteristics
 SECTION 1 Description and Background of Study Area 1.1 Introduction This preliminary engineering report was prepared for the Alaska Department of Transportation and Public Facilities (ADOT&PF). It is part
TRANSPORT AFFORDABILITY INDEX
 TRANSPORT AFFORDABILITY INDEX Report - December 2016 AAA 1 AAA 2 Table of contents Foreword 4 Section One Overview 6 Section Two Summary of Results 7 Section Three Detailed Results 9 Section Four City
Sunshine Coast Airport Master Plan September 2007
 Sunshine Coast Airport Master Plan September 2007 Contents CONTENTS... I ACKNOWLEDGEMENT... II DISCLAIMER... III 1 EXECUTIVE SUMMARY...IV 1 INTRODUCTION... 1 2 AVIATION DEMAND FORECAST... 5 3 AIRCRAFT
AN ANALYSIS OF CASUAL CARPOOL PASSENGER BEHAVIOR IN HOUSTON, TEXAS. A Thesis JUSTIN R. WINN
 AN ANALYSIS OF CASUAL CARPOOL PASSENGER BEHAVIOR IN HOUSTON, TEXAS A Thesis by JUSTIN R. WINN Submitted to the Office of Graduate Studies of Texas A&M University in partial fulfillment of the requirements
Business Growth (as of mid 2002)
") Page 1 of 6 Planning FHWA > HEP > Planning > Econ Dev < Previous Contents Next > Business Growth (as of mid 2002) Data from two business directories was used to analyze the change in the number of businesses
Page 1 of 6 Planning FHWA > HEP > Planning > Econ Dev < Previous Contents Next > Business Growth (as of mid 2002) Data from two business directories was used to analyze the change in the number of businesses
East West Rail Consortium
 East West Rail Consortium EWR Wider Economic Case: Refresh 18 th November 2015 Rupert Dyer Rail Expertise Ltd Rail Expertise Ltd. Tel: 01543 493533 Email: info@railexpertise.co.uk 1 Introduction 1.1 The
Activity-Based Model Applications
 Activity-Based Model Applications Activity-Based Modelling Symposium Research Centre for Integrated Transport and Innovation (rciti) UNSW, Sydney, Australia March 10, 2014 John L Bowman, Ph.D. John_L_Bowman@alum.mit.edu
Fare Policy Discussion Background and History
 Fare Policy Discussion Background and History Transportation Committee Nick Eull Senior Manager of Revenue Operations February 27 th, 2017 2013 Fare Policy Analysis Report Cross-functional group comprised
2006 WEEKDAY TRAFFIC PROFILE. June 15, 2007
 June 15, 2007 Mr. Gary Stobb, P.E. Director of Planning/Operations Harris County Toll Road Authority 330 Meadowfern, Suite 200 Houston, TX 77067 Re: Westpark Tollway Value Pricing Analysis Dear Mr. Stobb:
TABLE OF CONTENTS. Coral Springs Charter High School and Middle School Job No Page 2
 Job No. 15-019 Page 2 TABLE OF CONTENTS 1.0 INTRODUCTION... 4 2.0 EXISTING CONDITIONS... 5 3.0 TRAFFIC GENERATION... 7 4.0 TRIP DISTRIBUTION... 8 5.0 FUTURE CONDITIONS... 8 6.0 SITE ACCESS...13 7.0 CONCLUSION...13
FORT LAUDERDALE-HOLLYWOOD INTERNATIONAL AIRPORT ENVIRONMENTAL IMPACT STATEMENT DRAFT
 D.3 RUNWAY LENGTH ANALYSIS Appendix D Purpose and Need THIS PAGE INTENTIONALLY LEFT BLANK Appendix D Purpose and Need APPENDIX D.3 AIRFIELD GEOMETRIC REQUIREMENTS This information provided in this appendix
November 11, 2009 BY . Planning and Growth Management Department 110 Laurier Avenue West, 4 th Floor Ottawa, Ontario K1P 1J1. Dear Mr.
 November 11, 2009 Planning and Growth Management Department 110 Laurier Avenue West, 4 th Floor Ottawa, Ontario K1P 1J1 BY E-MAIL Attention: Mr. Don Herweyer Dear Mr. Herweyer: Reference: Abbott-Fernbank
DIRECTOR, ENVIRONMENT, FLEET, & SOLID WASTE UPDATE: REGIONAL RIDESHARE PROGRAM RECOMMENDATION
 Agenda Item # Page # 1 TO: FROM: SUBJECT: CHAIR AND MEMBERS CIVIC WORKS COMMITTEE MEETING ON APRIL 20, 2015 JAY STANFORD DIRECTOR, ENVIRONMENT, FLEET, & SOLID WASTE UPDATE: REGIONAL RIDESHARE PROGRAM RECOMMENDATION
95 Express Monthly Operations Report May 2017
 95 Express Operations Report May 17 95 Express currently has three dynamically-priced tolling segments in each direction. Segment 1 is in Miami-Dade County from just north of SR 836 to the Golden Glades
Overview of Highway 37 Project. Napa County Board of Supervisors December 20, 2016
 Overview of Highway 37 Project Napa County Board of Supervisors December 20, 2016 1 Project Location-Caltrans District 4 2 SR 37 Corridor Features 2 to 4 lane 21 mile corridor traversing Solano, Sonoma,
WESTERN EL DORADO COUNTY SHORT AND LONG-RANGE TRANSIT PLAN Executive Summary
 WESTERN EL DORADO COUNTY SHORT AND LONG-RANGE TRANSIT PLAN Executive Summary Prepared for the El Dorado County Transportation Commission Prepared by The El Dorado County Transportation Commission (EDCTC)
Submission to Infrastructure Victoria s Draft 30-Year Infrastructure Strategy
 Submission to Infrastructure Victoria s Draft 30-Year Infrastructure Strategy 1. Introduction This submission is a response to Infrastructure Victoria s assessment of the need to construct a heavy rail
MONTEREY REGIONAL AIRPORT MASTER PLAN TOPICAL QUESTIONS FROM THE PLANNING ADVISORY COMMITTEE AND TOPICAL RESPONSES
 MONTEREY REGIONAL AIRPORT MASTER PLAN TOPICAL QUESTIONS FROM THE PLANNING ADVISORY COMMITTEE AND TOPICAL RESPONSES Recurring topics emerged in some of the comments and questions raised by members of the
SAN LUIS OBISPO TRANSIT + SAN LUIS OBISPO RTA JOINT SHORT RANGE TRANSIT PLANS: SERVICE STRATEGIES. Presented by: Gordon Shaw, PE, AICP; Principal
 SAN LUIS OBISPO TRANSIT + SAN LUIS OBISPO RTA JOINT SHORT RANGE TRANSIT PLANS: SERVICE STRATEGIES Presented by: Gordon Shaw, PE, AICP; Principal Project Status Review of existing services and setting complete
Airport analyses informing new mobility shifts: Opportunities to adapt energyefficient mobility services and infrastructure
 Airport analyses informing new mobility shifts: Opportunities to adapt energyefficient mobility services and infrastructure Alejandro Henao, Josh Sperling, Venu Garikapati, Yi Hou, Stan Young National
RACINE COUNTY PUBLIC TRANSIT PLAN:
 RACINE COUNTY PUBLIC TRANSIT PLAN: 2013-2017 Recommended Transit Service Improvement Plan NEWSLETTER 3 SEPTEMBER 2013 This newsletter describes the final recommended public transit plan for the City of
Watts St westbound thru
 Executive Summary At the request of the Hudson Square Business Improvement District, Sam Schwartz Engineering, DPC (Sam Schwartz) has completed a technical analysis of various congestion pricing and/or