Sustainable Nature Based Tourism: Planning and Management
|
|
|
- Evangeline Harrell
- 6 years ago
- Views:
Transcription
1
2


3 Kulki Site Report Sustainable Nature Based Tourism: Planning and Management Report on Visitation and Use at Kulki, Far North Queensland, 2009/2010 Julie Carmody and Bruce Prideaux School of Business, James Cook University, Cairns Supported by the Australian Government s Marine and Tropical Sciences Research Facility Project Sustainable Nature Based Tourism: Planning and Management
4 James Cook University ISBN This report should be cited as: Carmody, J. and Prideaux, B. (2011) Sustainable Nature Based Tourism: Planning and Management. Report on Visitation and Use at Kulki, Far North Queensland, 2009/2010. Report to the Marine and Tropical Sciences Research Facility. Published by the Reef and Rainforest Research Centre Limited, Cairns (61pp.). Published by the Reef and Rainforest Research Centre on behalf of the Australian Government s Marine and Tropical Sciences Research Facility. The Australian Government s Marine and Tropical Sciences Research Facility (MTSRF) supports world-class, public good research. The MTSRF is a major initiative of the Australian Government, designed to ensure that Australia s environmental challenges are addressed in an innovative, collaborative and sustainable way. The MTSRF investment is managed by the Department of the Environment, Water, Heritage and the Arts (DEWHA), and is supplemented by substantial cash and in-kind investments from research providers and interested third parties. The Reef and Rainforest Research Centre Limited (RRRC) is contracted by DEWHA to provide program management and communications services for the MTSRF. This publication is copyright. The Copyright Act 1968 permits fair dealing for study, research, information or educational purposes subject to inclusion of a sufficient acknowledgement of the source. The views and opinions expressed in this publication are those of the authors and do not necessarily reflect those of the Australian Government or the Minister for the Environment, Water, Heritage and the Arts or Minister for Climate Change and Water. While reasonable effort has been made to ensure that the contents of this publication are factually correct, the Commonwealth does not accept responsibility for the accuracy or completeness of the contents, and shall not be liable for any loss or damage that may be occasioned directly or indirectly through the use of, or reliance on, the contents of this publication. Cover photographs courtesy of Shannon Hogan (Kulki beachfront, main image; marine stingers signage; beach tourists) and Julie Carmody, JCU (view from Kulki lookout). This report is available for download from the Reef and Rainforest Research Centre Limited website: March 2011
5 Report on Visitor Activity at Kulki: 2009/2010 Contents List of Tables... ii List of Figures... iii Acronyms and Abbreviations... iii Acknowledgements... iv KEY FINDINGS... V 1. INTRODUCTION Site Location and Description Previous Research Traffic Counter Data METHODOLOGY Survey Instrument Survey Collection Non-response and Observations Limitations FINDINGS Respondent Profile Perceptions of the Natural Environment Perceptions and Use of the Site Facilities Visitor Experience Additional Comments MANAGEMENT CONSIDERATIONS REFERENCES APPENDIX 1: SITE SURVEY INSTRUMENT APPENDIX 2: SITE PHOTOGRAPHS i
6 Carmody and Prideaux List of Tables Table 1: Counts of vehicular traffic recorded at Kulki during Table 2: Components of the Kulki visitor survey... 4 Table 3: Kulki visitor survey collection times and details (N = 204)... 5 Table 4: Reasons given for not participating in the Kulki visitor survey (n = 48)... 6 Table 5: Origin of Kulki survey respondents (n = 201)... 8 Table 6: Respondents age and education (n = 202) Table 7: Composition of visitor travel parties to Kulki Table 8: Kulki survey respondents travelling with an organised tour operator (n = 33) Table 9: Visitors reported previous stop before arriving at Kulki (n = 181) Table 10: Intention of survey respondents to visit other places within the region after Kulki (n = 196) Table 11: Comparative domestic and international visitors motivations to visit Kulki Table 12: Survey respondents most cited reasons for visiting Kulki Table 13: Activities which survey respondents would like to have undertaken at Kulki, but could not (n = 50) Table 14: Domestic and international visitors perceptions of the natural environment at Kulki Table 15: Survey respondents perceptions of the natural features at Kulki Table 16: Domestic and international visitors perceptions of the site facilities at Kulki Table 17: Survey respondents perceptions of the site facilities at Kulki Table 18: Facilities expected to be available at Kulki by survey respondents (n = 13) Table 19: Domestic and international survey respondents perceptions of on-site signage at Kulki Table 20: Survey respondents perceptions of on-site tourism information provided at Kulki Table 21: Survey respondents suggested additional visitor information that could be made available at the Kulki site (n = 40) Table 22: Aspects that visitors considered enhanced or increased their enjoyment of Kulki (n = 59) Table 23: Aspects visitors considered took away or detracted from their enjoyment of Kulki (n = 34) Table 24: Domestic and international visitors perceptions of other site visitors Table 25: Perceptions of other visitors at Kulki ii
7 Report on Visitor Activity at Kulki: 2009/2010 List of Figures Figure i: Cape Tribulation (Daintree National Park), showing the Kulki visitor survey site... vi Figure 1: Counts of vehicular traffic recorded at Kulki during Figure 2: Surveys collected at Kulki by date and time (N = 204)... 5 Figure 3: Occupations of Kulki survey respondents (n = 203)... 9 Figure 4: Age groups of Kulki survey respondents (n = 203) Figure 5: Levels of education attained by Kulki survey respondents (n = 202) Figure 6: Modes of transport used by survey respondents to travel to Kulki (n = 139) Figure 7: Survey respondents frequency of visitation to protected natural areas (n = 191) Figure 8: Activities undertaken at Kulki as cited by survey respondents (n = 203) in response to a multiple-response survey question Figure 9: Approximate time spent at Kulki by both domestic and international visitors (n = 201) Figure 10: Survey respondents willingness to pay an access/entrance fee to visit Kulki (n = 199) Figure 11: Survey respondents suggested uses of an on-site Park Ranger at Kulki in response to a multiple-response survey question (n = 200) Figure 12: Most popular Kulki site facilities used by survey respondents, cited in response to a multiple-response survey question (n = 204) Figure 13: Sources of information consulted by survey respondents prior to visiting Kulki (n = 204) Acronyms and Abbreviations DERM... Queensland Department of Environment and Resource Management MTSRF... Marine and Tropical Sciences Research Facility N... Entire survey sample n... Portion of survey sample QPWS... Queensland Parks and Wildlife Service WTMA... Wet Tropics Management Authority WTWHA... Wet Tropics World Heritage Area iii
8 Carmody and Prideaux Acknowledgements Funding for this research was provided by the Australian Government s Marine and Tropical Sciences Research Facility (MTSRF) and the Wet Tropics Management Authority. We would like to thank the following people for their assistance. Those involved in the distribution and collection of surveys were Debbie Cobden, Jonathan Sibtain and Lisa King. Data entry was completed by Debbie Cobden. We would also like to acknowledge the assistance of Max Chappell and Andrew Maclean of the Wet Tropics Management Authority; and Andrew Millerd, Tina Alderson, Jodie Bray and Delys Wilson from the Queensland Department of Environment and Resource Management. iv
9 Report on Visitor Activity at Kulki: 2009/2010 Key Findings The following key findings are based on a visitor survey (N = 204) undertaken at Kulki between August and October Where findings are reported as a mean, 1 represents the lowest level of agreement with given statements by survey respondents, while 6 represents the highest level of agreement. Respondent Profile Both domestic (44.8%) and international (55.2%) respondents completed the survey. Respondents ranged from 16 to 65 years, with the average age being 36.5 years. Travel Patterns Respondents travelled to Kulki from Port Douglas (18.2%), Cairns (11.0%) and the Daintree (7.7%). After visiting Kulki respondents travelled to Port Douglas (28.1%), Cairns (15.3%) and Cape Tribulation (8.7%). Word-of-mouth (37.5%), travel guides (36.5%) and tourist maps (33.0%) were the major information sources used prior to their visit. Reasons for Visiting Kulki Respondents visited Kulki to experience the natural features of the site (mean = 5.41) and to be close to nature (5.13). Activities Observing the scenery (89.2%), short walks (83.3%), photography (65.5%) and relaxing (59.9%) were the main activities participated in. Perceptions of the Natural Environment The natural environment at Kulki was considered interesting (mean = 5.35), in good condition (5.29) and appealing in terms of scenic beauty (5.27). Perceptions and Use of the Site Facilities The site facilities were considered to be in reasonably good condition (mean = 4.84). The presence of a ranger at the site was endorsed (mean = 4.10). The most popular facilities were the walking track (76.1%), viewing platform (65.7%), boardwalk (64.2%), and toilets (52.3%). Perceptions of Signage Information about rules and safety was considered easy to understand (mean = 5.04). Information on the site s Aboriginal culture, natural environment and wildlife is desirable. Satisfaction with the Visitor Experience The rainforest, natural beauty and tranquillity of Kulki enhanced the visitor experience. Overcrowding is not perceived as an issue at Kulki. v
, showing the Kulki")

10 CAPE TRIBULATION DAINTREE NATIONAL PARK Figure i: Cape Tribulation (Daintree National Park), showing the Kulki visitor survey site. Map courtesy of Queensland Parks and Wildlife Service, Department of Environment and Resource Management. vi
11 Report on Visitor Activity at Kulki: 2009/ Introduction This report is one of a series of ten that examine visitor activity at sites within Wet Tropics rainforests. The aim of the research was to provide a snapshot of visitor activity to inform management on how sites are used and investigate visitors views on site management. Visitor data was collected using a self-completed visitor survey. Collectively the series of reports will provide an overall understanding of how visitors use the rainforest and provide managers with feedback that can be used for site management and future planning. Responsibility for the management of the Wet Tropics rainforests is shared by the Wet Tropics Management Authority (WTMA) and the Queensland Department of Environment and Resource Management (DERM). The WTMA was established after listing of the Wet Tropics as a World Heritage site and is responsible for the planning of visitor sites across the Wet Tropics World Heritage Area (WTWHA). The Queensland Parks and Wildlife Service (QPWS), an agency of the DERM, has responsibility for the day to day management of site infrastructure including toilets, car parking, signage, viewing lookouts, boardwalks, walking trails and other recreational facilities. The Wet Tropics has a large number of visitor sites, some of which have high rates of visitation. A number of sites have relatively low visitation rates, but all offer unique nature-based visitor experiences. 1.1 Site Location and Description The Kulki visitor site is located in the Cape Tribulation section of the Daintree National Park, which encompasses an area of approximately 17,000 ha stretching in a narrow strip from the Daintree River in the south to the Bloomfield River in the north and bordered by the McDowall Range in the west. The site forms part of the traditional land of the eastern Kuku Yalanji people and was a meeting place where traditional owners gathered materials to make tools as well as natural medicines and food. Daintree National Park was declared in 1981 by the former Queensland Premier Sir Joh Bjelke-Petersen in response to protests against clearing of the rainforest by landholders. The Park was included in the World Heritage Area listing in The visitor site was opened in 1988 and upgraded in 1997 with funds from the Daintree Rescue Program. Up to the early 1980s the beach was used as a road for vehicles travelling to campsites further north. It was also a locally known nudist beach. The Kulki visitor site (formerly known as the Cape Tribulation site) is the most northern developed visitor site within this section of the Daintree National Park and is managed by the QPWS. A picnic area and bio-toilets have been constructed at the site. A map of Kulki with the approximate location of the survey collection is provided at Figure i. The site s main facilities are a walkway that connects the car park to the beach and a 600 metre boardwalk that commences at the picnic area and extends up a ridge to a lookout named in honour of two senior Yalanji custodians, Numbaji and Jinabaji. The most significant natural features of the site are the wide, gently sloping beach and exceptional views of the ocean and the rainforest. 1
12 Carmody and Prideaux 1.2 Previous Research A visitor use monitoring strategy was commissioned by the WTMA in 1993 to gain an understanding of visitor use and travel patterns. Manidis Roberts Consultants conducted visitor surveys during the wet season (March/April) and again during the dry season (September/October) of 1993 across 56 individual visitor sites and three conglomerate sites within the WTWHA. The research approach included traffic counts, site observations and visitor interviews. Three versions of the visitor survey were developed one for independent travellers, one for those travelling with a commercial operator and one left at sites as a selfregistration survey. Kulki visitor site (previously Cape Tribulation) was surveyed and the results included in a Daintree-Cape Tribulation conglomerate. In their survey, Manadis Roberts (1994) estimated that the site received more than 148,000 visitors annually. Other findings of note were that visitors mostly travelled as a couple or with family or friends; averaged 0.7 hours at the site; and travelled by private four-wheel drive (4WD) motor vehicle containing an average of 2.9 people per vehicle. The majority of visitors were on their first visit to the site; went for a short walk and observed the scenery. The most recent estimate of visitation to the site indicates that the site receives over 220,000 visitors annually (Bentrupperbäumer et al. 2004). 1.3 Traffic Counter Data Traffic data was collected at the site in 2009 by QPWS rangers. Table 1 outlines this data on a monthly basis and indicates that the peak period for visitation occurs between April and October, with the peak month being July (8,466 vehicles recorded). Table 1: Counts of vehicular traffic recorded at Kulki during Data courtesy of Queensland Parks and Wildlife Service, DERM. Month Vehicles per month Average vehicles per day January 1, February 1, March 3, April 5, May 5, June 5, July 8, August 6, September 6, October 5, November 2, December 3,
13 Report on Visitor Activity at Kulki: 2009/2010 As can be clearly seen in Figure 1, visitation to Kulki decreased significantly during January, February and November Figure 1: Counts of vehicular traffic recorded at Kulki during Data courtesy of Queensland Parks and Wildlife Service, DERM. 3
14 Carmody and Prideaux 2. Methodology The aims of this report are to: Investigate visitor activities undertaken at Kulki; and Identify visitors views about aspects of the site including its management. Specific objectives of the research were to: Provide a snapshot profile of visitors to Kulki; Understand visitors perceptions of the management of the site; Understand visitors perceptions of the natural environment at the site; Gain an understanding of visitors travel patterns within the Wet Tropics region; and Assess the suitability of the interpretative information provided at the site. A convenience sampling technique was used and data was analysed with the SPSS v17 statistical package. This research complements earlier research (Carmody and Prideaux, 2008) that investigated how local residents used the Wet Tropics and their views on its management. 2.1 Survey Instrument To collect data on a range of issues related to visitor expectations and experiences, a survey (Appendix 1) was developed in conjunction with officers from the WTMA. The survey instrument was based on a previous survey used in 2001/2002 which enabled some general comparisons to be made with earlier research. The self-completed survey contained 29 closed and open-ended questions and provided space for respondents to write additional comments. Open-ended questions were used because they can test specificity of knowledge more effectively (as shown by Whitmarsh, 2009), provide richer responses (Altinay and Paraskevas, 2008) and can minimise social desirability bias (Budeanu, 2007). Survey questions were grouped into eight sections commencing with demographic data. Table 2 outlines the components of the survey. Survey staff recorded site details including location, date, time of collection and weather conditions on the front cover of the survey instrument. Table 2: Components of the Kulki visitor survey. Section A Background information Place of residence, occupation, education, age, gender Section B Travel and transport Organised tour or free and independent traveller, travel party, mode of transport, pre- and post-visit of site, experience of protected natural areas Section C Reasons for visiting Motivations, activities, time spent at site, willingness to pay Section D Natural environment Perceptions of the natural environment Section E Section F Section G Additional comments Site facilities Information Visitor experience Use of site facilities, expectations of facilities, perceptions of facilities, ranger presence Prior information search, perceptions of on-site information, additional information required Aspects of visit that enhanced and detracted from experience, perceptions of crowding Open-ended to allow for any comments and feedback 4
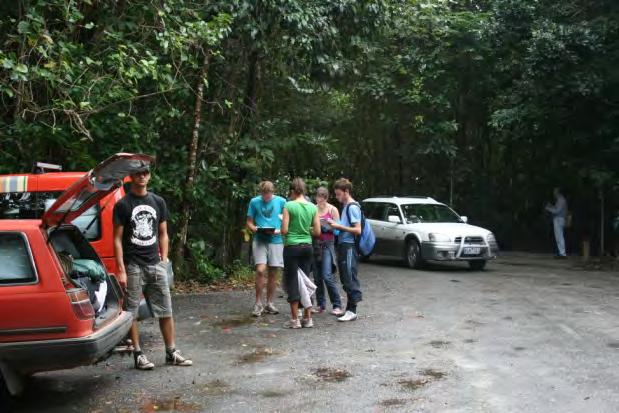
15 Report on Visitor Activity at Kulki: 2009/ Survey Collection Surveys were carried out at the Kulki visitor site by two experienced research assistants who were stationed in the carpark. Using a convenience sampling technique, visitors returning from the walk were approached on their return from either the beach or the boardwalk and asked to complete the survey. Researchers explained the purpose of the survey and the approximate time for completion. A postcard or WTMA cassowary sticker was offered as a token of appreciation to those returning the survey. Table 3 outlines the schedule and collection of surveys for the Kulki site. Table 3: Kulki visitor survey collection times and details (N = 204). Date Day Weather Visitor Frequency Percent of Total 1 August 2009 Saturday Overcast October 2009 Sunday Sunny October 2009 Wednesday Sunny October 2009 Thursday Sunny Total Surveys were collected between 9.00 am and 6.00 pm on the survey days (Figure 2). The majority of surveys were collected on the 25 October 2009 between am and 5.00 pm. Figure 2: Surveys collected at Kulki by date and time (N = 204). 5
16 Carmody and Prideaux 2.3 Non-response and Observations Refusals to complete the survey were recorded on-site and are presented in Table 4. Over the four day survey period, 252 people were approached to complete the survey. The nonresponse rate was 19.1% (n = 48) and lack of time (8.3%) and lack of interest (4.4%) were the main reasons given for not participating in the survey. Table 4: Reasons given for not participating in the Kulki visitor survey (n = 48). Reason for not participating in survey Frequency (n) Percentage of total number of people approached (n = 252) No time Not interested Language barrier On holiday No I m working No I m hungry Non-Response Limitations There were some limitations associated with the research that should be considered prior to generalising the results: First, the surveys were collected randomly during a six-month period and may not be representative of all visitors to the Kulki site; Second, the sample size was limited by time and budget constraints, therefore a target of 200 surveys was set; Third, the survey was only available in English, resulting in a possible under-reporting of some nationalities visiting the site; Fourth, there was potential for social desirability bias occurring where respondents offered answers that are seen to be desirable or acceptable but may not reflect their true opinions. In most cases it is difficult to determine the level of social desirability for any given question; Finally, although Kulki is a popular site for commercial tour operators, it was difficult to secure completed surveys from visitors who were travelling with a tour operator. The need to remain on schedule was the main reason given by tour operators for visitors not being able to complete their surveys. On a number of occasions, tour guides asked the interviewers to refrain from surveying their clients. 6

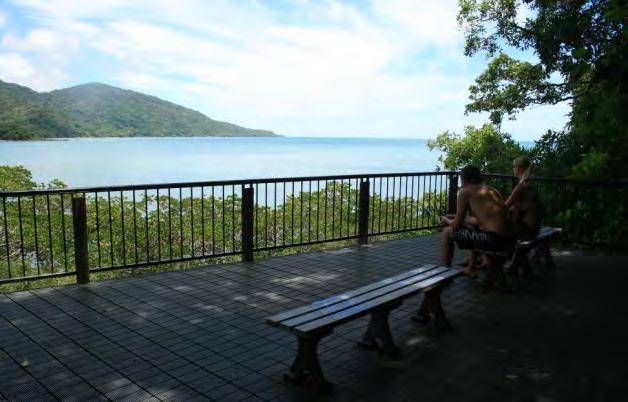
17 Report on Visitor Activity at Kulki: 2009/2010 Understanding the Results Both closed questions with specific response options and open-ended questions were used in the visitor survey. The advantage of closed questions is that it allows the researcher to investigate specific issues of interest while open-ended questions provide a good indication of top-of-mind responses and concerns of interviewees. Closed response questions generally asked respondents to use a six-point Likert scale. In the following discussion, the results of closed questions are reported as means and as the percentage breakdown by the six items on the Likert scale. Means are useful for ranking in order of importance while percentage breakdown gives a clearer indication of the strength of agreement or disagreement with a particular given statement. The following discussion should be read with these considerations in mind. It should also be noted that not every question was answered by all respondents, thus the n values of tables and figures may vary. The n value reports valid responses. The N value reports the entire sample. View from Kulki lookout (Photo: Julie Carmody) 7
18 Carmody and Prideaux 3. Findings The results presented in this report are from the Wet Tropics Visitor Site Level Survey distributed at Kulki in Respondent Profile The survey was completed by both females (52.5%) and males (47.5%) (N = 204). Place of Residence Respondents places of residence are provided in Table 5. Just over half (55.2%) of all respondents were international visitors with the largest groups being from Europe (28.4%) and the United Kingdom (18.9%). The largest group of domestic respondents was from New South Wales (19.4%) followed by Victoria (11.4%) and Queensland (10%). Table 5: Origin of Kulki survey respondents (n = 201). Frequency (n) Percent (%) DOMESTIC New South Wales Victoria Other Queensland Far North Queensland South Australia Western Australia Northern Territory Tasmania Domestic Total INTERNATIONAL Europe England/ UK North America New Zealand Asia-Pacific International Total Total Domestic and International
, those whoe are self-employed (10.8%), retirees/semi-retirees (9.4%) and managers (9.4%). Further analysis (p<.005) indicates a significant proportion of international students (14.")
19 Report on Visitor Activity at Kulki: 2009/2010 Occupation The occupation of the respondents is provided in Figure 3. The largest occupational group was professionals (32.0%) followed by students (16.7%), those whoe are self-employed (10.8%), retirees/semi-retirees (9.4%) and managers (9.4%). Further analysis (p<.005) indicates a significant proportion of international students (14.8%) and domestic retirees/semi-retirees (7.9%). Figure 3: Occupations of Kulki survey respondents (n = 203). Kulki (Photo: Julie Carmody) 9
20 Carmody and Prideaux Age Figure 4 highlights the age ranges of respondents by whether they were domestic or international visitors. International visitors aged years (32.0%) were the largest group of respondents followed by those aged years (11.3%). The mean age of respondents at Kulki was 36.5 years, with a range of 16 to 65 years old. The standard deviation was 14 years. Domestic visitors were represented across all age groups, with those aged years (10.8%) being the largest group surveyed. Overall, the largest group of respondents was aged years (41.4%). Figure 4: Age groups of Kulki survey respondents (n = 203). 10
21 Report on Visitor Activity at Kulki: 2009/2010 Education Figure 5 highlights survey respondents education levels, where Tertiary A is defined as technical or further education, and Tertiary B is defined as a university qualification. For the whole sample, 63.3% of respondents reported having a Tertiary B qualification, 20.3% reported having a Tertiary A qualification and 16.3% reported having a secondary qualification. More international (37.7%) than domestic respondents (25.7%) held Tertiary B qualifications. Figure 5: Levels of education attained by Kulki survey respondents (n = 202). A cross-tabulation analysis of respondents age and education is provided in Table 6. The largest group of respondents had a Tertiary B education (63.4%) and was aged years (30.2%). Table 6: Respondents age and education (n = 202). Age Group Primary (%) Secondary (%) Tertiary A (%) Tertiary B (%) < 20 years years years years years years > 70 years Total Respondents (n = 202) % (n = 33) 20.3% (n = 41) 63.4% (n = 128) Domestic - 8.9% (n = 18) 11.4% (n = 23) 25.7% (n = 52) International - 7.4% (n = 15) 8.9% (n = 18) 37.6% (n = 76) 11
22 Carmody and Prideaux Travel Party and Mode of Transport More than seventy percent of respondents reported travelling to Kulki by hired vehicle (76.3%) while 23.8% travelled by private vehicle. Figure 6 indicates domestic visitors were significantly (p<.001) more likely to use private vehicles (18.0%) whilst international respondents were more likely to be travelling in a hire vehicle (47.5%). Figure 6: Modes of transport used by survey respondents to travel to Kulki (n = 139). Table 7 reports on travel party composition. Most respondents indicated they were travelling as a party of two adults with no children (n = 69) or as groups of four adults with no children (n = 29). The average number of adults per vehicle was Table 7: Composition of visitor travel parties to Kulki. 1 adult 2 adults 3 adults 4 adults 5 adults 6 adults 0 children child children children Adults per vehicle 2.82 ± SD 1.22 (range 1-5) Children per vehicle 0.24 ± SD 0.66 (range 0-3) 12
23 Report on Visitor Activity at Kulki: 2009/2010 Organised Tour Visitors Table 8 shows that the majority of survey respondents were travelling with a commercial tour operator that was carrying 14 guests or less (n = 23). As previously noted, the time constraints imposed by commercial tour operator itineraries limited the number of surveys completed by tour group members. Table 8: Kulki survey respondents travelling with an organised tour operator (n = 31). Number of guests on the tour Tour Operator 6 or less 7-14 guests guests 30+ guests Total Tony s Tropical Tours Jungle Tours Foaming Fury Tropics Explorer Daintree Wonder Cape Tribulation Connections Adventure Tours Daintree Safaris Tribal Travel Cape Tribulation Tours Can t recall / Don t know Total
24 Carmody and Prideaux Travel Flow Respondents were asked about their travel patterns on the day of the survey, including where they had been and where they intended to go after leaving the site. Results are outlined in Tables 9 and 10. Respondents reported travelling from Port Douglas (18.2%), Cairns (11.0%), Daintree (7.7%) and Cape Tribulation (7.2%). A small number reported travelling from other visitor attractions including Mossman Gorge (6.1%) and the Daintree Discovery Centre (6.1%). Further examination of the towns and attractions visited before and after Kulki suggest the site is just one element of the Daintree-Cape Tribulation experience. Table 9: Visitors reported previous stop before arriving at Kulki (n = 181). Frequency (n) Percent (%) Towns Port Douglas Cairns Daintree Cape Tribulation Mossman Thornton Beach Trinity Beach Cooktown Cow Bay Sydney Mareeba Mission Beach Speerwah Bloomfield/ Track/ Falls Coconut Beach Hamilton Island Innisfail Kuranda Lucinda Mt Molloy Whitsunday Islands Wonga Beach Natural Attractions Mossman Gorge Mason s Waterhole Alexandra Range Lookout Daintree walk Myall Beach The beach
25 Report on Visitor Activity at Kulki: 2009/2010 Frequency (n) Percent (%) Mt Mutchinson Emmagen Creek Other Attractions Daintree Discovery Centre Motel / resort Nowhere / Kulki is first stop Information centre Mason s Shop and Visitor Information Centre PK s Jungle Village Daintree River Cruise GBR Ocean Cruises Total As outlined in Table 10, respondents reported that after leaving Kulki they would travel to Port Douglas (28.1%), Cairns (15.3%), Cape Tribulation (8.7%) and Daintree (7.1%). Analysis of the results outlined in Tables 9 and 10 indicate that the typical daily travel pattern of visitors to Kulki was to visit sites of interest on the way to Cape Tribulation and then return directly to their overnight accommodation in the afternoon. Table 10: Intention of survey respondents to visit other places within the region after Kulki (n = 196). Frequency (n) Percent (%) Towns Port Douglas Cairns Cape Tribulation Daintree Mossman Sydney Thornton Beach Darwin Brisbane Cooktown Wonga Beach Ayers Rock Bloomfield/ Track/ Falls Coconut Beach Cow Bay
26 Carmody and Prideaux Frequency (n) Percent (%) Ellis Beach Kuranda Mission Beach Natural Attractions Marrdja Boardwalk Daintree Ice-cream Company Rainforest Emmagen Creek Mason s Waterhole Mt Sorrow Noah Beach The beach Other Attractions Don t know PK s Jungle Village East coast Exotic Fruit Tour Daintree River Cruise Home Bug museum Cooper Creek Daintree Discovery Centre Motel/resort The Cape Restaurant Up north West coast Total
, a frequency that is double that of international respondents (11.5%).")
27 Report on Visitor Activity at Kulki: 2009/2010 Visits to Protected Natural Areas Respondents were asked about the frequency of their visits to protected natural areas. Figure 7 shows that domestic respondents reported visiting protected natural areas between two and five times a year (22.0%), a frequency that is double that of international respondents (11.5%). International respondents also reported a lower level of visitation in the 5+ times per year range (14.1%). These results provide an indication of visitors experience in protected natural areas. Further analysis showed there were no significant differences between frequency of visitation to natural protected areas and respondents places of origin, age, occupation or education. Figure 7: Survey respondents frequency of visitation to protected natural areas (n = 191). Beach at Kulki (Photo: Julie Carmody) 17
28 Carmody and Prideaux Reasons for Visiting Kulki Respondents were asked to respond to a series of questions about their motivations for visiting Kulki. A six-point Likert scale of 1 (being not important ) to 6 ( very important ) was used. Table 11 shows respondents were mainly interested in seeing the natural features and scenery at the site (mean = 5.41), being close to nature (5.13), and experiencing tranquilly (4.34). International visitors were more motivated to experience the natural features of the site (mean = 5.45), learn about native plants and animals (5.18), and enjoy the short walks (4.19). Domestic visitors were more interested in the opportunities for tranquillity (mean = 4.51), to visit a World Heritage Area (4.33) and for rest and relaxation (4.27). Table 11: Comparative domestic and international visitors motivations to visit Kulki. Reasons for visiting Kulki n Overall Mean Domestic visitors (mean) International visitors (mean) See natural features and scenery Be close to/ experience nature Experience tranquillity Because it is a World Heritage Area Opportunities for short walks Learn about native animals and plants Rest and relax Because it is a National Park Outdoor exercise Learn about Aboriginal culture Opportunities for long walks Socialise with family or friends
29 Report on Visitor Activity at Kulki: 2009/2010 The results outlined in Table 12 show the level of importance ascribed to each motive on a scale from not important to very important. Results show that 99% of respondents considered the opportunity to see natural features and scenery was an important motivation (moderately to very important) for visiting the site with 61.7% of the respondents indicating that this motive was very important. Socialising with friends, opportunities for long walks and to learn about Aboriginal Culture were the least important reasons for visiting the site; however even these reasons were rated as relatively important. Table 12: Survey respondents most cited reasons for visiting Kulki. Percentage of survey respondents Reasons for visiting Kulki Not important Slightly important Moderately important Important Quite important Very important See natural features and scenery Be close to/ experience nature Experience tranquillity Because it is a World Heritage Area Opportunities for short walks Learn about native animals and plants Rest and relax Because it is a National Park Outdoor exercise Learn about Aboriginal culture Opportunities for long walks Socialise with family or friends Other reasons (n = 5) given for visiting Kulki included the rainforest (three responses), the ability to gain an historical context and understanding of early explorers in northern Australia (two responses) and to visit somewhere new (two responses). 19
30 Carmody and Prideaux Activities Respondents were asked to indicate which activities they had undertaken at Kulki. Results are outlined in Figure 8. Both domestic and international visitors indicated they had observed the scenery (89.2%), taken short walks (83.3%), taken photographs (65.5%) and relaxed (59.9%). International visitors were more inclined to observe wildlife (27.2%) and participate in photography/painting/drawing (36.9%) than domestic respondents. A small number of the respondents indicated camping (7.4%) although Kulki is not an approved camping site. Figure 8: Activities undertaken at Kulki as cited by survey respondents (n = 203) in response to a multiple-response survey question. 20
31 Report on Visitor Activity at Kulki: 2009/2010 Using an open-ended survey question, respondents were asked to indicate if there were activities that they would have liked to have participated in, but could not. As shown in Table 13, fifty respondents (24.5% of the sample) indicated 54 activities they would have liked to have participated in. Thirty respondents indicated they would have liked to have gone swimming, but did not due to the risk of crocodiles or stingers, or adverse weather conditions. Other responses included seeing a cassowary (four responses) and taking a longer walk (three responses). Table 13: Activities which survey respondents would like to have undertaken at Kulki, but could not (n = 50). Activity Overall (n) Domestic (n) International (n) Swimming due to risk of crocodiles or stingers, or due to poor weather conditions See a cassowary Take a longer walk See a crocodile 2-2 Kayaking Stay longer didn t know you could stay overnight Snorkelling/ visit reef but too windy 2-2 See wildlife Coffee shop Watch sunrise but too overcast Visit the town Stay dry 1-1 Photography but raining Cape Tribulation shore 1-1 Total 54* * Note: Multiple responses were given by individual respondents. 21
32 Carmody and Prideaux Figure 9 illustrates the length of time visitors spent at Kulki. A one-hour visit was most popular (33.0%) followed by visits up to thirty minutes (21.4%) and one hour (33.0%). International respondents were more likely to stay two hours (13.9%) while both half-hour and one-hour visits were equally popular with domestic and international visitors. The majority of respondents (80.6%) stayed two hours or less at the site. Figure 9: Approximate time spent at Kulki by both domestic and international visitors (n = 201). 22
33 Report on Visitor Activity at Kulki: 2009/2010 Willingness to Pay Currently, visitors to protected natural areas in Queensland are not charged an access/entry fee. Respondents were asked to indicate how much they would be prepared to pay if an entrance fee was introduced at the Kulki visitor site. Figure 10 shows 41.2% of respondents believed that they should not have to pay a fee, while 20.1% were prepared to pay between $5 and $10 and 24.6% were prepared to pay between $2 and $4. Figure 10: Survey respondents willingness to pay an access/entrance fee to visit Kulki (n = 199). 23
34 Carmody and Prideaux 3.2 Perceptions of the Natural Environment A series of statements were used to gather respondents views on the natural environment at Kulki. Respondents were asked to indicate their views using a Likert scale where 1 = strongly disagree and 6 = strongly agree. Table 14 summarises respondents perceptions measured as a mean. Visitors generally considered the site to be interesting (mean = 5.35), in good condition (5.29), appealing (5.27) and well managed (5.15). While there was not a strong sense that the site had been seriously disturbed (mean = 2.70) both domestic (4.13) and international (4.22) respondents expressed relatively strong concern about the impacts of human activity. Both international and domestic respondents expressed a strong desire to spend more time at the site. Table 14: Domestic and international visitors perceptions of the natural environment at Kulki. Perceptions of the natural environment at Kulki n Overall Mean Domestic visitors (mean) International visitors (mean) The natural environment at this site is interesting. The condition of the natural environment at this site appears to be good. In terms of natural attractions and scenic beauty this site is appealing. The natural environment at this site is well managed. I would like to spend more time exploring this natural environment. I am concerned about the impacts of human activity on the natural environment at this site. This site appears to be disturbed and impacted
35 Report on Visitor Activity at Kulki: 2009/2010 Levels of agreement/disagreement with statements about the natural features of the site measured as a percentage are summarised in Table 15. Almost all respondents (97.5%) indicated that the natural environment was interesting while 97.0% thought the natural environment appeared to be in good condition and was well managed 96.5%. Just over twothirds of respondents (70.6%) expressed some level of concern over the impacts of human activity, however only 28.1% thought the site appeared to be disturbed and impacted. Table 15: Survey respondents perceptions of the natural features at Kulki. Perceptions of the natural environment at Kulki Strongly disagree Somewhat disagree Percentage of survey respondents Mildly disagree Mildly agree Somewhat agree Strongly agree The natural environment at this site is interesting. The condition of the natural environment at this site appears to be good. In terms of natural attractions and scenic beauty this site is appealing. The natural environment at this site is well managed. I would like to spend more time exploring this natural environment. I am concerned about the impacts of human activity on the natural environment at this site. This site appears to be disturbed and impacted
36 Carmody and Prideaux 3.3 Perceptions and Use of the Site Facilities As with all Wet Tropics visitor sites sampled, the survey asked respondents to comment on given statements about site facilities using a Likert scale of 1 = strongly disagree to 6 = strongly agree. As illustrated in Table 16 respondents thought the overall condition of the site s facilities appeared to be good (mean = 4.84) and well managed (4.76), were adequate (4.66) and presented in a manner that made the site look appealing (4.56). A positive response was recorded to the statement regarding the importance of a ranger at the site (mean = 4.10). Domestic respondents indicated a greater level of support for a ranger at the site (mean = 4.30) than international respondents (3.92). Table 16: Domestic and international visitors perceptions of the site facilities at Kulki. Perceptions of the site facilities at Kulki n Overall Mean Domestic visitors (mean) International visitors (mean) The overall condition of the facilities at this site appears to be good. The facilities and infrastructure at this site are well managed The facilities at this site are adequate This site is appealing in terms of the character and attractiveness of the facilities. The presence of a ranger at sites like this is important to me
37 Report on Visitor Activity at Kulki: 2009/2010 The percentages for agreement/disagreement with each statement are shown in Table 17. The majority of respondents (91.4%) agreed that the facilities were in good condition while 90.1% thought that the facilities were well managed. More than two-thirds (68.0%) supported the presence of a ranger at the site. Table 17: Survey respondents perceptions of the site facilities at Kulki. Perceptions of the site facilities at Kulki Strongly disagree Somewhat disagree Percentage of survey respondents Mildly disagree Mildly agree Somewhat agree Strongly agree The overall condition of the facilities at this site appears to be good. The facilities and infrastructure at this site are well managed. The facilities at this site are adequate. This site is appealing in terms of the character and attractiveness of the facilities. The presence of a ranger at sites like this is important to me
38 Carmody and Prideaux Presence of a Ranger On-site As shown in Figure 11, almost half of all respondents felt an on-site ranger would be able to provide information and education (56.0%), would enhance safety and security (43.5%) and could answer questions (42.0%). Only 6.5% thought a ranger would be helpful for lodging complaints about the behaviour of other visitors. The level of agreement for the presence of a ranger was relatively even by both domestic (33.0%) and international visitors (35.0%). Other reasons given (n = 6) for having a ranger on-site at Kulki included to stop people abusing the site and facilities and to rehabilitate, monitor and maintain the natural environment. Four respondents did not offer an explanation for their reasons. Figure 11: Survey respondents suggested uses of an on-site Park Ranger at Kulki in response to a multiple-response survey question (n = 200). 28
39 Report on Visitor Activity at Kulki: 2009/2010 Use of Site Facilities A multiple-response format was used to ensure respondents had the opportunity to indicate the facilities they had used at the Kulki site. Results outlined in Figure 12 show that the walking track (76.1%), viewing platform/lookout (65.7%), boardwalk (64.2%) and toilet (52.3%) were mostly used. International visitors were more inclined to use these facilities than domestic visitors. Domestic respondents (11.9%) were more likely to use a picnic table than international respondents (8.0%). Figure 12: Most popular Kulki site facilities used by survey respondents, cited in response to a multiple-response survey question (n = 204). 29
 (Table 18).")
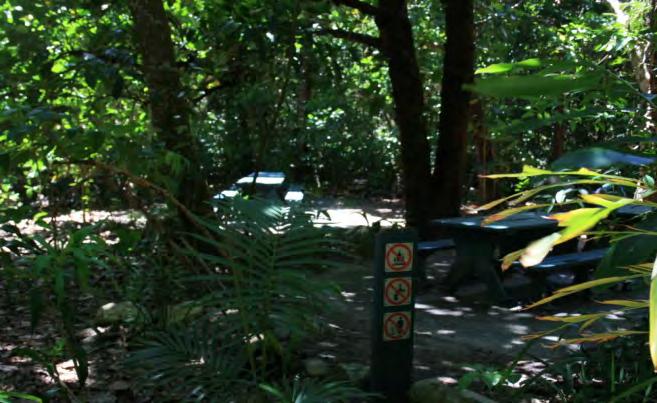
40 Carmody and Prideaux Expected Site Facilities Respondents were asked to indicate if there were facilities that they would have liked to have seen at the Kulki site. Responses were received from thirteen survey participants (6.4% of the sample) (Table 18). The most common expected facility was a shop or canteen both of which are available at the Cape Tribulation village approximately five kilometres from Kulki. Table 18: Facilities expected to be available at Kulki by survey respondents (n = 13). Expectation Total Shop/ canteen 2 Crocodiles 1 Free camping zone 1 More bins they are all full 1 More specific information - local area/directions/maps 1 Not so touristy 1 Rubbish bin 1 Service station air for tyres 1 Signage of walks and lengths 1 Signs of what to do in an emergency, as no phone available 1 Swim 1 Viewing platform/ lookout 1 Total Responses 13 Pebbler Sand Crab balls, Kulki beach (Photo: Julie Carmody) 30
41 Report on Visitor Activity at Kulki: 2009/2010 Information about Kulki Survey respondents were asked to indicate the sources they had used to gain information about the Kulki site prior to their visit. Figure 13 illustrates the main sources of information used by both domestic and international respondents. The most significant was word-ofmouth (37.5%) followed by a travel guide or book (36.5%) and a map which indicated Kulki as a tourist site (33.0%). International respondents used each of these sources at a rate that was higher than that of domestic respondents. Only 10.5% of domestic visitors had previously visited the site. Other sources (n = 7) of prior information mentioned included an interest in the area and always wanted to come here, a part of profession as cartographer, school, Sunday Mail [newspaper] travel section and came across it on a walk. The majority of respondents (88.0%) indicated that the information they had referred to was accurate. Those who suggested the information was not accurate (n = 9) felt they were not well informed about the dangers of swimming because crocodiles and stingers may be encountered information was not detailed enough and/or out of date and the location of the nearest service station needed to be made clearer. Figure 13: Sources of information consulted by survey respondents prior to visiting Kulki (n = 204). 31
42 Carmody and Prideaux On-site Signage Interpretative and directional signs are important features of the infrastructure at any visitor site. Nearly two thirds of respondents (62.5%) reported using the interpretative information available at the site. Cross-tabulation analysis of results did not reveal a specific group who were more or less likely to use on-site information. Tables 19 and 20 report on respondents agreement/disagreement with statements pertaining to the quality of information available at the site. A Likert scale of 1 = strongly disagree to 6 = strongly agree was used for ranking responses. Table 19 reports on means. Respondents generally felt the rules and safety information was easy to understand (mean = 5.04) and addressed any interests and concerns (4.83). International visitors (mean = 5.12) reported no difficulties in understanding safety information. Respondents did not give a high rating to the statement that Aboriginal cultural information was interesting and informative (mean = 3.68) nor that this information helped them to understand the significance of the area to rainforest Aboriginal people (mean = 3.61). Table 19: Domestic and international survey respondents perceptions of on-site signage at Kulki. Perceptions of on-site information at Kulki n Overall Mean Domestic visitors (mean) International visitors (mean) Signs, maps and directions Were easy to find Helped me to find my way around The rules and safety information Were easy to understand Addressed my interests and concerns The information about natural features and values Was interesting and informative Helped me to better appreciate the special natural features of the area The Aboriginal cultural information Was interesting and informative Helped me to understand the significance of this area for rainforest Aboriginal people
43 Report on Visitor Activity at Kulki: 2009/2010 Table 20 outlines the percentage of responses for each level of agreement/disagreement to statements about on-site information at Kulki. The majority (83.4%) of respondents thought that signs and maps were easy to find while 93.2% of respondents thought the rules and safety information was easy to understand, and 91.1% said it addressed their safety concerns. Most respondents also thought information about the natural environment was interesting and informative (85.7%) and helped them to understand the special features of the site (82.2%). Respondents were less positive about Aboriginal cultural information with 40.7% disagreeing that it was interesting and informative. Similarly, 44.4% disagreed with the given statement that information helped them to understand the significance of the area to rainforest Aboriginal people. Table 20: Survey respondents perceptions of on-site tourism information provided at Kulki. Perceptions of on-site information at Kulki Strongly disagree Somewhat disagree Percentage of survey respondents Mildly disagree Mildly agree Somewhat agree Strongly agree Signs, maps and directions Were easy to find Helped me to find my way around The rules and safety information Were easy to understand Addressed my interests and concerns The information about natural features and values Was interesting and informative Helped me to better appreciate the special natural features of the area The Aboriginal cultural information Was interesting and informative Helped me to understand the significance of this area for rainforest Aboriginal people
44 Carmody and Prideaux Using an open-ended question, survey respondents were asked for suggestions on additional interpretative information they would like to see at the site. Forty respondents (19.6% of the sample) provided 44 suggestions. Results outlined in Table 21 indicate a desire for more information about Aboriginal people and their culture (18 responses); more information about the natural features, wildlife, plants and forestry (nine responses); and additional information about the historical significance of the site (three responses). Table 21: Survey respondents suggested additional visitor information that could be made available at the Kulki site (n = 40). Suggested additional information Overall (n) Domestic (n) International (n) Aboriginal information, practices and unique features More information about natural features/wildlife/forestry Discovery dates and by whom/ simple heritage information/ age of environment 3-3 Anything Alternative safe swimming destination (e.g. cannot swim here but go to for safe swimming) Crocodile information 1-1 Graded road 1-1 Kilometres between sites on signage 1-1 Full list of services/ population More informative travel guides, not easy to understand what to expect 1-1 Site specific information Track description/ signage and flora signage 1-1 Jellyfish information 1-1 When gravel road starts 1-1 Wildlife identification charts/ Aboriginal culture 1-1 More distance signs to attractions/viewpoints 1-1 Total responses 44* * Note: Multiple responses were given by individual respondents. 34
45 Report on Visitor Activity at Kulki: 2009/ Visitor Experience Visitors were asked to comment on aspects of their visit that enhanced or increased their enjoyment of the site using an open-ended survey question. Over a quarter (28.9%) of respondents (n = 59) indicated there were aspects of their visit to Kulki which enhanced or increased their enjoyment at the site and results are outlined in Table 22. The major factors were peace and tranquillity (11.9%), the fact that Kulki is a beautiful place (10.2%), the rainforest (6.8%), information about the site (6.8%) and the few other tourists (6.8%). These are interesting results considering the high levels of visitation experienced at Kulki. Table 22: Aspects that visitors considered enhanced or increased their enjoyment of Kulki (n = 59). Frequency (n) Percentage (%) Natural Beautiful place Rainforest Water lookouts Nature plants & wildlife Great weather Unspoilt nature of the site Seeing the fish Seeing a crocodile Seeing a cassowary Diversity of beach/ rainforest Facilities Wonderful information about the site Boardwalk Maintained walkways Well maintained facilities Area is clean and looking like minimal impact Track signage Psycho-social Peace and tranquillity Few other tourists Very relaxed Socialising with friends/family Meeting Aboriginal community members in the area Freedom to walk at pleasing pace Guide providing information Interaction with nature
46 Carmody and Prideaux Frequency (n) Percentage (%) Other Not a commercial area yet? Driving, scenery, atmosphere Radio reception Total Responses A small number of respondents (18.6% of the sample) indicated there were aspects of their visit that took away from or detracted from their enjoyment of the site. Responses are outlined in Table 23. The weather (ten responses), crowding (five responses) and toilets (three responses) were the main aspects mentioned. Table 23: Aspects visitors considered took away or detracted from their enjoyment of Kulki (n = 34). Frequency (n) Percentage (%) Natural The weather March flies and mosquitoes Facilities Atrocious state of the toilets Facilities unsatisfactory, carpark too small, no shop for food Toilet paper and some litter Rules / Regulations / Safety Not being able to swim safely Worrying about crocodiles and jellyfish Psycho-social Too many people Only other people Mass tourism in Daintree Other Litter on track Tourists littering and breaking trees Cars No motor cross available I have to leave and go back to work Arrogance from tour operators they should be more considerate of the general public This unnecessarily long survey Total Responses
47 Report on Visitor Activity at Kulki: 2009/2010 Other Visitors The behaviour of other visitors at a site can affect the level of enjoyment an individual derives from visiting that site. In circumstances where overcrowding occurs the overall level of enjoyment could be expected to fall. However, the link between perceived crowding and satisfaction is weak and is dependent on personal norms, situational variables and site infrastructure (West, 1981; Stankey and McCool, 1984; Kalisch and Klaphake, 2007). A series of statements were presented in the survey and respondents were asked to comment using a Likert scale of 1 = strongly disagree to 6 = strongly agree. Table 24 outlines responses as a mean. The highest ranking was recorded in response to the statement that the behaviour of others at the site was environmentally responsible (mean = 4.09). The remaining statements received a much lower mean, indicating a high level of disagreement with statements that were negative in orientation. For example the mean for the statement there were too many people at the site was low at Table 24: Domestic and international visitors perceptions of other site visitors. Perceptions of other site visitors at Kulki n Overall Mean Domestic visitors (mean) International visitors (mean) The behaviour of other visitors at this site has been on the whole environmentally responsible There were too many people at this site today The presence of other people at this site prevented me from doing what I wanted to. The behaviour of some visitors at this site detracted from my enjoyment of this site
. Three quarters (74.")
48 Carmody and Prideaux Table 25 provides respondents levels of agreement/disagreement with statements relating to perceptions of other visitors at the site. Respondents did not feel the presence of other visitors detracted from their level of enjoyment of the site (90.8%). Three quarters (74.6%) of respondents did not believe there were too many people at the site. Table 25: Perceptions of other visitors at Kulki. Perceptions of other site visitors at Kulki Strongly disagree Somewhat disagree Percentage of survey respondents Mildly disagree Mildly agree Somewhat agree Strongly agree The behaviour of other visitors at this site has been on the whole environmentally responsible. There were too many people at this site today. The presence of other people at this site prevented me from doing what I wanted to. The behaviour of some visitors at this site detracted from my enjoyment of this site Walkway alongside the Kulki carpark (Photo: Julie Carmody) 38
49 Report on Visitor Activity at Kulki: 2009/ Additional Comments The survey instrument provided respondents with the opportunity to record comments on any aspect of their visit. Twenty responses were received with most describing the Kulki visitor site and beach as beautiful. Date 1 August August August August August August August August August August August October October 2009 Comment Maybe this site is just too touristy. We re looking for a more natural site and the ferry crossing is very expensive. But I enjoyed my travel in Australia. French visitor, female, 21 years Beautiful and very well managed. UK visitor, male, 28 years Too many questions! Switzerland visitor, male, 52 years Get some free camping places around here, thanks. Netherlands visitor, female, 23 years Visitor behaviour good, except for rubbish in the toilets. UK visitor, male, 47 years Well managed at the time we visited. South Australian visitor, female, 40 years Very beautiful here. Austrian visitor, female, 35 years A lot of tourist brochures are a load of b*llshit describing facilities and beauty. New South Wales visitor, female, 56 years Please keep this area as unspoilt and natural as possible. NO mod-cons and shops are needed. Thank you. Victorian visitor, female, 65 years Great infrastructure, well managed, good balance. Greek visitor, female, 39 years A great place to be, maybe add a bench or two by the beach to relax on. USA visitor, female, 16 years This is a lovely spot, well sign posted and good road. Walks and scenery were interesting and the beach just perfect. Take me home James! Victorian visitor, female, 52 years There were cigarette butts left on the beach. Victorian visitor, female, 25 years 39
50 Carmody and Prideaux Date 28 October October October October October October October 2009 Comment Believe all public beaches and National Parks should be free and accessible to all. Our taxes pay for upkeep of these facilities. Victorian visitor, female, 54 years A fabulous place hope it stays this way! UK visitor, female, 44 years I didn t answer Question No. 25 because I did not look at information at this site. Canadian visitor, female, 23 years Just a beautiful area really glad I came here from Trinity Beach. Would love to come back for longer. The boardwalk was very interesting. Victorian visitor, female, 52 years Amazing part of Australia!!! Don t change it, manage it. Other Queensland visitor, male, 38 years A beautiful site that we will recommend to others back home. Victorian visitor, female, 25 years Although I was enjoying my time and ready to move on I was happy to fill in this questionnaire although I felt it was too long. It may be worth bearing in mind a bit. UK visitor, male, 38 years 40
51 Report on Visitor Activity at Kulki: 2009/ Management Considerations Kulki is a popular visitor site in the Cape Tribulation area, attracting a large number of visitors. The findings of this survey suggest management consideration is given to the following matters: Visitors expressed high levels of satisfaction with the site facilities and the natural environment. Although Kulki is a high visitation site, there were few concerns about overcrowding. There is support for upgrading on-site signage to make it more interesting and informative. Specific suggestions include additional Aboriginal cultural information and information about the site s natural features, wildlife and plants. Signage recommending alternative swimming areas during periods when the beach is closed should be considered. Some consideration could be given to enhancing the visibility of road signage. There was strong support for stationing a ranger on site specifically to provide information and undertake education programs. In part the provision of information could be achieved through enhanced interpretative signage. A second option may be to make a ranger available at set times each day to provide interpretative tours and answer questions. The use of on-site picnic tables is low. One reason could be the lack of shade or weather protection over the tables, which could be discouraging people from using them. There are moderate levels of satisfaction with the condition of the site s facilities. Refreshment of the current facilities may be required. Additional signage promoting the site s World Heritage status should be considered. There were some minor concerns for the state of the toilets and litter. Photography is a popular activity at this site. Consideration could be given to installing a map that identifies the best places and subject matter for taking photos. Informative guides to taking great photos could also be installed. The site s World Heritage status was not a major pull factor for visiting the site. This finding highlights the need for a more vigorous and coordinated strategy to promote the Wet Tropics World Heritage status. One element of this strategy may be to encourage destination marketing collateral to include the World Heritage logo. Install a visitor counter (similar to toilet counter) at the entrance to the boardwalk to develop a more detailed picture of visitor numbers and daily visitor patterns. Data of this nature, combined with the results of this survey will give managers a better understanding of how the site is used on a daily, weekly and monthly basis. 41
52 Carmody and Prideaux 5. References Altinay, L. and Paraskevas, A. (2008) Planning Research in Hospitality and Tourism. Oxford: Butterworth-Heinemann. Bentrupperbäumer, J. O Farrell, S.-E. and Reser, J.P. (2004) Visitor monitoring system for the Wet Tropics World Heritage Area: Volume 2 Visitor monitoring process From pre-destination to post-destination. Cooperative Research Centre for Tropical Rainforest Ecology and Management. Cairns: Rainforest CRC. Budeanu, A. (2007) Sustainable Tourism Behaviour a Discussion of Opportunities for Change. International Journal of Consumer Studies 31: Carmody, J. and Prideaux, B. (2008) Community attitudes, knowledge, perceptions and use of the Wet Tropics of Queensland World Heritage Area in Report to the Marine and Tropical Sciences Research Facility. Cairns: Reef and Rainforest Research Centre. Kalisch, D. and Klaphake, A. (2007) Visitors satisfaction and perception of crowding in a German National Park: A case study on the island of Hallig Hooge. Forest Snow and Landscape Research 81(1-2): Manidis Roberts Consultants (1994) Data summary: 1993 Visitor use survey Wet Tropics World Heritage Area. Report to the Wet Tropics Management Authority. Stankey, G.H. and McCool, S.F. (1984) Carrying capacity in recreational settings: Evaluation, appraisal and application. Leisure Sciences 6(4): West, A. (1981) Recreational carrying capacity. In: J. Pigram (1983) Outdoor recreation and resource management. London: Croom Helm Ltd. Whitmarsh, L. (2009) What's in a name? Commonalities and differences in public understanding of "climate change" and "global warming". Public Understanding of Science 18:
... Dear Visitor,.")


53 APPENDIX 1 SITE SURVEY INSTRUMENT Appendix 1: Site Survey Instrument Visitor Site Survey in the Wet Tropics World Heritage Area Interviewer:... Survey Location:... Survey Date:... Time:... Weather: Sunny Overcast Raining Hot Warm Cool Other Comments: (e.g. windy, smoky, mist)... Dear Visitor,... We are researchers from James Cook University, School of Business Tourism, and on behalf of the Wet Tropics Management Authority we are exploring visitors expectations and experiences of this Wet Tropics site. We would be very grateful if you would participate in the study by completing this questionnaire. Your participation will help to improve visitor services and the continued management of sites by understanding visitors needs and views. The questionnaire is voluntary and all responses remain completely anonymous. The questionnaire will take approximately 15 minutes to complete. Thank you very much for your participation. If you would like any more information about this project please contact the project manager. If you would like to discuss any ethical matters regarding this project please contact the Ethics Administrator. This project has Human Ethics approval H3100 from James Cook University. PLEASE DETACH AND RETAIN THIS INFORMATION PAGE ONLY FOR YOUR FUTURE REFERENCE Project Manager: Dr Julie Carmody School of Business Tourism James Cook University Cairns, QLD 4870 T: (07) E: Julie.Carmody@jcu.edu.au Ethics Administrator: Ms Tina Langford Research Office James Cook University Townsville, QLD 4810 T: (07) E: Tina.Langford@jcu.edu.au 43
54 APPENDIX 1 SITE SURVEY INSTRUMENT HOW TO COMPLETE THIS QUESTIONNAIRE Where questions require a Yes or No answer, or multiple response, please put a tick in the checkbox beside the appropriate response. Where a scale question is provided (e.g. scale from 1 to 6) please circle the response which best applies. SECTION A: BACKGROUND INFORMATION 1. Where do you normally live? Within Australia Postcode:... Overseas Country: How long have you lived there?... Years 3. Which of these best describes your occupation? Self-employed Professional Retail Domestic duties Management Office/clerical Public service Manual/factory work Service industry Tradesperson Student Retired/semi-retired Other What is the highest level of formal education you have completed so far? Primary Secondary Tertiary A Tertiary B (1-7 years of education) (8-12 years of education) (Technical or further education institution) (University) 5. What is your age?... years 6. Gender: Male Female SECTION B: TRANSPORT AND TRAVEL 7. Are you with an organised tour? Yes No (Go to Question 8) If you answered Yes, what is the name of the tour company?... Approx. number of people on your tour: If you travelled in a private or hired vehicle, how many people including yourself are in your vehicle?... Adults... Children Private vehicle Hired vehicle 44
55 APPENDIX 1 SITE SURVEY INSTRUMENT 9. In your travels today, where did you previously visit before coming to this site? (e.g. township, visitor site) In your travels today, where do you plan to go after leaving this site? How often do you visit natural areas like this (e.g. National Parks)? This is my first time Less than once a year Once a year Between 2 and 5 times a year More than 5 times a year SECTION C: REASONS FOR VISITING 12. Please indicate how important the following reasons were for you visiting this site today. Not important Slightly important Moderately important Important Quite important Very important See natural features and scenery Be close to / experience nature Social with family or friends Rest and relax Experience tranquility Outdoor exercise Opportunities for short walks Opportunities for long walks Because it is a World Heritage Area Because it is a National Park Learn about native animals and plants Learn about Aboriginal culture Other (please specify)
56 APPENDIX 1 SITE SURVEY INSTRUMENT 13. What activities did you engage in at this site today? Observing scenery Bird watching Observe wildlife Photography / painting / drawing Picnic / barbeque (BBQ) Using café / restaurant Camping Walking short (1 hour or less) Walking long (1-6 hours) Swimming Guided tour Looking at interpretation material Relaxing Other (please specify): Were there particular things you wanted to do today at this site which you were unable to do? Yes No If you answered Yes, please specify: How long have you spent at this site today? Less than half an hour About half an hour About 1 hour About 2 hours About 3 hours About 4 hours More than 4 hours Overnight Days (please specify) If an entrance fee were introduced to access this site today, how much would you be willing to pay? $1 less than $2 (AUD) $2 less than $5 (AUD) $5 less than $10 (AUD) $10 less than $20 (AUD) I do not think I should pay anything to access this site as a day visitor. 46
57 APPENDIX 1 SITE SURVEY INSTRUMENT SECTION D: NATURAL ENVIRONMENT 17. The following statements are about the natural features of this site. Please rate the extent to which you agree or disagree with each statement. Strongly disagree Somewhat disagree Mildly disagree Mildly agree Somewhat agree Strongly agree The natural environment at this site is interesting. I would like to spend more time exploring this natural environment. In terms of natural attractions and scenic beauty this site is appealing. The condition of the natural environment at this site appears to be good. The natural environment at this site is well managed. I am concerned about the impacts of human activity on the natural environment at this site. This site appears to be disturbed and impacted SECTION E: SITE FACILITIES 18. What facilities have you used at this site today? (Tick as many as applicable) Picnic table Shelter shed Restaurant / café Rubbish bin Toilet / showers Walking track Boardwalk Viewing platform / lookout Fire place Barbeque Tap Other (please specify)
58 APPENDIX 1 SITE SURVEY INSTRUMENT 19. Were there particular facilities at this site you were expecting to find which were not available? Yes No If you answered Yes, please specify: Please rate the extent to which you agree or disagree with each of the following statements about the facilities and management at this site. Strongly disagree Somewhat disagree Mildly disagree Mildly agree Somewhat agree Strongly agree The site is appealing in terms of the character and attractiveness of the facilities The facilities at this site are adequate The overall condition of the facilities at this site appears to be good. The facilities and infrastructure at this site are well managed. The presence of a ranger at sites like this is important to me If you agreed the presence of a ranger was important, what are the reasons for this? To provide information / education To answer questions To take us on guided walks To give directions For lodging complaints about others behavior For site maintenance For safety / security Other (please specify)
59 APPENDIX 1 SITE SURVEY INSTRUMENT SECTION F: INFORMATION 22. How did you find out about this site? Have been here before Travel guide or book Road sign From the web Word of mouth The trip here was included in a package tour Map which said it was a tourist site Tourist brochure (which one?)... Tourist information centre in North Queensland Tourist information centre (other)... Other (please specify): If you obtained prior information about this site, was the information accurate? Yes No If you answered No, please specify: Did you refer to any of the information available at this site today? Yes No 25. Please rate the extent to which you agree or disagree with the following statements about information available at this site. Strongly disagree Somewhat disagree Mildly disagree Mildly agree Somewhat agree Strongly agree Signs, maps and directions were easy to find helped me to find my way around The rules and safety information were easy to understand addressed my interests and concerns The information about natural features and values was interesting and informative helped me to better appreciate the special natural values of the area The Aboriginal cultural information was interesting and informative helped me to understand the significance of this area for Rainforest Aboriginal people
60 APPENDIX 1 SITE SURVEY INSTRUMENT 26. If you were to visit this site again, is there any additional information you would like? Yes No If you answered Yes, please specify: SECTION G: VISITOR EXPERIENCE 27. Were there any particular aspects of your visit that increased / enhanced your enjoyment of this site? Yes No If you answered Yes, please specify: Were there any particular aspects of your visit that took away / detracted from your enjoyment of this site? Yes No If you answered Yes, please specify: Please rate how strongly you agree or disagree with the following statements about other visitors at this site today. Strongly disagree Somewhat disagree Mildly disagree Mildly agree Somewhat agree Strongly agree There were too many people at this site today. The presence of other people at this site prevented me from doing what I wanted to do. The behavior of other visitors at this site has been on the whole environmentally responsible. The behavior of some visitors at this site detracted from my enjoyment of this site
61 APPENDIX 1 SITE SURVEY INSTRUMENT ADDITIONAL COMMENTS: THANK YOU VERY MUCH FOR YOUR PARTICIPATION 51


62 APPENDIX 2 SITE PHOTOGRAPHS Appendix 2: Site Photographs Kulki site facilities Photographs by Julie Carmody (JCU) 52


63 APPENDIX 2 SITE PHOTOGRAPHS Kulki site signage Photographs by Julie Carmody (JCU) 53
Sustainable Nature Based Tourism: Planning and Management
 Emmagen Creek Site Report Sustainable Nature Based Tourism: Planning and Management Report on Visitation and Use at Emmagen Creek, Far North Queensland, 2009/2010 Julie Carmody and Bruce Prideaux School
Sustainable Nature Based Tourism: Planning and Management
 Lake Tinaroo Site Report Sustainable Nature Based Tourism: Planning and Management Report on Visitation and Use at Lake Tinaroo, Far North Queensland, 2009/2010 Julie Carmody and Bruce Prideaux School
Rainforest Tourism First Annual Report: January December 2007
 Rainforest Tourism First Annual Report: January December 2007 Annual and Quarterly Patterns of Rainforest Tourism in the Wet Tropics World Heritage Area, North Queensland Karen McNamara and Bruce Prideaux
Rainforest Tourism Second Annual Report: January December 2008
 Rainforest Tourism Second Annual Report: January December 2008 Annual and Quarterly Patterns of Rainforest Tourism in the Wet Tropics World Heritage Area, North Queensland Karen McNamara and Bruce Prideaux
Lord Howe Island Visitor Survey 2017
 INTRODUCTION Lord Howe Island Visitor Survey 2017 Lord Howe Island is one of Australia s premier holiday destinations, part of a World Heritage-listed island group that is known for its outstanding natural
The Great Barrier Reef World Heritage Area: its value to residents and tourists, and the effect of world prices on it
 Final Report The Great Barrier Reef World Heritage Area: its value to residents and tourists, and the effect of world prices on it Natalie Stoeckl, Marina Farr, Diane Jarvis, Silva Larson, Michelle Esparon,
Rainforest tourism drivers, trends and management tools: Synthesis report
 MTSRF Transition Program Rainforest tourism drivers, trends and management tools: Synthesis report Bruce Prideaux and Jonathan Sibtain School of Business, James Cook University Supported by the Australian
Reef Tourism First Yearly Report: November 2006 October 2007
 Reef Tourism First Yearly Report: November 26 October 27 Quarterly Patterns of Reef Tourism on the Great Barrier Reef Northern, Central and Whitsunday Areas Alexandra Coghlan and Bruce Prideaux School
The Social and Economic Long Term Monitoring Program (SELTMP) 2014 Community Well-being in the Great Barrier Reef
 2014 Community Well-being in the Great Barrier Reef") Technical Report TROPICAL ECOSYSTEMS hub The Social and Economic Long Term Monitoring Program (SELTMP) 2014 Community Well-being in the Great Barrier Reef Lea M. Scherl, Sarah Gillet, Erin Bohensky, Matt
Technical Report TROPICAL ECOSYSTEMS hub The Social and Economic Long Term Monitoring Program (SELTMP) 2014 Community Well-being in the Great Barrier Reef Lea M. Scherl, Sarah Gillet, Erin Bohensky, Matt
ARRIVAL CHARACTERISTICS OF PASSENGERS INTENDING TO USE PUBLIC TRANSPORT
 ARRIVAL CHARACTERISTICS OF PASSENGERS INTENDING TO USE PUBLIC TRANSPORT Tiffany Lester, Darren Walton Opus International Consultants, Central Laboratories, Lower Hutt, New Zealand ABSTRACT A public transport
Benefits and costs of tourism for remote communities
 Benefits and costs of tourism for remote communities Case study for the Carpentaria Shire in north-west Queensland Chapter 2 1 THE CARPENTARIA SHIRE COMMUNITY AND TOURISM... 2 Plate 5: Matilda Highway
Recreationists on the Gifford Pinchot National Forest: A Survey of User Characteristics, Behaviors, and Attitudes
 Recreationists on the Gifford Pinchot National Forest: A Survey of User Characteristics, Behaviors, and Attitudes by Alan R. Graefe The Pennsylvania State University Robert C. Burns University of Florida
MELBOURNE S WEST TOURISM RESEARCH
 MELBOURNE S WEST TOURISM RESEARCH COLLATION OF TOURISM RESEARCH AUSTRALIA DATA MAY 2017 WESTERN MELBOURNE TOURISM Urban Enterprise Urban Planning / Land Economics / Tourism Planning / Industry Software
Byron Shire Visitor Profile and Satisfaction Report: Summary and Discussion of Results
 Byron Shire Visitor Profile and Satisfaction Report: Summary and Discussion of Results Introduction The Byron Shire Visitor Profile and Satisfaction (VPS) project was completed as part of the Destination
LORD HOWE ISLAND MARINE PARK PROFILE OF LOCAL BUSINESSES. Department of Environment Climate Change & Water. Prepared For: Prepared By:
 LORD HOWE ISLAND MARINE PARK PROFILE OF LOCAL BUSINESSES Prepared For: Department of Environment Climate Change & Water Prepared By: Arche Consulting Pty Ltd Version: June 2010 Arche Consulting T + 61
2013 Business & Legislative Session Visitor Satisfaction Survey Results
 2013 Business & Legislative Session Visitor Satisfaction Survey Results Completed by Juneau Economic Development Council in partnership with The Alaska Committee August 2013 JEDC research efforts are supported
Juneau Household Waterfront Opinion Survey
 Juneau Household Waterfront Opinion Survey Prepared for: City and Borough of Juneau Prepared by: April 13, 2004 TABLE OF CONTENTS Executive Summary...1 Introduction and Methodology...6 Survey Results...7
Estimating Tourism Expenditures for the Burlington Waterfront Path and the Island Line Trail
 A report by the University of Vermont Transportation Research Center Estimating Tourism Expenditures for the Burlington Waterfront Path and the Island Line Trail Report # 10-003 February 2010 Estimating
Brisbane. Social Indicators te.queensland.com/research
 Brisbane Social Indicators 2013 This study examines the social impacts of tourism on the local communities, as perceived by its residents. The research is intended to inform the decision making of state
NEWCASTLE VISITOR PROFILE AND SATISFACTION REPORT. Summary of results OCTOBER Image: Newcastle Marina, courtesy of Newcastle Tourism
 NEWCASTLE VISITOR PROFILE AND SATISFACTION REPORT Summary of results OCTOBER 2013 Image: Newcastle Marina, courtesy of Newcastle Tourism 3 NEWCASTLE VISITOR PROFILE AND SATISFACTION REPORT: SUMMARY OF
Summary Report. Economic Impact Assessment for Beef Australia 2015
 Summary Report Economic Impact Assessment for Beef Australia 2015 September 2015 The Department of State Development The Department of State Development exists to drive the economic development of Queensland.
Tourism Industry Council Tasmania Community Survey 2018 Research Report. May 2018
 Tourism Industry Council Tasmania Community Survey 2018 Research Report May 2018 This report has been prepared by Enterprise Marketing and Research Services 60 Main Road, Moonah TAS 7009 All enquiries
36% 64% 57% 43% Base: Total Sample - Excluding Residents (n=2,433) Base: Total Sample (n=2,480)
 Base: Total Sample (n=2,480)") Angus & Associates Ltd. 2017 The majority of the domestic travel market (87%) have visited, with one in four having visited within the past 12 months. Unsurprisingly, attracts a high proportion of visitors
Angus & Associates Ltd. 2017 The majority of the domestic travel market (87%) have visited, with one in four having visited within the past 12 months. Unsurprisingly, attracts a high proportion of visitors
OUTDOOR AND ENVIRONMENTAL STUDIES
 Victorian Certificate of Education 2002 SUPERVISOR TO ATTACH PROCESSING LABEL HERE Figures Words STUDENT NUMBER Letter OUTDOOR AND ENVIRONMENTAL STUDIES Written examination Monday 18 November 2002 Reading
Tropical North Queensland
 Tropical North Queensland Social Indicators 2013 This study examines the social impacts of tourism on the local communities, as perceived by its residents. The research is intended to inform the decision
MOURNE & SLIEVE CROOB AONB. VISITORS SURVEY Summary Report
 MOURNE & SLIEVE CROOB AONB VISITORS SURVEY Summary Report November 2004 This project was funded by 1 EXECUTIVE SUMMARY INTRODUCTION In 2004 Mourne Heritage Trust secured funding for the implementation
Domestic Tourism Snapshot Year ending March 2018
 Domestic overnight s within Australia Robust growth delivers records Domestic overnight expenditure in Australia Avg # Australians took a record 97.8m domestic overnight trips in 1 2 stay the year ending
1987 SUMMER USE SURVEY OF MINNESOTA STATE PARK VISITORS
 This document is made available electronically by the Minnesota Legislative Reference Library as part of an ongoing digital archiving project. http://www.leg.state.mn.us/lrl/lrl.asp (Funding for document
BUDGET GROUP ACCOMMODATION
 CAPE TRIBULATION YHA BUDGET GROUP ACCOMMODATION - 2018 Nestled deep within the Daintree Rainforest, Cape Tribulation YHA provides budget group accommodation at one of Australia s most famous beaches. With
Appendix 15.2: Pasha Dere Beach Usage Survey
 Appendix 15.2: Pasha Dere Beach Usage Survey URS-EIA-REP-22375 Table of Contents 15.2 Pasha Dere Beach Usage Survey... 1 15.2.1 Introduction... 1 15.2.2 Beach Surveys... 1 15.2.2.1 Survey Dates, Times
EXPO 88 IMPACT THE IMPACT OF WORLD EXPO 88 ON QUEENSLAND'S TOURISM INDUSTRY QUEENSLAND TOURIST AND TRAVEL CORPORATION GPO BOX 328, BRISBANE, 4001
 EXPO 88 IMPACT THE IMPACT OF WORLD EXPO 88 ON QUEENSLAND'S TOURISM INDUSTRY QUEENSLAND TOURIST AND TRAVEL CORPORATION GPO BOX 328, BRISBANE, 4001 Prepared by The National Centre for Studies in Travel and
Cedar Rapids Area Convention and Visitors Bureau Visitor Study
 Cedar Rapids Area Convention and Visitors Bureau Visitor Study 2003-2004 University of Northern Iowa Sustainable Tourism & The Environment Program www.uni.edu/step Project Directors: Sam Lankford, Ph.D.
Backpackers to the Northern Territory DEPARTMENT OF TOURISM AND CULTURE. Executive Summary June 2018
 Backpackers to the Northern Territory DEPARTMENT OF Executive Summary June 2018 Background and Objectives DEPARTMENT OF There has been a continuous decline in international backpacker numbers since the
Cultural and Heritage Tourism to NSW
 Cultural and Heritage Tourism to NSW Year Ended December 2017 This snapshot provides a profile of cultural and heritage 1 to New South Wales in the year ended (YE) December 2017. 2 VISITOR MARKET SIZE
Patterns of reef tourism on the GBR, Tropical North Queensland and the Whitsundays
 Patterns of reef tourism on the GBR, Tropical North Queensland and the Whitsundays Alexandra Coghlan & Bruce Prideaux School of Business, James Cook University Supported by the Australian Government s
Coffs Coast Visitor Profile and Satisfaction Report: Summary and Discussion of Results
 Coffs Coast Visitor Profile and Satisfaction Report: Summary and Discussion of Results Introduction The Coffs Coast Visitor Profile and Satisfaction (VPS) project was completed as part of the Destination
Changing Patterns of Reef Tourism
 Changing Patterns of Reef Tourism Gianna Moscardo, Rebecca Saltzer, Anne Galletly, Adrian Burke & Amy Hildebrandt CRC Reef Research Centre & James Cook University www.reef.crc.org.au Established and supported
Study on Hotel Management Graduates Perceptions and Preferences of Jobs in Hotel Industry in Chennai City
 Study on Hotel Management Graduates Perceptions and Preferences of Jobs in Hotel Industry in Chennai City T.S. Natarajan, Research scholar, Department of Management studies, SCSVMV University, India. E-mail:
Thai Airline Passengers' Opinion and Awareness on Airline Safety Instruction Card
 1 Thai Airline Passengers' Opinion and Awareness on Airline Safety Instruction Card Chantarat Manvichien International College, Suan Sunandha Rajabhat University, Thailand Chantarat.ma@ssru.ac.th Abstract
Events Tasmania Research Program Hobart Baroque Festival
 Events Tasmania Research Program Hobart Baroque Festival Research Report 2014 Prepared by This report has been prepared by Enterprise Marketing and Research Services Pty. Ltd. 60 Main Road, Moonah, 7009
Introduces the topic. Diamond shape of whole essay. Diamond shape of each body paragraph
 Academic writing has a particular structure. This structure can be represented like a diamond. The diamond structure repeats on a small level in paragraphs and assignment tasks and on a larger level in
Royal Parks Stakeholder Research Programme 2014
 1 Royal Parks Stakeholder Research Programme 2014 Park profile: Greenwich Park (Waves 1-3) January 2015 Technical note 2 This slide deck presents findings from three waves of survey research conducted
Analysing the performance of New Zealand universities in the 2010 Academic Ranking of World Universities. Tertiary education occasional paper 2010/07
 Analysing the performance of New Zealand universities in the 2010 Academic Ranking of World Universities Tertiary education occasional paper 2010/07 The Tertiary Education Occasional Papers provide short
Mackay Region. Destination Tourism Strategy
 Mackay Region Destination Tourism Strategy 2012 2016 Mackay Region The Mackay region offers an abundance of natural attractions including national parks, gorges, the Great Barrier Reef, numerous islands
Aboriginal and Torres Strait Islander Life Expectancy and Mortality Trend Reporting
 Aboriginal and Torres Strait Islander Life Expectancy and Mortality Trend Reporting Technical Report December 2015 Amended May 2016 Authors: Clare Coleman, Nicola Fortune, Vanessa Lee, Kalinda Griffiths,
National Passenger Survey Spring putting rail passengers first
 National Passenger Survey putting rail passengers first What is Passenger Focus? Passenger Focus is the independent national rail consumer watchdog. Our mission is to get the best deal for Britain s rail
1987 SUMMER USE SURVEY OF MINNESOTA STATE PARK VISITORS
 This document is made available electronically by the Minnesota Legislative Reference Library as part of an ongoing digital archiving project. http://www.leg.state.mn.us/lrl/lrl.asp (Funding for document
Prepared for: TOMM Committee Kangaroo Island CB Contact: Ben Nitschke, Account Manager Phone: (08)
") Prepared for: TOMM Committee Kangaroo Island CB Contact: Ben Nitschke, Account Manager Phone: (08) 8373 3822 Email: ben.nitschke@colmarbrunton.com Issue Date: 24 August, 2017 Project number: TOMM0003 www.colmarbrunton.com
Prepared for: TOMM Committee Kangaroo Island CB Contact: Ben Nitschke, Account Manager Phone: (08) 8373 3822 Email: ben.nitschke@colmarbrunton.com Issue Date: 24 August, 2017 Project number: TOMM0003 www.colmarbrunton.com
The Essential Report. 25 February MELBOURNE SYDNEY BRISBANE ADELAIDE BRUSSELS
 The Essential Report 25 February 2014 MELBOURNE SYDNEY BRISBANE ADELAIDE BRUSSELS www.essentialresearch.com.au The Essential Report Date: 25 February 2014 Prepared by: Essential Research Data supplied:
MAGNETIC ISLAND YHA YHAGROUPS.COM.AU
 B U D G E T G R O U P A C C O M M O D AT I O N 2 0 1 7 Set in the heart of untouched National Park and a short walk to Horseshoe Bay, Magnetic Island YHA provides great value for all of your group accommodation
BUDGET GROUP ACCOMMODATION 2018
 PORT DOUGLAS YHA BUDGET GROUP ACCOMMODATION 2018 Centrally located and the perfect base for exploring the Great Barrier Reef and the Daintree Rainforest, Port Douglas YHA provides great value for all of
SHORT BREAKS TO NSW INTRODUCTION
 SHORT BREAKS TO NSW March 2016 INTRODUCTION This document provides demographic profile of domestic and international short break 1 visitors to NSW, and their travel behaviour. It makes comparisons in terms
University College of Jaffna, Jaffna, Sri Lanka. Keywords: destination image, revisit, tourism risks, word of mouth communication, ritual beach sites
 Journal of Tourism and Hospitality Management, Jan.-Feb. 2018, Vol. 6, No. 1, 23-27 doi: 10.17265/2328-2169/2018.02.004 D DAVID PUBLISHING Exploring Tourism Risk at Jaffna Peninsula with Special Reference
RESEARCH AND PLANNING FORT STEELE HERITAGE TOWN VISITOR STUDY 2007 RESULTS. May 2008
 RESEARCH AND PLANNING FORT STEELE HERITAGE TOWN VISITOR STUDY 2007 RESULTS May 2008 Research and Planning Tourism British Columbia 300-1803 Douglas St. Box 9830 Stn. Prov. Gov t. Victoria, BC V8W 9W5 Web:
Papua New Guinea International Visitor Survey. January December 2017 Simon Milne
 Papua New Guinea International Visitor Survey January December 2017 Simon Milne Papua New Guinea Tourism Project Project Objectives Introduction 2 Objective 1: Grow tourism arrivals to PNG by working with
Tourism Impacts and Second Home Development in Coastal Counties: A Sustainable Approach
 Tourism Impacts and Second Home Development in Coastal Counties: A Sustainable Approach Brunswick, Currituck and Pender Counties, North Carolina (Funded by North Carolina Sea Grant) Center for Sustainable
Irish Fair of Minnesota: 2017 Attendee Profile
 TOURISM CENTER Irish Fair of Minnesota: 2017 Attendee Profile Authored by Xinyi Qian, Ph.D. Irish Fair of Minnesota: 2017 Attendee Profile November 13, 2017 Authored by Xinyi (Lisa) Qian, Ph.D., University
2015 British Columbia Parks. Visitor Survey. Juan De Fuca Park. China Beach
 2015 British Columbia Parks Visitor Survey Juan De Fuca Park China Beach 1 Contents Introduction 3 Methodology 3 Limitations 3 How this report is organized 3 Part 1 - Visitor Satisfaction 4 Part 2 - Visitor
TABLE OF CONTENTS. TOURIST EXPENDITURE 31 Average Spend per Person per Night ( ) 31 Tourist Expenditure per Annum ( ) 32
 31 Tourist Expenditure per Annum ( ) 32") FALKLAND ISLANDS International Tourism Statistics Report 2013 2 3 4 TABLE OF CONTENTS PAGE INTRODUCTION 6 KEY FACTS AND FIGURES 7 INBOUND TOURISM (OVERNIGHT VISITORS) 8 TOURIST ARRIVALS 8 Tourist Arrivals
FALKLAND ISLANDS International Tourism Statistics Report 2013 2 3 4 TABLE OF CONTENTS PAGE INTRODUCTION 6 KEY FACTS AND FIGURES 7 INBOUND TOURISM (OVERNIGHT VISITORS) 8 TOURIST ARRIVALS 8 Tourist Arrivals
2004 SOUTH DAKOTA MOTEL AND CAMPGROUND OCCUPANCY REPORT and INTERNATIONAL VISITOR SURVEY
 2004 SOUTH DAKOTA MOTEL AND CAMPGROUND OCCUPANCY REPORT and INTERNATIONAL VISITOR SURVEY Prepared By: Center for Tourism Research Black Hills State University Spearfish, South Dakota Commissioned by: South
Norfolk Island tourism industry
 Norfolk Island tourism industry Significance of tourism The tourism industry is Norfolk Island s main export and is a major driver of the Island s economy. Using expected distribution and value of tourist
CEREDIGION VISITOR SURVEY 2011 TOTAL SAMPLE. November 2011
 CEREDIGION VISITOR SURVEY 2011 TOTAL SAMPLE November 2011 TERMS OF CONTRACT Unless otherwise agreed, the findings of this study remain the copyright of Beaufort Research Ltd and may not be quoted, published
The Role of Gauteng in South Africa s Backpacking Economy
 The Role of Gauteng in South Africa s Backpacking Economy Jonathan Brandon Mograbi Dissertation submitted to the Faculty of Science of the University of the Witwatersrand, Johannesburg, in fulfilment of
Destination Visitor Survey Strategic Regional Research Queensland: Understanding the Queensland Touring Group
 Destination Visitor Survey Strategic Regional Research : Understanding the Touring Group Introduction Tourism is a major industry for (Qld), directly contributing around 124,000 jobs annually. In the year
TOURIST PROFILE AND PERCEPTION
 CHAPTER VI TOURIST PROFILE AND PERCEPTION 6.1 Tourist profile and Perception To know the background of the tourist and their perception about a particular tourist spot will help in the tourism promotion.
Accommodation Survey: November 2009
 Embargoed until 10:45am 19 January 2010 Accommodation Survey: November 2009 Highlights Compared with November 2008: International guest nights were up 2 percent, while domestic guest nights were down 1
PUHOI TO PAKIRI VISITOR SURVEY UPDATE. ( Simon Milne New Zealand Tourism Research Institute
 PUHOI TO PAKIRI VISITOR SURVEY UPDATE (www.regionalsurveys.co.nz) Simon Milne New Zealand Tourism Research Institute 1 There are three partners in this research - all contributing time, money, energy and
June TEQ Marketing Strategy 2025 Executive Summary
 June 2017 TEQ Marketing Strategy 2025 Executive Summary Vision and The Opportunity Tourism and Events Queensland s (TEQ) Marketing Strategy 2025 provides a platform to realise the TEQ vision of inspiring
Kenai Fjords National Park
 Kenai Fjords National Park Exit Glacier Area Visitor Study The Visitor Services Project 2 OMB Approval 1024-0224 Expiration Date: 12-23-99 United States Department of the Interior NATIONAL PARK SERVICE
Annual overnight visitor numbers to the region
 x TOURISM NT REGIONAL PROFILE Greater Darwin Report Period: Year Ending June 2018 Annual overnight visitor numbers to the region Sunset at Mindil Beach, Darwin Credit: Aude Mayans/Tourism NT REGION DEFINITION
Economic Impact Assessment of the Cruise Shipping Industry in Australia, Cruise Down Under. Final Report September, 2010
 Economic Impact Assessment of the Cruise Shipping Industry in Australia, 2009-10 Cruise Down Under Final Report September, 2010 Document Control Job ID: 15640 Job Name: Project Director: Project Manager:
Isles of Scilly Online Visitor Survey Final report. Produced for and on behalf of the Islands Partnership. May 2016
 Isles of Scilly Online Visitor Survey 2015 Final report Produced for and on behalf of the Islands Partnership by The South West Research Company Ltd. May 2016 Contents Page Summary 3 Introduction 7 Visitor
COMMUNITY BASED TOURISM DEVELOPMENT (A Case Study of Sikkim)
") COMMUNITY BASED TOURISM DEVELOPMENT (A Case Study of Sikkim) SUMMARY BY RINZING LAMA UNDER THE SUPERVISION OF PROFESSOR MANJULA CHAUDHARY DEPARTMENT OF TOURISM AND HOTEL MANAGEMENT KURUKSHETRA UNIVERSITY,
COMMUNITY BASED TOURISM DEVELOPMENT (A Case Study of Sikkim) SUMMARY BY RINZING LAMA UNDER THE SUPERVISION OF PROFESSOR MANJULA CHAUDHARY DEPARTMENT OF TOURISM AND HOTEL MANAGEMENT KURUKSHETRA UNIVERSITY,
Prepared for: TOMM Committee Kangaroo Island CB Contact: Naomi Downer, Account Director Phone: (08)
") Prepared for: TOMM Committee Kangaroo Island CB Contact: Naomi Downer, Account Director Phone: (08) 8373 3822 Email: naomi.downer@colmarbrunton.com Issue Date: 14 November, 2016 Project number: TOMM0002
Prepared for: TOMM Committee Kangaroo Island CB Contact: Naomi Downer, Account Director Phone: (08) 8373 3822 Email: naomi.downer@colmarbrunton.com Issue Date: 14 November, 2016 Project number: TOMM0002
SOME MOTIVATIONAL FACTORS THAT DETERMINE ROMANIAN PEOPLE TO CHOOSE CERTAIN TRAVEL PACKAGES
 36 SOME MOTIVATIONAL FACTORS THAT DETERMINE ROMANIAN PEOPLE TO CHOOSE CERTAIN TRAVEL PACKAGES Author: Nicolescu Maria-Mădălina Bucharest Academy of Economic Studies, Faculty of Commerce nicolescumariamadalina@yahoo.com
1.4 Previous research on New Zealand subantarctic tourism
 Figure 5 The subantarctic islands are nature reserves protecting habitats of great conservation value, such as that of the Southern Royal albatross, seen here at the Auckland Islands. Tourist visits must
Minnesota River Valley Area Survey Summary Report
 Minnesota River Valley Area Survey Summary Report Report prepared by: Minnesota Department of Natural Resources Office of Management and Budget Services May 2002 ACKNOWLEDGMENTS A number of organizations
State Park Visitor Survey
 State Park Visitor Survey Methods, Findings and Conclusions State s Department of Recreation, Park and Tourism Management surveyed state park visitor and trip characteristics, and collected evaluations
LATENCY OF TOURISM PERMITS IN THE GREAT BARRIER REEF MARINE PARK AUDIT FOR THE YEAR 2000
 LATENCY OF TOURISM PERMITS IN THE GREAT BARRIER REEF MARINE PARK AUDIT FOR THE YEAR 2 Tourism and Recreation Group December 2 DISCLAIMER The information provided in this Audit is for information and discussion
International Tourism Snapshot
 Australia on a high International visitors to Australia Australia welcomed 7.8m international visitors in the year ending June International visitor expenditure in Australia 2017, more than any previous
Cruise tourism in Akaroa: Visitor experiences, business stakeholder perceptions, and community attitudes Michael Shone & Jude Wilson 31 July 2013
 Cruise tourism in Akaroa: Visitor experiences, business stakeholder perceptions, and community attitudes Michael Shone & Jude Wilson 31 July 2013 Part A: Cruise ship visitor experiences and expenditure,
Papua New Guinea International Visitor Survey. January December 2017 Simon Milne
 Papua New Guinea International Visitor Survey January December 2017 Simon Milne Summary of the Key Findings Total Direct Economic Impact for Jan-Dec 2017 Figures exclude employment and cruise visitors
National Rail Passenger Survey Autumn 2013 Main Report
 National Rail Passenger Survey Autumn 2013 Main Report What is Passenger Focus? Passenger Focus is the independent consumer watchdog for Britain s rail passengers and England s bus, coach and tram passengers
9 November, Defence White Paper 2015 R1-3-A135 Russell Offices Department of Defence PO Box 7901 CANBERRA BC ACT 2610.
 9 November, 2014 Defence White Paper 2015 R1-3-A135 Russell Offices Department of Defence PO Box 7901 CANBERRA BC ACT 2610 Dear Sir/ Madam Re: 2015 Defence White Paper On behalf of the Regional Development
Exemplar for Internal Achievement Standard Geography Level 1. Conduct geographic research, with direction
 Exemplar for internal assessment resource Geography for Achievement Standard 91011 Exemplar for Internal Achievement Standard Geography Level 1 This exemplar supports assessment against: Achievement Standard
A TYPOLOGY OF CULTURAL HERITAGE ATTRACTION VISITORS
 University of Massachusetts Amherst ScholarWorks@UMass Amherst Tourism Travel and Research Association: Advancing Tourism Research Globally 2007 ttra International Conference A TYPOLOGY OF CULTURAL HERITAGE
June TEQ Marketing Strategy 2025 Executive Summary
 June 2018 TEQ Marketing Strategy 2025 Executive Summary Vision and The Opportunity Tourism and Events Queensland s (TEQ) Marketing Strategy 2025 provides a platform to realise the TEQ vision of inspiring
Economic Impact Assessment of the Cruise Shipping Industry in Australia, Executive Summary Cruise Down Under
 Economic Impact Assessment of the Cruise Shipping Industry in Australia, 2013-14 Executive Summary Cruise Down Under September, 2014 Disclaimer: Whilst all care and diligence have been exercised in the
CHAPTER FIVE RESULTS OF THE STAKEHOLDERS SURVEYS
 CHAPTER FIVE RESULTS OF THE STAKEHOLDERS SURVEYS This chapter includes the presentation of the collected data, statistical analysis, and discussion of the findings. 5.0. INTRODUCTION The main purposes
Contents Manningham at a Glance... 6 Location and Area... 6 Manningham Activity Centres... 6 Manningham Suburbs... 6 Population... 8 Forecast... 9 For
 Contents Manningham at a Glance... 6 Location and Area... 6 Manningham Activity Centres... 6 Manningham Suburbs... 6 Population... 8 Forecast... 9 Forecast 2011 2036... 9 Population Forecast... 9 Gross
Aboriginal and Torres Strait Islander Life Expectancy and Mortality Trend Reporting to 2014
 Aboriginal and Torres Strait Islander Life Expectancy and Mortality Trend Reporting to 2014 Technical Report June 2016 Authors: Clare Coleman, Nicola Fortune, Vanessa Lee, Kalinda Griffiths, Richard Madden
Outdoor Adventures Department of Recreational Sports Spring 2017
 Outdoor Adventures Department of Recreational Sports Spring 2017 Background The Department of Recreational Sports maintains a more than 400,000 square foot facility visited by thousands of students, faculty,
Keeping the Outstanding Exceptional: The Future of World Heritage in Australia
 Keeping the Outstanding Exceptional: The Future of World Heritage in Australia Editors: Penelope Figgis, Andrea Leverington, Richard Mackay, Andrew Maclean, Peter Valentine WORLD HERITAGE AND THE COMMUNITY
LANGPORTS ENGLISH + VOLUNTEERING PROGRAMS
 LANGPORTS ENGLISH + VOLUNTEERING PROGRAMS www.langports.com ENGLISH + VOLUNTEERING PROGRAMS AT LANGPORTS To complement our existing programs, Langports is now offering students increased opportunities
Florida State Park Visitors Park Visiting Party Size
 Party size is roughly the same across all regions. State Park Visitors Park Visiting Party Size Total Central Northeast Northwest Southeast Southwest (n=3972) (n=798) (n=792) (n=782) (n=796) (n=804) Avg.
LANGPORTS ENGLISH + VOLUNTEERING PROGRAMS
 LANGPORTS ENGLISH + VOLUNTEERING PROGRAMS www.langports.com ENGLISH + VOLUNTEERING PROGRAMS AT LANGPORTS To complement our existing programs, Langports is now offering students increased opportunities
Land Management Summary
 photo credit: ANGAIR Anglesea Heath Land Management Summary The Anglesea Heath (6,501 ha) was incorporated into the Great Otway National Park in January 2018. This provides an opportunity to consider the
PEMBROKESHIRE & CORNWALL VISITOR SURVEYS 2011/12 COMPARING THE DESTINATIONS. February 2013
 PEMBROKESHIRE & CORNWALL VISITOR SURVEYS 2011/12 COMPARING THE DESTINATIONS February 2013 Prepared for: Visit / Destination Pembrokeshire Partnership Client Contact: Emma Rojano/ Mark Horner TERMS OF CONTRACT
Isles of Scilly Visitor Survey Final report. Produced for and on behalf of the Islands Partnership. May 2017
 Isles of Scilly Visitor Survey 2016 Final report Produced for and on behalf of the Islands Partnership by The South West Research Company Ltd. May 2017 Contents Page Summary 3 6 Introduction 7 10 Visitor
Perth & Kinross Council. Community Planning Partnership Report June 2016
 Perth & Kinross Council Community Planning Partnership Report June 2016 Contents Foreword... 3 Section 1: Spring 2016 destination follow up of 2014/15 school leavers... 4 Background... 4 Section A: Initial