Strategic Review of the WestConnex Proposal Final Report City of Sydney February 2015
|
|
|
- Claribel Welch
- 5 years ago
- Views:
Transcription

1 Strategic Review of the WestConnex Proposal Final Report City of Sydney February Final Report_150409
2 This report has been prepared for City of Sydney. SGS Economics and Planning has taken all due care in the preparation of this report. However, SGS and its associated consultants are not liable to any person or entity for any damage or loss that has occurred, or may occur, in relation to that person or entity taking or not taking action in respect of any representation, statement, opinion or advice referred to herein. SGS Economics and Planning Pty Ltd ACN Offices in Canberra, Hobart, Melbourne and Sydney Final Report_150409
3 TABLE OF CONTENTS EXECUTIVE SUMMARY 1 1 INTRODUCTION 4 2 THE ECONOMIC AND TRANSPORT CONTEXT Introduction Recent employment growth Historic population growth and distribution Transport movements over time Planning response to date Significant future infrastructure Key observations 14 3 ABOUT WESTCONNEX Introduction Project history 16 Original route (2012) 16 Updated WestConnex Route (2013) 18 Updated WestConnex Route (2014) WestConnex Policy Alignment Summary 23 4 STRATEGIC ASSESSMENT OF WESTCONNEX Introduction Strong population growth in Western Sydney with employment growth in Sydney s East 24 Origin-destination evidence 24 Journey to work to Sydney CBD 25 Journey to work to Global Economic Corridor (GEC) 27 Journey to work to Eastern Sydney 28 Journey to work from Eastern Sydney 29 Employment type 30 Corridor growth Urban renewal along Parramatta Road The economic stimulus of WestConnex The cost, benefits and risks of WestConnex 35 NSW Auditor-General Review (2014) Summary of findings 37 5 STRATEGIC ALTERNATIVES TO WESTCONNEX Introduction Strategic alternatives 40 West Metro 40 Road Pricing 41
4 Wider Public Transport Investments 42 Other considerations 43 6 CONCLUDING REMARKS 44 APPENDIX 1. TOLL ROAD CASE STUDIES 46 CityLink 46 Initial project drivers and anticipated impacts 46 Funding and management 48 Cross City Tunnel 48 Initial project drivers and anticipated impacts 48 Funding and management 49 Lane Cove Tunnel 49 Initial project drivers and anticipated impacts 49 Funding and management 50 Clem Jones Tunnel 50 Initial project drivers and anticipated impacts 50 Funding and management 50 APPENDIX 2. DATA ANALYSIS 52 Geographies 52 REFERENCES 57
5 TABLES TABLE 1. SUB-REGIONS EMPLOYMENT G ROWTH, TO TABLE 2. LOCATION OF E MPLOYME NT IN SELECT INDUSTR IES 6 TABLE JTW DATA FOR WE STCONNEX CATCHMENTS 25 TABLE JTW TRIPS BY IN DUSTRY 31 TABLE 5. TRAFFIC ON PARRAMATTA ROAD 33 TABLE 6. WESTCONNEX BENEFIT COST ANALYSIS RESULTS 35 TABLE 7. TRAVEL TIME SAVINGS WITH WESTCONNEX IN COMPARED TO TRAV EL VIA EXISTING ROUTES 36 TABLE 8. WEST ME TRO AT A GLAN CE 41
6 FIGURES FIGURE 1. SYDNE Y EMPLOYMENT BY SELECT INDUSTRIES (0 00S) 6 FIGURE 2. SYDNE Y POPULATION GROWTH 7 FIGURE 3. POPULATION GROWTH IN SYDNEY FIGURE 4. RAIL PASSENGER JOURN EYS, SYDNEY AND MELBOURNE (MILLIONS) 9 FIGURE 5. NEW SOUTH WALES GOVE RNMENT EXPENSES BY P URPOSE (MILLIONS) 10 FIGURE 6. ACTUAL AND PREDICTED LEVELS OF SYDNEY TRA FFIC PER PERSON 11 FIGURE 7. AGGREGATE TRAFFIC LE VELS IN SYDNEY 11 FIGURE 8. TRE NDS IN TRAVEL TO THE SYDNEY CITY CENT RE AM PEAK 1 HOUR 12 FIGURE 9. POPULATION DENSITY 1KM² GRID SYDNEY AND LONDON 12 FIGURE 10. SNAMUTS COMPOSITE IN DEX 13 FIGURE 11. WESTCONNEX ALIGNMENT FIGURE 12. CORE E LEMENTS AND CO NNECTIONS 17 FIGURE 13. WESTCONNEX ROUTE FIGURE 14. PROPOSE D WESTCONNEX EXTENSIONS 19 FIGURE 15. WESTCONNEX ALIGNMENT (DECEMBER 2014) 20 FIGURE 16. ST PE TERS INTERCHANG E 21 FIGURE 17. POTENTIAL CONNECTION S IN THE MOTORWAY NE TWORK 22 FIGURE 18. A PLAN FOR GROWING SYDNEY 23 FIGURE 19. PROPORTION OF JOURNE Y TO WORK TRIPS TO SYDNEY CBD 26 FIGURE 20. PROPORTION OF PT TRI PS TO THE CBD 27 FIGURE 21. PROPORTION OF JTW TR IPS TO GLOBAL ECONOM IC CORRIDOR 28 FIGURE 22. PROPORTION OF JOURNE Y TO WORK TRIPS TO E ASTERN SUBURBS 29 FIGURE 23. PROPORTION OF JTW TRIPS FROM EASTE RN SUBURBS 30 FIGURE 24. REGIONAL GROWTH INDI CATORS 32 FIGURE 25. DISCARDE D PLAN FOR PARRAMATTA ROAD 33 FIGURE 26. NEW SOUTH WALES CONSTRUCTION EMPLOYMENT (000S) 34 FIGURE 27. CARRYING CAPACITY BY MODE (PER HOUR ON 3. 5 METRE LANE) 40 FIGURE 28. SYDNEY S RAIL NE TWOR K 42 FIGURE 29. EARLY CITY RING ROAD AND CBD ACCESS ROUTE S (1954) 46 FIGURE 30. CITYLINK WESTE RN AND SOUTHERN COMPONENTS 47 FIGURE 31. ME TROPOLITAN SUB -REGIONS 56
7 EXECUTIVE SUMMARY In 2012, the WestConnex project was announced by Government. The project is effectively a suite of smaller projects, including renewal of Parramatta Road, M4 Widening, M4 East, M4-M5 Link, a new M5 and links to the port and Sydney airport. When all stages of WestConnex are completed it will be the largest continuous motorway in Australia and will influence land use and transport patterns over half of Sydney. However, its purpose and the challenges it is trying to address remain unclear. Sydney is projected to be home to approximately 6.2 million by 2031, with 8.5 million by Sydney is a vast metropolis of almost 5 million people which is rapidly growing. This level of growth presents a significant planning challenge. Ensuring Sydney s economic and social performance improves while it grows will require challenging transport planning and urban development dynamics to be addressed. Individual transport projects can have far reaching and, often unintended, consequences on the broader transport network and urban structure of the city. It could be argued that many of the transport and land use challenges Sydney faces today are the consequence of ad hoc, uncoordinated or narrowly considered approaches to planning in the past. While freeway building in the 50s, 60s and 70s led the city to expand and become more productive, more recent road building (e.g. Cross City Tunnel and Lane Cove Tunnel) has not generated expected accessibility improvements. This is due to the changed economic geography of Sydney, with jobs increasingly clustering at sites with good access to the mass transit network. Rail patronage has risen in Sydney, while growth in car usage has slowed. Sydney, like other international cities, has witnessed an upward trend in heavy rail patronage over the past thirty years coinciding with slowing of growth in kilometres travelled by car. As cities grow in size, travel by private car becomes increasingly challenging for commuters. Sydney s strategic planners have recognised this changed pattern and have developed policies that attempt to shape the city to function more productively. They aim to do this by promoting greater densities at key locations and along mass transit corridors. Rail accessibility remains low in parts of Sydney, including its growth areas. Greenfield development has continued in Sydney s outer north and south west. These areas do not have a high level of public transport accessibility, and the proposed North West and South West Rail Links will not connect all residents to the mass transit system. For example, areas around Rouse Hill, Kellyville and Castle Hill will continue to be relatively isolated in public transport terms. This in turn has led these locations to be highly dependent on car travel. The differing level of accessibility across Sydney effectively leads to an uneven level of access to opportunities for residents. This has the potential to entrench concentrations of social and economic disadvantage. In this context, the suitability of any major transport investment must be scrutinised to ensure benefits outweigh costs, value for money is achieved and Sydney s sustainable long term growth is supported. 1
8 A review of the WestConnex project and its justification shows: It is highly unlikely that there will be sufficient demand to ensure the various WestConnex tolls roads are viable. Journey to work data does not support construction of WestConnex. Analysis suggests that the travellers in the key catchment, that are intended to be users, are now more likely to make use of public transport. Only four per cent of workers in Penrith, St Marys and Camden travel to the CBD. Furthermore, 90 per cent of work trips to the CBD from the west are made by public transport compared to 74 per cent for Sydney overall. This suggests that major public transport improvements in this corridor might be a better way of managing travel needs and stimulating urban renewal. The construction of Sydney s second airport at Badgerys Creek and the Moorebank Intermodal Freight Terminal (and smaller intermodal terminals around Sydney) may mean that the M5 extensions between Sydney Airport / Port Botany and Western Sydney are not required. The Business Case for WestConnex was completed prior to the announcement of the second Sydney airport at Badgerys Creek. Sydney s second airport will not only change the distribution of passenger and freight movements around Sydney; it will catalyse local employment growth in related industries. The small proportion of workers from Sydney s west who work in the east tend to be employed in the manufacturing and transport-related industries. This proportion is likely to decline, with job growth around the second airport. The Moorebank Intermodal Freight Terminal will also change the pattern of freight movements. It is not guaranteed that WestConnex would remove traffic from local roads. Information on the impact of each component of WestConnex has not been made available. Data on assumptions, benefits and costs has not been released to date. This is in contrast to published material on NorthConnex, which considers expected traffic flow and impact on surrounding areas. With this lack of detail, there is uncertainty about whether dis-benefits, such as road congestion, particularly on secondary roads will be generated. For example, it appears unlikely that M4 East would draw sufficient traffic off Parramatta Road to significantly improve the local amenity and lead to significant urban renewal, over a do nothing scenario unless Parramatta Road capacity is reduced significantly, which does not appear to be a favoured approach. The travel time savings put forward in the public documents are not plausible until all of the proposed road sections are completed. Given that the current planning would see the project delivered in stages, it is unlikely that travel time savings would materialise until all road sections are complete. Previous toll road projects have overestimated the travel time savings and drivers propensity to use the toll road, to the point where the toll roads have been financial disasters 1. These previous toll roads have had a number of similar characteristics: Brownfield projects which required tunnelling The roads themselves are relatively short (in distance) and hence travel time savings were limited (or the aggregation of many small time savings) Did not significantly improve accessibility to key employment hubs. In its current form, the various individual segments of WestConnex share these characteristics. Failed toll roads have shaken the private sector s appetite for investment in WestConnex meaning Government 1 These include the Lane Cove Tunnel 1, Cross City Tunnel and the Clem 7. 2
9 would be taking on the risk of the project until toll revenues are attractive to private sector investors. Consequently NSW taxpayers could be exposed to decades of subsidy for an underperforming asset. Given the current strength of Sydney s construction sector and private sector plans for more investment, the need for a large scale public works project to stimulate additional activity is questionable. The WestConnex is predicated on generating economic stimulus by supporting forecast growth in freight movements across Sydney, at Sydney Airport and through Port Botany. However, Sydney has a strong economy. The unemployment rate in Sydney is 5.1 percent compared with 6.1 percent for the rest of the country. In , GDP growth was 4.3 percent, compared with the national rate of 2.5 percent. The construction industry is recording its highest employment levels of all time. Significant concerns about the process undertaken to assess WestConnex mean that the project requires significant scruitiny. The Auditor-General s report in relation to the assurance processes associated with WestConnex raises serious concerns around the process undertaken to date and the adequacy of the project in terms of governance and independent assurance. The report suggests four gateway reviews were required but not undertaken. Further to this, the significant State investment into WestConnex will reduce the ability for Government to invest in other infrastructure. It may also cause unintended dis-benefits as it does not adequately respond to current demographic and transport movements. There are alternative solutions which better support Sydney s population and employment growth. There may be alternative projects which could deliver more effective ways of achieving stated government objectives. For example, the West Metro proposed during the mid-2000s would connect the western suburbs of Sydney from Westmead to the Sydney CBD. The project aimed to provide fast, frequent mass transport. It would be likely to unlock urban renewal along Parramatta Road, Rosehill, Camellia, Parramatta East and Silverwater. An alternative to alleviating road congestion by building new road infrastructure to increase capacity is to use pricing mechanisms. Reviewing or introducing pricing mechanisms was included as part of the NSW Long Term Transport Master Plan. The Master Plan proposed more efficient road user charges with pricing and revenue reforms. These factors suggest that WestConnex is not a holistic solution to Sydney s growth challenges, and it fails to respond to key employment and transport trends. There is no doubt that Sydney s transport network requires significant investments to deal with a population of 6.2 million people by However, significant doubt remains around the suitability of WestConnex to respond to these challenges. 3
10 1 INTRODUCTION Sydney is the economic powerhouse of the nation and a gateway to the global economy. It generates almost a quarter of Australia s GDP and is home to much of the nation s key economic infrastructure, critical to the prosperity of industries and sectors across New South Wales and Australia. Given Sydney s paramount economic and social importance, the structure and functioning of the city has ramifications across all spheres of government, whether in relation to issues of productivity, social stability, environmental sustainability, or, ultimately government taxation revenues. The past twenty years have seen a change in economic geography, residential development and transport patterns that have signalled the end of a city whose development will be led by motorways. In 2012, the WestConnex project was announced by Government. The project is effectively a suite of smaller projects, including renewal of Parramatta Road, M4 Widening, M4 East, M4-M5 Link, a new M5 and links to the port and Sydney airport. When all stages of WestConnex are completed it will be the largest continuous motorway in Australia and will influence land use and transport patterns over half of Sydney. However, its purpose and the challenges it is trying to address remain unclear. In this context, it is critical that a holistic review of WestConnex is undertaken. Transport projects such as WestConnex can have far reaching and, often unintended, consequences on both the broader transport network and on the urban structure of the city. Failing to apply a whole of city, whole of network, integrated transport and land use approach to transport project planning and funding decisions is likely to result in undesirable urban realities and be both extremely costly and timely to reverse. This report examines the strategic justification of WestConnex in light of: Population and employment trends The recently announced second Sydney Airport and Badgery s Creek, and Future freight movements. It aims to determine the extent to which WestConnex responds to known planning challenges, demographic and transport trends and other future infrastructure investment. The remainder of this report is structured as follows: Section 2 presents the economic geography of Sydney and the current planning response to its challenges Section 3 outlines the development of WestConnex and the stated project justification Section 4 assesses the strategic merit of WestConnex Section 5 raises potential alternatives to the project Section 6 presents some concluding remarks Appendix 1 presents toll road case studies, and Appendix 2 presents additional data analysis. 4
11 2 THE ECONOMIC AND TRANSPORT CONTEXT 2.1 Introduction This section provides the context for consideration of WestConnex, its stated objectives and benefits and suitability to meet Sydney s growth challenges. This section presents evidence on Sydney s: Population growth and distribution Employment growth and distribution by industry Rail patronage trends Car usage patterns, and The policy response to date. 2.2 Recent employment growth Sydney hosts almost 2.5 million jobs and generates approximately a quarter of Australia s total GDP. Much of this economic activity is concentrated in the Central city sub-region, with 36 percent of jobs in , contributing to 54 percent of total job growth from to (Table 1). Also demonstrating strong growth is the Global Economic Corridor, stretching north of the CBD to North Sydney, St Leonards, Chatswood, Macquarie Park, and on to Parramatta. These sub-regions are illustrated in Figure 30 on page 53. TABLE 1. SUB-REGION S E MPLOYMENT GROWTH, TO Region Annual Growth Rate Contribution to Central 778, , % 54% South 152, , % -2% North 438, , % 22% West Central & North West 378, , % 13% West 118, , % 3% South West 280, , % 7% Central Coast 113, , % 4% Growth Sydney 2,260,136 2,402, % 100% Source: SGS Economics and Planning Of the 72,000 additional jobs in the Central sub-region from to , 60 percent have been generated in the Financial services, Professional services and Health care industries. The growth of these industries reflects a broader restructuring of the Sydney economy and labour market. As Figure 1 demonstrates, since the mid-1990s, employment in Professional and Financial services has increased drastically while employment in Manufacturing has fallen. 5
12 FIGURE 1. SYDNEY EMPLOYMENT BY SELECT INDUSTRIES (000S) Employment ('000) Source: ABS 2014, SGS Economics and Planning A vast majority of Sydney s financial services jobs (58.4 percent) and a high proportion of Professional services jobs (29.8 percent) are clustered in the Inner Sydney Statistical Local Area (Table 2). There are also significant clusters in other centres along the Global Economic Corridor. Interestingly, Manufacturing, which still employs almost 200,000 people, is scattered quite evenly throughout the western suburbs. TABLE 2. Rank LOCATION OF E MPLOYME NT IN SELECT INDUSTR IES Manufacturing Share of Jobs Financial Services Share of Jobs Professional Services 1 Blacktown (C) - South-East 5.0% Sydney (C) - Inner 58.4% Sydney (C) - Inner 29.8% 2 Auburn (C) 5.0% Parramatta (C) - Inner 6.5% North Sydney (A) 10.8% 3 Fairfield (C) - West 4.8% North Sydney (A) 6.4% Ryde (C) 5.2% 4 Holroyd (C) 4.8% Auburn (C) 3.0% Sydney (C) - East 4.3% 5 Liverpool (C) - East 4.4% Canada Bay (A) - Concord 2.3% Sydney (C) - West 3.7% 6 Campbelltown (C) - North 4.2% Willoughby (C) 1.7% Willoughby (C) 3.6% 7 Ryde (C) 4.1% The Hills Shire (A) - Central 1.5% Warringah (A) 2.4% 8 Bankstown (C) - South 3.5% Sydney (C) - West 1.1% Parramatta (C) - Inner 2.3% 9 Botany Bay (C) 3.3% Kogarah (C) 1.1% Sydney (C) - South 2.2% 10 Sydney (C) - South 3.3% Hurstville (C) 1.0% Ku-ring-gai (A) 2.0% Source: ABS 2014, SGS Economics and Planning Manufacturing Financial Services Professional Services This industry structure has had some very clear implications for the distribution of employment and population and the associated transport patterns. After the Second World War the economy of Sydney was driven by rapid growth in manufacturing, which was dispersed throughout the rapidly expanding metropolis of Sydney. Increasing levels of car ownership contributed to easy access to labour, supplies and customers, supporting the growth of manufacturing in locations with plentiful or inexpensive Share of Jobs 2 Financial year annual 6
13 industrial land. In contrast, Financial and Professional services businesses tend to cluster together within Inner Sydney. With the decline of manufacturing, this has affected work travel patterns with an increased proportion of workers travelling to the CBD and immediate surrounds. Continued employment growth, driven by the Financial and Professional services industry along with population growth will exacerbate this trend. 2.1 Historic population growth and distribution Sydney is now home to approximately 4.8 million people, up by 1.2 million people since As shown in Figure 2, growth was highest in 2008, and has been on an upward trajectory since FIGURE 2. SYDNEY POPULATION GR OWTH Source: Australian Historical Population Statistics, 2014 (Cat. No ) The following Figure illustrates how there have been two distinct growth patterns for the city, one of significant residential intensification in the inner urban core and in the spine to Parramatta, and one of high growth on the urban fringe. Through the middle suburbs there has been less intense growth. 7
. This long term trend reflects economic restructuring of the city.")
14 FIGURE 3. POPULATION GROWTH IN SYDNEY Source: SGS Economics and Planning base on ABS data 2.1 Transport movements over time Since 1979, there has been sustained growth in rail passenger journeys in Sydney (Figure 4). This long term trend reflects economic restructuring of the city. The early (60s and 70s) manufacturing led dispersion of Sydney s development was assisted by increased car ownership and road construction, led to a steady fall in rail passenger numbers for three decades. During the 1980s this trend slowed and the 1990s saw an increase in passengers, spurred by more jobs locating within the CBD and Parramatta on the rail network. The speed of this growth increased during the 2000s. Interestingly, similar trends were displayed in Melbourne with rapid growth in rail patronage over the last decade. 8
15 FIGURE 4. RAIL PASSENGE R JOURN EYS, SYDNEY AND MELBOURNE (MI LLIONS) 3 Source: Historical ABS Year Books and Grattan Institute 2012 Can we afford to get our cities back on the rails. The time series is not complete so data has been interpolated and estimated in certain periods. In response to the increased demand for mass transit, the New South Wales Government has shifted more expenditure towards public transport compared with roads, as shown in Figure 5. In , $3.5 billion was spent on public transport in New South Wales 4. 3 The opening of the City Loop in Melbourne during the 1980s provided the city with significant capacity for increased passenger numbers and hence employment growth. Sydney s capacity into the central city was fixed to the requirements of the 1930s. 4 Sydney-based figures are not available. 9
16 FIGURE 5. NEW SOUTH WALES GOVERNMENT EXPENSES BY PURPOSE (MILLIONS) 5 Source: Government Finance Statistics, Australia, (Cat No ) The upwards trend in heavy rail patronage over the past thirty years has coincided with a slowing in growth of total kilometres travelled by car. The following figures present Bureau of Infrastructure, Transport and Regional Economics (BITRE) 6 historical data on the kilometres travelled by car in New South Wales. BITRE also provide modelling on the future kilometres travelled by car and the per capita rate. The BITRE data confirms that as Sydney s population grows, the number of average car trips per capita will not grow. However, the projected growth in Sydney s population does mean that in aggregate, car travel will increase. 5 This would include expenditure on the North West Rail Link
17 FIGURE 6. ACTUAL AND PREDICTED LEVELS OF SYDNEY TRA FFIC PER PERSON Source: BITRE Traffic Growth in Australia FIGURE 7. AGGREGATE TRAFFIC LE VELS IN SYDNEY Source: BITRE Traffic Growth in Australia Focusing on the City of Sydney in particular further highlights the increase in mass transit usage. In , more than 80 percent of people travelling to or from the CBD during the morning peak did so via mass transit 7. This is compared with 14 percent of trips to the city centre made by car. 7 (Heavy rail, bus, light rail and ferry) 11
 align with")

18 FIGURE 8. TRENDS IN TRAVEL TO THE SYDNEY CITY CENT RE AM PEAK 1 HOUR Source: NSW Government Sydney City Centre Access Strategy Per capita total kilometres travelled by car figures (Figure 5) align with trends observed in international cities. As the density of population in a city grows, increased opportunities for mass transit and transport orientated development tend to support higher public transport usage. Sydney s current population density is compared to London (Figure 8) which has a population of over 8 million people. Sydney will be nearing that size in the next thirty years, and could see similar population densities to London become apparent. FIGURE 9. POPULATION DENSITY 1 KM² GRID SYDNEY AND LONDON Source: Australian Population Grid,
 cities are the best performers for overall public transport")
19 Comparing Sydney s to its international peers highlights poor public transport accessibility. The Composite Index comparison demonstrates which of the Spatial Network Analysis for Multi-Modal Urban Transport Systems (SNAMUTS) cities are the best performers for overall public transport accessibility. Sydney is one of the lower ranked international cities on the SNAMUTS. FIGURE 10. SNAMUTS COMPOSITE IN DEX Source: Spatial Network Analysis for Multi-Modal Urban Transport Systems 2.2 Planning response to date The New South Wales Department of Planning and Environment released a new metropolitan strategy for Sydney in December 2014 titled A plan for growing Sydney. The plan recognises the challenges that Sydney faces with population growth, and sets out a pathway to address these. A plan for growing Sydney contains four key goals: a competitive economy with world-class services and transport a city of housing choice, with homes that meet our needs and lifestyles a great place to live with communities that are strong, healthy and well connected a sustainable and resilient city that protects the natural environment and has a balanced approach to the use of land and resources. The strategy is particularly focused on employment and the economy, with actions including accelerating urban renewal across Sydney around train stations, growing a more internationally competitive Sydney, growing Parramatta as Sydney s second CBD, improving productivity in Western Sydney, and enhancing capacity at key international gateways and managing long term growth. In the east of Sydney, the plan aims to focus urban renewal along existing heavy rail corridors and the committed CBD and South East Light Rail line. The Sydney CBD (including North Sydney) is the main focus for employment within Sydney and the strategy seeks to grow the international competitiveness of the CBD and expand the centre to the south from Central to the Eveleigh precinct. In the west of Sydney, the residential focus is on Greenfield development in the growth centres of the North West and the South West, while for employment growth the focus is on the Badgerys Creek and Western Sydney Employment Area (WSEA). Parramatta is recognised as Sydney s second CBD, however the focus of the strategy is to expand the centre to include the specialised activity areas of Westmead, 13
20 Parramatta North, Rydalmere and Camellia and establish a new growth area between Greater Parramatta and Olympic Park. The strategy identifies the significant role that a Parramatta light rail connection could play in supporting this vision. The proposed Parramatta light rail network (under investigation) is noted in the strategy as a project with the potential to increase the catchment of Parramatta s CBD and link various precincts between Greater Parramatta and Olympic Park. Additionally, three regional cities have been identified within the strategy; Penrith, Liverpool and Campbelltown-Macarthur, as well as 22 strategic centres and four transport gateways. These centres are the primary focus for dwelling and employment growth. The Global Economic Corridor is supported by high quality public and private transport infrastructure that connects the corridor s employment centres. The resulting high levels of accessibility provide favourable conditions to attract firms and improve firm productivity. In addition to the Global Economic Corridor, the metropolitan strategy introduces two Enterprise Corridors, one running between Bankstown and Liverpool, and the other along Bringelly Road from Leppington to the Badgerys Creek site. Enterprise corridors are loosely defined as an area designed to attract investment and stimulate employment-generating development that is aligned with specific sections of rail or road transport infrastructure. Further west of Liverpool, Greater Western Sydney is a key focus of the metropolitan strategy for accommodating both population and employment growth. The North West and South West Growth Centres are Greenfield release areas which have been subject to precinct planning over the past ten years and will accommodate both housing and employment. 2.3 Significant future infrastructure The Australian Government has announced that Badgerys Creek will be the site for a Western Sydney airport 8. This will divert air traffic from Mascot and increase opportunities for industrial and commercial development in Sydney s West. Over the next 10 years $3.6 billion will be invested in roads to connect Badgerys Creek to Sydney's motorway network, making the proposed airport site easily accessible to Western Sydney residents. The airport will become operational in the mid-2020s and will begin to reduce road traffic to Mascot and hence directly compete with WestConnex. 2.4 Key observations Sydney s economic geography has changed, with recent and forecast travel patterns showing higher levels of rail patronage, in line with the high growth of the Financial and Professional industries in the Central sub-region of Sydney. Sydney has already demonstrated a flatlining of per capita kilometres travelled a key trend evident in other international cities. This is linked not only to the growth of jobs in the CBD, but the decline in the dispersed manufacturing industry over the last decade. With increased population growth (8.3 million by 2061), the density of Sydney will grow. Mass transit systems which support this growth are a critical piece of economic infrastructure required to support growth in jobs and economic prosperity. Strategic planning policy has recognised this challenge, and has accordingly planned for increased urban renewal in well-located inner urban locations and around train stations, along with supporting growth of
21 the CBD and Parramatta. The plan also identifies the opportunity to grow employment in Badgery s Creek, the location of Sydney s future second airport, and the Western Sydney Employment Area. 15

22 3 ABOUT WESTCONNEX 3.1 Introduction Since its announcement in 2012, the WestConnex project has undergone several amendments. This section examines the history of the project and its current status. The project s alignment with policy is also assessed. 3.2 Project history Original route (2012) The WestConnex motorway was first announced as part of Infrastructure NSW s State Infrastructure Strategy (SIS) in The motorway was designed to link the existing M4 and M5 motorways through the inner west of Sydney and Sydney Airport. The key opportunities and benefits envisaged as part of the project are detailed in Figure 11. The SIS in 2012 noted that WestConnex will be predominantly user funded, with limited Government financial support in the early years. FIGURE 11. WESTCONNEX ALIGNMENT 2012 Source: Infrastructure NSW, 2012 However, the SIS highlights that existing assets should be maximised before investing in new projects: NSW should also maximise the use of existing assets wherever possible before investing in new projects because it is both cost effective and it is capable of delivering quick improvements for 16

23 the community that are sacrificed when there is too great a focus on big projects with long lead times. 9 Infrastructure NSW promoted WestConnex as being a catalyst for the renewal and transformation of areas through which it passes. The SIS highlights that WestConnex is intended to be more than a motorway. It is a scheme designed to act as a catalyst to renew and transform the parts of Sydney through which it passes. WestConnex is intended to develop as an integrated land use and transport scheme delivering on road transport, urban renewal and public transport outcomes 10. WestConnex was also promoted as supporting freight and people movements to Sydney Airport, relieving congestion and facilitating improvements in public transport. The strategic justification of the projects in the SIS included: relieving congestion on the existing M4/Parramatta Road and M5 East supporting freight movements between Sydney s Gateways and the logistics hubs in Western and South Western Sydney supporting people movements to Sydney Airport acting as a catalyst for urban regeneration along key corridors, particularly Parramatta Road enhancing orbital road connectivity South and West of the CBD facilitating improvements in public transport, particularly on the Parramatta Road corridor. A number of connections to existing nodes and major roads were proposed as part of the original design including a connection to the Airport. The core elements of WestConnex and key connections are highlighted in Figure 12. FIGURE 12. CORE E LEME NTS AND CONNECTIONS Source: Infrastructure NSW; Transport for NSW; Transport Roads & Maritime Services 2012 WestConnex Sydney s next motorway priority. A cost benefit analysis was conducted and a strategic benefit-cost ratio for the WestConnex project was assessed at more than 1.5. According to Infrastructure NSW, this was a traffic benefit-cost ratio that excludes consideration of wider benefits such as urban regeneration. This is a high return for a major 9 Infrastructure NSW 2012, State Infrastructure Strategy, p Infrastructure NSW 2012, State Infrastructure Strategy 17

24 transport investment in an inner urban environment. It reflects the high levels of existing utilisation of these roads and the expected significant journey time savings that WestConnex would offer. In October 2012, the state Government announced it would proceed with Infrastructure NSW s recommendation and develop a business case for WestConnex. Updated WestConnex Route (2013) Figure 13 details the design of the motorway which was adopted in 2013 as part of the business case and further studies. The design contains limited detail on connections and links, particularly to Sydney Airport, when compared to previous illustrations of the motorway. Three stages were introduced with stage 1 M4 East to start first, M5 East to follow and stage 3 M4-M5 link to be completed last. FIGURE 13. WESTCONNEX ROUTE 2013 Source: WestConnex Delivery Authority, 2013 In July 2013, the WestConnex final business case was completed and the cost of the project was estimated at $11.5 billion (2012 dollars). The expected benefits of building WestConnex as identified in the business case include: reduced travel times between Parramatta and Sydney Airport by up to 40 minutes, bypassing up to 52 sets of traffic lights halved bus travel times between the Inner West and the city and improving north-south travel times for public buses accessing the Western Rail Line at Burwood and other stations creation of around 10,000 jobs during construction 3,000 trucks a day removed from Parramatta Road and put underground, creating an opportunity for neighbourhood revitalisation provide the environment for 25,000 new jobs and 25,000 residences to be created over the next 20 years along Parramatta Road delivery of more than $20 billion (nominal) in economic benefits to New South Wales. 18

25 The WestConnex Delivery Authority (WDA) was set up to run and manage the project in October WDA comprises a number of board members who are responsible for reporting to the Minister for Roads and freight. Updated WestConnex Route (2014) In June 2014, the NSW Government announced that WDA would prepare a business case for two extensions to WestConnex. Northern and southern extensions have been proposed (refer to Figure 14) with the WDA to assess the feasibility and affordability of this change to scope. These extensions were both identified within Transport for NSW s 2012 Long Term Transport Master Plan as corridors for investigation and a connection to the F6. The northern extension will link the former Rozelle Goods Yards to Victoria Road to the north and Anzac Bridge and Western Distributor to the East. The southern extension will connect the new M5 East to President Avenue in Rockdale. According to the INSW 2014 Update, these extensions are aimed to offer a western bypass of Sydney s CBD to alleviate existing pressure on the existing north-south corridor of Sydney s orbital network and also to reduce journey times from the south. The preliminary business case shows strong incremental traffic forecasts for these connections, suggesting toll revenues could significantly reduce the need for Government contributions towards the cost of delivery 11. FIGURE 14. PROPOSE D WESTCONNEX EXTENSIONS Source: WestConnex Delivery Authority, Infrastructure NSW 2014, State Infrastructure Strategy Update

26 Subsequently, Stage 3 of WestConnex was rerouted towards the northern extension and away from Parramatta Road. The updated alignment from December 2014 is shown in Figure 15, with Stage 3 illustrated in dark blue as the M4-M5 link. The realignment has resulted in Parramatta Road no longer being duplicated from Haberfield to Petersham and has introduced a connection onto Parramatta Road at Camperdown. FIGURE 15. WESTCONNEX ALIGNMENT (DECEMBER 2014) Source: WestConnex Delivery Authority, 2014 In December 2014, the acceleration of Stage 2 of WestConnex was also announced as a result of a loan agreement with the Australian Government. The New M5 is expected to be completed in 2019, alongside the M4 East (Stage 1). A major interchange will also be constructed on the Alexandria Landfill site at St Peters (refer to Figure 16). This will provide the opportunity to provide access to Sydney Airport, Port Botany as well as the local road network in the future. However, there is some uncertainty regarding when the Sydney Gateway will be constructed. 20
 when the final was released in late 2012.")
27 FIGURE 16. ST PE TERS INTE RCHANG E Source: WestConnex Delivery Authority, WestConnex Policy Alignment In terms of policy, WestConnex was incorporated into the Long Term Transport Master Plan (LTTMP) when the final was released in late The draft LTTMP which was released in 2011 contained no references to the WestConnex; however it did include an M4 East extension as a protected corridor. WestConnex was included in the final LTTMP (refer to Figure 17) when it was released in late 2012 following the release of SIS by INSW. 21

28 FIGURE 17. POTENTIAL CONNECTION S IN THE MOTORWAY NE TWORK Source: Transport for NSW, 2012 The LTTMP similarly highlights the benefits of the project as improved economic productivity through increasing capacity and connectivity for freight and urban amenity improvements. The major transport challenges for Sydney identified within the LTTMP include: keeping the city s most important transport corridors moving providing travel options that support and enhance the strength and success of the CBD. improving connections across an expanded Sydney CBD footprint building a fully integrated city-wide transport system sustaining growth in Greater Sydney providing better connections and services to Sydney s growth areas adopting a customer focus and adapting to the changing needs of customers. A plan for growing Sydney refers to WestConnex in relation to the revitalisation of the Parramatta Road Corridor and enhancing gateways to Sydney Airport and Port Botany. WestConnex is identified as a proposed motorway expansion within the most recent metropolitan strategy for Sydney (refer to Figure 18). WestConnex is expected to allow for significant improvements 22

29 to local amenity by reducing through-traffic on surface roads, and allowing for enhanced north-south local connectivity. The Government will investigate the feasibility of light rail along Parramatta Road for the length of the corridor 12. A plan for growing Sydney also identifies a number of priorities for transport gateways, including the Sydney Airport precinct and the Port Botany precinct. In relation to the Sydney Airport precinct, a priority is to facilitate road planning to connect Sydney Airport to WestConnex. A priority for the Port Botany precinct is similarly to investigate a corridor for and enhanced road link from Port Botany to WestConnex. FIGURE 18. A PLAN FOR GROWING SYDNEY Source: Department of Planning and Environment, Summary The WestConnex project has evolved over the past two years with changes to the design and alignment which have altered the focus of the project, particularly in relation to Parramatta Road. Two key benefits of the project include: acting as a catalyst for urban regeneration along key corridors, particularly Parramatta Road and facilitating improvements in public transport, particularly on the Parramatta Road corridor. With the realignment of Stage 3 away from Parramatta Road, this ability to achieve these benefits is questionable. However, A plan for growing Sydney and the Long Term Transport Plan (TfNSW) both support WestConnex. 12 Department of Planning and Infrastructure 2014, A plan for growing Sydney, p
30 4 STRATEGIC ASSESSMENT OF WESTCONNEX 4.1 Introduction The WestConnex project was predicated on a number of key assumptions regarding Sydney growth: Strong population growth in Western Sydney and strong employment growth in Eastern Sydney fuelling an even stronger growth in demand for travel between the two. Urban renewal along Parramatta Road to accommodate more housing and employment Strong growth in freight demand particularly through the gateways of Port Botany and Sydney Airport Strong growth within the Sydney Airport corridor including passenger growth at Sydney Airport and industrial growth associated with the Airport. The evidence underpinning these assumptions is examined in this section. In addition, the broader objective of generating economic growth is considered alongside cost benefit analysis results of the project. 4.2 Strong population growth in Western Sydney with employment growth in Sydney s East Historical patterns have shown Sydney s population growth occurring in the South West and North West of Sydney, (Figures 2 and 3) in contrast to employment growth mostly in the east (Table 1). Employment growth from to in the Central sub-region was 1.9% per annum, compared to 0.7% to 0.9% in the Western Sub-Regions collectively. However, strong population growth is also evident in the inner urban core of Sydney through to Parramatta. This evidence is not considered in the justification for WestConnex, nor is the potential influence of the project on re-distributing population growth in Sydney. Origin-destination evidence The need to support Western Sydney s population growth in relation to employment growth in the east, the following examines origin-destination data. Table 3 shows a summary of the Journey to Work (JTW) patterns to the Sydney CBD, the Global Economic Corridor (GEC) and Eastern Sydney by origin Statistical Area 3 for Western and South Western Sydney (defined in Appendix 2). Journey to Work rates are shown for the whole of Western and South Western Sydney as well as the Sydney Region. Columns B1 to B3 break this data down further to show the percentage of the journeys that are made by public transport. 24
31 TABLE JTW DATA FOR WE STCONNEX CATCHMENTS SA3 Name A1 A2 A3 B1 B2 B3 % JTW to Sydney CBD % JTW to GEC % JTW to Eastern Sydney % PT to Sydney CBD % PT to GEC % PT to Eastern Sydney Blacktown 7% 14% 14% 91% 70% 73% Mount Druitt 5% 11% 11% 92% 73% 73% Penrith 4% 7% 8% 90% 73% 74% St Marys 4% 8% 9% 85% 68% 66% Auburn 12% 23% 27% 89% 73% 70% Merrylands - Guildford 8% 15% 16% 87% 69% 65% Parramatta 11% 22% 21% 91% 71% 75% Fairfield 6% 11% 13% 86% 67% 62% Western Sydney Total 7% 14% 15% 89% 71% 70% Bankstown 10% 18% 23% 86% 64% 55% Camden 4% 8% 9% 84% 60% 54% Campbelltown (NSW) 7% 13% 15% 93% 78% 71% Bringelly - Green Valley 5% 9% 11% 85% 59% 52% Liverpool 7% 14% 18% 88% 64% 55% South Western Sydney Total 7% 13% 17% 88% 67% 59% Sydney Region TOTAL 14% 28% 34% 74% 56% 49% Source: Analysis of Australian Bureau of Statistics Census 2011 Table 3 shows residents in Western and South Western Sydney are about half as likely to work in destinations in Eastern Sydney including the Sydney CBD and the Global Economic Corridor (GEC) compared to Sydney as a whole. In the Sydney region 14 percent of work trips are made to the Sydney CBD; 28 percent to the Global Economic Corridor (GEC) and 34 percent to Eastern Sydney. The corresponding figures for Western and South Western Sydney are about half of the figures for the Sydney Region and the proportion of work trips to the three key destinations declines with increasing distance from Eastern Sydney. For example, no more than four percent of work trips from Penrith, St Marys and Camden are to Sydney CBD. Of those travelling to work in the east, the use of public transport is much higher from Western and South Western Sydney than the Sydney Region. About 74 percent of work trips to Sydney CBD from the Sydney Region are made by public transport 13 with the corresponding figures for travel to the GEC and Eastern Sydney at 56 percent and 49 percent. Conversely 89 percent of work trips from Western and South Western Sydney to Sydney CBD are made by public transport. These results indicate that the majority of workers travelling to destinations in Eastern Sydney from the west and south west are currently using public transport. The role of WestConnex in improving accessibility to the CBD from the West would be very limited given only around 10 percent of workers travelling to the CBD from the west and south west use car. This information is presented graphically in the following maps. Journey to work to Sydney CBD Figure 19 shows the proportion of JTW trips from each travel zone to the Sydney CBD is lower for Western and South Western Sydney than for Eastern Sydney. This proportion is also lower than for North 13 motorised excludes walking and cycling 25

32 Western Sydney where there is a strong corridor of demand for travel to the CBD along the future North West Rail Link. Within both Western and South Western Sydney, the proportion of JTW trips to Eastern Sydney is highest close to rail lines, particularly the Western and East Hills Lines which provide relatively fast, frequent services to the CBD. FIGURE 19. PROPORTION OF JOURNE Y TO WORK TRIPS TO SYDNEY CBD Source: Analysis of Australian Bureau of Statistics Census 2011 Figure 20 shows the use of public transport for work travel to Sydney CBD is higher in Western and South Western Sydney than for travel to Eastern Sydney. This reflects the relative preference for rail over car in these catchments. There are few areas in Western and South Western Sydney with low levels of public transport use reflecting relatively good access to rail stations by walking, bus or car. Within North Western Sydney, there are areas with poor access to rail, such as near Castle Hill, where public transport use is low; this highlights the importance of rail infrastructure such as the North West Rail Link in servicing demand for work travel to Sydney CBD. 26
 The journey to work patterns to the GEC are")
33 FIGURE 20. PROPORTION OF PT TRI PS TO THE CBD Source: Analysis of Australian Bureau of Statistics Census 2011 Journey to work to Global Economic Corridor (GEC) The journey to work patterns to the GEC are similar to that of for the Sydney CBD. North Western Sydney has a particularly high proportion of travel to the GEC compared with Western and South Western Sydney, largely because it is connected by the M2 corridor. 27
34 FIGURE 21. PROPORTION OF JTW TR IPS TO GLOBAL ECONOM IC CORRIDOR Source: Analysis of Australian Bureau of Statistics Census 2011 Journey to work to Eastern Sydney Again, the journey to work patterns for Eastern Sydney, shown in Figure 21, are similar to those for the Sydney CBD and the GEC. There are concentrations of demand for travel to Eastern Sydney along all rail lines in Western Sydney highlighting the importance of rail services in meeting this demand. 28

35 FIGURE 22. PROPORTION OF JOURNE Y TO WORK TRIPS TO E ASTERN SUBURBS Source: Analysis of Australian Bureau of Statistics Census 2011 Journey to work from Eastern Sydney Figure 23 shows the destination for journey to work trips originating in Eastern Sydney. It shows people in Eastern Sydney also largely work in Eastern Sydney with relatively few trips to Western, North Western and South Western Sydney. 29

36 FIGURE 23. PROPORTION OF JTW TR IPS FROM EASTERN SUBURBS Source: Analysis of Australian Bureau of Statistics Census 2011 Employment type The following table provides a breakdown of the JTW trips in the two regional corridors into employment type using the industry code provided with Census data. For comparison purposes, the breakdown of all JTW trips to Eastern Sydney is provided. Table 4 shows workers from Western and South Western Sydney who work in Eastern Sydney are more likely to work in Manufacturing, Transport, Postal and Warehousing, Construction, and Public Administration and Safety than workers who travel to Eastern Sydney from the Greater Metropolitan Area. This indicates that workers from the West and South West are more likely to travel to Eastern Sydney to do lower skilled jobs than those from other parts of Greater Sydney. 30
37 TABLE 4. Industry 2011 JTW TRIPS BY IN DUSTRY 2011 JTW trips 2011 JTW trips % All GMA West Syd SW Syd All GMA West Syd SW Syd to East Syd to East Syd to East Syd to East Syd to East Syd to East Syd A Agriculture, Forestry and Fishing % 0.0% 0.0% B Mining 1, % 0.1% 0.1% C Manufacturing 24,847 2,620 2, % 4.7% 5.4% D Electricity, Gas, Water and Waste Services 4, % 0.7% 0.8% E Construction 24,007 2,579 1, % 4.6% 4.6% F Wholesale Trade 22,590 1,822 1, % 3.3% 3.7% G Retail Trade 44,605 3,457 2, % 6.2% 6.2% H Accommodation and Food Services 45,862 4,044 2, % 7.2% 5.3% I Transport, Postal and Warehousing 43,887 4,090 4, % 7.3% 12.7% J Information Media and Telecommunications 33,811 2,704 1, % 4.8% 4.0% K Financial and Insurance Services 92,917 9,285 5, % 16.6% 13.7% L Rental, Hiring and Real Estate Services 14, % 1.5% 1.5% M Professional, Scientific and Technical Services 106,913 7,536 4, % 13.4% 10.7% N Administrative and Support Services 28,547 2,692 1, % 4.8% 4.4% O Public Administration and Safety 46,553 4,184 3, % 7.5% 9.7% P Education and Training 43,525 2,065 1, % 3.7% 3.7% Q Health Care and Social Assistance 47,789 2,917 2, % 5.2% 5.4% R Arts and Recreation Services 15,590 1, % 2.2% 1.9% S Other Services 28,457 2,481 1, % 4.4% 4.7% T Inadequately described 7,614 1, % 1.9% 1.6% & Not stated % 0.0% 0.0% TOTAL 677,683 56,060 38, % 100% 100% Source: Analysis of Australian Bureau of Statistics Census 2011 Corridor growth Growth in the two WestConnex corridors (Western to Eastern and South Western to Eastern) will be driven to a large extent by growth in Western and South Western Sydney population and Eastern Sydney employment. 31
38 FIGURE REGIONAL GROWTH INDI CATORS Western Sydney population South Western Sydney population Eastern Sydney employment Western Sydney to Eastern Sydney JTW trips South Western Sydney to Eastern Sydney JTW trips Regional growth indicators Source: BTS The Journey to Work data highlights some key observations. Firstly, the employment growth in Eastern Sydney is fixed to the existing employment hubs located in that part of the city. Given the trends of the past 20 years, and our understanding of the next 20 years, it is most unlikely that this employment growth can be shifted elsewhere in Sydney. A second consideration is the development of the second airport. The second airport is likely to lead to dispersion of low skilled jobs from Eastern Sydney, particularly from the port and airport, to Badgerys Creek. The result may be a reduction in trips from Western and South Western Sydney to Eastern Sydney, as people are able to access these jobs more locally. 4.3 Urban renewal along Parramatta Road Parramatta Road is the key urban corridor linking the CBD, Parramatta and the rest of Sydney s West. It is also a link used for suburban, long commuter trips and business travel. Parramatta Road is currently impacted by heavy traffic congestion and which has impacted on amenity, pedestrian flows and occupancy of retail and commercial premises (see Table below). 32

39 TABLE 5. TRAFFIC ON PARRAMATTA ROAD Road Nearest cross street Suburb Volume M4 West Hill Road Homebush 143,000 Parramatta Road Telopea Avenue Homebush West 35,000 Parramatta Road Taylor Street Croydon 78,000 Parramatta Road Franklyn Street Concord 101,000 General Holmes Drive Foreshore Road Botany 143,000 M5 East King Georges Road Beverly Hills 110,000 Source: Roads and Maritime Services permanent count data, based on 2012 The draft Parramatta Road Urban Renewal Strategy identifies areas that will be the focus of growth and change along the corridor. The numbers of people living in these defined areas is expected to rise by 51,600 by 2031 to achieve a total of 69,700. The population increase in these areas is 3.2 percent of Sydney s overall expected population growth of 1.6 million to Urban renewal will transform Parramatta Road, bringing life to local communities and improve the commercial feasibility for residential, retail and commercial development. WestConnex proposes that urban renewal will be achieved by directing trucks and cars underground (to improve amenity) and improving above ground public transport (to improve connectivity) in the inner west. Investments of up to $200 million will be made to improve the built environment in the Parramatta Road corridor. Amending planning controls and Urban Growth working with the development sector will help encourage new investment in residential, retail and commercial developments along the corridor. FIGURE 25. DISCARDE D PLAN FOR PARRAMATTA ROAD Source: The State Infrastructure Strategy
40 4.4 The economic stimulus of WestConnex In the Commonwealth Budget the government resolved to take decisive action by building infrastructure that will drive economic growth, create jobs and improve productivity via a $11.6 billion 15 infrastructure funding program. The NSW component of this infrastructure spend was focused on: WestConnex the Western Sydney Infrastructure Plan, a ten-year road investment programme to meet future growth in the South West Growth Centre and for the development of an airport at Badgerys Creek the Pacific Highway upgrade NorthConnex the M1 Productivity Package for capacity improvements in four sections of the M1 Motorway. Currently the Sydney economy is performing very strongly. During Gross Domestic Product (GDP) growth in Sydney was 4.3 percent (the highest in since ) compared with the national rate of 2.5 percent. The unemployment rate in Sydney 16 is 5.1 percent 17 compared with 6.1 percent for the rest of the country. The New South Wales construction industry has the highest recorded level of employment (Figure 26). FIGURE 26. NEW SOUTH WALES CONSTRUCTION EMPLOYMENT (000 S) Source: Labour Force, Australia, Detailed - Electronic Delivery (Cat. No ) Given the current strength of Sydney s construction sector, it is questionable that a large scale public works in the form of WestConex is required to stimulate additional activity Regional New South Wales had an unemployment rate of 7.0 percent. 17 December
41 4.5 The cost, benefits and risks of WestConnex The September 2013 WestConnex Business Case Executive Summary outlined the Benefit Cost Ratio (BCR) and Net Present Value (NPV) 18 of WestConnex. No detailed material underpinning the BCR was provided. There is no information on project assumptions, traffic flows, the distribution of travel time savings or the benefits and costs associated with each section of WestConnex. This makes assessing the validity of the stated benefits challenging. This is in comparison with the published material on the NorthConnex project 19. NorthConnex has provided information on traffic flows and impacts on surrounding areas 20. The Business Case Executive Summary stated that 61 percent of the benefits (see Table 6) were from travel time savings. When compared to a toll road such as CityLink 21 appears to be the reasonable proportion 22. TABLE 6. WESTCONNEX BENEFIT COST ANALYSI S RESULTS Benefits Benefit Cost Outcomes Discounted ($m) Share Travel Time savings 15,410 61% Reliability benefits 2,603 10% Vehicle operating cost savings 3,099 12% Environmental & indirect benefits & residual value 931 4% Productivity Benefits 3,402 13% Total Benefits 25, % Costs Operating expenditure 9,402 87% Capital expenditure 1,465 13% Total Costs 10, % Net Present Value 2.55 Source: WestConnex However, the BCR appear to be based on the completion of the whole WestConnex project. This raises issues with the methodology used to assess travel time savings. Table 7 presents travel time savings for WestConnex from the State Infrastructure Strategy. The estimated travel time savings to the airport and port seem very odd as no traffic lights are avoided and the bulk of the trip is along the existing M5. Previous toll road projects have overestimated the travel time savings and drivers propensity to use the toll road to the point where the toll roads have been financial disasters. This includes the Lane Cove Tunnel 23, Cross City Tunnel and the Clem 7. These toll roads have had a number of similar characteristics: Brownfield projects which required tunnelling. The roads themselves are relevant short (in distance) and hence travel time savings were limited (or the aggregation of many small time savings). Did not significantly improve accessibility to key employment hubs. 18 The NPV is the sum of the present value (after accounting for the time value of money) of both costs and benefits CityLink 52 percent of project benefits were attributed to travel time services Economic impact of city link : Transurban project
42 TABLE 7. Between TRAVEL TIME SAVINGS WITH WESTCONNEX IN COMPARED TO TRAV EL VIA EXISTING ROUTES Existing route Estimated time saving using WestConnex (minutes) Traffic Signals Avoid Parramatta and Sydney Airport via City Rd, Regent St Parramatta and Sydney Airport via Sydenham Rd Eastern Creek and Port Botany via Sydenham Rd Flemington to Sydney Airport via KGR/M Revesby to Port Botany via General Holmes Dr 15 0 Liverpool to Sydney Airport via Marsh St 15 0 Source: The State Infrastructure Strategy In its current form, the various individual segments of WestConnex share these characteristics. This does raise concerns of optimism associated with the project benefits. The Department of Infrastructure and Transport published a research paper in 2012 Disincentivising overbidding for toll road concessions. The paper provides some insights into the issues around the transport modelling of toll roads. For example: The unpredictability of traffic projections generally and in particular the sizeably upwards biased seen in many toll road submissions Prior to entering into contracts for construction there has been a lack of rigorous and transparent project vetting process. The process should have had an emphasis on value-for-money assessment such that any public sector or political pressures are discouraged and neutralised. A key risk is that actual toll revenues differ to the forecasts. Broadly there are three elements of risk for new toll roads such as WestConnex: Base demand risk the risk associated with predicting the number of vehicles that will use the new road once traffic levels have reached a consistent level for a given toll Ramp-up period risk the risk associated with predicting how rapidly traffic volumes will grow from day one volumes to the base demand forecasts Long-term growth risk the risk associated with how general traffic volumes will grow in the medium to long-term. These risks change over time as traffic volumes on a toll road is proven. Further issues related to WestConnex include the project s impacts on the transport network and local community during the construction period. Geotechnical risk is also added as a significant tunnelling component is included in the project to accommodate the road within the urban fabric of the inner west. The project has a very high capital cost as a consequence of the issues outlined above which tend to have a multiplying effect on a range of project design and construction risks. It also introduces risks around debt market liquidity and construction market capacity (especially considering NorthConnex construction at the same time). The phased delivery of the full project creates technical, operational, and commercial interface risks in relation to the efficient delivery of the each stage and the full project. The tolling represents a significant point of difference to other major government infrastructure projects which are typically non-user pays as the demand risk is limited to government appropriately sizing the capacity of new infrastructure. NSW Auditor-General Review (2014) The NSW Auditor-General released a report in December 2014 into assurance processes associated with WestConnex, and highlights that the process undertaken to date is not considered satisfactory. 36
43 The focus of the audit was to determine whether WestConnex assurance processes are consistent with key principles underlying NSW Government major projects assurance frameworks and have been effectively implemented to provide sound, independent assurance to Government and project sponsors. The audit did not examine the merit of the project or whether it represented value-for-money. The report found that additional independent gateway reviews should have been conducted. Only one review was conducted which found that the preliminary business case was deficient and fell well short of the standard required for such a document. Four additional gateway reviews should have been conducted. A number of other conflicts of interest were raised in relation to governance arrangements and the board members of WDA. The final conclusion of the report was that There were a number of deficiencies in governance and independent assurance over the early stages of the WestConnex project. Going forward, these need to be rectified to ensure that WestConnex achieves the expected benefits at a reasonable cost 24. Further to this, the report notes that The preliminary business cases submitted raise deficiencies in business cases on which decisions have been made. 4.6 Summary of findings The evidence presented in this section suggests that the need to better connect Western Sydney population growth with Eastern Sydney employment growth with WestConnex is questionable, given: Residents in Western and South West Sydney are half as likely to work in the East compared to Sydney overall and this likelihood decreases with distance. Only four percent of workers in Penrith, St Marys and Camden travel to the CBD 90 percent of work trips to the CBD from the west are made by public transport, compared to 74 percent for Sydney overall those travelling to the CBD from the west are more likely to be employed in Manufacturing and Transport related industries. However, employment growth in the Central Sub-Region is focused on Professional and Financial Services. Given the announcement of Sydney s second airport at Badgery s Creek, the need for WestConnex to support growth in freight from Port Botany and Sydney Airport, along with passenger and industrial growth in the Sydney Airport corridor no longer exists. The building of a second Sydney Airport provides much greater flexibility in how demand for air passenger and freight travel is accommodated in the Sydney region. In particular, there is an opportunity for future airport-associated industries to be located in Western Sydney where land would be more available and better access to workforce. The success of a second Sydney Airport in accommodating growth would be dependent on the State Government investing in supporting public transport and road infrastructure. Overall growth in the Airport corridor is also based on expected growth associated in the Green Square renewal area. However, the ongoing conversion of light industrial to residential in the Green Square area lends itself well to increased use of public transport. The Airport rail line has a dual role of connecting south west Sydney to the GEC and serving demand within the Airport corridor including Sydney Airport. Under Sydney s Rail Future, including completion of Sydney Rapid Transit (SRT), there is an opportunity 24 Auditor General 2014, WestConnex: Assurance to the Government, New South Wales Auditor-General s Report Performance Audit- 37
44 to better tailor rail services on the line to serve demand within the corridor itself and reduce traffic growth. The Auditor-General s report in relation to the assurance processes associated with WestConnex puts into question the adequacy of the project in terms of governance and independent assurance. The report raises significant concerns about the business case process to date, and the lack of detail surrounding assumptions makes it difficult to assess project merits on a stage by stage basis. 38
45 5 STRATEGIC ALTERNATIVES TO WESTCONNEX 5.1 Introduction There is no doubt that Sydney s transport network requires significant investments to deal with a population of 6.2 million people by If forecast distribution of population and employment growth in Sydney does occur, there are a number of strategic alternatives to WestConnex to accommodate this growth. Major transport infrastructure investments change accessibility patterns and influence the location choices of households and firms and provide urban renewal opportunities. Transport can incentivise dense urban forms, with such urban form increasing the productive capacity of an area and the city more broadly. Major transport investments are a powerful and, perhaps, the pre-eminent policy lever for determining metropolitan structure. Land use regulation via planning schemes and the like are more likely to play a supplementary role in managing urban development. This means that major transport projects need to be conceptualised within the context of a preferred urban structure, that is, creating the sort of city we want as opposed to following the more conventional predict and provide philosophy where transport investment simply responds to demonstrated demand. In some instances, it may make more economic sense to prioritise transport infrastructure that will reshape the city in permanently advantageous ways, over those projects that are solving evident congestion problems. Investment in rail infrastructure, such as the North West Rail Link, Second Harbour Crossing and the previously proposed West Metro, is best able to facilitate such an urban form. Stations act as nodes around which are located people, jobs and services (commonly referred to as Transit Oriented Development). However, investment in road infrastructure, coupled with land use policies that separate land uses, has led to urban development on the periphery of cities and dispersal of the population. This urban growth pattern has led to rising trip lengths, congestion and an urban form where the car is often the only convenient option for travel (UNESCAP 2013). Different transport modes have also differing abilities to move large numbers of people in and out of dense urban environments (Figure 27) across the world. In dense urban centres the car is not only an inefficient mode for moving people in terms of land and energy use, but also in terms of carrying capacity. Inefficient transportation modes cannot move the number of people required to feed vibrant job- and service- rich urban cores. They do however; provide a viable means of mobility when trip destinations and origins are dispersed, provided congestion is not excessive. 39


46 FIGURE 27. CARRYING CAPACITY BY MODE (PER HOUR ON 3. 5 METRE LANE) Source: United Nations ESCAP, Review of Developments in Transport in Asia and the Pacific Strategic alternatives West Metro West Metro was a new metro line proposed in the 2009 to connect the western suburbs of Sydney from Westmead to the Sydney CBD. The project was to provide fast, frequent public transport service that would address public transport bottlenecks and improve connectivity to key centres including the University of Sydney, Broadway, Leichhardt, Burwood, Sydney Olympic Park, the Parramatta CBD and the Westmead health and education precincts. See Table 8 for a summary of West Metro stations, distances from the CBD, travel times and project benefits. Importantly, the project would have enabled urban renewal in the opportunity areas of Parramatta East, Rosehill, Camellia and Silverwater. This project is considered by Infrastructure Australia to have merit. To date, $91 million has been invested by the Commonwealth for pre-construction, planning, design and engineering works National Building for the Future, May 2009, Commonwealth of Australia. 40
47 TABLE 8. WEST ME TRO AT A GLAN CE From Central Station Distance (km) Travel time (mins) Westmead Direct link to the North West Transitway. Opens up access to the Westmead health and education precincts. Parramatta Direct link to major bus services, including Liverpool Transitway. Fast, convenient connections for Parramatta commuters. Easy access to retail, employment, health and education centres. Camellia Potential park and ride location. Improved transport access to University of Western Sydney Rydalmere campus, adjoining industrial estates and Rosehill. Silverwater Improves access to residential, industrial and employment areas. Sydney Olympic Park Boosts access to Sydney Olympic Park s employment, entertainment, recreational and residential centres. Strathfield Convenient link to Strathfield CityRail station gives commuters from other areas a quick link to Leichhardt, hospitals and Sydney University. Burwood Supports planned employment growth in the Burwood town centre, improves access to shopping, restaurants and cross-regional buses. Five Dock Provides a potential transport hub for Five Dock. With easy interchange between cross-regional bus services and metro. This transport hub would relieve bus congestion locally, along Parramatta Road and into the CBD. Leichhardt Direct, frequent travel between Leichhardt, University of Sydney and the CBD potential to reduce Parramatta Road and CBD bus congestion. Camperdown Improved access to major health facilities in the Camperdown area. Broadway-University of Sydney Improved access to University of Sydney, Broadway and surrounding residential areas including Glebe, Darlington and Chippendale. Central Source: adapted from Information Summary West Metro, NSW Government. Road Pricing An alternative to alleviating road congestion by building new road infrastructure to increase capacity is to use pricing mechanisms. Reviewing or introducing pricing mechanisms was included as part of the NSW Long Term Transport Master Plan (2012) (the Master Plan). The Master Plan proposed more efficient road user charges with pricing and revenue reforms that: Better reflect the cost of providing well maintained roads The level of road use Safety and environmental performance of vehicles. As in the Master Plan, pricing mechanisms can have different primary policy objectives including to help pay construction costs, or to help pay for public transport or address environmental objectives. Pricing mechanisms, however, can also be used to manage congestion. Congestion pricing uses tolls to alter demand and has been shown to substantially affect behaviour and reduce traffic congestion (Small & Gomez-Ibanez 1997). 41

48 Time of day tolling is an example of congestion pricing. Road demand changes through the day with weekdays usually characterised by low traffic levels rising to the AM Peak before easing during the middle of the day and then increasing again for the PM Peak (Murray 2012). When a road is tolled, there is a notional toll at which the road will no longer be congested. By varying the toll during the day to match the level of congestion it is possible to maintain a free flowing road across the day, for example, Sydney Harbour Bridge 26. In Western Sydney, rather than increasing road capacity by building new road infrastructure, congestion on the existing road network may be better managed through a new or updated price mechanism. The Bureau of Transport Statistics has produced research from Household Travel Survey previously that shows there are still a number of discretionary trips made in peak periods that could be shifted to other time periods. Wider Public Transport Investments There is always a strong argument for parallel investment in road and PT infrastructure but the scale of WestConnex raises the question of the investment spent across the two. The Sydney Rapid Transit project, as outlined in Sydney s Rail Future is of a similar scale of WestConnex. FIGURE 28. SYDNEY S RAIL NE TWOR K Source: Transport for NSW, 2012 While SRT does not directly increase capacity on the Western rail line, it does take some demand away from that line and hence reduce crowding on it. SRT increases capacity through to the CBD which is a major limitation on the network. Addressing bottlenecks to the CBD enables improvements on Western 26 There are two forms of time or day tolling: cordon pricing (where a charge is levied to enter a city region such as the CBD, port or airport) or corridor pricing where there is a charge to use a road or corridor (Murray 2012). 42
49 lines and increases reliability. There are other strategic PT alternatives that would help meet the demand for travel between Western and Eastern Sydney and take the pressure of existing road infrastructure. These include a West Metro (Parramatta to CBD) and a North-South metro which when combined with SRT would be a transformational metro-style network. The SRT network will include a the North West Rail Link, conversion of the existing Epping to Chatswood line, a second Sydney Harbour rail crossing, new CBD line and stations which will then connect to Bankstown via Sydenham and potentially further west towards Liverpool (refer to Figure ). Moorebank Intermodal Terminal 28 Sydney is the largest consumer market in Australia, and has the nation s second largest container freight port. Container trade through Port Botany is forecast to grow at around 4 percent a year to This growth is the consequence of a growing population, changing consumer demands and the increasing needs of business and industry. Most of the containerised freight moving between Port Botany and other parts of Sydney does so by road. It is estimated that only 14 percent of container freight at Port Botany is currently transported by rail. However, Sydney s freight handling capacity is increasingly constrained by a heavily congested road network. To cope with and enable future growth, more freight needs to move to and from Port Botany by rail. If the current rail mode share is not improved, truck traffic at Port Botany could have to increase by up to four times by 2030 to cope with demand. The Moorebank Intermodal Terminal will enable more containerised freight to move by rail. It will provide large-scale freight capacity within the Sydney basin directly linked by rail to Port Botany, bypassing Sydney s constrained roads. When the terminal is fully operational in about 2030 it will reduce the projected growth in road freight traffic from Port Botany, resulting in up to 3,000 fewer truck journeys to and from Port Botany each day. There could also be potential for other smaller intermodal terminals to be developed in other parts of Sydney. This will reduce demand for freight traffic on WestConnex, so long as an increased proportion of freight moving to and from Port Botany is via rail. Other considerations The WestConnex project effectively locks Sydney into a series of large scale road projects. Completion of WestConnex, and the resulting increase in traffic, will put pressure on other parts of the road network requiring extensions to the north and south as is already envisaged. An alternative approach is to address particular bottlenecks that would improve the efficiency of the existing motorway network without building whole new motorways. This would then allow a higher investment in transit corridors which are better able to shape the city. 27 This network potentially addresses some of the gaps within the existing public transport network which WestConnex will never address?
50 6 CONCLUDING REMARKS Sydney is an economic powerhouse of the nation and a gateway to the global economy. Sydney s current population of 5 million is anticipated to grow to approximately 6.2 million people by This presents a significant planning challenge in ensuring that Sydney grows in such a way as to improve the city s economic, environmental and social performance. There is complex interplay between land use and transport planning and urban development. Individual transport projects can have far reaching and, often unintended, consequences on both the broader transport network and on the urban structure of the city. It can be argued that many of the transport and land use challenges Sydney faces today are the consequence of ad hoc, uncoordinated or narrowly considered approaches to planning in the past, and have generally been in response to a particular issue. While freeway building in the 50s, 60s and 70s helped the city expand and become more productive, more recent road building has failed to improved accessibility as much as expected. This is due to the changing economic geography of the city with jobs increasingly clustering at sites with good access to the mass transit network. The upwards trend in heavy rail patronage over the past thirty years has coincided with a slowing in the growth of total kilometres travelled by car. Sydney s strategic planning documents have recognised this changed pattern and are attempting to shape the city to function more productively. They are aiming to do this by prompting greater densities at key locations and along mass transit corridors. In this context the construction of a major set of toll roads seems not to fully align with the needs of Sydney during 21 st Century. WestConnex, which is effectively comprised of a number of different projects, lacks detail in terms of the objective of specific projects and whether these would be met. The Auditor General s report into WestConnex raises serious concern around the business case process to date. Notwithstanding the concerns around business case process, the ability for WestConnex to respond to Sydney s challenges is tenuous. Importantly: The announcement of Sydney s second airport throws the justification of WestConnex into doubt. A second airport at Badgery s Creek will shift existing employment and freight patterns, reducing pressure to and from Sydney Airport. The proportion of workers in Sydney s west travelling to jobs in the east is low, and of these, most are made by public transport. Residents in Western Sydney are half as likely to work in the east compared to the rest of Sydney. Of those who do travel to work in the east, 90 percent of these trips are made by public transport. Economic restructuring of Sydney will continue to reduce manufacturing and transport related jobs in Sydney s east. The majority of employment growth has occurred in the Central Sub-Region but within the Professional and Financial Services industry. Most CBD workers from the west work in manufacturing and transport related industries, which have shown a marked decline in recent years. The need for economic stimulus through the WestConnex is questionable. Sydney s GDP growth in was 4.3 percent, the highest since and higher than Australia overall. Unemployment in Sydney is currently at 5.1 percent, compared to 6.1 percent nationally. Contributing to this is the highest level of employment ever recorded in the construction industry. 44
51 These factors suggest that WestConnex is not a holistic solution to Sydney s growth challenges, and it fails to respond to key employment and transport trends. The announcement of the second airport itself is sufficient to warrant a review into the merits of WestConnex. With the lack of information available around each project of WestConnex, an assessment of particular components cannot be undertaken. Such an assessment may find some parts of the project to have strategic merit against the context established in this report. The employment and transport context presented in this report however, does strongly point to a need to public transport investment or other alternatives to support Sydney s growth. Projects such as West Metro, which was considered by Infrastructure Australia to have merit, has already had $91 million invested into it by the Commonwealth. The Moorebank Intermodal Terminal will increase rail freight, reducing road-based freight movements. The Sydney Rapid Transit project will lead to increased capacity on the rail network, improving reliability and scope to increase rail capacity. Viable alternative projects need to be assessed and compared to WestConnex against forecast population and employment trends and confirmed major infrastructure investments. Investing in WestConnex at this time effectively locks Sydney into a series of high cost large scale road projects and may reduce the ability for Government to make other investments into Sydney s future. 45

52 APPENDIX 1. TOLL ROAD CASE STUDIES CityLink Initial project drivers and anticipated impacts As early as 1929, a proposal for a southern bypass to the CBD was put forward; however, it was the transport planning of the 1950s and 60s where the concept of a southern and western city bypass (later to become CityLink) gained more ground. The 1969 Melbourne Transportation plan advocated for reservations and set aside sinking funds for the new inner-city freeway system. FIGURE 29. EARLY CITY RING ROAD AND CBD ACCESS ROUTES (1954) Source: Melbourne Metropolitan Planning Scheme 1954: City Ring Road and CBD access routes, p.198 With the completion of many of the planned freeways of the 1950s and 60s, by the late 1980s Melbourne was served by several freeways that terminated in its inner suburbs, generally five kilometres from the centre. Once traffic left these freeways, it was distributed onto local and arterial roads, resulting in gridlock and some roads of the city, notably King, Spencer and Swanston Streets performing major through road arterial roles. Some residential and urban streets were handling volumes up to 80 percent greater than their planned capacity (Russell, 2000). While a degree of this traffic was bound for the CBD, many of the trips were cross town, largely servicing the regions beyond the central city, but forced through the CBD as there was no bypass available. During the 1980s Melbourne City Council advocated for a western bypass for the City, but in the 1990s first under the Labor Government, and then under the Liberal Kennett Government, the concept of a city bypass was taken further, and the project was conceptualised as an east-west connector (Institute of Engineers Australia, 2002). 46

53 Interviews highlighted that while the inner core of Melbourne is dependent on mass public transport, the next ring of the city, and particularly the city s air and sea ports, rely on major road access. This interaction of the inner core with its surrounds allows for a high value services economy to be supported by the adjacent freight and logistics industry. However, prior to the development of CityLink, access and utilisation of the Port of Melbourne and between Melbourne s individual freeways was poor. The proposal to build CityLink was first announced in May 1992 and received formal State Government approval in mid An Environmental Effects Statement was carried out in 1994 for CityLink, with the objectives of the link stated as reducing through traffic on inner city streets; improving environmental outcomes; optimising economic benefits while minimising financial costs; and improving access between industry and the port, rail and airport facilities (VicRoads, 1994). In 1995 the Melbourne CityLink Authority was established to assist development, evaluate submissions, negotiate with contractors, recommend a contractor, facilitate relations between agencies, and ensure the project was delivered according to the Act (VicRoads, 2008). During the early 1990s the Victorian economy was in a state of despair, and CityLink was seen as an opportunity to stimulate the economy both through the creation of construction jobs and the more efficient movement of people and freight. A major challenge of the project was in the development of automated tolling that allowed vehicles to maintain freeway speed. This had not been developed anywhere in the world prior to CityLink. The total value of the project was estimated at $1.5 billion in 1993 prices (Muhammad and Low, 2006). CityLink was built between 1996 and 2000, with stages opened throughout 1999 and The full link was operational from December FIGURE 30. CITYLINK WESTE RN AND SOUTHERN COMPONENTS Source: Transurban, Originally proposed as a city bypass route, the final design included the Exhibition Street extension that provided CBD access, via Batman Avenue to the Monash Freeway and CityLink. This link provided access over the rail yards east of Flinders Street station and allowed the Route 70 tram to be rerouted to dedicated tracks between the sporting precincts. Interviewees indicated that the City of Melbourne was a primary supporter of this extension, partly because it enabled traffic to enter and exit the city without the use of Swanston Street or local roads in Southbank. There was no mention of implicit land use changes as a result of this project; however, it is likely that it spurred on a greater density of development within its immediate vicinity and off-ramps. 47
54 Funding and management CityLink was funded through a Public-Private Partnership (PPP), the first of its kind in Australia, with the contract awarded in 1995 to Transurban. As part of the development of CityLink, existing roads were upgraded and expanded, and tolling points were added. Toll charges were applied to new sections of road, as well as to the Monash and Tullamarine Freeways, which had previously not been tolled. One interviewee observed that the pricing structure put in place by toll roads encouraged better accessibility for higher value activities. Operation of the road was leased on a 34 year concession, with the lease expiring 14 June 2034, after which it will be transferred to the State (Infrastructure Partnerships Australia, 2006). The contract between the State Government and Transurban offers protections for both parties. Protections include the ability for Transurban to make a claim against the State Government should the government do anything that could reduce vehicle numbers on CityLink. Although unsuccessful, Transurban commenced legal proceedings in 2001 against the State of Victoria over the construction of Wurundjeri Way. It was claimed that this free road decreased the revenue of CityLink. A similar case could be argued if the State Government was to build or increase the capacity of road or rail routes that parallel CityLink. The PPP agreement developed for CityLink had not been conducted in the past and the business case was largely unknown. The PPP model developed during the negotiations of CityLink, known as BOOT (Build, Own, Operate and Transfer) was subsequently adopted throughout Australia. Cross City Tunnel Initial project drivers and anticipated impacts The Cross City Tunnel and Lane Cove Tunnel were developed in parallel, with strategic route development commencing in the late 1980s. These two projects and the M7 Motorway completed the Sydney Orbital and provided an east-west bypass of Sydney s CBD. All three projects utilised the same development and approval processes. In particular, they were all assessed under Division 4, Part 5 of the EP&A Act and delivered under a Build, Own, Operate and Transfer contract. (RTA 2010) Over the years there have been numerous proposals for east west road tunnels under the Sydney CBD to relieve traffic congestion in the city, utilising a wide variety of alignments, including routes under Market and Park Streets. The basic concepts behind the project were developed by the RTA from the mid-1990s, and were first publicly aired in a 16 page public consultation report, The Cross City Tunnel: Improving the Heart of the City, released by the then Premier, Mr Bob Carr, and the then Minister for Roads, Mr Carl Scully, on 22 October These concepts were also displayed at a public exhibition and on the RTA s website. (RTA 2010) The preliminary concepts developed by the RTA at this stage involved much shorter two-lane tunnels than the final design, both of them passing under Druitt and Park Streets. The Cross City Tunnel motorway links the Western Distributor to New South Head Road and also connects to the Eastern Distributor. It takes traffic directly from the eastern suburbs to the northern parts of the Central Business District (CBD) and then the northern suburbs via the bridge and harbour tunnel crossings. The tunnel was designed to improve travel times for commuters by allowing traffic to travel below the city. The Cross City Tunnel project was intended to improve road safety and amenity in Sydney by removing traffic from the city centre and connecting major roads west and north of the city. The Cross City Tunnel is currently operated by Transurban CCT Pty Ltd. 48
55 Construction work for the cross city tunnel commenced in January 2003, and the tunnel opened in August The tunnel is a toll road except for a three-week toll-free period shortly after its opening which was extended for a further two and a half weeks, until the end of November, Funding and management The Cross City Motorway Pty Ltd was contracted to build and operate the Cross City Tunnel. This was a privately owned, special purpose company created solely for the Cross City Tunnel project. Cross City Motorway Pty Ltd engaged the Baulderstone Hornibrook/Bilfinger Berger (BHBB) Joint Venture to design and construct the project. The $680M tunnel was originally financed by a combination of international equity and locally and internationally sourced debt. Equity of $220M was provided by three international companies, Cheung Kong Infrastructure (50 percent), DB Capital Partners (30 percent) and Bilfinger Berger BOT (20 percent). The remaining $580 million was financed through a syndicate of Australian and international banks led by Westpac and Deutsche Bank. The tunnel is scheduled to revert to public ownership in In November 2006, it was reported that the motorway was in financial difficulties, and that additional equity would be required from the tunnel's investors in order to avoid placing the tunnel in administration. At the same time, it was suggested by a banking analyst with JP Morgan that traffic volumes of between 60,000 and 90,000 per day were needed in order for the consortium to meet the tunnel interest payments. The NSW government responded to the reports by indicating that it would not buy out the tunnel, nor assist in its financing. December 2006 the tollway became insolvent due to low traffic volumes, accumulating debts of over $500 million. On 20 June 2007, Leighton Contractors and investment bank ABN AMRO were chosen as preferred purchasers of the Cross City Tunnel Group for $700 million. In September 2013 the new owner of the tunnel placed itself in voluntary administration, saying that it was unable to refinance its debt due to action by the New South Wales government to claim $64 million in stamp duty on the original sale. Transurban purchased the tunnel from the managers and receivers in June 2014 for approximately $475 million. Lane Cove Tunnel Initial project drivers and anticipated impacts The Lane Cove Tunnel is 3.6 km, dual tunnel generally running below the alignment of Epping and Longueville Roads and connecting the M2 Motorway at North Ryde with the Gore Hill Freeway at Artarmon. It is owned by toll road operator Transurban and forms part of the M2 and the 110km Sydney Orbital Network. The tunnel was opened in 2007 and acquired by Transurban in May Transurban is contracted to operate the road until The Lane Cove Tunnel and Cross City Tunnel were developed in parallel, with strategic route development commencing in the late 1980s. These two projects and the M7 Motorway completed the Sydney Orbital and provided an east-west bypass of Sydney s CBD. (RTA 2010) The idea of building a Lane Cove Tunnel was first raised in the early 1990s when the Gore Hill Freeway opened. Several feasibility studies and rounds of public consultations followed, including a February 1997 invitation to the community to comment on options for improving Epping Road identified in studies commissioned by the RTA, which had suggested a tunnel under Epping Road between the Pacific Highway and a point just west of Centennial Avenue. Community feedback was strongly in favour of a 49
56 longer tunnel. Later in 1997 an M2 Epping Road Task Force, comprising the mayors of Lane Cove, Willoughby, North Sydney and Ryde and the Parliamentary Secretary for Roads, was formed to lead community discussions on the options. Six tunnel route options, involving both long and short tunnels under Mowbray Road West or Epping Road, were placed on public display in 1998, and community feedback on these options was obtained through discussions with the task force, public meetings and a questionnaire. On 17 December 1999 the NSW Government invited public comments on a Lane Cove Tunnel Overview Report which summarised the findings of these initial investigations and identified a preferred tunnel option with twin two-lane tunnels, generally under Epping Road and broadly based on one of the six options identified in This Overview Report also proposed the widening of the Gore Hill Freeway to six lanes, the construction of north-facing ramps to and from the Warringah Freeway at Falcon Street in North Sydney and the funding of the project by tolls. (RTA 2010) Funding and management Connector Motorways owned and managed the Lane Cove Tunnel from 2006 to Connector Motorways awarded a $1.1 billion contract to design and construct the tunnel to a joint venture between Thiess and the John Holland Group. The tunnel was built to replace the few kilometres motorists had to drive along Epping Road, through the suburb of Lane Cove, between two sections of freeway. Connector Motorways was supposed to operate the tunnel concession until However, the project went into receivership in January 2010 due to revenue losses. International toll road operator Transurban bought the tunnel in May 2010 for $630 million and became the new operator. Transurban is contracted to operate the road until Clem Jones Tunnel Initial project drivers and anticipated impacts The Clem Jones Tunnel, known as Clem7 is a 6.8km toll tunnel that connects Brisbane s inner north to the southern and eastern suburbs, bypassing the city centre. The tunnel was originally proposed by Labor Lord Mayor Jim Soorley in 2001, and was incorporated into the Liberal Party candidate Campbell Newman's five tunnel vision, called TransApex, in The tunnel is named after Brisbane s longest serving Lord Mayor Clem Jones. The Clem7 connects to the AirportLinkM7 tunnel as well as five other major Brisbane traffic routes. The Clem 7 was opened to traffic in March The Clem Jones Tunnel, known as the North South Bypass Tunnel during construction, is one of Brisbane s largest road infrastructure projects aimed at addressing the existing and future transport needs of Brisbane. The project provides a direct north-south link without travelling through the CBD or Fortitude Valley. The project forms the first plank in Brisbane City Council s TransApex Plan to reduce congestion across the city. The project is 6.8km in length from end to end and includes two 4.8km tunnels linking the Southeast Freeway and Ipswich Road in Woolloongabba; the Inner City Bypass and Lutwyche Road in Bowen Hills and Shafston Avenue in Kangaroo Point. Funding and management The Clem Jones Tunnel was built at a cost of 3.2 billion and is a motorway grade toll road under the Brisbane River. It is Brisbane s first privately financed inner city toll road, the city's largest road 50
57 infrastructure project and one of Queensland's largest infrastructure projects. The road was funded through a Public Private Partnership. Construction bids were provided by a tender process in which RiverCity Motorway was selected over the Brisconnections consortium. The project commenced in September Contracts for design and construction were given to Leighton Contractors and Baulderstone/Bilfinger Berger Joint Venture. Lower than expected revenue from tolls forced RiverCity Motorway into receivership. In December 2013, Queensland Motorways, operator of the Gateway and Logan motorways, took over tolling and operation. In July 2014, Queensland Motorways was acquired by a consortium led by toll road operator Transurban, which now manages and operates the tunnel. Transurban is contracted to operate the road until
58 APPENDIX 2. DATA ANALYSIS Geographies The WestConnex corridor provides a regional connection between Western and Eastern Sydney via the M4, and South Western and Eastern Sydney via the M5. Work travel data has been analysed based on these areas as defined below by Statistical Area 3. Western Sydney SA3s: Blacktown Mount Druitt Penrith St Marys Auburn Merrylands - Guildford Parramatta Fairfield South Western Sydney SA3s: Bankstown Camden Campbelltown (NSW) Bringelly - Green Valley Liverpool Eastern Sydney stretches from North Sydney and Mosman in the north down to Botany in the south; Marrickville - Sydenham - Petersham in the west and the Pacific Ocean to the east. It is defined as the following Statistical Areas 3 (SA3): Botany Marrickville - Sydenham - Petersham Sydney Inner City Eastern Suburbs - North Eastern Suburbs - South Leichhardt North Sydney Mosman Figures are also reported for the Sydney Region which is the Sydney Greater Metropolitan Area (GMA) excluding Central Coast, Lake Macquarie, Hunter, Illawarra, South Coast and Southern Highlands. Reference is also made to Sydney CBD and the Global Economic Corridor: Sydney CBD includes all travel zones in the area roughly bounded by Darling Harbour, Sydney Harbour, Domain, College St, Riley St, Devonshire St and Harris Street. It includes Haymarket, The Rocks and western part of Surry Hills. The Global Economic Corridor includes travel zones in the following strategic centres stretching from Macquarie Park to Port Botany (it does not include travel zones outside these centres): City East - Central Sydney Education and Health Precinct - Central Sydney North Sydney Redfern-Central Sydney Sydney CBD Ultimo-Pyrmont-Central Sydney 52
59 Macquarie Park Business Park Port Botany and Environs Randwick Education and Health St Leonards Office Cluster Sydney Airport and Environs Chatswood. 53


60 WESTERN SYDNEY SOUTH WESTERN SYDNEY 54

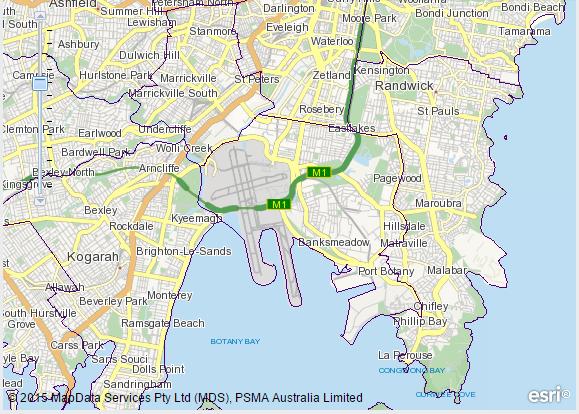
61 EASTERN SYDNEY 55
.")
62 2011 JTW Analysis and Sub-Regional Map The 2011 Journey to Work (JTW) data set, developed by ABS and BTS, incorporates information on origin, destination and mode of travel for work trips made on Census Day Origin and destination is coded as 2011 travel zones across the full Sydney Greater Metropolitan Area (GMA). No data is available from the Census on the time of travel but Household Travel Survey (HTS) data indicates that about 74 % of travel to work is made in the three hour morning peak period (arriving at work between 0630 and 0930). Mode of travel for JTW trips are reported at the highest level by 10 modes as follows: Code Description 1 Train 2 Ferry/Tram 3 Bus 4 Vehicle driver 5 Vehicle passenger 6 Other mode 7 Walked only 8 Mode not stated 9 Worked at Home 10 Did not go to Work FIGURE 31. ME TROPOLITAN SUB -REGION S Source: Department of Planning and Environment,
63 REFERENCES Bureau of Infrastructure, Transport and Regional Economics (BITRE), 2012, Traffic Growth in Australia, Report 127, Canberra ACT. (Muhammad and Low (2006) Melbourne City Link Background Report GAMUT Australasian Centre for the Governance and Management of Urban Transport The University of Melbourne RTA 2010, Post Implementation Review M7 Motorway, Cross city Tunnel and Lane Cove Tunnel, Motorway Projects Branch, Sydney NSW Roads_EY2008.pdf (Russell (2000).Audit Review of Government Contracts, Contracting, Privatisation, Probity and Disclosure in Victoria , An Independent Report to Government (Vol. 2 - Case Studies). Melbourne: State Government of Victoria. Swan, P. & Belzer, M. (2010) Empirical Evidence of Toll Road Traffic Diversion and Implications for Highway Infrastructure Privatization, Public Works Management Policy, 14(4), p Small, K. & Gomez-Ibanez (1997) Road Pricing for Congestion Management: the Transition from Theory to Policy, Chapter 16 in Transport Economics: Selected Readings, Oum, T., Dodgson, J., Hensher, D., Morrison, S., Nash, C., Small, K. & Waters II, W. (eds), Routledge: Oxford. Murray, P. (2012) Congestion pricing for roads: An overview of current best practice, and the economic and transport benefits for government, Public Infrastructure Bulletin, 1(8), Article 8. RTA (2010) Post Implementation Review M7 Motorway, Cross City Tunnel and Lane Cove Tunnel UNESCAP (2013) Review of Developments in Transport in Asia and the Pacific: Transport as a key to sustainable development and regional integration, United Nations Publications. ng_toll_road_concessions.pdf VicRoads (1994) VicRoads (2008) VicRoads. Error! Hyperlink reference not valid
439 941 934 sgstas@sgsep.com.au MELBOURNE Level 5, 171 La Trobe Street Melbourne VIC 3000 +61 3 8616 0331 sgsvic@sgsep.")
64 Contact us CANBERRA Level 6, 39 London Circuit Canberra ACT sgsact@sgsep.com.au HOBART Unit 2, 5 King Street Bellerive TAS (0) sgstas@sgsep.com.au MELBOURNE Level 5, 171 La Trobe Street Melbourne VIC sgsvic@sgsep.com.au SYDNEY Suite 12, 50 Reservoir Street Surry Hills NSW
5 Rail demand in Western Sydney
 5 Rail demand in Western Sydney About this chapter To better understand where new or enhanced rail services are needed, this chapter presents an overview of the existing and future demand on the rail network
FUTURE TRANSPORT STRATEGY AND GREATER SYDNEY SERVICES AND INFRASTRUCTURE PLAN. Western Parkland City
 FUTURE TRANSPORT STRATEGY AND GREATER SYDNEY SERVICES AND INFRASTRUCTURE PLAN Western Parkland City 2 Transport for NSW Future Transport Strategy and Greater Sydney Services and Infrastructure Plan Western
Kilometres. Blacktown. Penrith. Parramatta. Liverpool Bankstown. Campbelltown
 0 5 10 15 20 Kilometres Penrith Blacktown Parramatta Liverpool Bankstown Campbelltown accessibility outcomes Legend Outcomes targeted in Western Sydney are: public transport that is accessible throughout
3 The growth of Western Sydney
 3 The growth of Western Sydney About this chapter This chapter provides an overview of Western Sydney s growing population and economy, and the benefit of the proposed Western Sydney Airport. Population
Figure 3: Global Sydney. Draft Metropolitan Strategy for Sydney. North Sydney CBD. Second Harbour Crossing. Walsh Bay Arts Precinct.
 Newtown Glebe Macdonaldtown Pyrmont Ultimo Sydney International Convention, Exhibition & Entertainment Precinct Sydney Education & Health Erskineville Figure 3: Global Sydney Waterloo Second Harbour Crossing
4 Transport projects underway in Western Sydney
 4 Transport projects underway in Western Sydney About this chapter This chapter provides an overview of the Australian and NSW government s significant investments in road, bus and rail infrastructure
SYDNEY S SECOND AIRPORT
 COLLIERS RADAR SYDNEY S SECOND AIRPORT The Catalytic Effect of Transport Infrastructure By Sass J-Baleh Manager Research sass.jbaleh@colliers.com Summary Industrial land values across the Sydney markets
https://gsc-public-1.s3-ap-southeast-2.amazonaws.com/s3fs-public/draft-eastern-city-district-plan.pdf
 GSC Sydney East Rev Draft -references Port Botany - 30 https://gsc-public-1.s3-ap-southeast-2.amazonaws.com/s3fs-public/draft-eastern-city-district-plan.pdf Pages 6. The District s freight routes, particularly
PO Box 257 PO Box 257 PARRAMATTA NSW 2124 PARRAMATTA NSW 2124
 31 March 2017 Sean O Toole Sheridan Dudley District Commissioner - West District Commissioner - South West Greater Sydney Commission Greater Sydney Commission PO Box 257 PO Box 257 PARRAMATTA NSW 2124
SEARs strategic context and project need
 3 Strategic context and project need This chapter describes the strategic context of the project within the State and national planning policy framework, and explains the need for the project, across national,
NSW PRE-BUDGET STATEMENT FUTURE ECONOMY FUTURE JOBS
 2017-18 NSW PRE-BUDGET STATEMENT FUTURE ECONOMY FUTURE JOBS Executive Summary The 2017-18 NSW State Budget presents an opportunity for the NSW Government to future-proof the tourism and transport sectors.
STRATA DATA. Residential Strata in NSW A summary analysis. Issue 3, March City Futures Research Centre
 Governing the compact city STRATA DATA Residential Strata in NSW A summary analysis Issue 3, March 2011 City Futures Research Centre Cover photograph: Bruce Judd, 2010 Governing the Compact City Strata
Australian Cities Accounts Estimates. December 2011
 Australian Cities Accounts 2010-11 Estimates December 2011 This report has been prepared by: SGS Economics and Planning Pty Ltd ACN 007 437 729 Level 5 171 Latrobe Street MELBOURNE VIC 3000 P: + 61 3 8616
Why the. Building for growth. West Metro. is vital
 Information summary West Building for growth World class public transport solutions for high demand challenges can transform the way a global city like Sydney lives, works and breathes. Sydney s busiest
TOWN PLANNING SUBMISSION TO THE GREATER SYDNEY COMMISSION LANDS AT ARTARMON
 TOWN PLANNING SUBMISSION TO THE GREATER SYDNEY COMMISSION LANDS AT ARTARMON March 2017 TABLE OF CONTENTS 1.0 INTRODUCTION 3 2.0 THE SUBJECT SITE 4 3.0 STRATEGIC PLANNING CONTEXT 6 4.0 SUMMARY AND CONCLUSIONS
Public Transport for Perth in 2031
 South West Group Submission Public Transport for Perth in 2031 October 2011 South West Group Vision and Mission Local Governments in South Metropolitan Perth, through cooperation with industry, community
OUTLOOK EAST LEPPINGTON
 OUTLOOK EAST LEPPINGTON A CONTEXT ON BUSINESS, CULTURE, LIFESTYLE AND RESIDENTIAL Located within the rapidly expanding South West Growth Centre of Sydney, the East Leppington Precinct is well positioned
Draft Greater Sydney Region Plan
 Powered by TCPDF (www.tcpdf.org) Draft Greater Sydney Region Plan Submission_id: 31382 Date of Lodgment: 14 Dec 2017 Origin of Submission: Online Organisation name: Greenfields Development Company & Ingham
MARKET OUTLOOK. 01 Walkability & Accessibility 02 Infrastructure & Employment 03 Demographics 04 Residential Analysis 06 Rental Analysis
 MARKET OUTLOOK EAST LEPPINGTON Located within the rapidly expanding South West Growth Centre of Sydney, the East Leppington Precinct is well positioned to benefit from the region s strong infrastructure
Shaping Sydney Strategies and Action Plan
 Shaping Sydney 2051 Strategies and Action Plan THE VISION FOR SYDNEY IN 2051 By 2051, an estimated seven million people will be living in Sydney, a vibrant, environmentally sustainable and bustling city
Executive summary. Project description. Project name. Project address. Apartment mix. Deposit required. Estimated construction commencement date
 Investor Report Executive summary Project name Highline westmead Project address 158 164 Hawkesbury Road,, NSW 2145 Apartment mix Studio, 1, 2 and 3 bedroom apartments Deposit required 10% Deposit (cash
The Hon Paul Fletcher MP. Minister for Urban Infrastructure and Cities. CEDA 2018 State of the Nation. Tuesday 26 June 2018
 Page 1 of 16 The Hon Paul Fletcher MP Minister for Urban Infrastructure and Cities CEDA 2018 State of the Nation Tuesday 26 June 2018 National Convention Centre, Bradman Theatre, Canberra Introduction
Metropolitan Plan for Sydney 2036
 Metropolitan Plan for Sydney 2036 METROPOLITAN PLAN FOR SYDNEY 2036 December 2010 ISBN 978 0 7313 3477 3 Copies of this publication may be downloaded from metroplansydney.nsw.gov.au Metropolitan Plan for
Western Sydney Australia's development site
 2018 Real Estate Outlook Market and investment Western Sydney Australia's development site The surge in infrastructure development and real estate construction projects to accommodate Sydney s growing
Why does Sydney need a new fast Metro to the West? A fast Metro to the west is a vital component of this Plan
 Why does Sydney need a new fast Metro to the West? (as shown in 10,000 Friends of Greater Sydney Stage 1 Rail Plan) The Stage 1 Rail Plan was developed to support an integrated transport plan that would
January Productivity Profile. Greater Sydney Productivity Profile
 Greater Sydney Contents 6.2 Strategic and District Centres North District 35 Chatswood Strategic Centre 37 Macquarie Park Strategic Centre 38 01 Overview 3 1.1 Purpose 3 North Sydney Strategic Centre 39
IN FOCUS NSW. Developing Western Sydney
 IN FOCUS NSW Developing Western Sydney DEVELOPING WESTERN SYDNEY Introduction Western Sydney is one of the fastest growing regions in Australia. Traditionally infrastructure expenditure and development
PCAL Case Study Retail Areas: Rouse Hill Town Centre
 PCAL Case Study Retail Areas: Rouse Hill Town Centre Introduction Rouse Hill Town Centre is a new mixed use development on a greenfield site in Sydney s North West. It has been planned to be a major hub
North District Plan OVERVIEW
 OUR GREATER SYDNEY 2056 Revised Draft North District Plan OVERVIEW Hornsby Hunter's Hill Ku-ring-gai Lane Cove Mosman Northern Beaches North Sydney Ryde Willoughby Snapshot of the North District today
Draft Western District Plan
 Powered by TCPDF (www.tcpdf.org) Draft Western District Plan Submission_id: 31732 Date of Lodgment: 15 Dec 2017 Origin of Submission: Online Organisation name: APP Corporation Pty Ltd Organisation type:
Badgery s Creek Airport Presention. Revised from NAN 2015 AGM
 Badgery s Creek Airport Presention Revised from NAN 2015 AGM Contents History Badgery s Creek Objectives Why is another airport required? Badgery s Creek Airport key facts, approval process and timeline
IN SUMMARY. Sydney is growing; but the South is not included. A strategic hub?
 IN SUMMARY There is a serious brain drain in southern Sydney. The Commission needs to prioritise Southern Sydney in its development but nothing is being done, thereby missing the opportunity to stop it.
JULY 2018 SYDNEY METRO WEST: ACCESSIBILITY MODELLING. Measuring the impact of travel times and station location on job and housing accessibility
 JULY 2018 SYDNEY METRO WEST: ACCESSIBILITY MODELLING Measuring the impact of travel times and station location on job and housing accessibility 100 SYDNEY METRO WEST ACCESSIBILITY MODELLING TABLE OF CONTENTS
Overview. Draft Central District Plan. November Local Government Areas: Bayside Burwood Canada Bay. Inner West Randwick Strathfield
 Draft Central District Plan Overview November 2016 Local Government Areas: Bayside Burwood Canada Bay Inner West Randwick Strathfield The City of Sydney Waverley Woollahra 1 Snapshot of the Central District
Metropolitan Plan for Sydney 2036
 Metropolitan Plan for Sydney 2036 OVERVIEW METROPOLITAN PLAN FOR Sydney 2036 December 2010 ISBN 978 0 7313 3478 0 Copies of this publication may be downloaded from metroplansydney.nsw.gov.au Metropolitan
WELLINGTON $422 MILLION $614 MILLION $83 MILLION 22% SPEND $1.9 BILLION
 WELLINGTON WELLINGTON $1.9 BILLION FORECAST TOTAL WELLINGTON INVESTMENT The Wellington region s transport challenges are dominated by the region s concentration of population in the metropolitan cities,
Sydney Metro West A new railway for Western Sydney
 Sydney Metro West A new railway for Western Sydney PROJECT OVERVIEW, SEPTEMBER 2017 SYDNEY METRO WEST A NEW RAILWAY FOR WESTERN SYDNEY 1 CONTENTS Project snapshot 4 The need for new rail 5 Sydney Metro
7.0 Bus and light rail in Sydney
 7.0 Bus and light rail in Sydney Summary Buses and light rail provide accessible public transport on transit corridors where traffic flows do not support a heavy rail line. The principal issue facing bus
Submission to Infrastructure Victoria s Draft 30-Year Infrastructure Strategy
 Submission to Infrastructure Victoria s Draft 30-Year Infrastructure Strategy 1. Introduction This submission is a response to Infrastructure Victoria s assessment of the need to construct a heavy rail
Measuring the changing face of Global Sydney
 Measuring the changing face of Global Sydney Contents Global Migration Index P.1 Key findings P.2 Trends P.5 Future releases P.8 A Global Sydney Globalisation has brought society more closely together
Draft Greater Sydney Region Plan
 Powered by TCPDF (www.tcpdf.org) Draft Greater Sydney Region Plan Submission_id: 31119 Date of Lodgment: 12 Dec 2017 Origin of Submission: Online Organisation name: Serapark Pty Ltd Organisation type:
Economy. Metropolitan Plan for Sydney 2036 PAGE 127
 STRATEGIC DIRECTION E Growing Sydney s Economy Metropolitan Plan for Sydney 2036 PAGE 127 Introduction A strong economy in Sydney and NSW provides the resources to fund economic, social and cultural infrastructure
SYDNEY S GROWTH ENGINES: DRIVING SYDNEY S ROAD NETWORK NEEDS
 SYDNEY S GROWTH ENGINES: DRIVING SYDNEY S ROAD NETWORK NEEDS John Brewer, General Manager Strategic Network Planning, RTA of NSW Natalie Camilleri, Manager Network and Corridor Planning, RTA of NSW ABSTRACT:
East Lancashire Highways and Transport Masterplan East Lancashire Rail Connectivity Study Conditional Output Statement (Appendix 'A' refers)
") Report to the Cabinet Member for Highways and Transport Report submitted by: Director of Corporate Commissioning Date: 1 June 2015 Part I Electoral Divisions affected: All East Lancashire Highways and
Report to the Cabinet Member for Highways and Transport Report submitted by: Director of Corporate Commissioning Date: 1 June 2015 Part I Electoral Divisions affected: All East Lancashire Highways and
County of Cumberland Plan Sydney Region Outline Plan
 Sydney has been fortunate in having had two ground breaking Strategic Plans to guide its growth. The first was the County of Cumberland Plan 1948, based on the 1944 London Plan, complete with a green belt.
Sunshine Coast Council Locked Bag 72 Sunshine Coast Mail Centre QLD Submitted via online portal. 2 June 2017.
 Sunshine Coast Council Locked Bag 72 Sunshine Coast Mail Centre QLD 4560 Submitted via online portal 2 June 2017 Dear Sir /Madam, RE: DRAFT ENVIRONMENTAL AND LIVEABILITY STRATEGY The Green Building Council
Overview. Draft North District Plan. November Local Government Areas: Hornsby Hunter s Hill Ku-ring-gai. Lane Cove Mosman Northern Beaches
 Draft North District Plan Overview November 2016 Local Government Areas: Hornsby Hunter s Hill Ku-ring-gai Lane Cove Mosman Northern Beaches North Sydney Ryde Willoughby Snapshot of the North District
For personal use only
 asx release 21 October 2015 Presentation to Morgans Queensland Conference Please find attached the presentation that Transurban CEO Scott Charlton will be delivering at today s Morgans Queensland Conference.
ILLAWARRASHOALHAVEN ECONOMIC OUTLOOK
 360 SHOALHAVEN ECONOMIC OUTLOOK Foreword The Illawarra-Shoalhaven is a fantastic region. Home to a skilled and agile workforce, pristine natural environment, world-class university and thriving manufacturing
Page 1 of 7 FULL TRANSCRIPT: WESTERN SYDNEY AIRPORT ANIMATION VIDEO
 Page 1 of 7 FULL TRANSCRIPT: WESTERN SYDNEY AIRPORT ANIMATION VIDEO 00:00 Opening information screen with Australian Government Department of Infrastructure and Regional Development logo. Text reads: Western
TRANSPORT FOR A CONNECTED CITY
 STRATEGIC DIRECTION C TRANSPORT FOR A CONNECTED CITY Metropolitan Plan for Sydney 2036 PAGE 81 Introduction The rail network caters for almost one million passenger trips a day Sydney in 2010 Sydney s
East West Rail Consortium
 East West Rail Consortium EWR Wider Economic Case: Refresh 18 th November 2015 Rupert Dyer Rail Expertise Ltd Rail Expertise Ltd. Tel: 01543 493533 Email: info@railexpertise.co.uk 1 Introduction 1.1 The
CENTRES AND CORRIDORS STRATEGY FOR SYDNEY
 STRATEGY FOR SYDNEY B introduction 80 THIS PAGE TURNER/ARETS, PREVIOUS PAGE: KARL SCHWERDTFEGER VISION FOR CENTRES Sydney s strategic centres will be attractive places to live, work and invest. They will
TRANSPORT AFFORDABILITY INDEX
 TRANSPORT AFFORDABILITY INDEX Report - December 2016 AAA 1 AAA 2 Table of contents Foreword 4 Section One Overview 6 Section Two Summary of Results 7 Section Three Detailed Results 9 Section Four City
Technical Paper 1 Traffic report
 Technical Paper 1 Traffic report 1 Contents List of Tables... 3 List of Figures... 4 Preface... 6 Terminology... 7 1 Executive summary... 8 1.1 1.2 1.3 1.4 1.5 1.6 Background to this report... 8 Traffic
The Coalition s Policy to Build Melbourne s East West Link
 1 Our Plan Real Solutions for all Australians The direction, values and policy priorities of the next Coalition Government. The Coalition s Policy to Build Melbourne s East West Link August 2013 Our Plan
Investor Report. Connecting the best of both worlds
 Investor Report Connecting the best of both worlds Executive summary Project & display address 1015 Pacific Highway, Roseville, NSW 2069 Project description Rose is a mixed-use development located within
PLANNING THE SUNBURY GROWTH CORRIDOR
 SUNBURY GROWTH CORRIDOR NOVEMBER 2016 PLANNING THE SUNBURY GROWTH CORRIDOR Sunbury Planning Background The Victorian Planning Authority, in consultation with Hume City Council, is undertaking a number
Gold Coast: Modelled Future PIA Queensland Awards for Planning Excellence 2014 Nomination under Cutting Edge Research category
 Gold Coast: Modelled Future PIA Queensland Awards for Planning Excellence 2014 Nomination under Cutting Edge Research category Jointly nominated by SGS Economics and Planning and City of Gold Coast August
Draft Greater Sydney Region Plan
 Draft Greater Sydney Region Plan Submission_id: 31221 Date of Lodgment: 13 Dec 2017 Origin of Submission: Online Organisation name: Infrastructure Group Organisation type: Other First name: Jacob Ibrahim
Draft Greater Sydney Region Plan
 Draft Greater Sydney Region Plan Submission_id: 31392 Date of Lodgment: 14 Dec 2017 Origin of Submission: Online Organisation name: Greenfields Development Company No. 2 Pty Limited Organisation type:
A PLAN FOR GROWING SYDNEY December 2014 Crown Copyright 2014 NSW Government ISBN
 A B A PLAN FOR GROWING SYDNEY December 2014 Crown Copyright 2014 NSW Government ISBN 978-0-7313-3649-4 DISCLAIMER While every reasonable effort has been made to ensure that this document is correct at
Greater Parramatta and Olympic Peninsula Strategic Vision: Evidence base Final report Greater Sydney Commission September 2016
 Greater Parramatta and Olympic Peninsula Strategic Vision: Evidence base Final report Greater Sydney Commission September 2016 160276-draft report-160831 This report has been prepared for Greater Sydney
Dr Tim Brooker. Associate- Transport Planning; EMGA Mitchell McLennan Pty Ltd, Sydney. Abstract
 Australasian Transport Research Forum 2013 Proceedings 2-4 October 2013, Brisbane, Australia Publication website: http://www.patrec.org/atrf.aspx Growth trends between 2001, 2006 and 2011 for commuting
Moving Brisbane is the Newman Liberal team s blueprint for a modern and efficient transport system.
 Moving Brisbane Moving Brisbane is the Newman Liberal team s blueprint for a modern and efficient transport system. From roads and river crossings, to buses and bikes, Moving Brisbane addresses every component
Airport forecasting is used in master planning to guide future development of the Airport.
 Airport Forecasts Airport forecasting is used in master planning to guide future development of the Airport. 4.1 INTRODUCTION Airport forecasting ensures development is appropriate for passengers, ground
NSW Budget Highlights
 NSW Budget 2018-19 Highlights Wednesday 20 June 2018 The industry association representing the business interests of consulting firms operating in the built and natural environment Yesterday, NSW Treasurer
Australia s Cities: Opportunities & Challenges
 DEPARTMENT OF THE PRIME MINISTER AND CABINET Australia s Cities: Opportunities & Challenges Cities Division 1 Australia s 21 Biggest Cities Economic Activity is Concentrated in Cities 2% 8% Sources: Grattan
Sydney over the next 20 years A Discussion Paper. May 2012
 Sydney over the next 20 years A Discussion Paper May 2012 Sydney over the next 20 years. A Discussion Paper May 2012 Crown Copyright 2012 NSW Government ISBN 978-0-7313-3506-0 DISCLAIMER While every reasonable
Wellington $312 $49 $456 OVERVIEW WELLINGTON REGIONAL SUMMARY
 National Land Transport Programme 2015 18 Wellington WELLINGTON REGIONAL SUMMARY OVERVIEW The Wellington region is made up of a number of cities, urban areas and supporting rural hinterland. The city is
INTERIM REVIEW OF AUSTRALIAN CONSTRUCTION MARKET CONDITIONS JULY 2015
 INTERIM REVIEW OF AUSTRALIAN CONSTRUCTION MARKET CONDITIONS JULY 2015 2 Review of Australian Construction Market Conditions July 2015 Trade bottlenecks continue in New South Wales, Victoria and Queensland
Infrastructure Priority List. Infrastructure Priority List Printed as at 28 April
 Infrastructure Priority List Infrastructure Priority List Printed as at 28 April 2018 1 High Priority Projects High Priority Projects are potential infrastructure solutions for which a full business case
Roads and Maritime Services Presentation to Local Government NSW Annual Conference October 2014
 Roads and Maritime Services Presentation to Local Government NSW Annual Conference October 2014-1 - About Roads and Maritime Services Deliver customerfocused services and infrastructure to the value of
SIT BACK AND WATCH THE WORLD GO BY. FROM A CORNER THAT S ALL YOUR OWN.
 SIT BACK AND WATCH THE WORLD GO BY. FROM A CORNER THAT S ALL YOUR OWN. Welcome to Luminous Garden A new kind of residence in Edmondson Park The only address to call home Blue Mountains National Park Prospect
WESTERN SYDNEY PARKLANDS PLAN 2020 CORPORATE
 WESTERN SYDNEY PARKLANDS 2020 CORPORATE PLAN March 2015 Table of Contents Message from the Chairman and Director 1 What is the Western Sydney Parklands? 4 The Western Sydney Parklands Trust 4 The Corporate
Paul Fletcher Minister for Urban Infrastructure and Cities Launch of Infrastructure Australia Future Cities Paper. Fri 23 February 2018
 Paul Fletcher Minister for Urban Infrastructure and Cities Launch of Infrastructure Australia Future Cities Paper Fri 23 February 2018 Introduction I am pleased to have the opportunity to speak at the
Connecting Western Sydney. Submission to the Australian Government Western Sydney Rail Needs Scoping Study
 Connecting Western Sydney Submission to the Australian Government Western Sydney Rail Needs Scoping Study October 2016 Table of Contents Executive Summary... 3 About the Committee for Sydney... 4 Introduction...
CHRISTCHURCH MOTORWAYS. Project Summary Statement February 2010
 CHRISTCHURCH MOTORWAYS Project Summary Statement February 2010 Table of Contents 1. Purpose of Document 2. Strategic Context 3. Benefits 4. Project Scope and Economics 5. Implementation Plan 1 ROADS OF
Directions. for a Greater Sydney
 Directions for a Greater Sydney 2017-2056 Directions for a Greater Sydney is the approach produced by the Greater Sydney Commission to better integrate land use and infrastructure to deliver a more productive,
Connecting Sydney Olympic Park and GPOP with Greater Sydney. Final Summary Report 29 May 2017
 Connecting Sydney Olympic Park and GPOP with Greater Sydney Final Summary Report 29 May 2017 GPOP sits at the core of the emerging Central City. East Sydney is at the centre of the established Eastern
Draft West Central District Plan. Overview. November Local Government Areas: Blacktown Cumberland Parramatta The Hills
 Draft West Central District Plan Overview November 2016 Local Government Areas: Blacktown Cumberland Parramatta The Hills 1 Snapshot of the West Central District Population 2016 2036 That s an estimated
OUTLOOK WATERLOO. Waterloo is a growing residential market, boasting high amenity that is well located to a number of major employment centres.
 OUTLOOK WATERLOO A CONTEXT ON BUSINESS, CULTURE, LIFESTYLE AND RESIDENTIAL Waterloo is a growing residential market, boasting high amenity that is well located to a number of major employment centres.
AUCKLAND $1.2 BILLION $1.9 BILLION $149 MILLION 15% SPEND $5.7 BILLION
 AUCKLAND AUCKLAND $5.7 BILLION FORECAST TOTAL AUCKLAND INVESTMENT The next 10 years are expected to underline Auckland s performance as the fastest growing major city in Australasia. The city is expected
COFFS HARBOUR MARKETSNAPSHOT
 MARKETSNAPSHOT NEW SOUTH WALES The Mid North Coast region is ranked fourth in Australia for business confidence with its regional economy growing at a healthy 4.1% p.a. and produces an annual Gross Regional
Agenda Item 5: Rail East Midlands Rail Franchise Consultation
 Strategic Transport Forum 15 th September 2017 Agenda Item 5: Rail East Midlands Rail Franchise Consultation Recommendation: It is recommended that the Forum agree (subject to any amendments agreed by
The Coalition s Policy to Build the Swan Valley Bypass and Perth Gateway
 1 Our Plan Real Solutions for all Australians The direction, values and policy priorities of the next Coalition Government. The Coalition s Policy to Build the Swan Valley Bypass and Perth Gateway August
Assessing the long-term potential of Macquarie Park
 Assessing the long-term potential of Macquarie Park March 2016 Summary The Macquarie Park office market acts as a business cluster for companies in the health, education and technology sectors. The cluster
TRANSPORT AFFORDABILITY INDEX
 TRANSPORT AFFORDABILITY INDEX Report - March 2018 AAA 1 AAA 2 Table of contents Foreword 4 Section One Overview 6 Section Two Summary of Results 8 Section Three Detailed Results 14 Section Four State by
For personal use only
 11 October 2018 September Quarter Update 2018 Transurban today released its September quarter 2018 update. During the period, Average Daily Traffic (ADT) increased by 3.3%, with growth across all markets.
The Coalition s Policy
 The Coalition s Policy Key Commitments The Coalition s plan for a strong new economy will provide jobs and growth and secure the future for Australian families through smart investment in infrastructure.
URBAN CONSOLIDATION VS URBAN SPRAWL IN SYDNEY. THE DEBATE RAGES ON
 URBAN CONSOLIDATION VS URBAN SPRAWL IN SYDNEY. THE DEBATE RAGES ON Tim Brooker (Senior Transport Planner, Arup Sydney) Megan Gee (Graduate Environmental Engineer, Arup Sydney) ABSTRACT The challenge of
EAST WEST RAIL EASTERN SECTION. prospectus for growth
 EAST WEST RAIL EASTERN SECTION prospectus for growth September 2018 executive summary The East West Rail Consortium, a partnership of local authorities, rail operators and Network Rail, continues to promote
Forecasting the Distribution of Stand-Alone Office Employment across Sydney to 2035
 Forecasting the Distribution of Stand-Alone Office Employment across Sydney to 2035 PREPARED FOR NSW DEPARTMENT OF PLANNING AND ENVIRONMENT www.bis.com.au BIS Shrapnel Pty Limited August 2015 The information
ADVISORY. RESEARCH. VALUATIONS. PROJECTS.
 ADVISORY. RESEARCH. VALUATIONS. PROJECTS. Melbourne Level 19/8 Exhibition Street Melbourne VIC 3000 T +61 (0) 3 8102 8888 Sydney Level 25/52 Martin Place Sydney NSW 2000 T +61 (0) 2 8228 7888 Singapore
Sydney s Innovation Corridors Bob Meyer AM Director of Planning Cox Richardson Architects and Urban Planners July 2017
 Sydney s Innovation Corridors Bob Meyer AM Director of Planning Cox Richardson Architects and Urban Planners July 2017 Two years ago, I proposed a Sub-region, or district in today s terms, be formed stretching
AUSTRALIAN TRAVEL TIME METRIC 2017 EDITION
 AUSTRALIAN TRAVEL TIME METRIC 217 EDITION For more information please contact: Brendan Lyon Chief Executive Officer Infrastructure Partnerships Australia Suite 3.3, Level 3, 9 Pitt Street Sydney NSW 2
A Response to: Belfast On The Move Transport Masterplan for Belfast City Centre, Sustainable Transport Enabling Measures
 West Belfast Partnership 218-226 Falls Road Belfast BT12 6AH T: 02890809202 A Response to: Belfast On The Move Transport Masterplan for Belfast City Centre, Sustainable Transport Enabling Measures Issued
10 Ideas for the NSW Budget to Kick-start Jobs in Western Sydney
 10 Ideas for the NSW Budget to Kick-start Jobs in Western Sydney 1. A mandated requirement for all large State Government infrastructure projects to have a 4:1 ratio for apprentices to tradespeople. 2.
TERMINAL DEVELOPMENT PLAN
 5.0 TERMINAL DEVELOPMENT PLAN 5.0 TERMINAL DEVELOPMENT PLAN Key points The development plan in the Master Plan includes the expansion of terminal infrastructure, creating integrated terminals for international,
The Government s Aviation Strategy Transport for the North (TfN) response
 response") The Government s Aviation Strategy Transport for the North (TfN) response Transport for the North Background Good transport links are a crucial part of a strong economy supporting labour markets and delivering
The Government s Aviation Strategy Transport for the North (TfN) response Transport for the North Background Good transport links are a crucial part of a strong economy supporting labour markets and delivering