Full Year 2014 Results. 19 February 2015
|
|
|
- Alisha Bryan
- 5 years ago
- Views:
Transcription

1 Full Year 2014 Results 19 February 2015
2 Highlights of the Full Year 2014 Operating environment Air France-KLM Weak economic environment Significant currency volatility Fuel price stable in first 9 months followed by large drop Second Half impacted by industry overcapacity on certain long-haul routes Unit cost reduction delivered as planned Roll-out of upgraded products Transavia passengers up 26% in France EBITDA up 159 million excluding pilot strike impact Net debt stable, affected by pilot strike and Venezuela Launch of new strategic plan, Perform
3 Key data In millions Q Q (1) Change FY 2014 FY 2013 (1) Change Revenues 6,212 6, % 24,912 25, % Change like-for-like (3) -0.5% +0.3% EBITDA (2) m 1,589 1, m EBITDA excluding strike m 2,014 1, m Change like-for-like (3) -6m +216m Operating result m m Operating result excl. strike m m Change like-for-like (3) +6m +275m Net result, group share 316-1,176 +1,492m ,827 +1,629m Adjusted net result (2) m m ROCE excluding strike (2) 5.1% 2.9% +2.2 pts Operating free cash flow (2) m Net debt at end of period 5,407 5, m (1) 2013 restated for IFRIC 21, CityJet reclassified as discontinued operation (2) See definition in press release (3) Like-for-like: excluding currency, pilot strike impact and Q4 one-offs. Same definition applies in rest of presentation unless otherwise stated 3
4 Significant currency impact on operating result Currency impact on revenues and costs ( m) -65 Revenues Revenues and costs per currency (FY 2014) Other currencies 25% US dollar (and related currencies) Costs Q Q Q Q Currency impact on revenues Currency impact on costs, including hedging Other currencies (mainly euro) 42% US dollar -xx Currency impact on operating result 4
 Reported change (%) Change")
 Reported change ( m) Change")


5 Contribution by business segment to Revenue ( bn) Reported change (%) Change Like-for-like (%) Op. result ( m) Reported change ( m) Change Like-for-like ( m) Passenger 78% % +0.3% Cargo 9% % -2.4% Maintenance 5% % +3.5% Other 8% % +3.0% Total % +0.3%
6 Passenger activity Activity strongly affected by pilot strike Capacity up 1.0% excluding strike Full Year unit revenue down 0.6% like-for-like Second Half unit revenue impacted by industry overcapacity on certain parts of the long-haul network Positive trend in premium cabins Premium: +3.0%* Economy: -0.9%* Positive impact of capacity reduction on medium-haul Operating result up like-for-like thanks to strong unit cost reduction delivery Capacity (ASK) Load factor Traffic (RPK) RRPK RASK CASK -1.9% -3.1% Reported Activity -0.6% 83.8% +0.9 pt 84.7% FY 2013 FY 2014 Unit revenue Like-for-like +0.5% -0.6% -0.9% -2.0% Unit cost -0.7% -0.3% At constant currency -1.7% * Q4 one-offs taken at central level, no allocation by cabin 6
7 Passenger capacity and unit revenue per quarter 2012 Q Q Q Q Q Q Q Q Capacity +0,6% +0,3% +2,7% +1,6% +1,8% +1,3% +1,0% +1,6% -0.2% Like-for-like RASK ex-currency +3,2% +1,3% -1,3% +2,7% +0,0% -0.7% +1,3% -1.8% +1,0% -1.1% +0.8% -0.6% Like-for-like 7


8 Full Year passenger unit revenue by network Like-for-like Medium-haul point-to-point -12.8% ASK -9.5% RPK 7.5% RASK Total medium-haul North America Medium-haul hubs -1.3% ASK 1.3% RPK 1.6% RASK 2.9% ASK 2.6% RPK 1.0% RASK 2.6% ASK 4.4% RPK 0.1% RASK Latin America Africa and Middle East Asia 7.0% ASK 5.6% RPK -6.2% RASK -0.1% ASK 0.8% RPK 1.0% RASK -0.4% ASK 0.9% RPK -0.5% RASK Total long-haul Caribbean & Indian Ocean Total 1.6% ASK 2.3% RPK -0.3% RASK -0.5% ASK 2.4% RPK 2.3% RASK 1.0% ASK 2.1% RPK -0.6% RASK NB: Q4 one-offs taken at central level, no allocation by region 8
9 Cargo activity Activity strongly affected by pilot strike Capacity down 0.9% excluding strike Full freighter capacity further reduced by 7.8% Persistently weak demand RATK -0.9% like-for-like Capacity (ATK) Load factor Traffic (RTK) Activity -2.3% -0.1 pt 63.2% 63.1% -2.4% FY 2013 FY 2014 Operating income up 33m like-for-like thanks to good performance on unit costs Unit revenue Unit cost RRTK RATK CATK Perform 2020: accelerated phase-out of 9 full-freighters -0.9% -1.1% -1.2% -0.9% -1.8% -1.3% -1.9% -2.0% Reported At constant currency Like-for-like 9
10 Maintenance activity Revenue pick up as expected in Second Half 4.4bn Order book +28% 5.6bn Dollar strength now supporting revenue and profitability Increase in operating result and margin As a result of ongoing development of higher margin activities Despite pilot strike impact on internal revenue and operating result 31 Dec Dec 2014 In millions FY 14 FY 13 Change Total revenue 3,392 3, % Third party revenue: +3.5% likefor-like Like-for- Like Third party revenue 1,251 1, % +3.5% Perform 2020: further development Operating result Operating margin 5.1% 4.8% +0.3pt +1.1pt 10
11 Other businesses: strong development of Transavia 10 million passengers Revenues surpassing 1 billion Capacity (ASK) Load factor Transavia activity 90.0% +8.3% -0.2 pt 89.8% Load factor stable at almost 90% Traffic (RPK) +8.0% Accelerated ramp-up in France on track Capacity up 21% Passengers up by 23% Ongoing shift to LCC model in the Netherlands Scheduled capacity up 12% Charter capacity down 4% FY 2013 FY 2014 In millions FY 14 FY 13 Change Total revenue 1, % RRPK ( cts per RPK) % RASK ( cts per ASK) % CASK ( cts per ASK) % Operating result
12 Full Year 2014: Change in operating costs m Reported change Change at constant currency Like-for -like 30% Total employee costs including temps 7, % -1.9% 25% Supplier costs (1) excluding fuel and purchasing of maintenance services and parts 6, % +1.3% 12% Aircraft costs (2) 3, % -1.4% 5% Purchasing of maintenance services and parts 1, % +4.6% Operating costs ex-fuel (3) 18, % -0.2% -0.5% 26% Fuel 6, % -2.9% -1.5% Grand total of operating costs 25, % -0.9% -0.8% Capacity (EASK) -0.3% +1.2% (1) Catering, handling, commercial and distribution charges, landing fees and air-route charges, other external expenses, excluding temps (2) Chartering (capacity purchases), aircraft operating leases, amortization, depreciation and provisions (3) Including other taxes, other revenues, other income and expenses 12
13 Systematic fuel hedging 64% Percentage of fuel consumption already hedged (Picture at 9 February 2015) 66% 61% 57% 42% 31% 22% 10% Q1 Q2 Q3 Q4 Q1 Q2 Q3 Q4 Q1 2015: 62% 2016: 27% portfolio based on: 93% Brent, 7% jet fuel 13
14 Update on 2015 fuel bill 2014: fuel bill $8.9bn / 6.6bn 2015: fuel bill $7.4bn / 6.3bn (2) 8.9 Fuel bill after hedging (in billion dollars) 7.4 (1) $74/bbl 7.9* $68/bbl 7.6* $62/bbl 7.4 $55/bbl 7.1* $49/bbl 6.8* * Fuel sensitivity has been adjusted based on corrected sensitivity analysis using forward curve of 9 February (1) 1.9(1) 2.0 (1) 1.7 (1) MARKET PRICE Jan-Dec FY Q1 Q2 Q3 Q4 Brent ($ per bbl) (1) Jet fuel ($ per metric ton) (1) % of consumption already hedged 62% 64% 66% 61% 57% (1) Based on forward curve at 9 February Sensitivity computation based on February-December 2015 fuel price, assuming constant crack spread between Brent and Jet Fuel (2) Assuming exchange rate of 1.15 US dollar per euro 14
15 Update on employee costs Average headcount reduction in 2014: -1,550 FTEs Change in total employee costs ( m, including temporary staff) 100, ,200 99,500 98,400 98,800 97,100 97,500 97,100 7,655 Net change -1.6% 7,510 Q1 Q2 Q3 Q activity in EASK* General pay freeze at both Air France and KLM Pension expense, consolidation impact and strike Slower reduction employee costs in Second Half, in line with plan FY 2013 FY 2014 * Excluding pilot strike impact 15
16 Well covered pension liabilities in spite of large impact from falling discount rate Evolution of net pension balance sheet situation, in million euros +601 Regular evolution of net pension situation Change in Dutch fiscal regulation +824 Change in actuarial assumptions +124 Liabilities: Assets: 16.6bn 17.2bn Cash out: P&L expense: other: +30-3, ,578 Liabilities: 20.1bn Assets: 19.4bn Main discount rate revised down ~130 bps Change in asset value Dec 2013 Dec
17 Expected impact on 2015 P&L Fall in discount rate leads to significant increase in P&L pension cost Cash outflow is determined independently Multiple impacts of new Dutch fiscal regulation Reduction of cost of existing scheme Compensation for higher employee contributions under negotiation Net negative P&L impact of ~ 100m (no additional cash out) Pensions are part of the current Collective Labor Agreement negotiations Pension P&L expense and cash out ( m) IAS 19R Pension P&L expense Pension cash out Additional P&L expense 17
18 Full Year 2014: Further reduction in unit costs Net Costs: 22,334m (-1.3%); excluding impact of pilot strike: 22,404m Capacity in EASK: 332,602m (-0.3%) ; excluding impact of pilot strike: 337,352m (+1.2%) Unit cost per Equivalent Available-Seat Kilometer (EASK): 6.71 cents ; excluding impact of pilot strike: 6.64 cents Net change Excluding Q4 one-offs Net change Excluding change in pension expense Change at constant currency, excluding strike impact Reported change +0.0% Strike Impact 1.1% -1.3 % -+0.2% Q4 one-offs -1.1 % Change in pension expense (non cash) --0.7% -1.8% -1.1% Fuel price effect -0.4% Currency effect 18
19 Results impacted by strike, currency and unit revenue weakness Operating result, in million euros Unit cost +304 Change in pension expense (non cash) Q4 One- offs Currency Impact Revenues: +100 Costs: Strike impact Activity change Unit revenue -158 Revenues: -279 Costs: REASK: -0.8% +160 Fuel price ex-currency CEASK: -1.3% FY 2013* FY Reported operating result * Restated for IFRIC 21, CityJet reclassified as discontinued operation 19
20 Full Year operating free cash flow Analysis of change in net debt, Full Year 2014, in million euros 5,348 Cash flow before VDP, and change In WCR (FY 2013**: 1,311) +1,039 Operating free cash flow*: -164 (FY 2013: +530) Gross Investments -1,360 (FY 2013: -1,064) Voluntary Departure Plans (FY 2013: -183) -154 Change in WCR (FY 2013: +343) +113 Sale & Lease-Back +198 Net investments -1, Other including provision on cash held in Venezuela and Amadeus transaction 5,407 Net debt at 31 December 2013 Net debt at 31 December 2014 * Net cash flow from operating activities less net capex on tangibles and intangibles. All amounts excluding discontinued operations. See definition in press release ** 2013 restated for IFRIC 21, CityJet reclassified as discontinued operation 20
21 EBITDA and operating cash flow per airline EBITDA ( m) EBITDA margin 1,014 1, % 7.9% 8.7% 5.4% 7.6% Operating Cash Flow ( m, before VDP and WCR) 1, % Operating Cash Flow margin (before VDP and WCR) 6.8% 4.3% 5.3% 4.7% NB: Sum of airlines does not equate to total group because of intercompany transactions and activity at group level Strike adjusted 21
22 Financial ratios at 31 December 2014, trailing 12 months 3.3x EBITDAR / adjusted net interest costs (1) 3.5x 3.9x 4.3x (3) 3.7x Adjusted net debt (2) / EBITDAR 5.7x 5.4x 4.7x 4.2x 4.0x (3) 31/12/ /12/2012* 31/12/2013** 31/12/ /12/ /12/2012* 31/12/2013** 31/12/2014 EBITDA / net interest costs 5.4x (3) 4.6x 4.0x 3.6x 4.3x 4.8x Net debt / EBITDA 4.3x 2.9x 3.4x 2.7x (3) 31/12/ /12/2012* 31/12/2013** 31/12/ /12/ /12/2012* 31/12/2013** 31/12/2014 Strike adjusted (EBITDA(R) only, net debt not corrected for strike) * IAS19 Restated ** Restated for IFRIC 21, CityJet reclassified as discontinued operation (1) Adjusted by the portion of financial costs within operating leases (34%) (2) Adjusted for the capitalization of operating leases (7x yearly expense) (3) Excluding strike impact on EBITDA(R) (net debt unchanged) 22
23 High level of liquidity Cash of 3.5 billion at 31 December 2014 Undrawn credit lines of 1.75 billion Air France: 1.06 billion until 2016 KLM: 540 million until 2016 Air France-KLM: 150 million until 2017 Active debt refinancing program Successful 600 million bond issue in June 2014 Bonds representing 94 million euros repurchased on the same occasion Further Amadeus share sale in January Net proceeds of 327m Remaining 9.9m shares hedged in November
24 Strategy
25 Agenda Conclusion of Transform 2015 Update on Perform 2020 Key growth initiatives Strict framework of financial discipline Deployment of cost reduction initiatives at Air France Deployment of cost reduction initiatives at KLM 25
26 Transform 2015: first phase of group turnaround accomplished Strict capacity discipline Successful renegotiation of labour agreements Operational transformation Short and medium-haul restructuring well underway Capacity growth (CAGR ) +0.9% Net employee cost reduction (2014 vs 2011) - 300m Point-to-point capacity % Accelerated development of Transavia Full-freighter activity significantly downsized Transavia passengers % Full-freighter capacity % Successful roll-out of new long-haul products underpinning upscaling strategy Number of aircraft equipped with new cabins at 31/12/
27 Transform 2015 has delivered on unit cost reduction Ex-fuel net unit cost, in cents per EASK, like-for-like % cts With Transform 2015 momentum Annual costs reduced by over 1 billion in 3 years 27
28 leading to a strong improvement in financial situation Full Year EBITDA ( bn) ~2.0 Full Year Operating cash flow bn, before change in WCR and Voluntary Departure Plans ~1.5 Net debt/ebitda ratio trailing 12 months FY 2011 FY 2012 FY 2013 FY 2014 FY 2011 FY 2012 FY 2013 FY * vs 2011: 2014* vs 2011: Dec 2014* vs Dec 2011: + 670m + 960m almost halved Dec 2011 Dec 2012 Dec 2013 Dec 2014 Strike impact Strike impact Strike impact * Excluding strike impact 28
29 Agenda Conclusion of Transform 2015 Update on Perform 2020 Key growth initiatives Strict framework of financial discipline Deployment of cost reduction initiatives at Air France Deployment of cost reduction initiatives at KLM 29
30 Perform 2020: growth and competitiveness Selective development on growth markets Product and service upgrade Capacity and investment discipline Further restructuring and unit cost reduction 30
31 Key growth initiatives Smart growth in passenger operations Increased customer focus Upgraded product offer Leveraging brand portfolio Long-haul partnerships, with a focus on Asia-Pacific Accelerated development of Transavia Successful growth in maintenance 31
32 : customer experience improved thanks to 900m investment in product and service upgrade across all segments Long-haul Ongoing deployment of new products at both Air France and KLM Two Skytrax awards for La Première lounge Customer scores on business class seat comfort Short and medium-haul New Air France product deployed as of April 2015 Previous seats New seat Digital % of long-haul fleet equipped with new product at end 2015 Previous seat (B747) New seat (B747) Previous seat (B777) New seat (B777) 32
33 Transavia: a solid footprint in the growing low-cost market, targeting breakeven in 2017 and profitability by 2018 Successful development in France Already low-cost leader in the Netherlands traffic growth in France: +78% 2014 results better than expected Transavia passengers (million) >16 Further momentum in 2015 Number 1 low-cost carrier at Orly in 2015, operating 49 destinations out of France Roll out of new positioning, brand image and digital platform Flying Blue earning and burning Order for 20 Boeing 737s Medium-term operating margin above 5% Ongoing efforts at cost control profitability impacted by ongoing ramp-up +60% 8,9 7,6 6, , XX 45 Base fleet, excluding short term leases 33
34 Maintenance: rapid growth of order book secures significant share of future revenues Growth of order book External revenue and operating result ( m) +70% 5.6bn External revenue CAGR: +6% Operating result CAGR: +21% 1,225 1, bn 4.4bn 1,040 1, * 3.3bn 38 months of revenue 54 months of revenue Dec 2011 Dec 2012 Dec 2013 Dec * Excluding strike impact xx Operating result External revenue 34
35 Perform 2020: growth and competitiveness Selective development on growth markets Product and service upgrade Capacity and investment discipline Further restructuring and unit cost reduction 35

36 Maintaining ongoing capacity discipline Capacity growth plan (ASK) Network airlines (Air France, KLM, HOP!) Long-haul: +1.5% Hub feeding: +2% Point-to-point: -11% Total group +0.6% +1.2% +1.0%* +1.1%* +1.8% +1.5%* +1.6%* % % Transavia +8.2% +8% +3.1% * Excluding strike impact Reported network airlines growth: 2014: -0.6%, 2015: approx. +2.7% 36

37 while retaining leadership from Europe to long-haul routes Long-haul traffic to/from Europe (2014, bn RPK) Market share per long-haul region (OAG, Winter 2014) Asia % larger than peers North America* 22% 24% 24% 11% 12% 6% AF-KL IAG LH AF-KL IAG LH 26% Africa AF-KL IAG LH Latin America 21% 23% 10% AF-KL IAG LH 14% 7% AF-KL IAG LH Caribbean/Indian Ocean 28% 9% <4% AF-KL IAG LH * Including respective US partners 37
38 investment plan revised down by 600m Net investment plan, billion Plan presented in September 2014 Plan updated in February
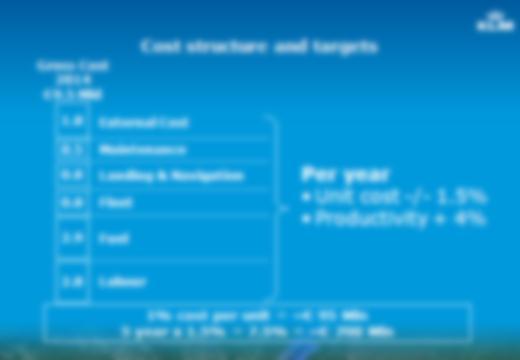
39 Unit cost reduction target revised up to an average of 1.5% per year Net unit cost per EASK in cents, at constant currency, fuel price and pension expense TRANSFORM 2015 Change in unit cost % -1.4% -1% to -1.3% -2.0% Target: average -1.5% per year : ~ 1bn Air France: 650m KLM: 390m 39
40 Rigorous organization adapted to social context in each airline Phase 1 Gathering and validation of benchmarks Sept-Nov 2014 Budget and 3-year planning Phase 2 Bottom-up approach per cluster Dec Consolidation of plans Implementation of immediate measures March 2015 Phase 3 Negotiations with all categories of staff KLM negotiations started in December 2014 Air France presentation and negotiations after March 2015 union elections From Dec 2014 From April 2015 Phase 4 Implementation of plans Ongoing 40
41 Leveraging all contributions beyond traditional efforts on operational excellence and external costs Operational excellence Renewal of long-haul fleet Fleet densification Smarter processes Activity by activity benchmarking Point-to-point Cargo Restructuring Smaller underperforming business units G&A Procurement: make or buy Fleet optimization IT and overheads External cost reduction Labor costs and productivity Amendments to Collective Labor Agreements: productivity and flexibility for growth Internal mobility as process change enabler 41
42 Agenda Conclusion of Transform 2015 Update on Perform 2020 Key growth initiatives Strict framework of financial discipline Deployment of cost reduction initiatives at Air France Deployment of cost reduction initiatives at KLM 42


43 Air France approach to Perform 2020 Perform 2020 plans defined per business area, along a common framework Bottom-up workshops per business area : bring additional ideas and refine initial plans Early launch of crossfunctional measures to secure 2015 result General wage increase freeze for all categories of staff New Voluntary Departure Plan Procurement actions Stricter capacity discipline Reduction of investments 43
44 Air France: phasing of cost reduction plan Reducing the cost base by an average of -1.5% per year means 650m net cost savings by driven by Transform 2015 momentum Perform 2020 schedule of cost saving initiatives ( million) projects under review 65% of savings already identified Ongoing/identified projects Projects to identify 44
45 Main Air France 2015 initiatives Main actions already implemented Additional actions recently initiated Full impact of 2014 Voluntary Departure Plans Capacity discipline Further cargo restructuring (phase out of B747-F) Further restructuring of point-to-point network Launch of new Medium-Haul offering Extension of general pay freeze New Voluntary Departure Plan targeting 800 FTEs Reinforced capacity discipline New procurement actions Reduction of investment plan 45
46 Air France initiatives generate cost reductions across all areas Transform 2015 carry over Groupwide G&A reduction Fleet renewal Ground purchasing Large projects 2015 VDP Point-to-point restructuring Pilot productivity Cabin crew CLA Maintenance infrastructures Medium-size projects AF Full freighter fleet reduction Distribution costs Passenger sales effectiveness Small projects Finalization of Transform 2015 labor cost measures Operational excellence External cost reduction Restructuring Labor cost and productivity 46
47 Key Air France projects under implementation Passenger business Ground process automation Self-boarding Automatic baggage drop-off Point-to-point restructuring Single Hop! Air France business unit Network restructuring and capacity reduction Voluntary Departure Plan targeting French stations Maintenance business Optimization of maintenance facilities Change in internal vs external workload allocation Process optimization and shorter engine turnaround times 47
48 Perform 2020 timeline for Air France Works council: new 2015 measures Internal communication initiatives Continued Perform 2020 bottom-up working groups Task-setting per cluster at 2017 horizon Union elections 22 January 2015 February-March 2015 Presentation of Perform 2020 projects to works councils, including social consequences of business rationalization (examples: CLA amendments and potential FTE reduction) Negotiations with all categories of staff in parallel with progressive implementation of Perform 2020 measures April-May 2015 May to October
49 Agenda Conclusion of Transform 2015 Update on Perform 2020 Key growth initiatives Strict framework of financial discipline Deployment of cost reduction initiatives at Air France Deployment of cost reduction initiatives at KLM 49


50 KLM approach to Perform 2020 Our vision Inspirational view of our end-point Supported by specific strategic objectives & targets Our transformation agenda Concrete projects to reach our vision & strategic objectives Needs to balance between Funding the Journey and transformation projects" Our flight plan 2015 Our concrete management agenda & targets for this year As such, subset of the Transformation agenda Becoming Europe's most customer centric, innovative and efficient network carrier Customer- Centric Innovative Efficient Network Carrier Supported by Highly Engaged Organization 50


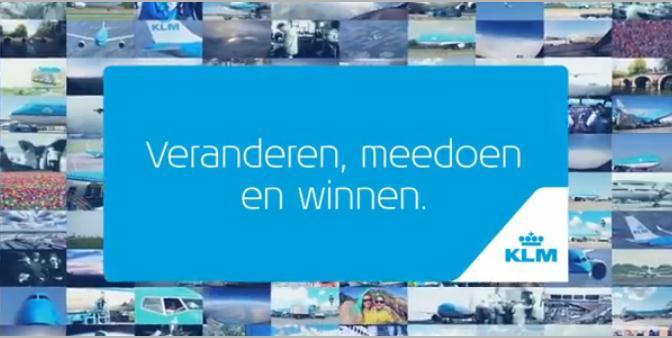
51 Sense of urgency created amongst KLM staff Change, participate and win 51


52 Short-term KLM initiatives within Perform 2020 framework Investments Labour & Organization Suppliers Other initiatives Bottom-up 52
53 KLM: phasing of cost reduction plan Reducing the cost base by an average of -1.5% per year means 390m cost savings by : funding the journey short-term projects and start of Transformation Perform 2020 schedule of cost saving initiatives ( million) : Winning in the mid term, execution of transformation Ongoing/identified projects Projects to identify 53
54 KLM: initiatives generate cost reductions across all areas Large projects Medium-size projects Small projects Cargo Restructuring CLA negotiations (2015 impact) Fleet renewal (2016 impact) CLA negotiations (2016 impact) Operational excellence Fleet renewal (2017 impact) CLA negotiations (2017 impact) Distribution cost High performance organization Passenger sales effectiveness Operational excellence External cost reduction Restructuring Labor cost and productivity 54

55 KLM: examples of major transformation projects Coordinated by a transformation office High performance organization Operational excellence De-layer organization by optimizing span of control Optimize/centralize support functions (incl. minimize waste) Behavior and performance reboot Structurally & integrally improve operational performance related to customer demand Achieve excellent performance in operations simultaneously financially and operationally Optimize our workplace for productivity and engagement 55

56 Customer centricity as core KLM value 56
57 Status of KLM Collective Labor Agreement negotiations Negotiations started on 18 December 2014 Framework established with most unions Framework finalized with Cockpit & Ground unions No consensus on framework with Cabin unions; negotiations continue without framework Current focus on detailing commitment of unions and specific measures for the first months In parallel, discussions to address specific restructuring plans: cargo, airframe maintenance 57
58 In conclusion Development initiatives moving at full speed Rigorous approach to investments, capacity and cost actions Timeline adapted to social context of each airline A de-risked business and a deleveraged balance sheet, delivering healthy ROCE 58

59 Outlook
60 Outlook Full Year 2015 targets The significant upside expected on the fuel bill could be almost completely offset by unit revenue pressure and negative currency impacts Further cost reduction: 1 to 1.3% unit cost reduction, equivalent to 250m to 350m Net debt around 5 billion euros at end 2015 Medium-term objectives Adjusted net debt / EBITDAR ratio around 2.5 by end 2017 Base businesses to consistently generate annual positive free cash flow EBITDAR growth target no longer applicable in view of significant fall in fuel price and implications on unit revenue development 60
61 Appendix
62 Fourth Quarter 2014: Contribution by business segment Revenue ( bn) Reported Change (%) Change Like for like (%) Op. result ( m) Change ( m) Change Like for like ( m) Passenger 79% % -1.4% Cargo 11% % -2.8% Maintenance 5% % +11.6% Other 5% % +9.3% Total % -0.5%
63 Fourth Quarter passenger unit revenue by network Like-for-like Medium-haul point-to-point -15.6% ASK -11.7% RPK 8.4% RASK Total medium-haul North America Medium-haul hubs -1.9% ASK 1.0% RPK 0.9% RASK 1.9% ASK 2.5% RPK 2.7% RASK 2.7% ASK 4.6% RPK -0.9% RASK Latin America Africa and Middle East Asia 4.1% ASK 3.5% RPK -8.0% RASK -2.9% ASK -4.1% RPK -2.6% RASK -0.6% ASK -0.3% RPK -3.5% RASK Total long-haul Caribbean & Indian Ocean Total 0.2% ASK 0.6% RPK -1.7% RASK -1.3% ASK 1.4% RPK 2.2% RASK -0.2% ASK 0.7% RPK -1.1% RASK *: Q4 one-offs taken at central level, no allocation to specific region 63
64 Cargo capacity and unit revenue per quarter 2012 Q Q Q Q Q Q Q Q Capacity -1.5% -0.9% -0.9% -2.0% -0.5% -0.3% -3.5% -4.1% -4.2% Excluding strike +1.1% RATK ex-currency -1.0% -1.0% ~-2.1% -1.2% -3.8% -4.8% -5.2% -5.7% -4.2% Excluding strike -0.9% 64
65 Fourth Quarter: Change in operating costs m Reported change Change at constant currency Like-for -like (4) 30% Total employee costs including temps 1, % +1.1% 25% Supplier costs (1) excluding fuel and purchasing of maintenance services and parts 1, % +1.0% 12% Aircraft costs (2) % +3.6% 5% Purchasing of maintenance services and parts % +7.0% Operating costs ex-fuel (3) 4, % +2.0% 0.7% 26% Fuel 1, % -3.3% -3.3% Grand total of operating costs 6, % +0.5% -0.4% Capacity (EASK) +0.5% (1)Catering, handling, commercial and distribution charges, landing fees and air-route charges, other external expenses, excluding temps (2) Chartering (capacity purchases), aircraft operating leases, amortization, depreciation and provisions (3)Including other taxes, other revenues, other income and expenses (4)Like-for-like: at constant currency, excluding strike impact and Q4 one-offs 65
66 Impact of pilot strike on Full Year 2014 profit and loss statement 14 days of strike from 15 to 28 September, plus one day affected by cancellations Activity: ~-4.75bn EASK Traffic revenues: ~- 495m Passenger -4,249m ASK Cargo -213m ATK Passenger Cargo -18% -16% -44 Strike impact on September activity -451 Net Costs*: ~- 70m Operating result: ~- 425m 22 7 Passenger Cargo -24 Maintenance Other Passenger Cargo Maintenance Other -372 * Including impact on intersegment revenues (eliminated at group level) 66


67 Other businesses: Catering Increase in third party revenues excluding impact of disposal of Air Chef Examples: Jet Airways, US Airways, Cathay Pacific Improvement in profitability while continuing to reduce cost for internal customers Emphasis on quality of service Catering FY 14 FY 13 Change Like-for-Like* Total revenue % +2.1% Further extension of operations Launch of operations in Sao Paulo Extension with partners in Belgium, Canada, Chile and DR Congo Third party revenue Operating result % +5.9% % +20.8% * Like-for-like: FY 2013 restated for sale of Air Chef and excluding strike impact 67
68 Full Year 2014: Adjusted net result Calculation of Full Year 2014 adjusted net result, in million euros Net result, group share Adjusted net result Discontinued operations (CityJet) Non current result Asset valuation -880 Value of hedging portfolio Legal modification NL pension plan: Amadeus: -187 Impairment Cargo fleet: De-recognition deferred tax asset: + 89 Deferred tax modification on pension plans: +206 Unrealized foreign exchange result: +122 Other: + 18 Other:
69 Adapting capex levels to cash generation million Operating Free cash Flow Operating Free cash Flow excluding strike Operating Free cash Flow VDP Operating Free cash Flow VDP VDP 183 Strike 113 VDP 154 VDP 154 Change in WCR Cash flow before VDP and change in WCR Net Capex Net Capex 898 1,311 Net Capex 941 1,039 Net Capex 1, Operating free cash flow: net cash flow from operating activities less net capex on tangibles and intangibles. All amounts excluding discontinued operations. See definition in press release 69
70 Debt reimbursement profile at 31 December 2014* % convertible bond ( 661m) Maturity: April 2015 Conv. price: % convertible bond ( 550m) Maturity: Feb Put: Feb Conv. price: % convertible bond ( 420m) Maturity: April nd put: April 2016 Conv. price: Convertible bonds Plain vanilla bonds October 2016: Air France-KLM 6.75% ( 700m) January 2018: Air France-KLM 6.25% ( 500m) June 2021: Air France-KLM 3.875% ( 600m) Other long-term debt mainly asset-backed (net of deposits ) and beyond * In millions, net of deposits on financial leases and excluding KLM perpetual debt ( 564m) 70
71 Full Year 2014 Results 19 February 2015
Third Quarter 2014 Results. 29 October 2014
 Third Quarter 2014 Results 29 October 2014 Highlights of the Third Quarter Operating environment Air France-KLM Economic environment remains weak Further currency volatility affecting revenues and results
FIRST QUARTER 2017 RESULTS. 4 May 2017
 FIRST QUARTER 2017 RESULTS 4 May 2017 A resilient start of the year, traffic up 4.2% 20.9 million passengers carried, up 5.2%, traffic (RPK) up 4.2%, capacity (ASK) up 3.3% and load factor up 0.7pts Confirmation
FIRST HALF 2016 RESULTS. 27 July 2016
 FIRST HALF 2016 RESULTS 27 July 2016 Highlights of the Second Quarter 2016 Environment Operations Financial highlights High level of geopolitical uncertainties, including Brexit Terrorist attacks in Europe
Agenda. Conclusion of Transform Key Perform 2020 initiatives. Perform 2020 financial framework. Information meeting
 Information meeting Agenda Conclusion of Transform 2015 Key Perform 2020 initiatives Perform 2020 financial framework 2 Transform 2015: first phase of group turnaround accomplished Strict capacity discipline
THIRD QUARTER 2016 RESULTS. 3 November 2016
 THIRD QUARTER 2016 RESULTS 3 November 2016 Highlights of the Third Quarter 2016 Environment Operations Financial highlights Strong increase in airline industry capacity Terrorist attacks in Europe resulting
First Half 2013 Results. 16 mai 2013
 First Half 2013 Results 16 mai 2013 26 July 2013 Results Increasing effects of Transform 2015 Highlights of the First Half A difficult global economic environment Transform 2015 plan roll-out on track
Full Year 2017 RESULTS 16 th of February 2018
 Full Year 2017 RESULTS 16 th of February 2018 2017 FULL YEAR 2017 MAIN ACHIEVEMENTS Robust traffic statistics Strong Full Year results +5.6% +2.0% 42% +101% 1,049 1,488 347 696 FY 2016 FY 2017 Passengers
FY 2013 and Q results. Increasing effects of Transform 2015
 FY 2013 and Q1 2014 results Increasing effects of Transform 2015 Key data FY 13 Change (1) Q1-14 Change (2) Revenue ( bn) 25.52 +2,3% (3) 5.55 +0.0% (4) EBITDA (5) ( m) 1,855 +461m -50 +66m Operating result
1.3% millionn euros. Net debt of 5.4 improvement. euros to. Financial Year. the Air. operating. equipped. ness and. also focus on.
 25 th July 2014 Financial Year 2014: First Half results SECOND QUARTER Revenues of 6.45 billion euros, upp 1.7% like-for-like; passenger unit revenue up 1.3% at constant currency thanks to strict capacity
THIRD QUARTER 2017 RESULTS 3 rd of November 2017
 THIRD QUARTER 2017 RESULTS 3 rd of November 2017 2017 THIRD QUARTER 2017: STRONG OPERATING RESULT DRIVEN BY SOLID TRAFFIC AND INCREASE IN UNIT REVENUE Robust Group traffic statistics +5.1% +4.1% Strong
AIR FRANCE-KLM RESULTS PRESENTATION
 AIR FRANCE-KLM RESULTS PRESENTATION Results as at 30 th of June 2018 1 st August 2018 SECOND QUARTER 2018: KEY HIGHLIGHTS Leveraging ongoing solid demand +0.8% +1.7% Stable operating result before strike
FULL YEAR 2015 RESULTS. 18 February 2016
 FULL YEAR 2015 RESULTS 18 February 2016 Results Highlights of the Full Year 2015 Environment Operations Financial highlights Steep decrease in fuel price Ongoing pressure on unit revenues Weak economic
FULL YEAR 2015 RESULTS. 18 February 2016
 FULL YEAR 2015 RESULTS 18 February 2016 Results Highlights of the Full Year 2015 Environment Operations Financial highlights Steep decrease in fuel price Ongoing pressure on unit revenues Weak economic
Information meeting. September 2011
 Information meeting September 2011 Full Year 2010-11 key data April 2010-March 2011 Revenues in billions Operating result in millions 77% Passenger 18.10 +11.3% -44 +874 13% Cargo 3.16 +29.5% +69 +505
Information meeting. 1 st September 2011
 Information meeting 1 st September 2011 Full Year 2010-11 key data April 2010-March 2011 Revenues in billions Operating result in millions 77% Passenger 18.10 +11.3% -44 +874 13% Cargo 3.16 +29.5% +69
Information meeting. 12 September 2011
 Information meeting 12 September 2011 Full Year 2010-11 key data April 2010-March 2011 Revenues in billions Operating result in millions 77% Passenger 18.10 +11.3% -44 +874 13% Cargo 3.16 +29.5% +69 +505
million euros to 5.3 billion euros
 0 th February 014 FULL YEAR 0 RESULTS 0 RESULTS ON TRACK DESPITE CHALLENGING CONTEXT C T Revenues up.3% at constant currency to 5.5 billion euros EBITDA 1 improvement of 461 million euros to 1,855 million
Third Quarter Results
 1 Third Quarter 2010-11 Results Highlights of the Third Quarter Passenger business affected by significant disruptions Dynamic cargo activity Strong improvement in results Decline in ex-fuel unit costs
1 st Quarter Results FY
 1 st Quarter Results FY 2004-05 05 Q1 Highlights p Context 8Improving economic context 8Strong economic growth in Americas and Asia 8Modest economic recovery in Europe 8Soaring fuel prices 8IPE Brent up
20 February 2019 FULL YEAR 2018 RESULTS Resilient results despite the impact of strikes and fuel bill increase
 20 February 2019 FULL YEAR 2018 RESULTS Resilient results despite the impact of strikes and fuel bill increase FULL YEAR 2018 More than 100 million passengers carried, the leading European group for long-haul
Information meeting. Full Year results. June 2011
 Information meeting Full Year 2010-11 results 1 June 2011 Agenda 2010-11: Recovery in activity and return to profitability 2011: Ongoing actions and reinforced strategic advantages 2 2010-11: Strong improvement
31 October 2018 RESULTS AS AT 30 SEPTEMBER 2018 Good resilience of operating result thanks to revenue performance and unit cost reduction
 31 October 2018 RESULTS AS AT 30 SEPTEMBER 2018 Good resilience of operating result thanks to revenue performance and unit cost reduction THIRD QUARTER 2018 Air France-KLM commercial teams delivered a
THIRD QUARTER 2017 RESULTS STRONG OPERATING RESULT DRIVEN BY SOLID TRAFFIC AND INCREASE IN UNIT REVENUE
 3 rd of November 2017 THIRD QUARTER 2017 RESULTS STRONG OPERATING RESULT DRIVEN BY SOLID TRAFFIC AND INCREASE IN UNIT REVENUE THIRD QUARTER 2017 The operating result stands at 1,022 million euros, up 38.7%
First Half 2017 results Result improvement driven by solid traffic and unit revenue performance
 28 th July 2017 2017 results Result improvement driven by solid traffic and unit revenue performance FIRST HALF 2017 Robust traffic resulting in an improved load factor, up 1.4 pts compared to last year
FIRST HALF 2017 RESULTS 28 July 2017
 FIRST HALF 2017 RESULTS 28 July 2017 2017 SECOND QUARTER 2017: IMPROVING RESULT DRIVEN BY SOLID TRAFFIC AND UNIT REVENUE PERFORMANCE +7.5% Second Quarter 2017: robust Group traffic statistics +5.1% +7.5%
FULL YEAR 2017 RESULTS STRONG OPERATING RESULT AND SIGNIFICANT STRENGTHENING OF THE FINANCIAL STRUCTURE
 16 February 2018 FULL YEAR 2017 RESULTS STRONG OPERATING RESULT AND SIGNIFICANT STRENGTHENING OF THE FINANCIAL STRUCTURE FULL YEAR 2017 Robust traffic statistics with 99 million passengers carried, up
RESULTS AS AT 30 th JUNE 2018 Positive unit revenue securing stable operating result excluding strikes
 1 st August 2018 RESULTS AS AT 30 th JUNE 2018 Positive unit revenue securing stable operating result excluding strikes SECOND QUARTER 2018 Air France-KLM leveraged the solid ongoing demand to generate
Information meeting. Third quarter results. March 2011
 Information meeting Third quarter 2010-11 results 1 March 2011 Agenda 2010-11: recovery in activity and return to profitability Current issues Air France-KLM ambitions for the next three years 2 All businesses
FY key data Passenger. Cargo. Maintenance. Other. Operating result in m. Revenues in bn -10.4% 78% 11%
 Information meeting FY 2009-10 key data Revenues in bn Operating result in m 78% Passenger 16.3-13.6% -918 11% Cargo 2.4-27.8% -436 5% Maintenance 1.0-4.0% +81 6% Other 1.3-12 -10.4% 2 Our industry is
First Quarter Results August 31 st, 2006
 First Quarter Results 2006-07 August 31 st, 2006 Key features of the First Quarter Market context Sustained global economic growth, and a recovery in Europe Average jet fuel price of 691 $/t, up 25% year-on-year
Analysts and Investors conference call. Q results. 15 May 2013
 Analysts and Investors conference call Q1 2013 results 15 May 2013 Management summary Key messages of Q1 2013 +6% +9% +3.3%p. Q1 2013 operational KPIs are in line with 109.7 116.2 6.5 7.1 82.3 85.6 expectations,
2012 Result. Mika Vehviläinen CEO
 2012 Result Mika Vehviläinen CEO 1 Agenda Market environment in Q4 Business performance and strategy execution Outlook Financials 2 Market Environment According to IATA, Global air travel continues to
FINANCIAL YEAR Key data
 March 8 th, 2012 FINANCIAL YEAR 2011 2011: A TOUGH YEAR Economic environment and geopolitical crises weigh on activity Insufficient level of unit revenues to absorb higher fuel bill Revenues up 4.5% to
UBS 14 th Global Emerging Markets Conference. New York, November 2016
 UBS 14 th Global Emerging Markets Conference New York, November 2016 This presentation may include forward-looking comments regarding the Company s business outlook and anticipated financial and operating
4.5% Decline in unit Improvement June 2011) (restructuring billion euros. Roll out in line. Key data FIRST HALF 5.2%
 (restructuring billion euros. Roll out in line. Key data FIRST HALF 5.2%") July 30th 2012 FINANCIAL YEAR 2012 SECOND QUARTER 4.5% rise in revenues to 6.5 billionn euros Decline in unit costs on a constantt currency and fuel price basis Improvement in operating result (-66 million
July 30th 2012 FINANCIAL YEAR 2012 SECOND QUARTER 4.5% rise in revenues to 6.5 billionn euros Decline in unit costs on a constantt currency and fuel price basis Improvement in operating result (-66 million
Second Quarter to 30th September
 22 nd November 2007 FINANCIAL YEAR 2007-08 EXCELLENT SECOND QUARTER Operating income up 27.6% to 725 million euros Adjusted 1 operating margin of 12%, up 2 points Net income up 97% to 736 million euros
IAG results presentation. Quarter One th May 2018
 IAG results presentation Quarter One 2018 4 th May 2018 Highlights Willie Walsh, Chief Executive Officer Highlights Another strong quarter performance with an operating profit of 280m (5.6% margin, +2.3pts)
Thank you for participating in the financial results for fiscal 2014.
 Thank you for participating in the financial results for fiscal 2014. ANA HOLDINGS strongly believes that safety is the most important principle of our air transportation business. The expansion of slots
SAS Group Q Teleconference
 SAS Group Q4 2012 Teleconference December 12, 2012 1 Break-even result in 2012 despite 1.6 bn SEK higher fuel cost 23 MSEK EBT (before non-recurring items) despite 1.6 bn SEK higher fuel cost Positive
Fourth Quarter and Full Year 2009 Results Presentation January 27, 2010
 Fourth Quarter and Full Year 2009 Results Presentation January 27, 2010 This presentation may include forward-looking comments regarding the Company s business outlook and anticipated financial and operating
Analyst and Investor Conference Call Q Ulrik Svensson, CFO and Member of the Executive Board
 Analyst and Investor Conference Call Q2 2017 Ulrik Svensson, CFO and Member of the Executive Board Frankfurt, 2 August 2017 Disclaimer The information herein is based on publicly available information.
Air Berlin PLC AGM 06 June 2013 London
 Air Berlin PLC AGM 06 June 2013 London airberlin a strong European carrier Market position as of 31 December 2012 No. 2 in core market: Germany / Austria / Switzerland No. 7 in Europe with 33.3 m guests
SAS AB Q December 2018
 SAS AB Q4 2018 4 December 2018 Q4 financial highlights Q4 POSITIVES Q4-18 CHANGE VS. Q4-17 Record number of passengers Total revenue up SEK 1bn vs. LY Yield (nominal) up 5.1% vs. LY RASK (nominal) up 7.0%
SAS Q3 2017/ August 2018
 SAS Q3 2017/2018 31 August 2018 Strong earnings in peak season POSITIVES Record number of passengers Total revenue up MSEK 936 vs. LY Currency adjusted yield up 1.1% vs. LY EB point sale up 27% vs. LY
SAS Group Q2 2012/13. Q2 Restructuring programme moving KPIs in the right direction
 SAS Group Q2 2012/13 1 Q2 Restructuring programme moving KPIs in the right direction Operating revenues +1.6%* Yield improvement of +2.7%* Forceful implementation of 4XNG plan: Unit cost down by 10.7%
Santander 22 nd Annual Latin American Conference. Cancun, January 2018
 Santander 22 nd Annual Latin American Conference Cancun, January 2018 This presentation may include forward-looking comments regarding the Company s business outlook and anticipated financial and operating
Finnair Q Result
 17 August 2016 CEO Pekka Vauramo CFO Pekka Vähähyyppä Finnair Q2 2016 Result 1 Highlights of the second quarter The seventh consecutive quarter of profit improvement Fukuoka & Guangzhou route openings
Finnair Q Result
 Finnair Q1 2015 Result 7 May 2015 CEO Pekka Vauramo, Interim CFO Mika Stirkkinen 1 Turbulent market environment The weakness of the Finnish economy continued to be reflected in the demand in the first
SAS Group Presentation Carnegie, May 22, 2012 Sture Stölen, Head of IR
 SAS Group Presentation Carnegie, May 22, 2012 Sture Stölen, Head of IR 1 This is the SAS Group 128 destinations 27,2 million passengers 28 new routes to be launched 2012 1,085 daily flights Revenues 2011,
J.P. Morgan 2019 Global Emerging Markets Corporate Conference. Miami, February 2019
 J.P. Morgan 2019 Global Emerging Markets Corporate Conference Miami, February 2019 This presentation may include forward-looking comments regarding the Company s business outlook and anticipated financial
Adjusted net income of $115 million versus an adjusted net loss of $7 million in the second quarter of 2012, an improvement of $122 million
 Air Canada Reports Record Second Quarter 2013 Results Highest Adjusted Net Income, Operating Income and EBITDAR Results for Second Quarter in Air Canada s History Adjusted net income of $115 million versus
SAS Q2 2017/2018 TELECONFERENCE
 SAS Q2 2017/2018 TELECONFERENCE 30 May 2018 Earnings as expected despite negative currency effect POSITIVES + Total revenue up MSEK 73 vs. LY + Currency adjusted yield up 0.6% vs. LY + EB-point sale revenue
Fourth Quarter and Full Year 2011 Results Presentation. February 1, 2012
 Fourth Quarter and Full Year 2011 Results Presentation February 1, 2012 This presentation may include forward-looking comments regarding the Company s business outlook and anticipated financial and operating
AIR CANADA REPORTS 2010 THIRD QUARTER RESULTS; Operating Income improved $259 million or 381 per cent from previous year s quarter
 AIR CANADA REPORTS 2010 THIRD QUARTER RESULTS; Operating Income improved $259 million or 381 per cent from previous year s quarter MONTRÉAL, November 4, 2010 Air Canada today reported operating income
Fourth Quarter 2006 Results Presentation February 15, 2007
 Fourth Quarter 2006 Results Presentation February 15, 2007 This presentation may include forward-looking comments regarding the Company s business outlook and anticipated financial and operating results.
Copa Holdings Reports Fourth Quarter and Full Year 2007 Results
 Copa Holdings Reports Fourth Quarter and Full Year 2007 Results Panama City, Panama --- February 21, 2008. Copa Holdings, S.A. (NYSE: CPA), parent company of Copa Airlines and Aero Republica, today announced
Interim results. 11 May 2010
 Interim results 11 May 2010 Introduction Andy Harrison Chief Executive Officer Strong performance despite disruption Improvement in revenue, margins and cash Continued network improvement has driven better
Agenda. Introduction Christine Ourmières-Widener. Financial Review Ian Milne. Performance Update & Outlook Christine Ourmières-Widener
 1 Agenda Introduction Christine Ourmières-Widener Financial Review Ian Milne Performance Update & Outlook Christine Ourmières-Widener 2 Strategy of regional connectivity is working Important to UK economy,
Information meeting. Jean-Cyril Spinetta Chairman and CEO
 Information meeting Jean-Cyril Spinetta Chairman and CEO Forward-looking statements The information herein contains forward-looking statements about Air France-KLM and its business. These forward-looking
PRESS RELEASE Financial Results. Rising passenger traffic at 12.5m Exceeding 1bn in consolidated revenue
 PRESS RELEASE 2016 Financial Results Rising passenger traffic at 12.5m Exceeding 1bn in consolidated revenue Kifissia, 23 March 2017 AEGEAN reports full year 2016 results with consolidated revenue at 1,020m,
OPERATING AND FINANCIAL HIGHLIGHTS
 Copa Holdings Reports Financial Results for the Fourth Quarter of 2015 Excluding special items, adjusted net income came in at $31.7 million, or EPS of $0.73 per share Panama City, Panama --- February
Copa Holdings Reports Net Income of $49.9 million and EPS of $1.18 for the Second Quarter of 2018
 Copa Holdings Reports Net Income of $49.9 million and EPS of $1.18 for the Second Quarter of 2018 Panama City, Panama --- Aug 8, 2018. Copa Holdings, S.A. (NYSE: CPA), today announced financial results
Bank of America Merrill Lynch Emerging Markets Corporate Conference. Miami, June 2016
 Bank of America Merrill Lynch Emerging Markets Corporate Conference Miami, June 2016 This presentation may include forward-looking comments regarding the Company s business outlook and anticipated financial
OPERATING AND FINANCIAL HIGHLIGHTS. Subsequent Events
 Copa Holdings Reports Financial Results for the First Quarter of 2016 Excluding special items, adjusted net income came in at US$69.9 million, or EPS of US$1.66 per share Panama City, Panama --- May 5,
OPERATING AND FINANCIAL HIGHLIGHTS. Subsequent Events
 Copa Holdings Reports Net Income of $103.8 million and EPS of $2.45 for the Third Quarter of 2017 Excluding special items, adjusted net income came in at $100.8 million, or EPS of $2.38 per share Panama
Deutsche Bank 16 th Annual Global Emerging Markets. New York, September 2017
 Deutsche Bank 16 th Annual Global Emerging Markets New York, September 2017 This presentation may include forward-looking comments regarding the Company s business outlook and anticipated financial and
Finnair Q Result
 Finnair Q2 2015 Result 14 August 2015 CEO Pekka Vauramo, Interim CFO Mika Stirkkinen 1 Market environment shows signs of improvement There were signs of a recovery in the demand for consumer and business
OPERATING AND FINANCIAL HIGHLIGHTS SUBSEQUENT EVENTS
 Copa Holdings Reports Net Income of US$6.2 Million and EPS of US$0.14 for the Third Quarter of 2015 Excluding special items, adjusted net income came in at $37.4 million, or EPS of $0.85 per share Panama
Heathrow (SP) Limited
 Limited") Draft v2.0 10 Feb Heathrow (SP) Limited Results for year ended 31 December 2013 24 February 2014 Strong operational and financial performance in 2013 Passenger satisfaction at record high and over 72 million
Draft v2.0 10 Feb Heathrow (SP) Limited Results for year ended 31 December 2013 24 February 2014 Strong operational and financial performance in 2013 Passenger satisfaction at record high and over 72 million
Analyst and Investor Conference Call Q Frankfurt, 25 October 2017
 Analyst and Investor Conference Call Q3 2017 Frankfurt, 25 October 2017 Disclaimer The information herein is based on publicly available information. It has been prepared by the Company solely for use
Managing through disruption
 28 July 2016 Third quarter results for the three months ended 30 June 2016 Managing through disruption 3 months ended Like-for-like (ii) m (unless otherwise stated) Change 30 June 2016 30 June 2015 change
FY RESULTS ROADSHOW PRESENTATION
 1 FY RESULTS 2014 ROADSHOW PRESENTATION FY 2014 HIGHLIGHTS FOCUS ON EXECUTION 2 Strong financial performance Revenues: 61 bn, +5% vs. 2013 EBIT* before one off: 4.1 bn, +15% vs. 2013 EPS: 2.99, +61% vs.
SAS Q1 2016/
 SAS Q1 2016/2017 08.03.2017 Weak Q1 as expected new structural actions underway Q1 in summary Positives + Currency adjusted passenger revenue up 5% + Strong development of ancillary revenues + Passengers
Part 1 Performance Highlights. Part 2 Business Overview. Part 3 Financial Review
 August 216 1 Part 1 Performance Highlights Part 2 Business Overview Part 3 Financial Review Part 4 Outlook 2 Under IFRS 3 Part 1 Performance Highlights Performance Highlights - Key Operational Metrics
QANTAS HALF YEAR 2015 FINANCIAL RESULTS 1
 QANTAS HALF YEAR 2015 FINANCIAL RESULTS 1 Key points: Underlying Profit Before Tax: $367 million Statutory Profit After Tax: $206 million Transformation benefits: $374 million Comparable unit cost reduction:
OPERATING AND FINANCIAL HIGHLIGHTS SUBSEQUENT EVENTS
 Copa Holdings Reports Financial Results for the Third Quarter of 2016 Excluding special items, adjusted net income came in at $55.3 million, or adjusted EPS of $1.30 per share Panama City, Panama --- November
Santander 20 th Annual Latin America CEO Conference Cancun, January 2016
 Santander 20 th Annual Latin America CEO Conference Cancun, January 2016 This presentation may include forward-looking comments regarding the Company s business outlook and anticipated financial and operating
Montie Brewer, President and CEO Joshua Koshy, Executive VP and CFO UBS Transport Conference
 Montie Brewer, President and CEO Joshua Koshy, Executive VP and CFO UBS Transport Conference 1 London, England September 17, 2007 Agenda Strongly positioned international airline Investment proposition
Norwegian Air Shuttle ASA
 Norwegian Air Shuttle ASA Q4 2017 Presentation 15 February 2018 Highlights Q4 2017 Added one 737-800 and two 787-9s to operations Financed the first aircraft with a combination of UKEF and JOLCO Agreed
E190 REPLACEMENT & FLEET UPDATE JULY 11, 2018
 1 E190 REPLACEMENT & FLEET UPDATE JULY 11, 2018 SAFE HARBOR This presentation contains forward-looking statements within the meaning of the Private Securities Litigation Reform Act of 1995, Section 27A
Air China Limited Annual Results. March Under IFRS
 Air China Limited 21 Annual Results Under IFRS March 211 Agenda Part 1 Highlights Part 2 Business Overview Part 3 Financial Overview Part 4 Outlook 2 Part 1 Highlights Steady Economic Growth; Asia Pacific
Vueling Airlines 2009 Fourth-Quarter, Full-Year Financial Results. The 100-milion turnaround story
 Vueling Airlines 2009 Fourth-Quarter, Full-Year Financial Results The 100-milion turnaround story Barcelona, February 23 rd, 2009 Introduction Revenues Operations and costs Outlook for 2010 Vueling has
IAG results presentation. Quarter Three st October 2014
 IAG results presentation Quarter Three 2014 31 st October 2014 Q3 financial summary OPERATING PROFIT TOTAL UNIT REVENUE PAX UNIT REVENUE 900m (reported, pre-exceptional items) -1.9% (constant FX) -0.9%
INVESTOR PRESENTATION. Imperial Capital Global Opportunities Conference September 2015
 INVESTOR PRESENTATION Imperial Capital Global Opportunities Conference September 2015 Forward-looking Statements This presentation contains forward-looking statements within the meaning of the Private
Air China Limited Interim Results. August Under IFRS
 Air China Limited 21 Interim Results Under IFRS August 21 1 Agenda 21 Interim Results Overview Business Overview Financial Overview Outlook 2 2 2 21 Interim Results 3 21 Interim Results Overview 4 4 4
Bank of America Merrill Lynch 2018 Emerging Markets Corporate Credit Conference. Miami, May 2018
 Bank of America Merrill Lynch 2018 Emerging Markets Corporate Credit Conference Miami, May 2018 This presentation may include forward-looking comments regarding the Company s business outlook and anticipated
OPERATING AND FINANCIAL HIGHLIGHTS
 Copa Holdings Reports Financial Results for the Fourth Quarter of 2018 Excluding special items, adjusted net profit came in at $44.0 million, or Adjusted EPS of $1.04 Panama City, Panama --- February 13,
Strengthened SAS delivers positive result in Q3
 SAS Group Q3 2012/13 1 Strengthened SAS delivers positive result in Q3 Passenger revenues up 5.3% (FX adjusted) 32 new routes introduced Capacity up 7.7% Traffic up 5.6% Yield down 0.6% Restructuring status
SAS Q1 2017/2018. Q1 in Summary: Improved earnings CHANGE VS. Q1 FY17
 SAS 2017/2018 27.02.2018 in Summary: Improved earnings POSITIVES + Passenger revenue up 1% (FX adj.) + Cargo and EB-point sale revenue increased MSEK 109 + Efficiency program delivered MSEK 165 + Positive
Finnair Group Interim Report 1 January 30 June 2008
 Finnair Group Interim Report 1 January 30 June 2008 1 08/08/2008 Presentation name / Author Airline industry at a historical turning point Fuel price has a stranglehold on the business Average ticket prices
Fourth Quarter & FY 2008 Results Presentation January 28, 2008
 Fourth Quarter & FY 2008 Results Presentation January 28, 2008 This presentation may include forward-looking comments regarding the Company s business outlook and anticipated financial and operating results.
2010 ANNUAL GENERAL MEETING. May 4, 2010
 2010 ANNUAL GENERAL MEETING May 4, 2010 FORWARD-LOOKING STATEMENT Certain information in this presentation and statements made during this presentation, including any question and answer session, may contain
OPERATING AND FINANCIAL HIGHLIGHTS. Subsequent Events
 Copa Holdings Reports Net Income of US$113.1 Million and EPS of US$2.57 for the First Quarter of 2015 Excluding special items, adjusted net income came in at US$106.0 million, or EPS of US$2.41 per share
THIRD QUARTER OPERATING PROFIT UP 13% TO $330 MILLION
 13 February 2018 Page 1 of 7 ` No. 01/18 13 February 2018 THIRD QUARTER OPERATING PROFIT UP 13% TO $330 MILLION Higher carriage and load factors for all passenger airlines Strong earnings for SIA Cargo
Azul Increases Net Income by R$152 Million in 1Q18 Operating margin was a record 12.5% despite the 21% increase in oil year over year
 Azul Increases Net Income by R$152 Million in 1Q18 Operating margin was a record 12.5% despite the 21% increase in oil year over year São Paulo, May 10, Azul S.A., Azul, (B3:AZUL4, NYSE:AZUL) the largest
AIR CANADA REPORTS THIRD QUARTER RESULTS
 AIR CANADA REPORTS THIRD QUARTER RESULTS THIRD QUARTER OVERVIEW Operating income of $112 million compared to operating income of $351 million in the third quarter of 2007. Fuel expense increased 49 per
Gerry Laderman SVP Finance, Procurement and Treasurer
 Gerry Laderman SVP Finance, Procurement and Treasurer Safe Harbor Statement Certain statements included in this release are forward-looking and thus reflect our current expectations and beliefs with respect
OPERATING AND FINANCIAL HIGHLIGHTS
 Copa Holdings Reports Net Income of US$18.6 Million and EPS of US$0.42 for the Second Quarter of 2010 Excluding special items, adjusted net income came in at $26.3 million, or $0.60 per share Panama City,
AIR CANADA REPORTS FULL YEAR AND FOURTH QUARTER 2010 RESULTS
 AIR CANADA REPORTS FULL YEAR AND FOURTH QUARTER 2010 RESULTS Record annual EBITDAR of $1.386 billion, 104 per cent improvement Operating income improvement of $677 million Employees to receive special
Air China Limited 2014 Annual Results Under IFRS
 Air China Limited 2014 Annual Results Under IFRS March 2015 Agenda Part 1 Results Highlights Part 2 Business Overview Part 3 Financial Overview Part 4 Outlook Part 1 Results Highlights Gradual Global Economic