ALBANY COUNTY AIRPORT AUTHORITY
|
|
|
- Martha Harvey
- 5 years ago
- Views:
Transcription

1 ALBANY COUNTY AIRPORT AUTHORITY 2016 Preliminary Operating Budget New York s Tech Valley Airport A component unit of the County of Albany, in the Town of Colonie, New York
2 ALBANY COUNTY AIRPORT AUTHORITY Albany, New York BOARD MEMBERS REV. KENNETH DOYLE Chairman DORSEY M. WHITEHEAD LYON M. GREENBERG, M.D. ANTHONY GORMAN ROBERT S. HITE, Esq. PATRICIA M. REILLY PAULA T. WILKERSON SENIOR STAFF JOHN A. O DONNELL, P.E. Chief Executive Officer WILLIAM J. O REILLY, CPA, CGFM Chief Financial Officer MARGARET HERRMANN Chief Accountant RIMA A. CERRONE Budget & Performance Manager CUSIP #012123XXX
3 ALBANY COUNTY AIRPORT AUTHORITY TABLE OF CONTENTS PAGES 1. TRANSMITTAL LETTER/BUDGET MESSAGE Status of Airline Industry Air Trade Area served by Albany International Airport Status of Albany International Airport Activity Projections for Airline Use and Lease Agreement Airport and Fixed Based Operations Operating Agreements Operating Budget Financial Highlights Airline Rates and Charges Summary GAAP Financial Statements Budget Summary Award Acknowledgments AIRPORT AUTHORITY OVERVIEW Organization Vision, Mission, Goal, Objectives and Values Performance Measures Organizational Strategic Goals Budget Process Summary of Financial Policies Economic Information Albany International Airport Nonstop Scheduled Passenger Service Albany International Airport Property Inventory Comparison of Geographic Distance Average Fare Comparison of Selected Commercial Airports Graph of Air Trade Population Albany, the Heart of Tech Valley Colleges and Universities in the Albany Area Major Private Sector Employers in the Capital Region Graph of Capital Region Unemployment Rate REVENUES Description of Revenues Revenues, Audited 2014, Adopted 2015, Projected 2015, and Budget EXPENSES Summary of Expenses Description of Expense Budget Items Operating Expenses by Category Operating Expenses by Department Expenditures by Line Item AFCO AVPORT S MANAGEMENT, LLC S COST CENTER STRUCTURE Summary of AvPort s Cost Center Structure AvPort s Performance Measurements, 2015/2016 Goals, Objectives and Achievements, and 2016 Summary of Expenses AvPort s Expenditure Budget by Line Items AvPort s Schedule of Salaries and Benefits AvPort s Organizational Chart
4 PAGES 6. MILLION AIR COST CENTER STRUCTURE Summary of Million Air s Cost Center Structure Million Air s Performance Measurements, 2015/2016 Goals, Objectives and Achievements, and 2016 Summary of Expenses Million Air s Expenditure Budget by Line Items Million Air s Schedule of Salaries and Benefits Million Air s Organizational Chart ALBANY COUNTY AIRPORT AUTHORITY (ACAA) COST CENTER STRUCTURE Summary of ACAA Cost Center Structure ACAA s Performance Measurements, 2015/2016 Goals, Objectives and Achievements, and 2015 Summary of Expenses ACAA s Expenditure Budget by Line Items ACAA s Schedule of Salaries and Benefits ACAA s Organizational Chart INDEBTEDNESS Debt Policy Debt Limit Master Bond Resolution Debt Outstanding Debt Issued by the County Schedules of Debt Issued by the Authority and their Purpose Passenger Facility Charges (PFC s) Application of Authority Revenue Under the Master Bond Resolution Debt Service Coverage Calculation of PFC Revenues Debt Schedules Audited 2014, Adopted 2015, Projected 2015, and Budget CAPITAL HISTORY History of Airport Development Albany Airport Authority Created Capital Developments by the Authority Five Year Capital Programs Capital Development Capital Expenditures Summary of Capital Projects and Equipment Purchases Five Year Capital Plan Goals and Objectives Capital Program for Potential Funding Sources Five Year Capital Plans and AIRLINES RATES AND CHARGES SUMMARY Airlines Rates and Charges Summary Cost Centers and Allocations Schedules for Rates and Charges GLOSSARY
 preliminary operating budget for")
5 ALBANY COUNTY AIRPORT AUTHORITY TEL: ALBANY INTERNATIONAL AIRPORT ADMIN FAX: ADMINISTRATION BUILDING FINANCE FAX: SUITE ALBANY, NEW YORK SITE: TO THE MEMBERS OF THE AUTHORITY: October 27, 2015 The Finance Department herein presents Albany International Airport s (ALB) preliminary operating budget for calendar year This represents the 22nd annual prepared by the Authority since it assumed management and financial responsibility for the Airport in The budget has been prepared on an accrual basis with certain exceptions and includes all current operations under the responsibility of the Authority. This budget incorporates the operation of two companies that operate under cost reimbursement agreements with the Authority. AFCO AvPorts Management, LLC (d/b/a AvPorts) is responsible for the daily operations of the Airport and REW Investments, Inc., (d/b/a Million Air-ALB) is responsible for the daily operations of the Fixed Base Operation (FBO). STATUS OF AIRLINE INDUSTRY Airline profitability eroded in 2008 due to record high fuel prices followed by the Great Recession - the worst global recession since the 1930s. Airlines responded by reducing the number of flights and seats available, increasing fees, reducing or eliminating passenger amenities, reducing orders for new equipment, grounding inefficient fleets, and eliminating marginal routes. Declines in available seat miles (ASMs) in were the sharpest in 67 years and wiped out 10 years of industry growth leaving domestic ASMs 1.3 percent below 1999 levels. Having learned from prior downturns, major airlines maintained strong cash positions, though major consolidations/acquisitions were announced by eight carriers; Delta Air Lines acquiring Northwest Airlines, United Airlines acquiring Continental Airlines, Southwest Airlines acquiring AirTran Airlines, and US Airways merging into American Airlines. Airlines for America (A4A), the industry trade organization for the leading U.S. airlines, reported that in 2015 daily domestic seat capacity reached 2.37 million, which is the highest level since The A4A reported that during the first half of 2015 the U.S. airline industry achieved $11.3 billion in net profit and achieved a pre-tax profit margin of 14.5% of Operating Revenues and are in-line with the average U.S. Company in the S&P 500 index. According to the A4A, the increase in airline profits through the first half of 2015 has been the result of a combination of lower fuel expense, higher traffic, lower fares, although somewhat offset with higher labor costs. Future airline traffic will be affected by the state, national and global economic conditions, regional airport competition, war and acts of terrorism, world health emergencies, federal regulatory actions, the financial condition of the airlines, air fare levels, the operation of the air traffic control system, fuel prices, and natural disasters. Concerns about the safety of airline travel and the effectiveness of security precautions may influence passenger travel behavior and air travel demand. The Authority is unable to predict with certainty the long-term operational and financial effect of these factors on air travel. Furthermore, additional bankruptcies, liquidations or major restructuring of other airlines could occur. Therefore, any long-term forecast the Authority makes may vary materially from the actual results. 1-1
6 The Authority derives a portion of its operating revenue from landing fees and terminal facility fees paid by the airlines using the Airport. The majority of non-airline revenues, such as parking revenue, are dependent upon the continuation of airline activity at the airport. The financial strength of these airlines, together with numerous other factors influences the level of aviation activity at the Airport and the revenues realized by the Authority. Individual airline decisions regarding level of service also affect total enplanements. Events such as the September 11 Events, general economic conditions, high fuel prices, terrorist threats and the United States military offensive in Iraq have had a significant negative effect on airline industry profitability. No assurances can be given that any of these airlines currently anticipated to be operating at the Albany International Airport in 2016 will continue operations or maintain their current level of operations at the Airport. AIR TRADE AREA SERVED BY ALBANY INTERNATIONAL AIRPORT The Authority defines the primary air trade area for the Airport within a 60 to 70 mile radius of the Airport. This area encompasses a total of 13 counties, including the Albany-Schenectady-Troy Metropolitan Statistical Area (MSA), with the New York counties of Albany (the county in which the Airport is located), Saratoga, Schenectady, Schoharie, and Rensselaer; the Glens Falls MSA, with the New York counties of Warren and Washington; the additional New York counties of Columbia, Fulton, Greene, Montgomery, and; Berkshire County, Massachusetts; and Bennington County, Vermont. The Airport is the sole provider of commercial service in the air trade area. The Airport serves the City of Albany which is the capital of the State of New York plus the major neighboring cities of Rensselaer, Saratoga Springs, Schenectady and Troy. The Airport's primary air trade area population was estimated in 2013 to be approximately 1.4 million. The per capita personal income in 2013 of the Albany-Schenectady-Troy MSA was $49,693 compared to a national average of $44,765. The unemployment rate in the Albany- Schenectady-Troy MSA has been consistently more favorable than the state and national average. The area includes over 31 employers with more than 1,000 employees, the largest employer being the State of New York with approximately 54,000 employees. The area includes 28 colleges and universities, 16 general-care hospitals and offers a rich variety of cultural, recreational, educational resources, and activities. STATUS OF ALBANY INTERNATIONAL AIRPORT (ALB) The Federal Aviation Administration ("FAA") defines ALB as a small air traffic hub, which is an airport with enplaned passengers of 0.05 percent to 0.249% of the total enplaned passengers by all U.S. air carriers nationwide. In 2014, ALB s share 0.16% based upon FAA data. As of September 2015, ALB has scheduled passenger airline services provided by five major airlines and their commuter airlines, and Cape Air, a regional airline. The five major airlines serving ALB are Delta, JetBlue, Southwest, United, and American Airlines. ALB has been served by all of its existing major airlines during each of the years 1990 to 2015, with the exception of Southwest which began service in May 2000 and JetBlue which begins in December American Airlines ended service from Albany International Airport on November 2, 2008 but reestablished service in 2015 with its merger with U.S. Airways. In September 2008, two allcargo carriers provide regular scheduled cargo service: FedEx and United Parcel Service. DHL ended major cargo flight operations at the end of June Albany has experienced a reduction in aircraft operations and enplanements from 2005 through Beginning in 2005, airlines serving ALB were affected by bankruptcy and high fuel prices. By December of 2007 the economic recession had begun with soon to follow record fuel prices resulting in the switch to smaller size aircraft which reduced the number of flights. By 2009 the merger of ALB s airlines had begun, yet again reducing flights and seats available as the average 1-2
7 airfares began to rise. In 2015 airline seat capacity at ALB was up about 1.0% compared to 2014 capacity. (See page 1-11 for the historic, current and future projections of enplanements and landed weights for ALB) A summary showing the mix of aircraft types servicing ALB and the average maximum monthly seats available follows: Monthly Maximum Full Size Jets Regional Jets Commuter Aircraft Total Seats Available As of December 31: Sep , , , , , , , ,052 Capacity and aircraft operations have become more seasonally adjusted since 2008 with scheduled capacity for the months of December through February being the lowest during the year. Fewer and smaller aircraft resulted in reduced aircraft landed weights and a lower number of enplanements. These two key operational items impact the level of Airport revenues generated for the operation and maintenance of all its facilities. The table below provides a summary showing the changes since 2007: Commercial Landed Weights Enplanements Projected as of July ,382,469,000 1,286,944 As of December 31: ,368,073,710 1,230, ,408,546,123 1,215, ,448,273,846 1,244, ,484,333,528 1,242, ,516,417,076 1,264, ,613,441,399 1,318, ,691,306,632 1,380, ,753,689,173 1,440,385 ACTIVITY PROJECTIONS FOR 2016 Given all the factors that exist as of today, it is difficult to project future year activity levels for ALB. While some combination of factors as described above has resulted in a decrease in enplanements, landed weight, and aircraft operations in the past several years, there are 1-3
8 indications of relief in the future that will contribute to an increase in seats available for JetBlue Airways is scheduled to commence operations in December of 2015 which should result in a capacity increase for 2016 if all other airlines maintain their current schedules in line with After the scheduled departing seats declined 3% in 2014, the seat capacity is increased 1% in 2015, and is expected to increase 13.6% in the first quarter of 2016, partly due to new services initiated by JetBlue. The projected number of commercial aircraft, plus the number of general aviation aircraft operations also affects the Airport s Fixed Based Operations (FBO) financial projections. FBO revenues are primarily dependent on fuel flowage fees from commercial airlines, sale of aviation fuels to general aviation users, and deicing services provided to both commercial and general aviation aircraft. The Authority is aggressively seeking expanded service from current and other carriers by offering attractive facilities in excellent condition combined with strong average airfares and passenger demand. In 2011 the Authority developed an airport incentive program that includes airport fee waivers for qualifying air service expansion, promotional marking funds and assistance for qualifying new service, and an airline revenue guarantee funded by the Federal Aviation Small Communities Air Service Development grant and community matching funds. In 2011 the Authority also received an economic development grant to fund 75 percent of the cost of marketing the airport to the airlines. In December of 2015 JetBlue will begin service with two flights per day and will receive credit for exclusive use rental space and landing fees for their first 12 months of operations at an estimated cost to the Authority of $643,170 and this amount is reflected in the budget. AIRLINE USE AND LEASE AGREEMENT The Authority and the airlines negotiated a five-year Use and Lease Agreement that became effective January 1, 2006 with an option for a five-year renewal which was exercised in 2010 extending the agreement until December 31, The agreement for the period January 1, 2016 through December 31, 2020 is in the process of finalization and the 2016 operating budget is prepared to reflect the terms of the agreement which are not substantially changed. This agreement establishes how the airlines that elect to sign the agreement will be assessed annual rates and charges for their use of the Airport. Under the current agreement, airlines that sign the agreement share the net revenues of the Airport based upon a 50/50 split of Net Funds Remaining as calculated under the agreement. As of December 2015; Delta, JetBlue, Southwest, United, American as US Airways, Cape Air, and two all-cargo carriers serving the Airport executed the current Signatory Agreement with the Airport and are expected to execute the new agreement for Because all airlines renting space in the terminal have signed the signatory agreement and named most of their contract carriers as affiliates, the 2016 budget assumes that substantially all airline rates and charges will be billed at the signatory airline rates and the new agreements will be signed by the end of AIRPORT AND FIXED BASED OPERATIONS OPERATING AGREEMENTS The Authority engages the services of AFCO AvPorts Management, LLC (AvPorts), to manage the daily operations of the Airport and REW Investments, Inc., d/b/a Million Air Albany (Million Air-ALB), to manage the daily operations of the Fixed Based Operations. AvPorts has the daily responsibility, under policies and direction from the Authority, for airport operations, airside security, ARFF, terminal and vehicle maintenance and the parking facilities. 1-4
9 AvPorts is reimbursed for its actual payroll expenditures based on an employment level approved annually by the Authority plus a fixed fee. Million Air has the daily responsibility, under policies and direction from the Authority, for the fixed based operations including commercial into-plane fueling, fuel farm management and general aviation handling and fueling. The Authority s goal in directing the daily management of the fixed based operations is to enhance the service the Authority can provide to the general and corporate aviation community by offering competitive rates and charges for users of the Airport and to provide the airlines at the Airport with efficient and quality into-plane fueling services and fuel inventory management. Million Air is reimbursed for its actual expenditures based on an employment level approved by the Authority plus a fixed fee with added incentives based on the growth of fixed based operation revenues. All expenditures incurred by AvPorts and Million Air are subject to the approval and execution by the Authority OPERATING BUDGET FINANCIAL HIGHLIGHTS The 2016 budget is balanced by implementing the strategies set forth in the Summary of Financial policies as described beginning on page 2-7. The Authority prepares annual operating budgets following the formulas contained in the Airline Use and Lease Agreements. At the end of each year, the Authority prepares an Airline Rates and Charges Settlement and Revenue Sharing Transfer Calculation report showing a comparison of the final audited financial results for the year compared to the adopted budget. Total anticipated revenues for 2016 are $48.5 million and total operating expenses are $33.3 million. The remaining $15.2 million is budgeted for the following: $8.7 million to pay the debt obligations of the Authority net of Passenger Facility Charge funds, $3.0 million for capital expenditures, and a change in reserve fund requirements of plus ($0.1) million leaving the end of the year with $3.6 million to share with the airlines. Additional airline revenue may be required to cover unanticipated expenses or unrealized revenues in 2016 The Authority s bond resolution requires the Authority to maintain an operating reserve equal to two months of operating and maintenance expenses. Upon adoption of the 2016 Operating Budget the Operating and Maintenance Reserve requirement will be $5.6 million based upon total budgeted operating expenses of $33.3 million in At September 30, 2015 the Authority had $10.6 million in its Operating and Maintenance Reserve Account and an additional $7.3 million in its Airport Development Account which can be used to restore a deficiency in the Operating and Maintenance Reserve Account. At this time it is projected the Authority will end 2015 with $3.7 million in net revenue to share with the Airlines and its Development Account would increase by $1.8 million to a total of $9.1million. The Authority also maintains cash balances in restricted accounts established by the Authority s Master bond resolution that are not available to pay operating expenses and these accounts include various debt service reserve accounts, the Passenger Facility Charge Funds account, Capital Projects Funds, and a Renewal and Replacements Fund. The Table below presents a summary of the Actual and Projected restricted and unrestricted Cash balances: 1-5
10 Projected Projected December 31 December 31 December 31 December 31 December Funds availabel for unrestricted operations $ 13,910,109 $ 14,704,149 $ 16,759,824 $ 18,150,790 $ 19,150,790 Restricted for: Capital Projects 6,795,387 6,795,387 3,209,004 3,555,001 4,555,001 PFCs available for debt service payments 4,692,973 4,692,973 5,271,588 7,064,300 7,964,300 Revenue bond reserves 11,736,469 11,736,469 11,682,648 11,680,000 11,680,000 Other restrictions 1,005,362 1,005, , , ,000 Total $ 38,140,300 $ 38,934,340 $ 37,907,189 $ 41,275,091 $ 44,175,091 The table below is a summary comparison based on the formula included in the Airlines Use and Lease Agreement showing the 2016 budget compared to the 2014 audited results, the 2015 adopted budget, and the 2015 projected results, along with the amount and percentage of changes for the 2016 budget versus the 2015 projected: ALBANY COUNTY AIRPORT AUTHORITY OPERATING BUDGET SUMMARY (Before revenue sharing) Budget vs. Projected 2015 Audited Budget Projected Budget $ of Change % of Change REVENUES Airfield charges $6,617,293 $6,874,419 $7,287,558 $7,237,319 -$50, % FBO 10,348,396 10,458,102 8,899,710 8,923,174 23, % Terminal rentals 5,510,514 5,690,101 5,802,004 6,310, , % Concessions 7,027,934 7,114,816 7,677,602 8,031, , % Ground Transportation 11,575,593 11,513,033 12,899,502 13,531, , % Other Airport 3,505,149 3,742,273 3,728,635 3,815,567 86, % Other Revenues 715, , , , % Total Revenues $45,300,260 $46,066,144 $46,966,193 $48,521,117 $765, % EXPENSES Personal Services $9,100,947 $9,513,907 $9,348,295 $10,133,199 $784, % Employee Benefits 4,274,206 4,698,022 4,385,141 4,730, , % Utilities & Communications 2,359,864 2,664,808 2,347,045 2,421,827 74, % Purchased Services 5,140,479 5,594,587 5,296,674 5,738, , % Materials & Supplies 10,335,716 10,307,215 8,711,460 9,015, , % Offices 267, , , ,327 97, % Administration 748, , , ,400 52, % Noncapital Equipment 96, , ,681 95, , % Total Expenses $32,323,558 $34,083,197 $31,578,240 $33,322,973 $1,759, % DEBT SERVICE P&I Payments 8,966,386 9,120,235 9,778,899 8,728,570 -$1,050, % CAPITAL CHARGE COVERAGE $0 0.0% RESERVE REQUIREMENTS 209,452 42,221 42,221 (126,704) -$168, % CAPITAL EXPENDITURES 1,819,309 1,826,157 1,876,791 3,000,000 $1,123, % LANDING FEE SURCHARGE $0 0.0% FUNDS REMAINING $1,981,555 $994,334 $3,690,043 $3,596,278 -$93, % 1-6
11 AIRLINE RATES AND CHARGES SUMMARY The Airline Use and Lease Agreement with the signatory airlines is hybrid in nature with a residual ratemaking methodology for calculating the airfield, apron and loading bridges rates and a commercial rental rate methodology for calculating the terminal rental rate. The agreement also provides for the inclusion of an amount for capital expenditures not subject to majority-in-interest (MII) approval by the signatory airlines in the rates and charges calculation. The Authority has the ability under the Agreement to adjust rates and charges at any time throughout the year to ensure adherence to all financial covenants in its bond resolutions. No such adjustments have ever been required under either the current or the prior Agreements. Based on the Airline Use and Lease Agreements, a comparison of the major signatory airline rates and charges and projected cost per enplaned passenger, plus the Authority s projected debt service coverage are as follows: Audited Budget Projected Budget 2016 Budget vs Projected Landing Fees <1> Signatory $3.06 $3.23 $3.44 $ % Non-Signatory $4.08 $4.04 $4.04 $ % Apron Fees <2> $1.59 $1.68 $1.67 $ % Terminal Rental Rate <2> Signatory $68.13 $74.78 $73.85 $ % Non-Signatory $90.58 $93.48 $92.31 $ % Loading Bridge Rate <3> $31,284 $36,826 $35,242 $37, % Cost per Enplanement Airport CPE <4> $7.22 $8.05 $6.92 $ % FBO CPE % Total Cost per Enplanement $9.09 $10.09 $8.64 $ % Debt Service Coverage % <1> Per 1,000 lbs. Max. Gross Landed Weight (MGLW) <2> Per Square Foot <3> Per Loading Bridge <4> After Revenue Sharing GAAP FINANCIAL STATEMENTS The Authority has adopted December 31 as its fiscal year end and issued its first financial statements in An audited comprehensive annual financial report has been issued each year thereafter. The Authority s financial statements are prepared on an accrual basis of accounting in accordance with generally accepted accounting principles (GAAP) promulgated by the Governmental Accounting Standards Board (GASB). The 2014 financial statements are available at The Authority operates as a single enterprise fund with revenues recognized when earned, not when received. Expenses are recognized when incurred, not when they are paid. Capital assets are capitalized and (except land) depreciated over their useful lives. Funds are restricted for debt service and, where applicable, for construction projects. The following table Summary Financial Information presents audited results for 2014, projected results for 2015, and the operating budget for 2016 presented in accordance with GAAP: 1-7
12 Summary Financial Information Audited Projected Budget Operating Revenues Airfield $ 6,320,059 $ 6,734,051 $ 6,697,877 Fixed Based Operations 10,348,396 8,899,710 8,923,174 Terminal 4,816,970 4,510,489 5,051,680 Concessions 7,027,934 7,677,602 8,031,961 Ground Transportation 11,575,593 12,899,502 13,531,535 Other Airport 3,505,149 3,728,635 3,815,567 Total Operating Revenues 43,594,101 44,449,988 46,051,794 Operating Expenses Airfield 2,695,126 2,958,756 3,079,119 Fixed Based Operations 8,837,293 7,431,635 7,351,128 Terminal 4,617,969 4,725,276 5,140,288 Loading Bridges Parking Landside Public Safety Aircraft Rescue & Fire Fighting Vehicle Maintenance Administration 191, , ,226 3,377,669 3,395,953 3,803,836 1,019, ,217 1,045,104 3,267,445 3,334,257 3,683,261 1,763,640 1,707,667 1,766,930 1,243,603 1,268,353 1,385,106 5,309,354 5,616,918 5,802,974 Total Operating Expenses 32,323,557 31,578,240 33,322,973 Operating Income before Depreciation Depreciation Operating Income (Loss) Before Non-Operating Income and Expenses 11,270,544 12,871,749 12,728,821 13,957,515 13,957,515 14,057,515 (2,686,971) (1,085,766) (1,328,694) Non-Operating Income and (Expenses) Passenger Facility Charges 4,777,691 5,020,373 5,408,605 Improvement Charges 368, , ,400 Interest Income 54,043 10,784 10,784 Interest Expense (5,870,629) (4,455,219) (4,201,056) Property Damage Insurance Recovery Grant Income Grant Expense TSA (LEO) Reimbursement 292, , ,000 Air Service Development Amortization of Bond Issue Costs (133,008) (109,986) (100,347) Investments received Decrease in fair value of investiments Total Non-Operating Income and (Expenses) (510,565) 1,126,352 1,778,386 Income (Loss) before Capital Contributions (3,197,536) 40, ,692 Capital Contributions 6,414,378 6,475,324 5,132,152 Special Item Extraordinary Item Total Capital Contrib., Special and Extraordinary Items 6,414,378 6,475,324 5,132,152 Net Position Increase in Net Position 3,216,842 6,515,909 5,581,844 Total Net Position, beginning of year 196,680, ,897, ,413,592 Total Net Position, end of year $ 199,897,683 $ 206,413,592 $ 211,995,
13 BUDGET SUMMARY The local and United States economy will determine the future financial performance for the Albany International Airport together with the airline industry and how both the airlines and the traveling passengers are impacted by heighten security. The greater Albany region, known as Tech Valley, has become a high tech center for research and development in nanotechnology/microelectronics, biotechnology/pharmaceuticals, energy and information technology. The Albany International Airport experienced major growth after 1998 not only in infrastructure improvements but also in passenger traffic that led to an increase in revenues, expenses and debt service. In the past ten years the Airport s two runways (1-19) and (10-28) were lengthened to 8,500 and 7,200 feet, respectively, additional commercial and general aviation hangar space has been constructed, a parking garage and additional surface parking was constructed. During this time vendor and concession revenue expanded with substantially increased minimum annual guarantees. Airport privilege and operating permit fees have also grown. As noted by the Airlines For America, the recent global recession resulted in the airline industry losing all growth from 1999 by the end of However, the airport remains poised to respond to the return to growth in airport activity with both affordable and well maintained airport assets. High tech development continues in the region. Albany s College of Nanoscale Science and Engineering continues to expand its nanotechnology research and development programs. This nanotechnology center is located within a few miles of the Airport and is the first college in the world dedicated to research, development, education, and deployment in the emerging disciplines of nanoscience, nanoengineering, nanobioscience, and nanoeconomics. With over $7 billion in public and private investments, CNSE's Albany NanoTech Complex has attracted over 250 global corporate partners - and is the most advanced research complex at any university in the world. On September 27, 2011 a public announcement revealed that the Albany nanocollege will be the new home of research for the 450 millimeter wafer and the focus of a new $4.8 billion investment. Just across the nearby river Rensselaer Polytechnic Institute recently completed construction of a new Center for Biotechnology and Interdisciplinary Studies. This technology research center ranks among the world s most advanced research. In late July 2009 Global Foundries broke ground on construction of a $4.6 billion computer chip plant approximately 20 miles north of the Airport which will complement the existing technology facilities already in the region. On June 1, 2010 an expansion of this plant to 1.3 million square feet was announced. In July of 2012 an additional expansion and investment of $2.3 billion was announced. The combination of significant growth in the technology businesses and comparatively low unemployment rates, position Albany for a return to growth in airline activities and passenger usage of the airport. This 2016 operating budget reflects the anticipated Airport revenues generated by the regional economy together with the expenses for all facilities or services offered. But with the ever changing traveling environment, the changing organizational structure of airlines, airline mergers and acquisitions, the impact of new routes with different aircraft, and the ongoing enhancement to security requirements, it can be assured that additional currently unforeseen changes will need to be addressed during This budget represents management s best estimates given the current economic conditions and recognizes that this budget will need extensive monitoring during The recommended billing rates and charges are at this time are a prudent assessment of the financial results that are reasonably achievable in 2016, given the current economic environment and future actions that might be taken by the airlines and potential travelers. There will be a continued need to control the number of workforce employees, for tight purchasing controls, strict controls on discretionary spending and support from the Airport patrons and our airlines to 1-9
14 achieve a financially successful year for the Airport in While being fiscally prudent with this budget, management is optimistic conditions can occur during 2016 resulting in new growth. The combination of robust economic activity and a multiple sponsor incentive program to the airlines for service expansion do provide a basis for hope of air service expansion. In developing the 2016 operating budget, the Authority continues to advance strategies that result in reasonable rates and charges so that business, government, and leisure travelers in the greater Albany region will continue their support and use of the Albany International Airport. AWARD The Government Finance Officers Association of the United States and Canada (GFOA) has presented ten Distinguished Budget Presentation Awards to the Albany County Airport Authority for its annual operating budget in prior years (see page 1-13). In order to receive this award, a governmental unit must publish a budget document that meets program criteria as a policy document, as an operations guide, as a financial plan, and as a communications device. The award is valid for a period of only one year. We believe this current budget continues to conform to program requirements, and its submission to GFOA will determine eligibility for a subsequent award. ACKNOWLEDGMENTS The Authority Board has contributed its full support to the development and maintenance of the financial operations of the Airport. Without this leadership, together with the strong commitment from the Authority s management team, the presentation of this budget and other financial reports would not occur. Also recognized are the management personnel of AFCO AvPorts and Million Air-ALB for their time and effort in submitting their respective goals, objectives and projected results to be achieved in A thank you goes to Rima Cerrone for performing the endless task of analyzing all the data submitted and preparing this document in a coherent manner for all to read and digest. The publication of this budget would not occur without the efficient and dedicated services of all the members of the Authority s Finance Department, plus those from AvPorts and Million Air, who contributed to the process. Respectfully submitted, William J. O Reilly Chief Financial Officer 1-10
15 Albany International Airport Enplanements ,400,000 ENPLANEMENTS 1,350,000 1,300,000 1,250,000 Original Projection Current Projection Actual 1,200,000 1,150, YEAR Albany International Airport Commercial Landed Weight COMERCIAL LANDED WEIGHT 1,550,000,000 1,500,000,000 1,450,000,000 1,400,000,000 Original Projection Current Projection Actual 1,350,000,000 1,300,000,000 1,250,000, YEAR 1-11
16 1-12
17 2) AIRPORT AUTHORITY OVERVIEW ORGANIZATION The Albany County Airport Authority (Authority) is a body corporate and politic constituting a public benefit corporation established and existing pursuant to the Albany County Airport Authority Act, Title 32 of Article 8 of the New York Public Authorities Law. The State of New York (State) created the Authority in 1993 in order to promote the strengthening and improvement of the Airport, to facilitate the financing and construction of the Terminal Improvement Project (TIP) and subsequent capital improvement programs, and give the Authority the power to operate, maintain and improve the Airport. The Authority is governed by seven members, with four members appointed by the majority leader of the County of Albany (County) Legislature and three members by the County Executive, all with approval of the County Legislature. The Authority members are appointed for a term of four years or until a successor is appointed, except that any person appointed to fill a vacancy will be appointed to serve only the unexpired term. Based on the County s responsibility for the appointment of the Authority members, their approval of any Airport capital improvement programs and the issuance of certain debt, the Authority is considered a component unit of the County under the criteria set forth by the Governmental Accounting Standards Board (GASB). The Authority does not have any component units. The financial transactions of the Authority are accounted for in a single enterprise fund. The Authority is responsible for the efficient planning, development, administration, operation, and financial condition of the Airport. The Authority, as landlord, rents space and assesses fees and charges to the airlines and businesses providing goods and services to the traveling public and to the civilian, business, governmental and military users of the Airport. The Authority is responsible for assuring residents of the County, the Town of Colonie and the surrounding areas of minimal environmental impact from air navigation and transportation. Authority employs the services of AvPorts to manage the daily operations and maintenance of the Airport and the services of Million Air to manage the daily operations of the Fixed Base Operation (FBO). The Authority s strategic direction for the Airport is based upon the following vision, mission, goals, and objectives. VISION The Authority s vision statement is a measurable statement describing the future results the Authority seeks to achieve. The Authority s vision for Albany International Airport is to provide an exemplary airport in which to visit, travel, and work. MISSION The Authority s mission statement is a broad statement of what the Authority has been charged to accomplish and why. The Authority s mission is to provide adequate, safe, secure and efficient aviation and transportation facilities at a reasonable cost to the people. To accomplish our mission we will: Provide world-class, customer-oriented transportation services at Albany International Airport; Promote airline, cargo, business, and general aviation services at Albany International Airport by providing quality airport facilities; 2-1
18 Operate the airport and provide services in the most cost-effective manner; Foster inter-modal transportation; Implement the airport s Capital Improvement Plan; and, Maintain financial security. GOAL The Authority s goal for the airport is derived from its mission and vision for the airport and describes the enduring end state for the airport desired. The Authority s goal for Albany International Airport is: To be widely recognized as the best airport of its size in the Northeast as well as an innovative model for a facility with vitality, enthusiasm, friendliness, competence, and efficiency. OBJECTIVES The Authority s objectives describe the outcomes required to accomplish the goal. The Authority s objectives in operating the airport are: To promote safe, secure, efficient and economic air transportation by preserving and enhancing Airport capacity. To acquire, construct, reconstruct, continue, develop, equip, expand, improve, maintain, finance, and operate aviation and other related facilities and services. To stimulate and promote economic development, trade and tourism. To form an integral part of a safe and effective nationwide system of airports to meet the present and future needs of civil aeronautics and national defense, and to assure inclusion of the Authority s facilities in state, national, and international programs for air transportation and for airway capital improvements. To ensure that aviation facilities shall provide for the protection and enhancement of the natural resources and the quality of the environment of the state and the capital district area. VALUES The Authority s values describe how the Authority will conduct itself, both internally and externally, when engaging in business activities. The Authority s values are: Responsiveness being proactive; having a bias for action and sense of urgency in getting things done; anticipating the needs of tenants and passengers by taking fast action to surpass their expectations; encouraging tenant and passenger input. Integrity possessing a commitment to doing the right things right, with consistent adherence to the highest professional standards; keeping commitments to our tenants, passengers, employees, and others. Innovation dedicating ourselves to learning and growing; constantly searching for better ways to get the job done; using our collective imagination effectively to solve problems for our tenants, passengers and employees; going beyond perceived boundaries to get desired results. 2-2
19 Teamwork recognizing that every board member, employee, volunteer, tenant, and others are important to the complete satisfaction of Albany International Airport; feeling personally responsible for successful outcomes; treating everyone with respect; communicating regularly, directly and honestly with our board members, employees, volunteers, tenants, and others. PERFORMANCE MEASURES The Authority has identified the following performance measures to monitor and report its success in achieving its mission and intended public purpose. Area of Measurement Safety Security Financial Operational Customer Service Environmental Sustainability Performance Measure Performance Measure Component 2014 Final 2015 Projected 2016 Budget Employee Accidents and Construction Injuries Lost Time Injury Incidents Rate Airfield Violations Runway Incursions Runway Condition FAA Safety Compliance Violations Warning Citations Issued Security Incidents and Security Badge Breaches Violations Letters of investigation Violations Revenue Management Total Airline per EPAX* $9.77 $9.14 $9.14 Total Non-Airline Revenue per EPAX $26.25 $25.92 $25.47 Total Revenue per EPAX* $36.01 $35.06 $34.62 Cost Performance Operating Cost per EPAX $9.09 $8.64 $8.66 Airport Cost per EPAX $7.22 $6.92 $7.00 Debt Management Debt Service Coverage Ratio Debt per EPAX $7.29 $86 $79 Liquidity Days Unrestricted Cash on Hands Aircraft Delays Number of Aircraft Delay caused by caused by Airport Airport or Runway Closings Aircraft Delays caused by Fixed Base Operations Number of Aircraft Fueling Delays Service Quality Terminal Cleanliness Concessions Quality and Variety (Five is the highest) Customer Customer Survey Results (Five is the Satisfaction highest) Environmental Compliance Violations Identified by Regulatory Agency De-Icing Material Discharge Frequency and Severity of Spills SPDES violations DEC violations Noise Noise Levels /Noise Complaints
20 Area of Measurement People Performance Measure Employee Satisfaction Workforce Diversity Performance Measure Component Employee Turnover AFCO AvPorts Million Air FBO Albany County Airport Authority Minority Representation in Workforce AFCO AvPorts Million Air FBO Albany County Airport Authority 2014 Final 19.9% 25.0% 0% 15.0% 11.9% 4.3% 2015 Projected 19.0% 14.0% 0% 14.0% 17.9% 4.3% 2016 Budget 18.0% 6.0% 0% 14.0% 17.9% 4.3% 2016 Organizational Strategic Goals Strategy Goal 2016 Key Initiatives 2016 Result Ensure long term financial security Promote customer service Provide the Albany International Airport with the financial resources to meet operational needs and meet all debt service obligations Ensure Albany International Airport provides world-class customer service Maintain appropriate financial reserves Enforce cost saving measures Improve purchasing processes, assess and identify savings at service levels and cost/benefit analysis Increase non-aeronautical revenue Promote Albany International Airport to international and domestic airlines to increase air service Evaluate customer service needs based on changing demographics of the traveling public Review roles and responsibilities for customer service between airlines and other Airport businesses Maintain 125% debt service coverage of net revenues Maintain its A-/A3 Bond rating from Fitch and Moody s Maintain a minimum twomonth operating reserve Implement cost saving plans Identify savings Identify new revenue streams Generate new businesses at the Airport Increase international flights Increase domestic flights Increase concession revenues Increase passenger activity Identify service responsibilities Increase customer service 2-4
21 Strategy Goal 2016 Key Initiatives 2016 Result Strengthen relationships Utilize employee experience and knowledge to adjust to changing business needs Utilize new technology Strengthen Albany International Airport s effectiveness through interdepartmental relationships and alliances with regional businesses, public agencies, governmental units, and airlines Ensure Albany International Airport acquires/sustains people with the ability, experience and knowledge to fulfill its mission Improve performance, increase productivity and deliver cost effective services Encourage internal teamwork Strengthen partnerships with Federal and State agencies Strengthen partnerships with the regional business communities Build public support for Albany International Airport policies and initiatives through proactive communication and public relations outreach activities Ensure employee wages and benefits remain competitive Expand employee training programs Design and integrate leadership development process Establish strategic investments in new equipment and technology based on current industry standards Evolve server equipment to virtual server technology Distribute software updates, patches and new programs electronically Evaluate common use systems and support services at Albany International Airport Improve effectiveness through cross department communications, coordination and sharing of resources Improve communications and integration of efforts with Federal and State agencies Improve coordination efforts between Albany International Airport and the regional business communities Improve communications of Albany International Airport s policies and programs Increase support for Albany International Airport s positions and activities Ensure Airport is competitive in the marketplace and able to attract and retain quality talent Enhance employee knowledge and skill development in every department Leadership that supports organizational goals Preserve organizational knowledge Upgrade equipment and electronic technology that improves productivity Lower energy maintenance, hardware and disaster recovery costs Greater efficiency and productivity Lower capital and operational technology costs Complete updates and installations Produce greater productivity Common use systems upgraded 2-5
22 BUDGET PROCESS The Authority operates on a January 1st through December 31st fiscal year. For administration purposes, an annual operating budget is prepared following the rates and charges methodology included in the five-year Airline s Use and Lease Agreement which became effective January 1, The Authority charges signatory landing fees and terminal rental rates to carriers who executed the Agreement and non-signatory landing fees and terminal rental rates, which are 125% higher than signatory rates, to those who have not. The Agreement also provides a revenue sharing mechanism by which the passenger signatory airlines receive a percentage of the net revenues remaining (as defined in the agreement). This calculation is set forth in Section 10 of this budget document. The Authority s share of any funds remaining may be used to fund the Authority s share of any project or any activity that does not affect the Airline s rates and charges. The budget is generally prepared on the accrual basis but differs from generally accepted accounting principles in that certain expenditures are reported on a cash basis. These include the principal portion of long-term debt obligations, the local share for certain capital projects, and the lack of depreciation expense. All other major revenues and expenses are budgeted for on the accrual basis. The Authority has adopted this budgetary basis of accounting to facilitate calculations for rates and charges billed to the airlines. There are fourteen cost centers in the Airline Use and Lease Agreement. Below is a schedule showing the target dates for the formation of the budget document to the adoption of the budget: June Finance Department provides worksheets for Million Air and AvPorts to calculate payroll and benefits and to enter Full Time Employment (FTE) positions Finance Department provides tables to Million Air, AvPorts, and Albany County Airport Authority to create new goals and objectives, actions to achieve the goals, and results to be achieved for current year and to state the results for budget year goals and objectives July Finance Department projects revenues and expenditures Finance Department provides worksheets for Million Air, AvPorts, and Albany County Airport Authority to adjust budget projections Hold coordination meeting with Million Air and AvPorts Meetings scheduled with department heads and managers for each cost center Meetings held with department heads and managers Million Air s and AvPorts work sheets for payroll and benefits completed ACAA payroll and benefits completed Cost Center s goals and objectives and performance measurements completed Work sheets for expenditures for Budget for Million Air, AvPorts, and ACAA completed Finance Department due diligence review August Finance Department due diligence review and updating budget September Final revisions received for budget Debt section completed by Finance Department Overview completed Revenue completed MA Expense completed ACAA Expense completed AvPorts Expense completed Expense Summary completed 2-6
23 Budget Summary completed Transmittal Letter completed Capital section completed by Finance Department Airline Rates and Charges developed Budget printed and assembled Budget distributed for review to the board members, airlines and ACAA October November Budget reviewed by ACAA and Airlines Finance Department due diligence review Final changes made and summary of changes distributed to Finance Committee for approval Finance Committee budget review Finalize Budget Final budget distributed to ACAA Board Members December Budget adopted SUMMARY OF FINANCIAL POLICIES Guidelines The budget process and format shall be performance based and focused on goals, objectives and performance indicators. The budget will provide adequate funding for operating and maintenance of the Airport buildings and property, and replacement of capital equipment, construction, reconstruction and development at the Airport. Balanced Budget The budget should be balanced with current revenues equal to or greater than current expenditures. Strategies to accomplish this balance include cost efficiencies, personnel efficiencies, increasing or implementing fees to match program expenses, fund balance usage (if available), and service reduction (if needed). Budget Amendments The adopted budget represents a business plan covering all Airport operations for the upcoming year. If the plan needs to be significantly modified during the year, the proposed revisions to the plan, together with their financial impact on either revenues or expenses, are presented to the Authority Board for review and approval. No amendments have been enacted during the year Budget Monitoring The independent monitoring of the budget continues throughout the Fiscal Year for management control purposes. Operating statements comparing actual financial results to budgets are reported monthly by the Chief Financial Officer and distributed to Board members, senior management and all key employees. Quarterly and annual financial reports are posted on the Authority s web-site 2-7
24 Performance Measurements Performance measurements are developed based on program objectives that tie to the Airport s vision, mission, and values. Performance measurements measure program results or accomplishments to provide good comparisons over time. Performance measurements measure efficiency and effectiveness is reliable, verifiable, and understandable. Performance measurements are monitored and used in decision-making processes. Planning The Authority will develop a five-year capital plan every five years commencing September 1, Each five-year plan must be approved by the Albany County Legislature. The five-year plan will include estimated operating costs and revenues for future capital improvements. Capital Improvement Policies Capital projects that will be made during the current budget year should be detailed by project and type of work. Progress projections for the five-year capital plan will be updated on a yearly basis. The Authority will identify the estimated costs and potential funding sources for each capital project proposal. The Authority will determine the least costly financing method for all new projects. The Authority will maintain all its assets at a level adequate to protect the Airport s capital interest and minimize future maintenance and replacement costs. Debt Policy The Authority will manage its current and future debt service requirement to be in compliance with all bond covenants. The Authority will confine long-term borrowing to capital improvements or projects that cannot be financed from current revenues. The Authority will maintain communications with bond rating agencies regarding its financial condition and will follow a policy of full disclosure. The Authority, when applicable, will determine if the financial market place will afford the opportunity to refund an issue and lessen its debt service costs. The Authority shall attempt to limit total debt outstanding to no more than $100 per enplanement. The Authority will not go over its legal debt limit of $285 million. The Authority will comply with its Derivative Policy which limits the use of derivative financial products to capital financing. The Authority will comply with its Variable Rate Debt Policy which limits the use of net permanent 2-8
25 variable rate debt to twenty percent of total debt outstanding. Revenue Policy The Authority will estimate and project its annual revenues by an objective, analytical process, as practical on a yearly basis. The Authority will maintain a diversified and stable revenue system to shelter it from unforeseeable short-run fluctuations in any one-revenue source. The Authority will maintain sufficient revenues to pay all expenditures incurred for the operations and maintenance at the Airport. Rates and Charges The Authority and the airlines have negotiated a Use and Lease Agreement that became effective January 1, 2011 establishes how the airlines that signed the agreement will be assessed annual rates and charges for their use of the Airport. Rates and charges are established annually. The calculation thereof is set forth in this document (section 10). The agreement is effective through December 31, 2015 with an option to renew for an additional five years. Compliance with Master Bond Resolution The Authority has established the following funds and accounts as required by the Master Resolution and illustrated in table on page 8-9, and has set the policy on fund balance as follows: Revenue Fund, holding revenues collected by the Authority and applying revenues as required by the Master Resolution. Our policy is to keep only necessary amount for working capital. O&M Fund, holding anticipated O&M expenses. Extra unused funds are applied to the accounts below; O&M Reserve, holding reserve for O&M expenses, equaling two months of O&M expenses as required by the Master Resolution; Bond Fund, including only principal and interest to be paid in the next payment dates Bond Reserve Fund, including only amounts required by the Master Resolution; Renewal and Replacement Fund. The Authority's policy is to keep a minimum balance of $500,000 in this account: Airport Development Fund, holding retained earnings of the Authority. The Authority's policy is to use this fund to build additional liquidity or avoid capital borrowing. Capital Construction Fund to hold funds for Capital Project expense. In addition, the Authority has the following funds and accounts: PFC account, holding all Passenger Facility Charge revenues collected by the Authority, to be used for future rates and charges or pay-as-you-go projects. The Authority reviews airlines rates and charges annually to determine the fund balance; Concession Area Improvement funds collected by the Authority for improvement to concession areas if needed at the Authority s discretion; and Air Service Development escrow account for Small Community Air Service Development matching contributions collected until needed for grant eligible expenditures. Investment Policies The investment of Authority funds is governed by provisions of its enabling legislation and by an Investment Policy adopted by the Authority March 23, Any bank or trust company with a full service office in the County of Albany is authorized for deposit of monies. Monies not needed for immediate expenditure may be invested in (1) United States Treasury obligations, (2) obligations backed by the United States Government full faith and credit, (3) Obligations of New York State, (4) obligations of any other state provided it has received the 2-9

26 highest rating by one independent rating agency designated by the State Comptroller, (5) certificates of deposit fully collateralized from a bank or trust company in New York State, (6) repurchase agreements using United States Treasury obligations with maturities of seven years or less. Investments are stated at cost or amortized cost if maturity at time of purchase is less than 1 year and fair value if greater than 1 year. ECONOMIC INFORMATION Albany International Airport - The Airport began operation in 1928 as the nation s first municipal airport. Albany International Airport is located on 1,157 acres of land in the Town of Colonie. The Airport is located seven miles northwest of downtown Albany, New York which is the capital of the State of New York. Also, the Airport is strategically located at the center of New York s growing Capital District and represents the heart of prospering Hudson Valley Corridor known as Tech Valley, a region that stretches from the Canadian border near Montreal to just north of New York City. Tech Valley offers rewarding career and business prospects, world-class educational and research facilities, vibrant arts and entertainment scene, and exhilarating, year round outdoor pursuits. The Airport is accessible to several major interstate and state highways. The Albany International Airport is defined by the Federal Aviation Administration (FAA) as a small hub airport, which is an airport that handles 0.05 percent to 0.249% of the total enplaned passengers by nationwide. In 2014, Albany International Airport was ranked the 86 th largest domestic passenger airport in the United States, 145 th for total aircraft operations, and 100 th in the all-cargo data according to Airports Council International- North America. The Airport s primary air trade area is generally defined as the area within a 60- mile to 70-mile radius of the Airport. This geographical area encompasses 11 counties in New York, Berkshire County in Massachusetts, and Bennington County in Vermont. The Airport s secondary air trade area is defined as being within 90 minutes of driving time to the Airport which includes an additional seven counties in New York, three counties in Massachusetts, four counties in Vermont and Litchfield County in Connecticut. 2-10

27 Nonstop Scheduled Passenger Service Albany International Airport March 11,

28 2-12
29 Location Analysis, Albany (first quarter 2015) This graph shows the Albany International Airport (the Airport ) in relation to selected commercial airports. The geographic distance from the Airport to a selected airport is represented by a solid dot and the driving time required is represented by a circle at the line end, indicated as in Burlington (187). A shaded circle (Manchester, Boston, Providence, Hartford, Islip, and Newburgh in this case) indicates that the average domestic outbound O&D fare at the selected airport is more than 5% lower than that of the Airport. Average fare levels may not be directly comparable depending on factors such as average trip distance, which can vary significantly. (Longer trip distance will more likely lead to higher fare level but lower yield per mile.) Additionally, average fares do not include ancillary charges, such as bag check fees, and therefore increasingly understate the true cost of air travel. The details are provided in the table below. Sources: U.S. DOT, Air Passenger Origin-Destination Survey, reconciled to Schedules T100 and 298C T1 for average 1Q2015 fare data; U.S. DOT, Schedule T100 for enplaned passengers for the 12 months ended February 28, Note: Fare data used in this analysis are preliminary and are subject to change. Prepared by LeighFisher, August 28,
30 2-14
31 Albany International Airport Population in the Air Trade Area 2010 vs vs PRIMARY TRADE AREA State of New York Albany County 306, , % 294, % 292,594 Columbia County 62,243 63, % 63, % 62,982 Fulton County 54,586 55, % 55, % 54,191 Greene County 48,455 49, % 48, % 44,739 Montgomery County 49,897 50, % 49, % 51,981 Rensselaer County 159, , % 152, % 154,429 Saratoga County 223, , % 200, % 181,276 Schenectady County 155, , % 146, % 149,285 Schoharie County 31,844 32, % 31, % 31,859 Warren County 65,337 65, % 63, % 59,209 Washington County 63,093 63, % 61, % 59,330 State of Massachusetts Berkshire County 129, , % 134, % 139,352 State of Vermont Bennington County 36,659 37, % 36, % 35,845 PRIMARY TRADE AREA 1,387,760 1,386, % 1,338, % 1,317,072 SECONDARY TRADE AREA State of New York Delaware County 46,722 47, % 48, % 47,225 Dutchess County 296, , % 280, % 259,462 Essex County 38,762 39, % 38, % 37,152 Hamilton County 4,773 4, % 5, % 5,279 Herkimer County 64,181 64, % 64, % 65,797 Otsego County 61,683 62, % 61, % 60,517 Ulster County 180, , % 177, % 165,304 State of Connecticut Litchfield County 187, , % 182, % 174,092 State of Massachusetts Franklin County 71,221 71, % 71, % 70,092 Hampden County 467, , % 456, % 456,310 Hampshire County 159, , % 152, % 146,568 State of Vermont Addison County 36,791 36, % 35, % 32,953 Rutland County 60,622 61, % 63, % 62,142 Windham County 43,857 44, % 44, % 41,588 Windsor County 56,067 56, % 57, % 54,055 SECONDARY TRADE AREA 1,777,038 1,781, % 1,739, % 1,678,536 TOTAL PRIMARY AND SECONDARY TRADE AREA POPULATION 3,164,798 3,167, % 3,077, % 2,995,608 State of New York 19,651,127 19,378, % 18,976, % 17,990,455 United States 316,128, ,745, % 282,171, % 248,709,873 Sources: U.S. Department of Commece, Bureau of the Census 2-15

32 Albany, the Heart of Tech Valley - Since 2008 the nanotechnology complex has doubled its size and nearly 50 new start-up companies have been launched at the complex. An August 2011 Wall Street Journal article proclaimed the Capital of New York is a big player in the field that deals with small things nanotechnology. Albany has become a hub for nanotechnology. When leaders of the world s semiconductor industry selected the site for International SEMATECH North, the research and development center for creating the next wave of super-fast computer chips, it is not surprising that Albany was its choice. SEMATECH continues to grow here, recently relocating its headquarters from Austin, Texas, to Albany. Global Foundries, one of the world s largest semiconductor manufacturers, opened a $4.6 billion facility in nearby Malta in 2012 and announced a $2.3 billion expansion also in General Electric is building a new battery manufacturing plant in Schenectady. The batteries will be used in new hybrid technology. General Electric also recently dedicated its Renewable Energy Wind Power Global Headquarters in Schenectady. On September 27, 2011 a new investment of $4.8 billion by IBM and Intel Corporation was announced for the Albany-based nanocollege that will be the new home of research for the 450 millimeter computer wafer chip. Because Albany is the location for the research center for the worlds next computer chip it becomes increasingly likely that a 450 millimeter computer wafer chip will also be located in New York. These kinds of business come to Tech Valley after considering locations around the world because of the region s excellence in higher education (led by the University at Albany and Rensselaer Polytechnic Institute) producing cutting-edge research and a talented workforce; business-friendly state and local governments; an appealing quality of life; modern air, rail and highway transportation systems, and proximity to New York City, Boston and Montreal. With more than $16 billion in investments that have been recently completed, in progress or announced, the Tech Valley region is being transformed into a center of research and advanced technology. 2-16

33 New York s Tech Valley is home to world-class summer and winter vacation and recreation attractions that draw individuals and families from across the nation and around the globe. The Adirondack Mountains, the Berkshires, Saratoga Springs, the upper Catskills, Lake George, southern Vermont, the upper Hudson Valley, and the Mohawk corridor all offer a cornucopia of entertainment and recreation venues including the Baseball Hall of Fame in Cooperstown, the Lake Placid Olympic Village and the thoroughbreds at Saratoga Race Track, home of former Kentucky Derby winner, Funny Cide. Recent National Recognition of Albany In 2010 Forbes Magazine Ranked Albany the 9 th best place to raise a family in America based upon cost of living, crime rate, commuting, household income, home ownership, home owner costs, and education. In 2010 Forbes ranked Albany 15 th among America s most innovative cities based upon tech and science jobs, creative jobs, patent awards per capita and venture investment per capita. In 2010 Forbes ranted the Albany-Schenectady-Troy Metro Area as the 30 th best bang for your buck cities based upon housing affordability, travel time, real estate taxes, unemployment rank, vacancy rates, job forecast, home price, and foreclosure forecast. In 2010 the American Institute of Economic Research names Albany the 14 th best city for College Students based upon twelve criteria that included percentage of all students holding foreign passports, research capacity, academic R&D expenditures per capita, earning potential, income per capita, entrepreneurial activity, net annual increase in total number of business establishments per 100,000 residents, year-over-year ratio of college-educated population living in the area, unemployment rate. In its 2010 Best-Performing Cities Index, the Milken Institute ranked Albany as the 41st bestperforming city (the 79th percentile) among the 200 largest metropolitan statistical areas in the United States for job, wage and salary growth and high-tech domestic product growth between 2006 and A July 2011 report by the Brookings Institution found the Capital Region had the largest percentage of its work force involved in green technology in the United States at 6.3% of its total 2-17
34 workforce. Albany is one on only four metropolitan areas contributing more than $1 billion annually from green technology industries. Students Enrolled in Colleges and Universities in the Albany Area 2014 Fall Semester Name County Public/Private Enrollment Excelsior College Albany Private 38,825 State University of New York at Albany Albany Public 17,195 Hudson Valley Comm. College Rensselaer Public 12,252 Rensselaer Polytechnic Institute Rensselaer Private 7,028 Schenectady Comm. College Schenectady Public 6,440 College Of Saint Rose Albany Private 4,500 Adirondack Comm. College Warren Public 4,249 Siena College Albany Private 3,139 The Sage Colleges Rensselaer Private 2,885 Skidmore College Saratoga Private 2,632 Fulton-Montgomery Comm. College Fulton-Montgomery Public 2,589 Cobleskill Schoharie Public 2,532 Union College Schenectady Private 2,242 Columbia-Greene Comm. College Columbia-Greene Public 2,048 Empire State College Albany Public 1,568 Albany College Of Pharmacy Albany Private 1,565 Empire Educartion Corp. Albany Private 1,537 Maria College Albany Private 866 Albany Medical College Albany Private 823 Bryant & Stratton Business Institute Albany Private 479 Albany Law School Albany Private 477 Southern Vermont College Bennington, VT Public 455 Union Graduate College Schenectady Private 438 College of Nanoscale Science and EngineeAlbany Public 400 Source: Albany Business Review, Book of Lists Private-Sector Employers in the Capital Region as of July 2015 Rank Employer Industry Total Staffing 1 New York State State Government 2 St. Peter's Health Care Services Health Care 12,130 3 Albany Medical Center Health Care 8,652 4 Golub Corporation Retail Grocery, Headquarters, and Dist. Center 8,208 5 General Electric Company Energy, Research, Industrial 7,000 6 Hannaford Brothers Retail Grocery 5,000 7 Ellis Medicine Health Care 3,479 8 Stewart's Ice Cream Co., Inc. Dairy Products 3,099 9 Bechtel Marine Propulsion Corp. Research and development 3, Glens Falls Hospital Health Care 2, Center for Disability Services Health Care 2, Global Foundries Semiconductor Manufacturing 2, Saratoga Hospital & Nursing Home Health Care 2, Rensselear Polytenchic Institute Educational Services 1, St Mary's Hospital Health Care 1, Empire Blue Cross/Blue Shield Health Insurance 1, Northern Rivers Family Services Inc. Health Care 1, National Grid Electric and Gas Utility 1, Momentive Performnce Materisal Inc. Speciality sillicones and quartz products 1, KeyCorp Banking/Financial services M+W U.S. Inc. - A Company of the MGlobal engineering, constructiona dn project manageme Regeneron Pharmaceuticals Inc. Biopharmaceutical development 1, AngioDynamics Inc. Designer/manufacturer of medical devices The College of Saint Rose Educational Services Union College Educational Services Nathan Littauer Hospital and Nursing Health Care 800 Source: Albany Business Review 2-18
35 Capital Region Unemployment Rate (not seasonally adjusted) August 2015 Percent of Population Unemployed % 5.0% 4.3% United States New York State Capital Region 2-19
36 This page intentionally left blank 2-20

 Other Airport, 8.2% Non Operating Revenues, 1.")


37 3) REVENUES DESCRIPTION OF REVENUES There are two types of revenues budgeted, operating and non-operating. Operating revenues are revenues generated through the daily operations of the Airport. Operating revenues are set forth in six categories; Airfield, Fixed Based Operator (FBO), Terminal, Ground Transportation, Concessions, and Other Airport. Non-operating revenues are generated from improvement charges and interest income. WHERE THE MONEY COMES FROM (Before Revenue Sharing) Other Airport, 8.2% Non Operating Revenues, 1.4% Airfield, 14.3% Concessions, 17.2% Fixed Base Operator, 19.1% Terminal, 10.8% Ground Transportation, 29.0% Enplanements and general aviation operations are critical since certain major non-airline revenues are projected on a per enplanement basis or a per-general aviation operations basis. Revenue projections for these items are discussed in this section and may vary significantly with any variance in the projected statistics for enplanements or general aviation operations. It is estimated that enplanements for 2016 will be 1,350,000 which is 4.9% higher than the 2015 projected amount of 1,286,944 due to a new airline and a destination increase due to another airline. It is estimated that general aviation operations for 2016 will be 13,398 which is in line with the projected 2015 operations. Audited 2014 Budgeted 2015 Projected 2015 Budgeted 2016 % Inc./(Dec) Enplanements 1,230,376 1,220,872 1,286,944 1,350, % General Aviation Operations 14,614 15,168 13,398 13, % 3-1
38 1,500,000 ENPLANEMENT HISTORY 1,450,000 1,400,000 1,350,000 1,300,000 1,250,000 1,200,000 1,150,000 1,100,000 40,000 GENERAL AVIATION OPERATIONS HISTORY 35,000 30,000 25,000 20,000 15,000 10,000 5,
39 REVENUE SUMMARY Total revenues for 2016 are budgeted at $48,521,117 before revenue sharing which is 3.2% higher than the 2015 projected amount of $46,966,193 before revenue sharing. Below is a revenue summary of audited 2014, budgeted 2015, projected 2015, and budgeted 2016 and a graph of historical operating revenues since 2007, along with 2015 projected revenues and 2016 budgeted revenues. Audit Budget Projected Budget Operating Airfield $ 6,617,293 $ 6,874,419 $ 7,287,558 $ 7,237,319 Fixed Based Operations 10,348,396 10,458,103 8,899,710 8,923,174 Terminal 5,510,514 5,690,101 5,802,004 6,310,377 Ground Transportation 11,575,593 11,513,033 12,899,502 13,531,535 Concessions 7,027,934 7,114,815 7,677,602 8,031,961 Other Airport 3,505,149 3,742,273 3,728,635 3,815,567 44,584,879 45,392,745 46,295,010 47,849,933 Non Operating Interest Income 54,043 12,999 10,784 10,784 TSA (LEO) Reimbursement 292, , , ,000 Improvement Charges 368, , , , , , , ,184 Total Revenues Before Revenue Sharing $ 45,300,260 $ 46,066,144 $ 46,966,193 $ 48,521,117 50,000,000 REVENUE HISTORY 48,000,000 46,000,000 44,000,000 42,000,000 40,000,000 38,000,000 Landing fees, apron fees, terminal rental rates, and loading bridge fees are determined by a formula contained in the Airline Use and Lease Agreement. The formula takes into consideration the revenues and expenses as proposed in the budget. A residual cost calculation is used to calculate rates for landing fees, apron fees and loading bridge fees and a commercial rental methodology for calculating terminal rental rate. The agreement also includes a 50/50 revenue sharing formula with the airlines based on all revenues less expenses of the Airport. 3-3
40 The Authority s assumption of the management of the FBO operations in October 2005 generates revenues from Jet-A fuel sales; AvGas fuel sales, auto gas sales, diesel fuel sales, into-plane, fuel farm, deicing, properties, and customer service. Ground transportation is projecting a slight increase due to promotional specials for parking at the Airport. Concessions have contributed to the increase in revenues due to a new lease with retail concession. AIRFIELD A signatory airline is an airline that has executed an agreement with the Albany County Airport Authority and is charged fees in accordance with an Airline Use and Lease Agreement which took effect January 1, A non-signatory airline is assessed at 125 percent of the signatory rates for landing fees and terminal rental rates. Signatory airlines have the option to have their affiliate carriers considered as signatory airlines. Currently there are seven commercial airlines, twelve affiliates to the commercial airlines, and two cargo airlines who are signatories to the agreement. Landing fees, landing fee surcharges and apron fees are calculated based on formulas contained in the Airline Use and Lease Agreement (More on the airline use and lease agreement in section 10). AIRLINE LANDING FEES The commercial landed weight for 2016 is expected to be 1,505,500,000 pounds which is 8.9% higher than the 2015 projected amount of 1,382,469,000 due to a new airline and additional destinations as demonstrated in the table below. Under the Airline Use and Lease Agreement the landing fee for signatory airlines in 2016 will be $3.29 per 1,000 pounds of Maximum Gross Landed Weight (MGLW). The rate for non-signatory airlines is 125 percent of the signatory rate or $4.11. Using the calculated signatory and non-signatory landing fee rates, landing fees for 2016 are budgeted at $4,962,813. The table below demonstrates zero growth in non-signatory landing weight. Audited 2014 Budgeted 2015 Projected 2015 Budgeted 2016 % Inc/(Dec) Signatory Landing Fee Rate $3.06 $3.23 $3.44 $ % Landing Weights 000-lbs (MGLW) 1,323,579 1,292,429 1,367,745 1,490, % Non-Signatory Landing Fee Rate $4.08 $4.04 $4.04 $ % Landing Weights 000-lbs (MGLW) 44,495 64,598 14,724 14, % 2,000,000,000 1,800,000,000 1,600,000,000 1,400,000,000 1,200,000,000 1,000,000, ,000, ,000, ,000, ,000,000 0 LANDING WEIGHT HISTORY 3-4
41 CARGO LANDING FEES There are two major cargo carriers that have signed the Cargo Carrier Airfield Use Agreement for the renewal term. For 2016, the signatory cargo carriers will be charged the signatory landing fee of $3.29. Air cargo landing weight projected for 2016 will be 161,553,000 forecasting zero growth as demonstrated in the table below. The cargo landing fees for 2016 are budgeted at $538,973. Audited 2014 Budgeted 2015 Projected 2015 Budgeted 2016 % Inc./Dec. Signatory Landing Fee Rate $3.06 $3.23 $3.44 $ % Landing Weights 000-lbs (MGLW) 152, , , , % Non-Signatory Landing Fee Rate $4.08 $4.04 $4.04 $ % Landing Weights 000-lbs (MGLW) 11,561 12,396 11,309 11, % 250,000,000 CARGO LANDING WEIGHT HISTORY 200,000, ,000, ,000,000 50,000,000 0 GLYCOL DISPOSAL FEE In late 2008 the Authority instituted a new glycol disposal fee to offset a portion of the direct costs associated with the removal and disposal of the glycol deicing fluid collected after use on aircraft. The fee is $2.30 per gallon and it is projected that there will be 150,450 gallons used. For 2016, $346,035 is budgeted. AIRLINE APRON FEES The Airline Apron Fee rate is calculated as one-tenth (1/10) of overall projected airfield costs divided by the terminal apron square footage (535,226 sq. ft). For 2016 the rate per square foot will be $1.23 which is -26.3% less than the 2015 projected amount of $1.67. Based on that rate, Apron Fees are budgeted at $657,802. TSA APRON FEE The Federal Transportation Security Administration pays rent for Apron space. Apron space rental fees budgeted for 2016 is $920. TENANT MAINTENANCE Tenant maintenance is a recovery for services and materials rendered to tenants by Airport employees. The amount of $65,000 is budgeted for CONTROL TOWER RENTAL The Federal Aviation Administration pays rent based on the annual cost to maintain the facility. This includes the direct and indirect operating and maintenance costs and debt service payments resulting from the construction of the facility by the Authority. It is projected this will generate $665,776 of revenues in 2016, the same as projected for
42 AvGas AvGas AvGas AvGas AvGas AvGas AvGas AvGas AvGas FIXED BASE OPERATOR (FBO) JET-A FUEL SALES Jet-A Fuel sales are the sale of fuel purchased by general aviation and charter companies. The amount of $4,442,352 is budgeted for The budgeted amount for 2016 was determined by projecting we would sell 974,200 gallons at $4.56 per gallon. AVGAS FUEL SALES AvGas fuel sales are the sale of fuel purchased for general aviation. The amount of $343,137 is budgeted for The budgeted amount for 2016 was determined by projecting we would sell 67,150 gallons at $5.11 per gallon. The following graph demonstrates the trend used to calculate the gallons for the 2016 budget. JET-A & AVGAS GALLONS SOLD 1,200,000 1,000,000 Jet A Jet A Jet A Jet A Jet A Jet A Jet A Jet A Jet A Jet A 800, , ,000 AvGas 200,000 0 AUTO GAS FUEL SALES Auto gas fuel sales are the sale of gasoline to the airlines for ground equipment. The amount of $106,813 is budgeted for 2016 which is 1.5% higher than the 2015 projected amount of $105,234 due to fluctuation in fuel costs. DIESEL FUEL SALES Diesel fuel sales are the sale of diesel fuel to the airlines for ground equipment. The amount of $254,020 is budgeted for 2016 which is 1.5% higher than the 2015 projected amount of $250,266 due to fluctuation in fuel costs. INTO PLANE Into Plane is the fee based on fuel pumped for the commercial airlines. A rate of $45 per fueling for non-signatory and $35 per fueling for signatory is charged. The amount of $616,034 is budgeted for 2016 which is 1.5% higher than the 2015 projected amount of $606,930. FUEL FARM Fuel Farm is a recovery fee for operating expenses by charging a fuel-flowage fee of $0.03 per gallon and a glycol flowage fee of $0.30 per gallon in The amount of $503,951 is budgeted for 2016 which is 10.0% higher than the 2015 projected amount of $453,587. It is projected there will be 15,318,350 gallons of fuel charged a fuel-flowage fee and 148,000 gallons of glycol charged a flowage fee. 3-6
43 GENERAL AVIATION LANDING FEES General aviation landing fees are the fees for landings charged to general aviation aircraft at the FBO facility. The fees range from $8.08 to $2, depending on the size of the aircraft. The amount of $268,759 is budgeted for 2016 which is a 0.5% increase from the 2015 projected amount of $267,422. GENERAL AVIATION PARKING FEES General aviation parking fees are the fees for aircraft parking at the FBO facility. The fees range from $11.25 to $875 depending on the size of the aircraft. The amount of $239,898 is budgeted for 2016 which is a 0.5% increase from the 2015 projected amount of $238,704. AVGAS FUEL SALES COMMERCIAL This revenue generated from a carrier who purchases fuel directly from the Authority. This carrier is projected to purchase 170,693 gallons of Avgas at $3.78 per gallon. The amount of $645,220 is budgeted for DEICING TYPE I - SPRAYED This is revenue generated from deicing commercial airlines and general aviation planes and is difficult to budget due to unpredictable winter weather. The amount of $548,000 is budgeted for It is predicted that 50,000 gallons will be sold at $10.96 per gallon. DEICING TYPE IV - SPRAYED This is revenue generated from deicing commercial airlines and general aviation planes and is difficult to budget due to unpredictable winter weather. The amount of $75,670 is budgeted for It is predicted that 7,000 gallons will be sold at $10.81 per gallon. DEICING TYPE I - CONSORTIUM This is revenue generated from the sale of Deicing Type I fluid at cost to commercial airlines and is difficult to budget due to unpredictable winter weather. The amount of $398,580 is budgeted for It is predicted that 73,000 gallons will be sold at $5.46 per gallon. DEICING TYPE IV - CONSORTIUM This is revenue generated from the sale of Deicing Type IV fluid at cost to commercial airlines and is difficult to budget due to unpredictable winter weather. The amount of $95,580 is budgeted for It is predicted that 18,000 gallons will be sold at $5.31 per gallon. DEICING GENERAL AVIATION This is revenue generated from deicing general aviation aircraft and is difficult to budget due to unpredictable winter weather. The amount of $39,700 is budgeted for It is predicted that 2,200 gallons of Type I will be sold at $16.00 per gallon and 250 gallons of Type IV will be sold at $18.00 per gallon. GENERAL AVIATION TENANTS General aviation tenants generate revenues rentals in the FBO facility such as office and hangar space. The amount of $281,141 is budgeted for 2016 which is 1.5% higher than the 2015 projected amount of $276,986. GENERAL AVIATION CUSTOMER SERVICE Customer service is revenue received from handling, catering, retail, and other general aviation services. The amount of $64,322 is budgeted for 2016 which is 0.5% higher than the 2015 projected amount of $64,002. TERMINAL AIRLINE SPACE RENTAL The Authority leases ticket counters, offices, baggage make-up rooms, gate/lounge areas and the baggage claim area in the terminal to the airlines servicing the Airport. Under the Airline Use and Lease Agreement (more on the airline use and lease agreement in section ten) the terminal signatory airline rental rate for 2016 is projected at $76.04 annually per square foot versus $74.78 annually per square foot in the 2015 adopted budget. 3-7
44 The rate for non-signatory airlines will be 125% of the signatory rate or $95.05 for 2016 versus $93.48 budgeted for Space rental fees budgeted for 2016 are $5,149,581. TSA SPACE RENTAL The Federal Transportation Security Administration pays rent for administrative space in the terminal. The rent includes both the direct and administrative costs incurred in maintaining their space plus an amount to amortize the construction costs over the five-year term of their Agreement. Revenue budgeted for 2016 is $421,234. NON-AIRLINES SPACE RENTAL-FLAT RATE The Authority leases terminal space to certain tenants at a fixed rate. The amount of $57,871 is budgeted for 2016 which is 1.6% higher than the 2015 projected amount of $56,964. NON-AIRLINES SPACE RENTAL The Authority leases terminal space at one-half the signatory airline rental rate of $38.02 annually per square foot in 2016 versus $37.39 in 2015 to non-airline tenants such as car rental companies, baggage delivery companies and others. The amount budgeted for 2016 is $148,126. LOADING BRIDGES The Authority leases 13 loading bridges. The rental rate charged to the airlines is based on the estimated direct and indirect costs to maintain the loading bridges. This includes both the operating and maintenance costs along with the debt service incurred to finance the purchase of the bridges. For 2016 the charge per loading bridge will be $37,044 annually versus $36,826 per bridge in The amount budgeted for 2016 is $481,566. TENANT MAINTENANCE The Authority performs various maintenance and repairs in-lieu of tenants hiring outside contractors. The Authority bills the tenants for the materials and labor incurred. The amount of $30,000 is budgeted for UTILITY REIMBURSEMENT TSA reimburses the Authority for electricity they use for equipment to check luggage at the checkpoint and behind the ticket counters. The amount budgeted for 2016 is $22,000. GROUND TRANSPORTATION PUBLIC PARKING Daily parking rates in short term, garage, long term, and economy parking lots are $24, $13, $10, and $6 respectively. For 2016, the parking revenue is projected to be $13,231,179, or $9.80 of revenue per enplanement (RPE) which is 4.7% higher than the 2015 projected amount of $12,613,175 due to parking fee increase. Also included in public parking revenues are the fees collected from 689 Albany based Airport employees and 119 non-albany based employees. Public parking rates are as follows: Albany Based Employee Parking (689 employees) $12 per year $8,268 Non-Albany Based Employee Parking (119 Flight Crew) $240 per year $28,560 Short Term Parking First half hour free, $2 second half hour and $2 an hour after $1,216,436 Long Term Parking $10 per day every day $3,720,619 Garage Parking $13 per day every day $5,490,589 Economy Parking $6 per day every day $2,766,707 Total Parking Revenue $13,231,
45 Available public parking spaces: As of As of Dec-14 Sep-15 Short Term - Garage/Surface Long Term - Garage 1,912 1,912 Long Term - Surface Lot A 1,278 1,281 Long Term - Surface Lot B N/A 187 Economy - Surface Lot E 2,246 2,283 Rental Cars Employees/Visitors Total: 6,502 6,557 ACCESS FEES The Authority collects a fee from the off-airport companies that derive revenue from the services they provide to Airport customers. These companies include: limousine companies, hotels and motels, off-airport parking facilities, and taxi cab companies. These companies have access to the commercial waiting zone in front of the terminal building and are charged for each entrance, an annual fee or a percentage of gross revenues. The fee and revenue collections for projected 2015 and 2016 are as follows: Projected Budget 2016 Budget vs Fees Projected 2015 Per Entrance: Limousine Services $1.41 per entrance $7,064 $7, % Taxi Cab Companies (Agreement) $1.41 per entrance $68,546 $72, % Per Vehicle (unlimited access): Hotels and Motels (38 vehicles) $650 yearly per vehicle $24,700 $24, % Off Airport Parking Facilities(Agreement) Gross Revenue x 10.0% $186,017 $195, % $286,327 $300, % CONCESSIONS The Airport receives various percentages of gross sales from on-site concessionaires servicing the Airport customers and the traveling public. Concessions include: rental cars, food and beverages, retail, advertising, museum shop, ground handling, business center, payphones, sale of phone cards, vending machines, ATM, and baggage cart rentals. Revenues for concessions are based on enplanements being 1,350,000 for the 2016 budget and enplanements being 1,286,944 projected Revenues per enplanement (RPE) are calculated by using an average year-to-year increase of sales per passenger and then by multiplying the RPE by the enplanements to get the projected and budgeted revenues for concessions. 3-9
46 Concession revenues are projected as follows: 2015 Projected 2016 Budget 2016 Budget vs RPE 2015 RPE 2016 Projected 2015 Rental Cars $4.32 $5,562,749 $4.32 $5,835, % Food & Beverage 0.52 $667, $699, % Retail 0.53 $687, $720, % Advertising 0.17 $225, $225, % Foreign Currency 0.02 $27, $26, % Museum Shop 0.20 $253, $266, % Operating Permits 0.08 $106, $106, % Telephone-Payphones 0.00 $3, $4, % Telephone-Tenants 0.06 $74, $75, % Phone Cards 0.00 $ $42 4.9% Bank ATMs 0.03 $35, $38, % Vending Machines 0.02 $26, $27, % Baggage Cart Concessions 0.01 $7, $7, % Total $5.97 $7,677,602 $5.95 $8,031, % OTHER AIRPORT LAND RENTAL The Airport charges rent for property owned by the Airport. The land rental charges are calculated based on a rate times the square footage or acreage occupied. The amount of $268,514 budgeted for 2016 is 1.9% higher than the 2015 projected revenues of $263,325. INDUSTRIAL PARK In 2001, the Authority purchased a 9½-acre site, now known as the Airport Industrial Park, with four warehouse buildings, all of which are currently leased. It is anticipated that in 2016 the Industrial Park will generate $433,426 in revenues, which is 2.9% higher than the 2015 projected revenues of $421,064 due to annual increases. GENERAL AVIATION T-HANGARS In 2002, construction was completed on a 10-unit T-Hangar building, self-service fuel facility and tie-down spaces for use by the general aviation community. As a result of additional demand, an additional 10-unit building was built and opened in early 2003 and two more 10-unit buildings were built in the summer of The Authority collects fees for the rental of the units, tie-down and the fuel sales. Revenue of $96,147 is budgeted for 2016 and is 3.5% lower than the 2015 projected revenues of $99,512. GENERAL AVIATION TIE-DOWNS It is anticipated that in 2016 the Tie-Downs will generate $3,756 which is equivalent to the 2015 projected revenues. AV GAS FUEL SALES AvGas fuel sales at the self service facility at the T-Hangars are based on General Aviation operations being 13,398 for the 2016 budget which is also projected for Rate per general aviation (RPGA) operation is calculated by using an average year to year increase and then by multiplying the RPGA by the average increase in RPGA to get the projected and budgeted revenue. The RPGA for 2016 is $4.17 and for projected 2015 $4.15. The 2016 budgeted amount is $55,900 which is in line with 2015 projected amount of $55,622. PARKING GARAGE SPACE RENT Included in the 2009 rental car agreement is return space rent for the rental cars. The $91,299 budgeted for 2016 which is 307 spaces at $ per space. HANGAR RENTAL The Authority owns four hangars in the northwest quadrant of the airport it rents to various tenants. The $330,306 budgeted for 2016 is 17.4% higher than the
47 projected amount of $272,688 due to new tenant. BUILDING RENTAL The Authority rents out various portions of buildings to various tenants. The 2016 budgeted amount is $158,394 which is 24.5% higher than the 2015 projected amount of $119,642 due to new tenant. CARGO BUILDING RENTAL FACILITIES In October 1998, operations began in a cargo facility built and financed by the Authority in the northeast quadrant of the Airport. An agreement with AFCO, who manages the building for the Authority, provides for the sharing of net revenues with the Authority, along with the Authority being fully reimbursed for the outstanding debt service payments in connection with the bonds issued in 1998 to finance construction of the facility. The Authority is reimbursed $964,260 annually by AFCO to cover the debt service payments on the facility along with 50% of any profit generated from rental fees or the Authority pays 50% of any loss generated by rental fees. Cargo building rental fees of $841,982 are budgeted for AIRCRAFT MAINTENANCE & SERVICE CENTER This aircraft maintenance and service center was completed in For 2016, $76,780 is budgeted which is 13.6% higher than the 2015 projected amount of $66,361 due to more space being rented and annual increase. STATE EXECUTIVE HANGAR In December 2000, the Authority issued debt to finance the construction of the New York State Police Executive Hangar and entered into a lease with the State of New York. The payments for 2016 are $1,247,083 per the lease agreement and will be sufficient to meet the debt service payments and any other costs anticipated to be incurred by the Airport for maintenance of the facility. UTILITY REIMBURSEMENT The Authority receives reimbursement from certain tenants for utility costs associated with their leased space. This revenue is calculated based on the actual kilowatt usage for electric or therm usage for natural gas times the current charge that the Authority receives from the electric/gas supplier. It is anticipated there will be $67,000 reimbursed for 2016 which is 2.3% higher than the projected 2015 amount of $65,479. REIMBURSEMENTS OF PROPERTY TAXES There are tenants located on landside property the Authority owns that are not aviation related businesses and therefore, real estate property taxes are levied on these properties. The tenants are obligated to reimburse the Authority for these taxes. Reimbursement is projected to be $25,000 for 2015 which is in line with projected INTERNET AND CABLE ACCESS The Authority receives reimbursement from certain Airport tenants who utilize the Authority s internet access network and the cable television network within the terminal. It is anticipated that $6,980 of revenues will be generated in The following table represents the revenues incurred from this service. Internet 6 lines at $55 per month $3,960 Internet 1 line at $85 per month $1,020 Cable 5 lines at $100 per quarter $2,000 Total Internet and Cable Access $6,980 FINGERPRINTING The Authority collects a fee of $38.00 per person for based tenants and $48.00 per person for non-based tenants which includes an $11.00 processing fee to offset the costs incurred to process fingerprints for Airport security clearance. There is also a badge renewal fee of $22.00 and a fee for lost cards; $50 for the first offense, $75 for the second offense and $125 for the third offense. It is anticipated that $22,000 in revenues will be 3-11
48 generated in The Airport processes approximately 700 fingerprint applications a year which includes Airport employees. TENANT MAINTENANCE The Authority performs various maintenance and repairs in-lieu of tenants hiring outside contractors. The Authority bills the tenants for the materials and labor incurred. It is projected that $5,000 will be generated for PURCHASING PROPOSALS The Authority collects fees from vendors who request proposals, contract bids and other forms of solicitations. The amount of $6,000 is budgeted for The Authority collects fees of $75 with drawings and $20 without drawings. SCRAP AND EQUIPMENT SALES The Authority utilizes an internet auctioning web site, Gov Deals for the disposal of Airport surplus items. Revenues result from Gov Deals sales together with the proceeds from the sale of surplus or scrap materials, equipment and abandon vehicles and other unclaimed items lost or abandoned by users of the Airport. The amount of $20,000 is budgeted for OTHER Various miscellaneous revenues are collected from non-repetitive sources. Revenues of $60,000 are budgeted for OTHER REVENUES INTEREST EARNINGS The Airport receives revenues from interest generated by investment of operating, capital, and reserve funds. There is $10,784 budgeted in TSA (LEO) REIMBURSEMENT This is a Law Enforcement Officer Reimbursement Agreement Program through the Federal Government which offers reimbursement for Sheriff staffing. The amount of $292,000 is budgeted for IMPROVEMENT CHARGES The rental car agreements provide for $ per space permonth for the 307 assigned spaces in the garage to pay the financing costs for constructing these spaces for their use. Revenues of $368,400 are included in the 2016 budget. 3-12
49 $16,000,000 $14,000,000 $12,000,000 $10,000,000 $8,000,000 $6,000,000 $4,000,000 $2,000,000 $ Operating Revenues by Category Projected 2015 Budget
50 Albany County Airport Authority Albany International Airport 2016 Budget REVENUES Audited Budget Projected Budget AIRFIELD Airline Landing Fees $4,231,691 $4,438,751 $4,769,239 $4,977,721 Airline Airfield Revenue Sharing (297,233) (149,150) (553,507) (542,012) Cargo Landing Fees 515, , , ,476 Airline Landing Fee Surcharge Cargo Landing Fee Surcharge Glycol Disposal Fee 343, , , ,035 Airline Apron Fee 811, , , ,527 TSA Apron Fee Tenant Maintenance 49,621 55,000 74,312 65,000 Control Tower Rental 665, , , ,776 $6,320,059 $6,725,269 $6,734,051 $6,712,442 FBO Jet A Fuel Sales $5,544,204 $5,401,533 $4,451,197 $4,442,352 Avgas Fuel Sales General Aviation 338, , , ,137 Auto Gas Fuel Sales 111, , , ,813 Diesel Fuel Sales 299, , , ,020 Into-plane 603, , , ,034 Fuel Farm 509, , , ,951 General Aviation Landing Fees 297, , , ,759 General Aviation Parking Fees 259, , , ,898 Avgas Fuel Sales Commercial 836, , , ,220 Deicing Type I - Sprayed 503, , , ,000 Deicing Type IV - Sprayed 58,429 80,920 61,218 75,670 Deicing Type I - Consortium 497, , , ,580 Deicing Type IV - Consortium 126, , ,566 95,580 Deicing - GA 53,636 39,700 42,300 39,700 General Aviation Tenants 255, , , ,141 General Aviation Customer Services 52,111 51,014 64,002 64,322 $10,348,396 $10,458,103 $8,899,710 $8,923,174 TERMINAL Airline Space Rental $4,391,524 $4,545,502 $4,668,692 $5,149,581 Airline Terminal Revenue Sharing (693,545) (348,017) (1,291,515) (1,264,695) TSA Space Rental 421, , , ,234 Nonairline Space Rental - Flat Rate 55,272 56,958 56,964 57,871 Nonairline Space Rental 140, , , ,126 Loading Bridge Rentals 437, , , ,566 Tenant Maintenance 37,396 16,000 31,105 30,000 Utility Reimbursement 27,058 26,000 21,984 22,000 $4,816,970 $5,342,085 $4,510,489 $5,045,682 GROUND TRANSPORTATION Parking $11,311,640 $11,244,389 $12,613,175 $13,231,179 Access Fees 263, , , ,356 $11,575,593 $11,513,033 $12,899,502 $13,531,
51 Albany County Airport Authority Albany International Airport 2016 Budget REVENUES Audited Budget Projected Budget CONCESSIONS Rental Cars $4,854,354 $4,994,700 $5,562,749 $5,835,305 Food and Beverage 670, , , ,787 Retail 707, , , ,979 Advertising 182, , , ,084 Foreign Currency 17,733 26,000 27,656 26,000 Museum Shop 233, , , ,226 Operating Permits 129, , , ,242 Telephone - Payphones 4,621 4,904 3,900 4,091 Telephone - Tenants 76,595 77,500 74,338 75,000 Phone Cards Bank ATMs 50,346 56,138 35,796 38,301 Business Center 23, Vending Machines 26,447 26,448 26,602 27,905 Baggage Cart Concessions 7,000 7,000 7,000 7,000 $7,027,934 $7,114,815 $7,677,602 $8,031,961 OTHER AIRPORT Land Rental $262,727 $263,325 $263,325 $268,514 Industrial Park 392, , , ,426 T Hangars 106, ,688 99,512 96,147 Tie Downs 3,646 3,646 3,756 3,756 T Hangar Avgas Fuel Sales 63,930 44,215 55,622 55,900 Parking Garage Space Rent 77,627 79,868 79,868 91,299 Hangar Rentals 153, , , ,306 Building Rental 52, , , ,394 Cargo Building Rental 848, , , ,982 Aircraft Maintenance & Service Center 70,461 72,336 66,361 76,780 State Executive Hangar/Maint 1,247,083 1,247,083 1,247,083 1,247,083 Utility Reimbursement 69,352 75,657 65,479 67,000 Reimbursement of Property Taxes 22,994 44,000 25,717 25,000 Internet and Cable Access 7,750 8,000 6,980 6,980 Fingerprinting 22,392 16,000 22,004 22,000 Tenant Maintenance 525 5, ,000 Purchasing Proposals 6,290 7,000 5,850 6,000 Scrap and Equipment Sales 18,836 20,000 14,438 20,000 Other 78,288 60,000 43,818 60,000 $3,505,149 $3,742,273 $3,728,635 $3,815,567 TOTAL REVENUES $43,594,101 $44,895,577 $44,449,988 $46,051,794 $0 $0 OTHER REVENUES 0 0 Interest Earnings $54,043 $12,999 $10,784 $10,784 TSA (LEO) Reimbursement 292, , , ,000 Improvement Charges 368, , , ,400 $715,381 $673,399 $671,184 $671,184 TOTAL REVENUES $44,309,482 $45,568,976 $45,121,172 $46,722,978 TOTAL REVENUES BEFORE REVENUE SHARING $45,300,260 $46,066,143 $46,966,193 $48,521,117 Airport Operations $34,236,483 $34,934,641 $37,395,300 $38,926,759 FBO Operations $10,348,396 $10,458,103 $8,899,710 $8,923,174 Other Revenues $715,381 $673,399 $671,184 $671,184 Total Revenues $45,300,260 $46,066,143 $46,966,193 $48,521,
52 4) EXPENSES SUMMARY OF EXPENSES Budgeted operating expenses for 2016 are $33,322,973 which is 5.2% higher than the $31,578,240 projected for Operating expenses include those incurred for AvPorts and Million Air management of the Airport and FBO functions. The following is a comparative summary of operating expenses: Audited Budget Projected Budget AvPorts $18,970,823 $20,537,025 $19,417,964 $21,017,106 Million Air 3,260,204 3,216,104 3,225,130 3,172,974 Million Air Cost of Sales 6,269,833 6,123,648 4,873,848 4,879,970 Authority 3,822,697 4,206,420 4,061,296 4,252,924 Total Operating Expenses $32,323,557 $34,083,197 $31,578,240 $33,322,973 DESCRIPTION OF BUDGETED 2016 EXPENSE BUDGET ITEMS COST CENTERS The expenditures in the budget are divided into seven direct cost centers: Airfield, Terminal, Loading Bridges, Landside, Parking, FBO Commercial, and FBO General Aviation and seven indirect cost centers: ARFF, Operations, Security, Vehicle and Equipment Maintenance, AvPorts Administration, FBO Administration, and Airport Authority Administration. The indirect cost centers are allocated to the seven direct cost centers in the calculation of the landing fee, terminal rental rates, apron rates, and loading bridge rates. The percentages for allocation are set forth in the Airlines Rates and Charges Summary section of this budget on page EXPENDITURES DESCRIPTIONS A detailed summary of expenditures by cost centers is included for each cost center mentioned above. Major expense items by category and major line items are described below. PERSONNEL SERVICES This includes salaries for AvPorts, Million Air, and Airport Authority personnel. There is an increase of 7.7% in the 2016 budget of $10,133,199 over the 2015 projected amount of $9,348,295. COLA increases for employees and pay rate adjustments have been provided for 2016 as dictated in various union contracts or other agreements. There was an adjustment made to Airport Authority employees; a decrease of one part time clerk. Summary of Employees 2014 Audited 2015 Budget 2016 Budget # of Additions AvPorts Million Air Authority
53 EMPLOYEE BENEFITS Employee Benefits are budgeted at $4,730,261 for 2016 which is a 7.3% increase from the 2015 projected amount of $4,385,141. This increase is due to the inflating costs of health insurance and retirement. SUMMARY BY SALARIES 2014 Audited 2015 Budget 2016 Budget & BENEFITS: Salaries Benefits Total Salaries Benefits Total Salaries Benefits Total AVPORTS $6,124,387 $2,729,725 $8,854,112 $6,441,091 $3,038,222 $9,479,313 $7,030,743 $3,047,560 $10,078,303 MILLION AIR 1,303, ,993 1,779,177 1,302, ,317 1,810,173 1,277, ,580 $1,776,644 AUTHORITY 1,673,376 1,068,488 2,741,864 1,769,960 1,152,483 2,922,443 1,825,392 1,183,121 $3,008,513 $9,100,947 $4,274,206 $13,375,153 $9,513,907 $4,698,022 $14,211,929 $10,133,199 $4,730,261 $14,863,459 UTILITIES AND COMMUNICATIONS This includes expenses to be incurred for electric charges, natural gas, sewer, water and communications. The $2,421,827 budgeted for 2016 is 3.1% more than projected 2015 amount of $2,347,045 due to increases in electricity, gas and telephone repairs. PURCHASED SERVICES Accounting and Auditing This category includes expenses to be incurred for the independent CPA firm employed to perform the year-end audit and for the firm employed to prepare the rates and charges and revenue sharing report analysis for the airlines. The $61,000 is budgeted for 2016 to cover these services. Insurance The $772,749 budgeted for 2016 is 1.7% higher than the 2015 projected amount of $759,621. Following is a summary of the 2015 projected and 2016 budgeted insurance coverage costs for the Authority: Projected Budget General Liability, including War Risk $ 360,107 $ 358,791 Business Automobile 58,220 59,347 Environmental Liability 43,279 43,279 Commercial Property 222, ,343 Crime 2,351 2,025 Public Officials & Employee Practices 26,321 26,321 Cyber Liability Insurance 5,448 11,907 Fiduciary Liability 1,249 1,236 Agent Fee 30,000 30,000 Insurance Claims 10,128 15,500 TOTAL $ 759,621 $ 772,749 Legal The 2016 budgeted amount is $50,000 for legal services which includes potential costs for pending cases. Public Safety This category includes armored car service, perimeter security at one of the gates in airfield and staffing at the TSA check point in the terminal. The amount budgeted for 2016 is $219,863 which is 1.7% more than the 2015 projected amount of $216,070 due to cost increases. Albany County Sheriffs This category includes the charges payable to the County of Albany for the services provided by the Albany County Sheriff s department. The $2,438,587 budgeted for 2016 is 10.5% more than the 2015 projected amount of $2,182,522 due to higher pension costs and health insurance. 4-2
54 Janitorial Services This category includes amounts payable for outside contractors for the janitorial services performed in the terminal including carpet, slate and terrazzo floor maintenance, the airfield building, and various buildings rented to tenants. It also includes refuse removal for all departments. The $441,786 budgeted for 2016 is 2.6% more than the 2015 projected amount of $430,412. Public Communications This category includes charges for the Authority s marketing and promotional expenses, funding for the Airport art program, museum shop DepARTure, as well as the costs for maintaining the information desk in the terminal. The $818,239 budgeted for 2016 is 14.9% higher than the 2015 projected amount of $695,991. The increase is due to in public relations and advertising to promote the Airport. Special Studies & GIS Services This category is used to research new methods to enhance the Airport and to evaluate business activities at the Airport. The $57,500 budgeted for 2016 is 179.5% lower than the 2015 projected amount of $160,703 due to research and studies on landside properties to lease and parking rate study in Professional Services This category includes the fees paid to AvPorts for their operational management services agreement for Airport operations, fees paid to Million Air for their operational management services agreement for FBO operations and other line items for architectural, consultant, engineering, inspection, testing, and code enforcement. The budgeted amount of $878,660 for 2016 is 14.4% higher than the 2015 projected amount of $751,951. This increase is due to architectural services to improve certain buildings. MATERIALS AND SUPPLIES Airfield This category contains the expenses associated with the airfield such as repair and maintenance of airfield lighting and pavement, tools and supplies for the airfield maintenance workers, snow removal supplies, expenses pertaining to the glycol collection and containment system, and emergency rescue supplies. The $899,200 budgeted for 2016 is 22.0% more than the 2015 projected amount of $701,601 due to increasing costs in snow removal supplies. FBO-Cost of Sales This category includes the expenses affiliated with fuel used for jets, general aviation, gasoline and diesel used for ground equipment, and deicing fluid. The $4,879,970 budgeted for 2016 is 0.1% more than the 2015 projected amount of $4,873,848. Buildings This category contains the expenses associated with the repair and maintenance of all Airport buildings including the terminal, FBO, parking, and landside buildings. The expense items include HVAC, pest control, baggage systems, electrical supplies, plumbing supplies, and miscellaneous supplies. The $1,468,405 budgeted for 2016 is 3.1% higher than the 2015 projected amount of $1,422,928 due to an increase in alarm improvements, electrical repairs and roof repairs. Grounds This category contains the expenses attributed to landscaping, roadway repairs, snow removal services and signage expenses for the parking lots, FBO, T-Hangars and Airport economic development areas. The $736,785 budgeted for 2016 is 16.1% more than the 2015 projected amount of $618,199 due to an increase of pavement repairs and liquid waste disposal. Vehicles and Equipment This category contains the expenses associated with the repair and maintenance of Airport vehicles, general equipment, supplies, tools, gas, diesel and radio communication equipment. The $1,031,516 budgeted for 2016 is 6.1% lower than the 2015 projected amount of $1,094,884 due to replacement and repair of general equipment and vehicles in
55 OFFICE This category contains the costs associated with the day-to-day operations of the Airport offices including copier rentals, office supplies, computer system support, forms, letterhead and postage. The $384,327 budgeted for 2016 is 25.3% higher than the 2015 projected amount of $287,011 due to an increase in need for computer system supplies, an increase in hardware/software maintenance agreements and an increase in office supplies. ADMINISTRATIVE This category contains the costs associated with dues, subscriptions, training, conferences, meetings, travel, legal notice advertising, property taxes, economic development, and credit card and EZPass processing fees. The $803,400 budgeted for 2016 is 6.5% higher than the 2015 projected amount of $750,932 due to employee education. NON-CAPITAL EQUIPMENT & FACILITIES Non-capital equipment purchases are major vehicles or major equipment items generally between $5,000 and $50,000 which are purchased annually as new or replacement items to support the operations and/or maintenance of the Airport. The total budget amount for anticipated equipment and vehicles is $95,700 for The following table demonstrates the probable purchases for Budget 2016 Item Requested Airfield $30,000 Truck lining and lining for two seperators Terminal 65,700 Build out for MDF (main distribution frame) room expansion (parts and racks) and two terminal B5H switches Total $ 95,
56 Expenses by Category For Budget 2016 Noncapital Equipment & Facilities 0.3% Admistrative 2.4% Offices 1.2% Personnel Services 30.4% Materials & Supplies 27.1% Employee Benefits 14.2% Purchased Services 17.2% Utilities & Comm 7.3% Albany County Airport Authority Albany International Airport 2016 Budget SUMMARY OF EXPENSES Audited Budget Projected Budget EXPENSES - SUMMARY Airport Management $18,970,823 $20,537,025 $19,417,964 $21,017,106 FBO Management 3,260,204 3,216,104 3,225,130 3,172,974 FBO Cost of Sales 6,269,833 6,123,648 4,873,848 4,879,970 Authority 3,822,697 4,206,420 4,061,296 4,252,924 TOTAL EXPENSES $32,323,557 $34,083,197 $31,578,240 $33,322,973 EXPENSES BY CATEGORY Personnel Services $9,100,947 $9,513,907 $9,348,295 $10,133,199 Employee Benefits 4,274,206 4,698,022 4,385,141 4,730,261 Utilities & Communications 2,359,864 2,664,808 2,347,045 2,421,827 Purchased Services Accounting & Auditing $46,377 $51,000 $62,863 $61,000 Insurance 727, , , ,749 Legal 12,460 50,000 36,541 50,000 Public Safety 205, , , ,863 Albany County Sheriffs 2,171,996 2,367,560 2,182,522 2,438,587 Janitorial 438, , , ,786 Public Communications 732, , , ,239 Special Studies & GIS Services 57,082 57, ,703 57,500 Professional Services 748, , , ,660 Total Purchased Services $5,140,479 $5,594,587 $5,296,674 $5,738,384 Materials & Supplies Airfield $661,147 $904,456 $701,601 $899,200 FBO - Cost of Sales 6,269,833 6,123,648 4,873,848 4,879,970 Buildings 1,507,137 1,489,832 1,422,928 1,468,405 Grounds 709, , , ,785 Vehicles & Equipment 1,187,844 1,108,748 1,094,884 1,031,516 Total Material & Supplies $10,335,716 $10,307,215 $8,711,460 $9,015,876 Office $267,449 $361,340 $287,011 $384,327 Administration 748, , , ,400 Noncapital Equipment & Facilities 96, , ,681 95,700 TOTAL EXPENSES $32,323,558 $34,083,197 $31,578,240 $33,322,
57 Operation Expenses by Department For Budget 2016 Administration 17.4% Airfield 9.2% Vehicle 4.2% Terminal 15.4% ARFF 5.3% Public Safety 11.1% Parking 11.4% FBO GA & Facilities 13.9% FBO Commercial 8.2% Loading Bridges 0.8% Landside 3.1% Albany County Airport Authority Albany International Airport 2016 Budget SUMMARY OF EXPENSES DEPARTMENT SUMMARY (Direct & Indirect) Audited Budget Projected Budget Direct Cost Centers Airfield $2,695,126 $3,052,820 $2,958,756 $3,079,119 Terminal 4,617,969 5,128,717 4,725,276 5,140,288 Loading Bridges 191, , , ,226 Landside: Parking 3,377,669 3,503,791 3,395,953 3,803,836 Landside Development 1,019,862 1,134, ,217 1,045,104 FBO Commercial 3,094,223 3,074,622 2,857,099 2,719,631 FBO GA & Facilities 5,743,070 5,584,096 4,574,536 4,631,498 Total Direct Cost Centers $20,739,515 $21,747,015 $19,651,045 $20,684,701 Indirect Cost Centers ARFF $1,763,640 $1,677,964 $1,707,667 $1,766,930 Operations 780, , , ,704 Security 2,486,474 2,704,942 2,497,948 2,801,557 Vehicle/Equipment 1,243,603 1,361,879 1,268,353 1,385,106 Airport Management Administration 793, , , ,235 FBO Administration 692, , , ,816 Airport Authority Administration 3,822,697 4,206,420 4,061,296 4,252,924 Total Indirect Cost Centers $11,584,042 $12,336,182 $11,927,195 $12,638,272 TOTAL EXPENSES $32,323,557 $34,083,197 $31,578,240 $33,322,
58 Albany County Airport Authority 2016 Expenditures by Line Item 2016 Budget 2016 Budget 2016 Budget AvPorts MA ACAA Budget Projected 2016 Over 2016 Over DESCRIPTION ACCT Totals Totals Admin Projected 2015 Projected PERSONNEL SERVICES Salaries ,552,831 1,177,496 1,825,392 9,555,719 8,476,538 1,079, % Overtime (1.5) ,524 99, , , , % Overtime (2.0) , ,388 92,026-59, % Temporary Help ,636-9, % Subtotal 7,030,743 1,277,064 1,825,392 10,133,199 9,348, , % EMPLOYEE BENEFITS Social Security ,670 97, , , ,959 48, % Health-Active ,887, , ,733 2,614,184 2,376, , % OPEB , , ,418 22, % Health-Dental ,557 27,557 29,643-2, % Health-Vision ,999 5,999 5, % Health-Aflac ,010 8,010 7, % Medical Exams ,500 1,500 15,000 17,147-2, % Capital EAP Program % Smoking Cessation Class ,200 1, , % Uniforms & Laundry ,250 8,000 47,250 44,221 3, % Uniform Purchases ,585 15,000 47,585 44,452 3, % NYS Disability Insurance/Life Ins ,171 3,154 1,657 98,982 79,607 19, % Unemployment Insurance ,714 21,617 5,943 77,274 73,127 4, % Workers Compensation ,109 62,687 8, , ,869 38, % Retirement Plans ,797 17, , , ,914-29, % Subtotal 3,047, ,580 1,183,121 4,730,261 4,385, , % UTILITIES & COMMUNICATIONS Electric ,585,250 64,000 24,000 1,673,250 1,648,065 25, % Natural Gas ,000 37,000 10, , ,521 22, % Sewer , ,500 93,369 1, % Water , , , % Telephone Charges - Local , ,500 19,160 18, % Telephone Charges - Long Distanc ,500 2,575 2, % Telephone-Sheriff , ,300 4, % Telephones-Monthly Service ,000 15,000 14, % Telephones-Monthly Usage ,000 2,000 1, % Payphones-Annual& Monthly Ser , ,363 37,452-10, % Payphones-Monthly Usage % Telephone Parts & Repairs , ,285 50,285 19,075 31, % Telephone Cellular , ,000 34,058 1, % Internet Access ,300 18,300 17,184 1, % Radio Communications , ,750 2, % Paging Services , ,350 1, % Cable Television ,136 1, ,794 6, % Subtotal 2,195, , ,803 2,421,827 2,347,045 74, % PURCHASED SERVICES Accounting and Auditing Financial ,000 55,000 57,873-2, % Rates and Charges ,000 6,000 4,990 1, % Subtotal ,000 61,000 62,863-1, % Insurance Airport Liability , , , , ,107-1, % Automotive , ,347 58,220 1, % Environmental Liability ,100 30,179 43,279 43, % Property Insurance ,150 50,357 1, , ,518 1, % Crime ,025 2,025 2, % Public Officials Liability ,321 26,321 26, % Cyber Liability Insurance ,907 11,907 5,448 Fiduciary Liability ,236 1,236 1, % Agent Fee ,000 30,000 30, % Insurance Claims , ,500 10,128 5, % Subtotal 252, , , , ,621 13, % 4-7
59 Albany County Airport Authority 2016 Expenditures by Line Item 2016 Budget 2016 Budget 2016 Budget AvPorts MA ACAA Budget Projected 2016 Over 2016 Over DESCRIPTION ACCT Totals Totals Admin Projected 2015 Projected Outside Services Legal ,000 50,000 36,541 13, % Public Safety ,438, ,438,587 2,182, , % Perimeter Security , , ,036 3, % Armored Car Services , ,100 8, % Safety Program % Janitorial Services , , , ,197 10, % Refuse Removal Services ,000 2,545 68,545 67,215 1, % Public Relations ,000 81, ,323 68,897 54, % Artistic Exhibits , ,990 94,183 3, % Departure , , ,147 17, % Business Center % Advertising , , ,578 42, % Passenger Information Booth , , ,186 4, % Special Studies , ,000 55, , , % GIS Services , ,500 2, % Subtotal 3,629,133 44, ,296 4,025,975 3,722, , % Professional Services Plumbing % Appraisals ,000 7,000 5,000 2, % Architectural , , , , % Consultant ,000 20,000 24,550-4, % Engineering Services , ,500 32,500 7,840 24, % Professional Management , , , ,401 4, % Code Enforcement ,160 45,160 45, % Subtotal 490, , , , , , % Total Purchased Services 4,372, , ,553 5,738,384 5,296, , % MATERIALS AND SUPPLIES Airfield Fencing , ,000 14,650-9, % Airfield Lighting System , , ,091-3, % Pavement Repairs , ,000 8,048-2, % Apron Maintenance , , , % Runway Painting , ,000 25, % Airfield Shop Supplies , ,000 16, % Airfield Shop Tools % Snow Removal Supplies , , , , % Rubber Removal , ,000 27,663 7, % ARFF EMS Supplies , ,000 2,991 2, % ARFF Supplies , ,000 11,012 8, % Hazardous Material Supplies , ,000 1,000 5, % Foam , ,200 15,200 5, % Glycol Glycol Disposal (BOD) , ,500 3, % Waste Water Conveyance , ,500 7, % Electricity & Gas , , ,481 9, % Sewer District Charges , ,000 5, % Water District Chemical Analysis , ,000 15, % System Maintenance & Repairs , , ,000 15, % Subtotal 899, , , , % FBO Fuel Cost - Jet ,640,082 2,640,082 2,568,306 71, % Fuel Discounts - Jet A , , , % Fuel Cost - Avgas , , ,616-7, % Fuel Discounts - AvGas ,000 4,000 3,920 Fuel Cost - Auto ,000 80,000 73,752 6, % Fuel Cost Diesel , , ,430 36, % Fuel Cost - Avgas Commercial , , , % Deicing Type I - Sprayed , , ,448 90, % Deicing Type IV - Sprayed ,918 37,918 50,231-12, % Deicing Type I - Consortium , , , , % Deicing Type IV - Consortium ,140 94, ,790-54, % Catering ,000 1, % Oil ,000 3,000 3, % TKS (Deicing fluid) ,000 1, , % Charts, Pilot Supplies % Subtotal 0 4,879, ,879,970 4,873,848 6, % 4-8
60 Albany County Airport Authority 2016 Expenditures by Line Item 2016 Budget 2016 Budget 2016 Budget AvPorts MA ACAA Budget Projected 2016 Over 2016 Over DESCRIPTION ACCT Totals Totals Admin Projected 2015 Projected BUILDINGS Alarm and PA Systems ,025 2,423 1,500 71,948 43,067 28, % Card Access Control , ,000 60,146-15, % CCTV Repair , , , % Key Access System , ,000 5,257 4, % Baggage System , ,000 14,605 5, % Electrical Repairs & Supplies ,800 10,500 2,000 84,300 40,265 44, % Elevator Repairs & Supplies ,056 2,400 2, , , % HVAC ,000 13,500 1, , ,290-41, % Roof ,500 3, ,000 6,642 19, % Plumbing Repairs & Supplies ,000 3,500 1,500 44, ,920-69, % Automatic Door Repairs & Suppli ,000 4,000 11,000 1,041 9, % Pest Control , ,720 6, % Fire Extinguishers , ,500 4,493 3, % Fire Equipment Testing , ,000 2, % US Customs , ,000 29, % Control Tower , , , % Storage Space Rental ,400 14,400 31,396-16, % Building Maintenance ,500 17,000 3, , ,417 4, % Janitorial Supplies ,500 7, ,500 96,751 40, % Window Washing ,814 3,200 1,289 65,303 63,495 1, % ID Tags , ,000 12,112 5, % Sign Expense , , , % FIDS , ,000 20, % Subtotal 1,372,355 67,503 28,548 1,468,405 1,422,928 45, % GROUNDS Landscaping , ,200 2,976 4, % Fencing % Pavement Repairs , ,500 9,778 6, % Utility Repairs % Sign Expense , ,100 5,720 2, % Traffic Light Repairs and Material , ,000 1,069 3, % Catch Basin Maintenance , , , % Snow Removal Supplies , ,000 71,729-1, % Snow Removal Contract Services , , ,265 8, % NYS Police Hangar , , , % Dump Fees - Landfill , ,150 2,000 1, % Hazardous Waste Management ,800 30,000 36,800 9,911 26, % Wildlife Hazard Management , ,000 6,254 8, % Liquid Waste Disposal ,000 25,000 50,000 2,770 47, % Land Lease , ,435 15, % T-Hangar Maintenance , , ,773 7, % Subtotal 680,585 56, , , , % VEHICLES AND EQUIPMENT Gasoline ,000 11,000 76,000 60,548 15, % Diesel Fuel ,200 60, , ,407 27, % CNG , ,000 18,346 6, % Oil/Grease , ,000 15,576 13, % Vehicle/Equipment Tires ,500 13,000 51,500 43,508 7, % Vehicle Repair and Maintenance ,000 1,500 63,500 73,074-9, % Veh Communication Equip. Repai ,000 2,000 8,000 1,328 6, % Sheriff Vehicle Repair and Mainte % Sheriff Radio Repair and Mainten % General Equip. Repair/Maintenanc ,000 55,000 95, , , % Quality Control Testing Equipmen ,000 6,000 7,287-1, % Heavy Equipment Maintenance , , , ,024-32, % ARFF Equipment Maintenance , ,000 6,848 13, % Snow Equipment Repair/Maintena , ,000 33,207 46, % Mower Repair/Maintenance , ,000 13,442-3, % Vehicle Shop Tools and Supplies ,000 6,500 36,500 33,130 3, % Fuel Truck Rental , , , % Subtotal 645, , ,031,516 1,094,884-63, % Total Materials and Supplies 3,597,841 5,389,388 28,648 9,015,876 8,711, , % 4-9
61 Albany County Airport Authority 2016 Expenditures by Line Item 2016 Budget 2016 Budget 2016 Budget AvPorts MA ACAA Budget Projected 2016 Over 2016 Over DESCRIPTION ACCT Totals Totals Admin Projected 2015 Projected OFFICE Office Equipment Rental ,836 1,786 8,000 16,622 15,017 1, % Copy Machine Use ,000 1, % Office Equipment Service Agreem , ,876 8,813 8, % Office Equipment Repairs % Computer System Supplies ,080 8,000 26,000 78,080 21,695 56, % Hardware/Software Maint Agreem ,737 8,390 35, , ,139 14, % Computer Equipment , ,120 16,930 6,787 10, % Office Furniture and Fixtures ,900 2,000 5,000 10,900 6,368 4, % Printed Forms/Letterhead ,500 1,000 1,500 6,000 2,547 3, % Parking Ticket Stock , ,000 16, % Printing Outside Services ,000 10,500 10, % Postage ,000 7,000 6, % Express Mail ,000 1,900 1, % Reference Materials , ,000 2,200 1,012 1, % Office Supplies ,700 6,000 12,000 31,700 30,187 1, % Payroll Services ,000 19,000 4,500 58,500 57, % Subtotal 219,001 47, , , ,011 97, % ADMINISTRATIVE Dues and Subscriptions ,959 17,000 22,000 48,959 47,493 1, % Airport Membership (ACI) ,000 12,000 11, % AAAE ,150 1, % GFOA % NYS Bar Association % NY Airport Managers Association ,000 5,000 5, % Local Chambers of Commerce ,706 5,706 5, % Center for Economic Growth ,500 2,500 2, % AvPorts/MA Training & Travel ,285 17,000 80,285 44,974 35, % Authority Travel and Education % Mgmt. Travel and Education ,000 20,000 18,164 1, % Functions/Refreshments ,000 25,000 27,500 26,267 1, % Outside Functions ,000 3,000 5,200-2, % Incentives ,000 45,000 41,894 3, % Tuition Reimbursement ,385-1, % Advertising/Public Meetings , ,000 13,000 11,121 1, % Economic Development ,000 1,000 1,000 12,000 10,712 1, % License and Permits , ,300 2, % Property Taxes , ,000 36,779 3, % Credit Card Service Charges , ,000 5, , ,072 4, % EZPass Fees , ,000 89, % County Indirect ,185 13,185 13, % Subtotal 458, , , , ,932 52, % TOTAL OPERATIONS 20,921,406 8,052,944 4,252,924 33,227,273 31,126,558 2,100, % Non-Capital Equipment , , , , % Total Expenses 21,017,106 8,052,944 4,252,924 33,322,973 31,578,240 1,744, % 4-10
62 5) AFCO AVPORTS MANAGEMENT, LLC S COST CENTER STRUCTURE The Authority has contracted with AFCO AvPorts Management LLC ( AFCO ) and Aviation Facilities Company, Inc. ( AFCO Parent ) to manage the day-to-day operations and maintenance of the Airport. Under AFCO AvPorts, there are five direct cost centers: Airfield, Terminal, Loading Bridges, Parking, and Landside and five indirect cost centers: ARFF, Operations, Security, Vehicles and Equipment Maintenance, and AvPorts Administration. Included in this section for each cost center there is a brief description with responsibilities, performance measurements, the goals and objectives with activities and the projected results to be achieved for 2014 and 2015, and the summary of expenses by category for each department with the department s employee count. Also included are the expenditures by line item, the schedule of salaries and benefits, and the organizational chart. A summary of AFCO AvPorts operating expenses by cost center is summarized in the following table. Audited Budget Projected Budget Airfield $ 2,695,126 $ 3,052,820 $ 2,958,756 $ 3,079,119 Terminal 4,617,969 5,128,717 4,725,276 5,140,288 Loading Bridges 191, , , ,226 Parking 3,377,669 3,503,791 3,395,953 3,803,836 Landside Development 1,019,862 1,134, ,217 1,045,104 ARFF 1,763,640 1,677,964 1,707,667 1,766,930 Operations 780, , , ,704 Security 2,486,474 2,704,942 2,497,948 2,801,557 Vehicle/Equipment 1,243,603 1,361,879 1,268,353 1,385,106 AFCO AvPorts Administration 793, , , ,235 TOTAL OPERATING EXPENSES $ 18,970,823 $ 20,537,025 $ 19,417,964 $ 21,017,
63 AIRFIELD This cost center includes the salaries and benefits for the airfield maintenance workers and the direct costs associated with the maintenance and repairs of all areas inside the Air Operations Area (AOA). This cost center is responsible for all areas within the AOA including the runways, taxiways and ramp areas. This cost center also includes the expenses for the glycol containment system and all maintenance and repairs for airside buildings including the airfield/vehicle maintenance facility. Airfield Performance Measurements 2014 Final 2015 Projected 2016 Budget Number of vehicle accidents on Airfield over $1, Airport remained open for all airline operations 100% 100% 100% Electrical work-orders SPEDES permit sanctions Gallons of deicing aircraft storm water fluid collected 18,495,907 18,250,000 25,000,000 Pounds of Biochemical Oxygen Demand in the collected storm water removed (the higher the better) 2.7% 3.1% 3.0% Employees with CDL licenses Runway incidents Notices to Airmen (NOTAMs) for airfield lighting Occupational Safety and Health Administration (OSHA) reportable incidents Liquid potassium acetate used on runways (avg gallons per snow ice event) 3,000 3,536 10,000 Airfield electric usage (KWH) 475, , ,000 Overtime/Personnel Services (%) 10.5% 15.4% 7.5% 5-2
64 Projected 2015 Strategic Plan Results and 2016 Strategic Goals for Airfield Goals Objectives Activities Improve snow removal Monitor maintenance costs while operating efficiently Schedule workers for 12- hour shifts during storms Assign specially trained employees to specific areas Clean obscured airfield lighting Minimize overtime Implement third shift Adjust the shifts for glycol employees Employ temporary employees Reduce glycol treatment system sludge removal and disposal costs Convert treatment system sludge into usable compost Collect less water (clean snow and rain) more BOD Use BOD as a gauge to test the effectiveness of waste water treatment Install and operate onsite composting system Promote Safety Provide safe work place Supply proper safety equipment Educate staff on safety through training and meetings Provide employees with proper training and drive time to pass CDL certification Maintain a satisfactory record on controlling effluent deicing fluid Comply with New York Encon State Safety regulations Operate according to Best Practice Standards 2015 Projected Results to be Achieved Airport remains open 100% for all airline operations Maintain a safe 140 foot runway Protect life and property Monitor the cost of snow removal supplies Keep collected storm water under 25m gallons Collect high BOD storm water to reduce operating cost Reduce Occupational Safety and Health Administration (OSHA) reportable accidents Forty-five employees will have their CDL licenses Operate at zero Encon sanctions and fines 2016 Budgeted Results to be Achieved Airport remains open 100% for all airline operations Maintain a safe 140 foot runway Protect life and property Monitor the cost of snow removal supplies Reduce overtime 8.0% If there isn t an extreme amount of bad weather Keep collected storm water under 25m gallons Collect high BOD storm water to reduce operating cost Reduce Occupational Safety and Health Administration (OSHA) reportable accidents Forty-nine employees will have their CDL licenses Operate at zero Encon sanctions and fines Summary of Expenses for Airfield Audited Budget Projected Budget Personnel Services $ 1,078,772 $ 1,169,049 $ 1,139,812 $ 1,213,714 Employee Benefits 499, , , ,242 Utilities & Communications 101, , , ,000 Purchased Services 194, , , ,791 Material & Supplies 811, , , ,585 Office 5,114 7,199 3,013 8,917 Administration 4,281 7,710 8,924 10,870 Non-capital Equipment & Facilities ,488 30,000 Total $ 2,695,126 $ 3,052,820 $ 2,958,756 $ 3,079,119 Employee Count
65 TERMINAL This department includes the salaries and benefits for the terminal maintenance and custodial staff. This department also includes all the direct costs associated with the daily maintenance and repairs of the terminal building. The expenditures include utilities, communication systems, window washing, elevator service, HVAC, electrical, plumbing, baggage systems, cleaning supplies, and the contracted services for the carpet, slate and terrazzo floor maintenance for the terminal facility. Terminal Performance Measurements 2014 Final 2015 Projected 2016 Budget HVAC Equipment in operation 97.9% 100.0% 100.0% Work Orders 3,587 3,532 3,600 Survey: cleanliness of the terminal 98% 80% 80% Average # of days a work order remains open Plumbing Equipment in operation 100% 100% 100% Terminal Maintenance direct cost per square $15.87 $15.84 $17.67 Terminal electrical usage (KWH): 79 Building 1,563,618 1,672,520 1,660,000 Terminal electrical usage (KWH): 98 Building 7,681,612 7,883,840 7,800,000 Overtime/Personnel Services (%) 5.6% 6.4% 5.0% Projected 2015 Strategic Plan Results and 2016 Strategic Goals for Terminal Goals Objectives Activities 2015 Projected Results to be Achieved 2016 Budgeted Results to be Achieved Provide terminal maintenance by maintaining cost efficiency, open communication, well maintained equipment, and monitoring outside contractors for the traveling public, tenants, and employees Maintain cost effectiveness for HVAC, plumbing, and building maintenance Maintain an attractive, clean and maintained terminal Work with the purchasing agent to reduce costs in supplies and equipment Perform a preventative maintenance program Compare the cost of outside contractors to the option of performing duties in-house Monitor work performed by outside contractors Monitor electricity usage by observing actual usage stated on invoices Conduct a daily walk through of all areas Minimize the costs of purchased services Minimize the costs of materials and supplies Ensure quality of work performed by contactors Monitor actual hours worked by contractors Monitor energy usage Achieve a well maintained and clean environment Minimize the costs of purchased services Minimize the costs of materials and supplies Ensure quality of work performed by contactors Monitor actual hours worked by contractors Monitor energy usage Achieve a well maintained and clean environment Conduct a survey Achieve an 80% favorable survey response Achieve an 80% favorable survey response Improve Staff efficiency Develop improved work assignments Conduct work inspection program Contract HVAC and plumbing repair to an outside company Issue daily assignments to leads Improve work accountability Maintain personnel services below budget levels Improve work accountability Maintain personnel services below budget levels 5-4
66 Summary of Expenses for Terminal Audited Budget Projected Budget Personnel Services $ 1,092,049 $ 1,166,285 $ 1,154,621 $ 1,343,517 Employee Benefits 520, , , ,925 Utilities & Communications 1,308,723 1,475,431 1,358,789 1,372,149 Purchased Services 988,788 1,097,051 1,012,418 1,096,001 Material & Supplies 636, , , ,031 Office 25,852 33,760 34,594 34,165 Administration - 2, Non-capital Equipment & Facilities 45, ,700-65,700 Total $ 4,617,969 $ 5,128,717 $ 4,725,276 $ 5,140,288 Employee Count 38.5* 41.0* 34.0* 41.0* *Includes 0.5 FTE for artistic exhibits and 5.5 FTE for museum shop. Their salaries and benefits are allocated to the direct expense. 5-5
67 LOADING BRIDGES This cost center includes the maintenance expenses and related debt service payments associated with 15 loading bridges. Revenues are collected in amounts sufficient to offset any expenses the Authority incurs. Loading Bridge Performance Measurements 2014 Final 2015 Projected 2016 Budget Direct Cost per Loading Bridge $12,773 $16,214 $17,682 Airline Employees trained as requested Over-the-Wing (OTW) Loading Bridge total operations 4,238 3,856 4,200 Loading Bridge electrical usage (KWH) (6.1% of 98 building gets allocated) 665, , ,000 OTW Loading Bridge Maintenance calls OTW Loading Bridge out of service 1.8% 14.5% 0.6% Overtime/Personnel Services (%) 13.0% 14.2% 9.9% Projected 2015 Strategic Plan Results and 2016 Strategic Goals for Loading Bridges Goals Objectives Activities 2015 Projected Results to be Achieved Maintain and service the loading bridges with minimum downtime Perform annual preventative maintenance program (PM) Continue on-site training to airline personnel 10 Strategic Continue Jet Bridge PM program (evening inspection program) Schedule a sequence for loading bridge PM s Continue to monitor OTW loading bridges Improve maintenance coordination for Over the Wing (OTW) bridges Provide training as requested to airline personnel PM s per schedule not completed due to loss of an employee No disruptions or delays to airline operations Maintain OTW out of service Reduce maintenance calls by 97.2% for OTW bridges Improve OTW loading bridge availability Maintain overtime at budget levels Offer training to airline personnel with no response- eight employees trained 2016 Budgeted Results to be Achieved Complete loading bridge PM s per schedule No disruptions or delays to airline operations Maintain OTW out of service Maintain low maintenance calls on OTW bridges Improve OTW loading bridge availability Maintain overtime at budget levels Train airline personnel to correctly operate the loading bridges as requested 5-6
68 Summary of Expenses for Loading Bridges Actual Budget Projected Budget Personnel Services $ 45,555 $ 75,329 $ 73,287 $ 81,401 Employee Benefits 29,360 36,647 43,561 37,675 Utilities & Communications 65,000 68,250 68,250 68,250 Purchased Services Material & Supplies 51,681 75,500 58,109 77,900 Office Administration Non-capital Equipment & Facilities - 12, Total $ 191,596 $ 268,368 $ 243,207 $ 265,226 Employee Count
69 PARKING This cost center is used to account for all the cost necessary to maintain the parking garage, the parking lots, and the shuttle buses used between the terminal and economy parking lot. This cost center also includes the salaries and benefits for the parking cashiers, maintenance workers, shuttle bus drivers and detailer, utilities, parking lot equipment maintenance and repair, parking ticket stock, maintenance of the shuttle buses, and snow removal services. Parking Performance Measurements 2014 Final 2015 Projected 2016 Budget Express parking transactions 290, , ,908 Cashier parking transactions 321, , ,430 Cashier parking transaction errors Shuttle Bus Survey N/A 85% 85% Customer/vehicle contact N/A 0 0 OSHA recordable accidents Parking electrical usage (KWH) 352, , ,158 Parking Garage electrical usage (KWH) (23.5% of 98 building gets allocated) 2,564,174 2,631,680 2,620,388 YTD Loss/Gain -$399 -$930 -$884 Overtime/Personnel Services (%) 14.1% 15.7% 7.4% Projected 2015 Strategic Plan Results and 2016 Strategic Goals for Parking Goals Objectives Activities 2015 Projected Results to be Achieved Promote express parking machines (automated credit card and EZ-Pass plus payments) Enhance the use of express parking machines Provide safe parking Improve parking safety Provide quality customer service Be courteous and responsive to all customers Train cashiers to assist customers with problem transactions at cashier free exits Monitor and inspect parking areas Conduct safety meetings with employees Monitor and provide training to employees to meet the demands of customers with patience and confidence Monitor employee s work performance Achieve customer satisfaction for express parking Maintain express parking transactions Minimize risk of customer/vehicle contact to zero Minimize OSHA recordable accidents Achieve quality customer satisfaction Maintain positive survey results by 85% Minimize parking transaction errors Minimize YTD loss/gain 2016 Budgeted Results to be Achieved Achieve customer satisfaction for express parking Maintain express parking transactions Reduce risk of customer/vehicle contact to zero Reduce OSHA recordable accidents to zero Achieve quality customer satisfaction Maintain positive survey results by 85% Reduce parking transaction errors by 5% Reduce YTD loss/gain 5% Cost Reduction Control the use of supplies Monitor salt use and procedures during the snow season Change to energy efficient bulbs in parking garage Monitor parking lights in economy lot Maintain expenses at budget level Maintain expenses at budget level 5-8
70 Summary of Expenses for Parking Actual Budget Projected Budget Personnel Services $ 1,411,572 $ 1,463,325 $ 1,361,219 $ 1,692,338 Employee Benefits 643, , , ,415 Utilities & Communications 360, , , ,825 Purchased Services 57,642 72,590 87,318 72,689 Material & Supplies 571, , , ,335 Office 30,147 74,784 37,792 78,384 Administration 302, , , ,850 Non-capital Equipment & Facilitie ,519 - Total $ 3,377,669 $ 3,503,791 $ 3,395,953 $ 3,803,836 Employee Count
71 LANDSIDE This cost center is used to account for expenses of the buildings and properties located outside the Air Operations Area (AOA). This cost center includes the costs to maintain those buildings and properties plus any Authority s responsibilities under lease agreements with tenants. Landside Performance Measurements 2014 Final 2015 Projected 2016 Budget Number of tenants Landside building rental (Sq ft) * 279, , ,855 Landside land rental (acres)* Tenant complaints *Includes rented space/land only Projected 2015 Strategic Plan Results and 2016 Strategic Goals for Landside Goals Objectives Activities Maintain properties Maintain properties to appropriate safety, operational, and appearance levels Schedule preventative maintenance Conduct monthly inspections of all buildings 2015 Projected Results to be Achieved Maintain the cost of materials and supplies at budget level 2016 Budgeted Results to be Achieved Maintain the cost of materials and supplies at budget level Maintain good tenant relationships Develop good communication channels to anticipate tenant needs Timely response to emergency conditions Inspect properties on timely basis Hold annual tenant meeting to advise tenant community of airport activity and exchange information Maintain zero tenant complaints Maintain good tenant relationships Reinforce airport community spirit Anticipate tenant concerns Maintain zero tenant complaints Maintain good tenant relationships Reinforce airport community spirit Anticipate tenant concerns Conduct tenant survey Expect 80% positive response on survey results Expect 80% positive response on survey results 5-10
72 Summary of Expenses for Landside Actual Budget Projected Budget Utilities & Communications 225, , , ,425 Purchased Services 54,332 86,319 38,453 81,319 Material & Supplies 680, , , ,310 Office 58 2, ,050 Administration 60,108 51,000 47,491 50,000 Non-capital Equipment & Facilitie Total $1,019,862 $1,134,601 $896,217 $1,045,104 Employee Count* *Two custodial workers maintain the Control Tower and 0.5 custodial worker maintains the ACAA building. Their salaries and benefits are allocated to the direct expense. 5-11
73 AIRCRAFT RESCUE AND FIRE FIGHTING (ARFF) This cost center includes the salaries and benefits for the ARFF employees, all the expenses for ARFF supplies, the maintenance expenses associated with the ARFF facility which includes HVAC, electrical, building maintenance, and the repair and maintenance of the ARFF vehicles and equipment. ARFF Performance Measurements 2014 Final 2015 Projected 2016 Budget Annual Dispatch Calls Tour conducted by ARFF AED classes conducted Fire Extinguishers inspected/serviced 5,743 5,424 5,500 NYS Fire Fighter training (training hours) 1,992 1,900 1,900 OSHA required fire training (training hours) NYS EMT training (training hours) FAA ARFF training (training hours) Building code inspections Overtime/Personnel Services (%) 16.4% 16.1% 10.2% Projected 2015 Strategic Plan Results and 2016 Strategic Goals for ARFF Goals Objectives Activities Life Safety Provide trained employees with lifesaving equipment Fire Alarm system Improve the current fire alarm system and expand its capabilities Train employees in the use of AEDs Purchase new Automated External Defibrillations (AEDs) to replace AEDs that have reached their life expectancy Send employees for Fire Fighter training Send employees to ARFF related schools Upgrade the present fiber optic system Increase fire alarm reporting capacity 2015 Projected Results to be Achieved Train Airport community Preserve life Place AED s in the Albany Airport Authority s building, Customs, Terminal and Millionaire building Meet state fire fighter requirement Train employees: 40 hour basic ARFF school Enable firefighters to better handle aircraft emergency Provide better reporting Increase capabilities to enter information to a specific room/area Meet the current needs of the terminal Preserve life 2016 Budgeted Results to be Achieved Train Airport community Preserve life Meet state fire fighter requirement Train employees Enable firefighters to better handle aircraft emergency Provide better reporting Increase capabilities to enter information to a specific room/area Meet the current needs of the terminal Preserve life 5-12
74 Summary of Expenses for ARFF Actual Budget Projected Budget Personnel Services $ 1,105,601 $ 1,028,640 $ 1,079,357 $ 1,100,935 Employee Benefits 463, , , ,351 Utilities & Communications 26,107 30,904 23,035 25,300 Purchased Services 3,396 3,396 3,363 3,396 Material & Supplies 120, ,501 86, ,680 Office 4,864 8,183 8,174 8,308 Administration 30,386 24,826 29,143 38,960 Non-capital Equipment & Facilities 10,105 12,000 10,871 - Total $ 1,763,640 $ 1,677,964 $ 1,707,667 $ 1,766,930 Employee Count
75 OPERATIONS The Operations cost center is the command center for the overall day-to-day operations of the airport. This cost center classification includes the salaries and benefits for the staff responsible for controlling the daily operations of the airport. Operations Performance Measurements 2014 Final 2015 Projected 2016 Budget Work Orders (Facility) Building Maintenance calls 3,315 3,536 4,000 Work Orders (139) aeronautical areas Notice to airmen (NOTAMS) 1, ,000 Bird Strikes Property Damage Reports Bodily Injury Reports FAA 139 Inspections discrepancies Operations' employee accidents Operations' property accidents Overtime/Personnel Services (%) 5.4% 4.2% 4.5% Projected 2015 Strategic Plan Results and 2016 Strategic Goals for Operations Goals Objectives Activities 2015 Projected Results to be Achieved 2016 Budgeted Results to be Achieved Continue to operate a safe and efficient facility for our tenants and traveling public Improve department safety Continue a department clean program Maintain accidents to zero Maintain accidents to zero Minimize the impact of airport-based wildlife on air carriers Conduct a review exercise of the emergency plan ANTN Digicast training Enhance the efficiency of the field condition reporting system Update operation s work environment Implement new wildlife hazard management plan Introduce insecticide treatment Work in conjunction with USDA to assist with wildlife mitigation techniques Operations employees attend FAA required wildlife training Apply insect pesticides Test the effectiveness of the emergency plan Update the Airport Emergency Plan (AEP) Increase awareness of the plan Provide training to Operation s personnel via computer based training program Continue to use apple ipad in the Saab friction tester Replace/ reposition monitors and create more efficient work space Minimize bird strikes Improve effectiveness of wildlife mitigation procedures Educate employees on current techniques and requirements Improve emergency effectiveness by eliminating unnecessary and out-of-date practices Improve emergency response Increase knowledge in work related activities to implement FAA regulations Maintain accidents to zero Improve communications Improve Airport security Produce better reporting Minimize bird strikes Improve effectiveness of wildlife mitigation procedures Educate employees on current techniques and requirements Improve emergency effectiveness by eliminating unnecessary and out-of-date practices Improve emergency response Increase knowledge in work related activities to implement FAA regulations Maintain accidents to zero Improve communications Improve Airport security Produce better reporting 5-14
76 Summary of Expenses for Operations Actual Budget Projected Budget Personnel Services $ 515,997 $ 556,864 $ 524,734 $ 564,152 Employee Benefits 206, , , ,027 Utilities & Communications 45,683 49,151 44,944 46,450 Purchased Services Material & Supplies Office 4,433 9,286 8,448 9,986 Administration 8,428 11,589 9,542 13,089 Non-capital Equipment & Facilities Total $ 780,971 $ 866,632 $ 836,308 $ 881,704 Employee Count
77 SECURITY This cost center classification includes the salaries and benefits for the Curbside Monitors, the costs affiliated with employee security checks and badging, security equipment, and the fees incurred to have the Albany County Sheriffs provide protective services on Airport premises. Security Performance Measurements 2014 Final 2015 Projected 2016 Budget Security Trainees Driver Trainees Finger Printing Badges Issued Revalidations Escort Required Badges Issued 2,672 3,960 2,500 Business Center Security Passes * Curbside Accidents Curbside Security - Overtime/Personnel Services (%) 3.8% 8.0% 2.2% *Foreign currency is no longer exchanged in the business center Projected 2015 Strategic Plan Results and 2016 Strategic Goals for Security Goals Objectives Activities 2015 Projected Results to be Achieved Continue to operate a secure facility for our tenants and traveling public; meet or exceed Transportation Security Agency (TSA) requirements Test the effectiveness of the security plan Increase the reliability of the card access control computer system Achieve zero civil penalties of fines from the Transportation Security Administration Improve the process for obtaining an Airport badge Conduct a security table top Participate in monthly meetings with TSA Procure service support agreement Conduct random testing of access control system during terminal inspections Upgrade proximity card technology Meet with TSA to review effectiveness of ASP and current procedures to maintain compliance Develop a security newsletter to be distributed to all Airport badge holders Develop a web based interface including a secure login and individual account for agencies that require an Airport badge Promote security awareness Increase public safety Ensure the availability of the system to ensure compliance with the Airport Security Program Identify areas that need improvement and develop solutions in conjunction with TSA Increase security awareness of Airport badge holders and reduce security violations Provide online service to users in order to complete and submit applications, make appointments, and receive security information improving efficiency and customer service 2016 Budgeted Results to be Achieved Promote security awareness Increase public safety Ensure the availability of the system to ensure compliance with the Airport Security Program Identify areas that need improvement and develop solutions in conjunction with TSA Increase security awareness of Airport badge holders and reduce security violations Provide online service to users in order to complete and submit applications, make appointments, and receive security information improving efficiency and customer service 5-16
78 Summary of Expenses for Security Actual Budget Projected Budget Personnel Services $ 173,010 $ 182,389 $ 171,979 $ 195,755 Employee Benefits 61,790 66,013 61,553 67,435 Utilities & Communications 4,619 4,670 4,176 4,670 Purchased Services 2,171,996 2,367,560 2,182,522 2,438,587 Material & Supplies 68,176 80,000 77,514 88,000 Office 6,883 4, ,110 Administration Non-capital Equipment & Facilitie Total $ 2,486,474 $ 2,704,942 $ 2,497,948 $ 2,801,557 Employee Count
79 VEHICLES AND EQUIPMENT This cost center includes the salaries and benefits for the vehicle maintenance employees responsible for the maintenance and repairs of all airport vehicles and heavy equipment including snow removal equipment (snow blowers, brooms and plows), heavy equipment (loaders, dump trucks, fuel trucks), road vehicles (pick-up trucks, shuttle buses, and vans), general equipment (paint machines, cement mixers and generators) and mowing equipment. Vehicle Maintenance Performance Measurements 2014 Final 2015 Projected 2016 Budget Heavy Equipment (Units) Light Vehicles (Units) Light Equipment (Units) Average age of ARFF Fleet (yrs) Average age of Shuttle Buses (yrs) Average age of Fuel Trucks (yrs) Average age of other large vehicles Average age of Pick-ups Shuttle Bus (Not less than 6 operational) Fuel Truck (Not less than 7 operational) Technicians trained Overtime/Personnel Services (%) 9.1% 14.1% 8.0% Projected 2015 Strategic Plan Results and 2016 Strategic Goals for Vehicles/Equipment Goals Objectives Activities Maintain ACAA owned fleet Maintain fuel trucks Maintain deicer trucks Maintain shuttle buses Maintain snow fleet Continue preventative maintenance program Continue preventative maintenance program Purchase two new buses Purchase new snow removal equipment 2015 Projected Results to be Achieved Provide not less than seven operational fuel trucks Minimize repairs on fuel trucks Provide zero downtime to provide on-time service to customers Provide not less than two operational deicer trucks Minimize repair on deicer trucks Provide zero downtime to provide on-time service to customers Provide not less than four shuttle buses Minimize shuttle bus down time Maintain an average age of ten years 2016 Budgeted Results to be Achieved Provide not less than seven operational fuel trucks Minimize repairs on fuel trucks Provide zero downtime to provide on-time service to customers Provide not less than two operational deicer trucks Minimize repair on deicer trucks Provide zero downtime to provide on-time service to customers Provide not less than four shuttle buses Minimize shuttle bus down time Maintain an average age of ten years Maintain ARFF fleet Improve work efficiency Get factory training on various systems and new equipment; factory training required with each new piece of equipment Utilize All Data Maintenance Program Continue preventive maintenance program Maintain FAA Index Train employees for ARFF equipment Manage preventative maintenance Create estimates and repair orders with ease Maintain FAA Index Train employees for ARFF equipment Manage preventative maintenance Create estimates and repair orders with ease 5-18
80 Summary of Expenses for Vehicles and Equipment Actual Budget Projected Budget Personnel Services $ 428,586 $ 521,237 $ 461,020 $ 550,424 Employee Benefits 224, , , ,744 Utilities & Communications 26,483 28,270 22,252 23,095 Purchased Services 55,035 58,904 58,220 59,347 Material & Supplies 504, , , ,000 Office 4,246 8,246 3,807 15,246 Administration 449 3,250 1,149 3,250 Non-capital Equipment & Facilities ,499 - Total $ 1,243,603 $ 1,361,879 $ 1,268,353 $ 1,385,106 Employee Count
81 ADMINISTRATION AFCO AVPORTS This cost center category includes the salaries and benefits for the AFCO AvPorts administrators and includes the office and administration expenses needed to support the AFCO AvPorts operations. AvPort's Administration Performance Measurements 2014 Final 2015 Projected 2016 Budget AvPort's total full time employment equivalents Total AvPort's overtime 10.5% 12.0% 6.8% Budgetary needs met yes yes yes Saving/revenue producing ideas Total AvPorts Property Damage Reports Administration Overtime/Personnel Services (%) 0.0% 0.0% 0.0% Employee turnover 19.9% 19.0% 19.0% Projected 2015 Strategic Plan Results and 2016 Strategic Goals for AFCO AvPorts Administration Goals Objectives Activities Improve staff efficiency Reduce overtime Improve safety Reduce accidents Team Albany Recognize employees Continue reward lottery for unused sick days Continue with the housekeeping plans in all departments Institute Safety Management System (SMS) Improve Safety Program Continue the Safety Encouragement and Recognition Program Institute Safety Jackpot Program Continue recognition programs and reevaluate programs Produce an employee newsletter 2015 Projected Results to be Achieved Minimize sick day usage Implement SMS Program Reduce vehicle accidents 3% Reduce all employee accidents 2% Reduce property damage reports by 3% Recognize an employee s good work effort Better informed employees Conduct town hall meetings Recognize employee anniversary dates 2016 Budgeted Results to be Achieved Minimize sick day usage Implement SMS Program Reduce vehicle accidents 2% Reduce all employee accidents 2% Reduce property damage reports by 5% Recognize an employee s good work effort Better informed employees Conduct town hall meetings Recognize employee anniversary dates 5-20
82 Summary of Expenses for AFCO AvPorts Administration Actual Budget Projected Budget Personnel Services $ 273,245 $ 277,973 $ 295,834 $ 288,506 Employee Benefits 81,392 85,116 89,630 88,746 Utilities & Communications Purchased Services 395, , , ,923 Material & Supplies Office 39,849 48,235 41,941 48,835 Administration 2,976 4,775 4,525 5,825 Non-capital Equipment & Facilities ,946 - Total $ 793,913 $ 837,311 $ 888,278 $ 848,235 Employee Count
83 Albany County Airport Authority AFCO AvPorts 2016 Expenditures by Line Item AvPorts Direct Cost Centers Indirect Cost Centers Admin 2016 Budget 2015 Projected Airfield Terminal Loading Parking Landside PUBLIC SAFETY/OPERATIONS Vehicles & AvPorts AvPorts AvPorts DESCRIPTION ACCT Bridges ARFF Operations Security Equipment Admin Totals Totals PERSONNEL SERVICES Salaries ,123,007 1,275,977 73,368 1,567, , , , , ,506 6,552,831 5,512,978 Overtime (1.5) ,441 56,283 6, , ,916 25,643 4,269 39, , ,859 Overtime (2.0) ,266 11,257 1,677 4,649 2, ,710 32,388 92,026 Subtotal 1,213,714 1,343,517 81,401 1,692, ,100, , , , ,506 7,030,743 6,261,863 EMPLOYEE BENEFITS Social Security ,339 83,523 5, ,595 81,299 41,195 14,293 40,812 21, , ,202 Health-Active , ,135 23, , , ,927 31, ,892 44,304 1,887,764 1,681,884 Medical Exams ,900 10,000 13,500 15,934 Capital EAP Program Smoking Cessation Class Uniforms & Laundry ,500 8, ,500 2,000 4,500 39,250 37,892 Uniform Purchases ,000 3, ,000 14,000 1,885 1,000 3,000 32,585 36,605 NYS Disability Insurance/Life Insu ,043 18,269 1,046 21,071 14,233 7,977 2,838 7,435 4,259 94,171 75,009 Unemployment Insurance ,497 10, ,034 5,720 3,745 2,881 3,169 1,008 49,714 44,320 Workers Compensation ,042 56,133 4,672 85,589 64,585 25,572 11,359 32, , ,965 Retirement Plans ,845 12,281 1,256 19,761 23,070 5,726 1,640 3,500 6,718 91,797 94,750 Subtotal 517, ,925 37, , , ,027 67, ,744 88,746 3,047,560 2,803,561 UTILITIES & COMMUNICATIONS Electric , ,000 68, ,000 85,000 15,000 7,000 1,585,250 1,561,802 Natural Gas ,000 75,000 10,000 16, , ,740 Sewer ,000 85,000 8,500 94,500 93,369 Water , , , ,212 Telephone Charges - Local ,500 3, , ,120 12,804 Telephone Charges - Long Distance Telephone-Sheriff ,300 4,300 4,176 Payphones-Annual& Monthly Servi ,363 27,363 37,452 Payphones-Monthly Usage Telephone Repairs , ,000 7,485 Telephone Cellular ,000 36,000 34,058 Radio Communications , ,370 2,000 Paging Services ,350 1,350 1,322 Cable Television ,136 4,136 4,136 Subtotal 107,000 1,372,149 68, , ,425 25,300 46,450 4,670 23, ,195,564 2,163,358 PURCHASED SERVICES Insurance Airport Liability ,923 5,923 5,750 Automotive ,347 59,347 58,220 Property Insurance ,339 70,193 44,589 37,632 3, , ,475 Insurance Claims ,000 5,000 15,500 10,128 Subtotal 16,839 80, ,589 37,632 3, ,347 5, , ,574 Outside Services Public Safety ,438,587 2,438,587 2,182,522 Perimeter Security ,095 41, , ,036 Armored Car Services ,100 8,100 8,034 Safety Program Janitorial Services , ,237 1, , ,425 Refuse Removal Services ,000 63,000 66,000 64,669 Artistic Exhibits ,990 97,990 94,183 Departure , , ,147 Business Center Passenger Information Booth , , ,186 Special Studies , ,000 35,000 GIS Services ,500 2,500 2,624 Subtotal 187, , ,100 3, ,438, ,629,133 3,348,826 Professional Services Plumbing Appraisals Architectural , ,000 50,000 0 Consultant Engineering Services ,000 15,000 30,000 0 Professional Management , , ,333 Code Enforcement Subtotal 0 25, ,000 40, , , ,333 Total Purchased Services 204,791 1,096, ,689 81,319 3, ,438,587 59, ,923 4,372,053 4,001,734 MATERIALS AND SUPPLIES Airfield Fencing ,000 5,000 14,650 Airfield Lighting System , , ,091 Pavement Repairs ,000 6,000 8,048 Apron Maintenance ,000 10,000 0 Runway Painting ,000 25,000 25,000 Airfield Shop Supplies ,000 16,000 16,465 Airfield Shop Tools Snow Removal Supplies , , ,000 Rubber Removal ,000 35,000 27,
84 Albany County Airport Authority AFCO AvPorts 2016 Expenditures by Line Item AvPorts Direct Cost Centers Indirect Cost Centers Admin 2016 Budget 2015 Projected Airfield Terminal Loading Parking Landside PUBLIC SAFETY/OPERATIONS Vehicles & AvPorts AvPorts AvPorts DESCRIPTION ACCT Bridges ARFF Operations Security Equipment Admin Totals Totals ARFF EMS Supplies ,000 5,000 2,991 ARFF Supplies ,000 20,000 11,012 Hazardous Material Supplies ,000 6,000 1,000 Foam ,200 20,200 15,200 Glycol Glycol Disposal (BOD) ,500 3,500 3,500 Waste Water Conveyance ,500 7,500 7,500 Electricity & Gas , , ,481 Sewer District Charges ,000 5,000 5,000 Water District Chemical Analysis ,000 15,000 15,000 System Maintenance & Repairs , , ,000 Subtotal 848, , , ,601 BUILDINGS Alarm and PA Systems , ,000 18,000 3,500 68,025 41,708 Card Access Control ,000 45,000 60,146 CCTV Repair ,000 15,000 0 Key Access System ,000 10,000 5,257 Baggage System ,000 20,000 14,605 Electrical Repairs & Supplies ,000 30,000 15,000 15,000 7,000 1,800 71,800 34,803 Elevator Repairs & Supplies ,056 30, , ,554 HVAC , ,000 2,000 10,000 25,000 8, , ,290 Roof ,000 4,000 2,000 15, ,500 6,642 Plumbing Repairs & Supplies ,000 19,000 2,000 10,000 4,000 39, ,960 Automatic Door Repairs & Supplie ,000 2,000 7,000 0 Pest Control , ,760 5,760 Fire Extinguishers ,500 7,500 4,493 Fire Equipment Testing ,000 3,000 2,765 US Customs ,000 30,000 29,778 Control Tower , , ,000 Building Maintenance ,000 85,000 50,000 19,000 30,000 4, , ,016 Janitorial Supplies ,000 3, ,500 89,929 Window Washing ,795 13, ,814 59,044 ID Tags ,000 18,000 12,112 Sign Expense ,000 3, , FIDS ,000 20,000 20,217 Subtotal 51, ,331 67, , ,860 36, , ,372,355 1,311,318 GROUNDS Landscaping ,000 4,000 1, ,600 2,096 Fencing Pavement Repairs ,000 8,000 3,000 16,000 9,778 Utility Repairs Sign Expense ,000 2,500 8,000 5,720 Traffic Light Repairs and Materials ,000 5,000 1,069 Catch Basin Maintenance ,500 3, Snow Removal Supplies ,000 5,000 70,000 71,729 Snow Removal Contract Services , ,000 25, , ,265 NYS Police Hangar , , ,000 Dump Fees - Landfill , ,000 3,150 2,000 Hazardous Waste Management , ,100 4,000 6,800 4,556 Wildlife Hazard Management ,000 3,000 15,000 6,254 Liquid Waste Disposal ,000 5,000 10, ,000 0 Land Lease ,435 15,435 15,435 T-Hangar Maintenance , , ,773 Subtotal 87,000 9, , ,450 1, , , ,194 VEHICLES AND EQUIPMENT Gasoline ,000 25,000 65,000 51,715 Diesel Fuel ,200 20, , , ,040 CNG ,000 25,000 18,346 Oil/Grease ,000 1,000 25,000 29,000 15,576 Vehicle/Equipment Tires ,000 8,000 2,500 21,000 38,500 32,189 Vehicle Repair and Maintenance ,000 27,000 62,000 72,462 Veh Communication Equip. Repair ,000 6,000 1,328 Sheriff Vehicle Repair and Mainten Sheriff Radio Repair and Maintena General Equip. Repair/Maintenance ,000 20,000 40,000 35,295 Heavy Equipment Maintenance ,000 50,000 82,530 ARFF Equipment Maintenance ,000 20,000 6,848 Snow Equipment Repair/Maintenan ,000 80,000 33,207 Mower Repair/Maintenance ,000 10,000 13,442 Vehicle Shop Tools and Supplies ,000 30,000 29,079 Subtotal 0 5,200 10, , , , , ,058 Total Materials and Supplies 986, ,031 77, , , , , , ,597,841 3,184,
85 Albany County Airport Authority AFCO AvPorts 2016 Expenditures by Line Item AvPorts Direct Cost Centers Indirect Cost Centers Admin 2016 Budget 2015 Projected Airfield Terminal Loading Parking Landside PUBLIC SAFETY/OPERATIONS Vehicles & AvPorts AvPorts AvPorts DESCRIPTION ACCT Bridges ARFF Operations Security Equipment Admin Totals Totals OFFICE Office Equipment Rental , , , ,600 6,836 5,612 Copy Machine Use Office Equipment Service Agreeme , ,685 4,788 4,538 Office Equipment Repairs Computer System Supplies ,180 12,000 6,700 1,000 2,000 5,700 8,450 1,350 44,080 7,722 Hardware/Software Maint Agreeme ,385 43,084 1, , ,737 46,245 Computer Equipment , ,350 1,350 1, ,850 4,600 15,110 3,799 Office Furniture and Fixtures , ,900 4,907 Printed Forms/Letterhead , , Parking Ticket Stock ,000 16,000 16,000 Printing Outside Services Express Mail Reference Materials , , Office Supplies ,500 1,500 2,500 1,700 2, ,000 13,700 13,105 Payroll Services ,000 35,000 34,212 Subtotal 8,917 34, ,384 8,050 8,308 9,986 7,110 15,246 48, , ,973 ADMINISTRATIVE Dues and Subscriptions ,000 6, ,959 9,710 A.A.A.E. Memberships AvPorts/MA Training & Travel , ,250 36,960 6, ,250 2,725 63,285 40,068 Functions/Refreshments Advertising/Public Meetings ,000 2,000 1,200 Economic Development ,000 10,000 10,712 License and Permits ,300 2,300 2,300 Property Taxes ,000 40,000 36,779 Credit Card Service Charges , , ,222 EZPass Fees ,000 90,000 89,390 Subtotal 10, ,850 50,000 38,960 13, ,250 5, , ,982 TOTAL OPERATIONS 3,049,119 5,074, ,226 3,803,836 1,045,104 1,766, ,704 2,801,557 1,385, ,235 20,921,406 18,982,641 Non-Capital Equipment ,000 65, , ,323 Total Expenses 3,079,119 5,140, ,226 3,803,836 1,045,104 1,766, ,704 2,801,557 1,385, ,235 21,017,106 19,417,
86 Albany County Airport Authority Albany International Airport 2016 Budget SCHEDULE OF SALARIES AND BENEFITS FOR AFCO AVPORTS SUMMARY OF AUTHORIZED POSITIONS: 2014 Audited 2015 Budget 2016 Budget OF FTE POSITIONS OF FTE POSITIONS OF FTE POSITIONS FTE Count Department As of Add Transfer Count Add Transfer Count Add Transfer Count Jun 2015 Airfield Maintenance Manager Deputy Maintenance Manager Airport Maintenance Supervisor Airport Maintenance Lead-Airfield Electrician Airport Maintenance Tech-Electrical Airport Maintenance Lead-Grounds Airport Maint Tech Lead-Glycol Airport Maint Tech-Glycol Airport Maint Tech Airfield Secretary Terminal Facilities Manager Facilities Maint Lead Facility Maint Lead-HVAC Facilities Maint Technician Custodial Supervisor Custodial Lead Custodial Worker Floor Care Technician Airport Custodial Technician Business Center Artistic Exhibits Museum Shop Loading Bridges Facilities Maint Lead-Loading Bridge Parking Deputy, Commercial Services Parking Supervisor Lead Cashier Cashier, Full Time Cashier, Part Time - FTE Shuttle Operator Lead Shuttle Detailer Shuttle Operator, Full Time Shuttle Operator, Part Time - FTE Lead Parking Maint Tech Parking Assistant Parking Maint Technician Security Curbside Monitors Curbside Monitors, Part Time - FTE Landside Tower/Custodial Admin Blding/Custodial ARFF Chief/Safety Manager Captains/Safety Supervisor Firefighters/Safety Officer Operations Airport Operations Manager Airport Security Supervisor Assistant Airport Security Supervisor Airport Operations Supervisor Airport Operations Officer Receptionist Vehicles & Equipment Airport Maint Lead-Vehicle Maint Inventory Control Specialist Airport Maint Tech-Vehicle Maint Administration Total AFCO AvPorts Positions # of SUMMARY BY SALARIES & BENEFITS: 2014 Audited 2015 Budget 2016 Budget Additions/ AFCO AvPorts Salaries Benefits Total Salaries Benefits Total Salaries Benefits Total Transfers Airfield 1,078, ,135 1,577,907 1,169, ,697 1,719,746 1,213, ,242 1,730, Terminal 1,092, ,795 1,612,844 1,166, ,259 1,751,544 1,343, ,925 1,944, Loading Bridges 45,555 29,360 74,915 75,329 36, ,976 81,401 37, , Parking 1,411, ,559 2,055,131 1,463, ,263 2,209,588 1,692, ,415 2,431, ARFF 1,105, ,021 1,568,622 1,028, ,513 1,497,153 1,100, ,351 1,579, Operations 515, , , , , , , , , Security 173,010 61, , ,389 66, , ,755 67, , Vehicles & Equipment 428, , , , , , , , , Administration 273,245 81, , ,973 85, , ,506 88, , Total AFCO AvPorts Salaries & Benefits 6,124,387 2,729,725 8,854,112 6,441,091 3,038,222 9,479,313 7,030,743 3,047,560 10,078,

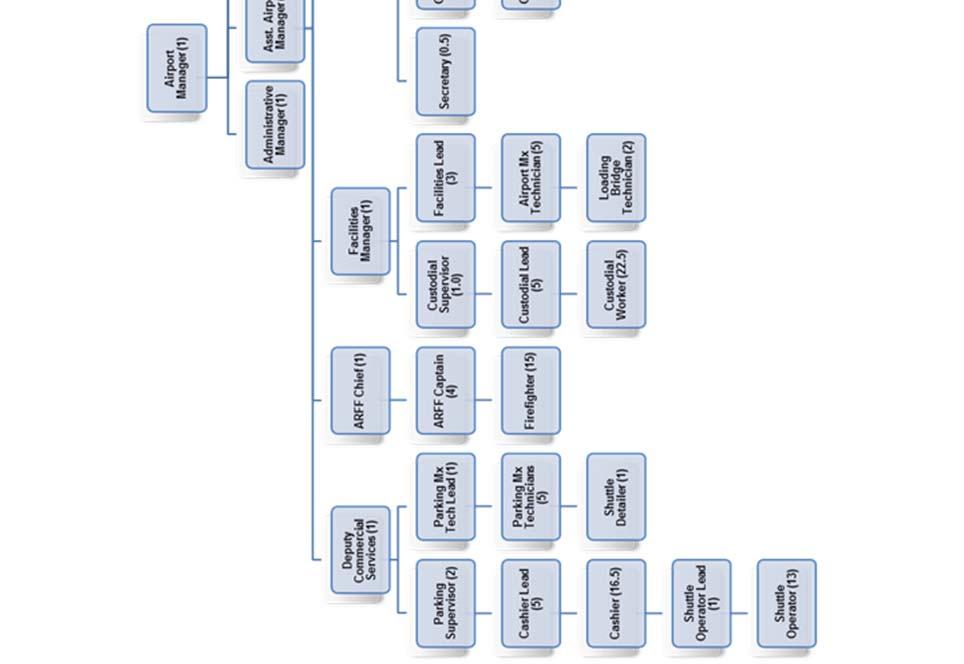
87 AvPort s Organizational Chart 5-26
88 6) MILLION AIR FIXED BASE OPERATOR The Authority contracted with Go Albany, Inc. (d/b/a Million Air) to manage the daily operations of the Fixed Based Operation (FBO). In 2005 The Authority elected to assume the direct management responsibility for the FBO. Million Air s operating agreement commenced on Oct 1, Million Air s projected operations for 2016 are summarized in the following table. Albany County Airport Authority FBO Operations Summary Projected Budget 2016 Commercial GA & Fueling Facilities Admin Total Budget Revenues Retail Fuel Jet A Fuel Sales $ - $ 4,442,352 $ - $ 4,442,352 $ 5,401,533 AvGas Fuel Sales - 343, , ,667 Auto & Diesel Fuel Sales 360, , ,605 Retail Fuel Sales 360,833 4,785,489-5,146,321 6,168,804 Into-Plane Fees 616, , ,007 Fuel Farm Fees 503, , ,821 Landing Fees - 268, , ,327 Parking Fees - 239, , ,319 Commercial AvGas 645, , ,566 Deicing 1,117,830 39,700-1,157,530 1,299,280 Properties - 281, , ,963 FBO Services (Catering, etc) - 64,322-64,322 51,014 Total Revenues 3,243,866 5,679,308-8,923,174 10,458,102 Cost of Sales ( ) Fuel Cost - Jet A - 2,640,082-2,640,082 3,544,651 Fuel Volume Discounts - 320, , ,000 Fuel Cost - AvGas - 259, , ,616 Fuel Volume Discounts 4,000 4,000 - Fuel Cost - Auto & Diesel 300, , ,000 Fuel Cost 300,000 3,223,281-3,523,281 4,537,267 Fuel Cost - Avgas Commercial 582, , ,680 Deicing Type I - Sprayed 265, , ,606 Deicing Type IV - Sprayed 37, ,918 43,935 Deicing Type I - Consortium 371, , ,580 Deicing Type IV - Consortium 94, , ,080 Deicing Cost 769, , ,201 Catering - 5,300-5,300 6,500 Total Cost of Sales 1,651,389 3,228,581-4,879,970 6,123,648 Gross Operating Revenue 1,592,478 2,450,727-4,043,205 4,334,454 Expenses ( ) Personal Services Salaries 419, , ,777 1,177,496 1,209,537 Overtime 41,935 57,633-99,568 93,319 Total Personal Services 461, , ,777 1,277,064 1,302,856 Employee Benefits 163, ,553 84, , ,317 Utilities & Communications 31,940 71,440 1, , ,769 Purchased Services 79, , , , ,739 Material & Supplies Buildings 11,500 56,003-67,503 64,482 Grounds 55,000 1,100-56,100 56,100 Vehicles 265, , , ,316 Total Material & Supplies 331, , , ,898 Administration - 202,000 62, , ,780 Non-Capital Equipment Total Expenses 1,068,242 1,402, ,816 3,172,974 3,213,359 FBO Net Direct Revenue $ 524,236 $ 1,047,810 $ (701,816) $ 870,230 $ 1,121,095 Allocation of Indirect Cost Centers ARFF $ 53,008 $ 53,008 $ - $ 106,016 $ 105,818 Operations 44,085 44,085-88,170 78,097 Security 28,016 28,016-56,031 49,729 Vehicles & Equipment 69,255 41, ,808 99,488 AvPorts Administration 47,305 58, , ,009 FBO Administration 312, ,942 (701,816) - 11,710 ACAA Administration 285, , , ,974 Total Allocation 839, ,081 (701,816) 1,107,115 1,092,827 Debt Service Depreciation - Capital Assets 148,300 86, , ,751 FBO Net Results $ (463,913) $ (7,722) $ - $ (471,635) $ (206,483) 6-1
89 Under Million Air (MA) there are two direct cost centers: MA commercial and MA general aviation and one indirect cost center: MA Administration. Included in this section for each cost center there is a brief description with responsibilities, performance measurements, the goals and objectives with activities and the projected results to be achieved for 2014 and 2015, and the summary of expenses by category for each department with the department s employee count. Also included are the expenditures by line item, the schedule of salaries and benefits, and the organizational chart. MA COMMERCIAL This cost center classification includes the salaries and benefits for the employees who service the commercial airlines, all the expenses incurred by the fuel farm, expenses incurred by the fuel trucks and other vehicles used for the commercial airlines, and the cost incurred from the purchase of fuel, glycol, gas and diesel for resale to the commercial airlines. Commercial Aviation Performance Measurements 2014 Final 2015 Projected 2016 Budget Number of accidents/incidents Number of airline delays counted against MA Into-plane gallons pumped 16,971,830 17,074,057 17,074,057 Number of Audits performed by Airlines/ Quality Control- Employeee Training Records Number of non-compliance items reported in Airline Audits AvGas fuel sales commercial 180, , ,881 Deicing gallons pumped 154, , ,450 Workers' compensation cases Employees who have completed Safety Programs Quality control audits at the Fuel Farm (less the better) Completed monthly training programs Monthly survey of airlines 100% 100% 100% Overtime/Personnel Services (%) 12.8% 10.4% 9.1% 6-2
90 Projected 2015 Strategic Plan Results and 2016 Strategic Goals for MA Commercial Goals Objectives Activities 2015 Projected Results to be Achieved Promote Albany International Airport as a leader in on-time scheduled departures Provide efficient and timely airline fueling Operate an Equipment Preventative Maintenance Program Offer continuous Airline Training Monitor airline schedules and adjust manpower schedules accordingly Minimize Airline fuel delays to zero Sustain safe and professional aircraft servicing Increase overall efficiency of the department 2016 Budgeted Results to be Achieved Reduce Airline fuel delays to zero Sustain safe and professional aircraft servicing Increase overall efficiency of the department Promote a high comfort level to the airline community by providing high-grade fuel quality and service at Albany International Airport Provide exceptional quality control and be responsive to the Airline s needs Provide recurrent Fuel Farm Technician Training Audit policies and procedures on a regular basis Build better relationships with the Airlines through communication and support Monitor the fuel farm to maintain safe standard as set by the Air Transport Association 103 (ATA 103) Train Employees Reduce quality Control Audit findings 45% Safe and professional aircraft servicing with minimal delays Promote a safe and efficient environment at Albany International Airport Provide the Airlines with an Incident Free environment Conduct NATA (National Air Transportation Association) Safety 1 st training Conduct monthly safety committee meetings Supervisor on duty for all airline operations supporting and auditing fueling and safety procedures Provide certified, qualified employees Promote enhanced safety culture/safe work environment Provide quality service Minimize delays due to aircraft damage Train Employees Reduce quality Control Audit findings 20% Safe and professional aircraft servicing with zero delays Provide certified, qualified employees Promote enhanced safety culture/safe work environment Provide quality service Zero delays due to aircraft damage 6-3
91 Summary of Expenses for MA Commercial Actual Budget Projected Budget Personnel Services $ 443,761 $ 469,254 $ 447,168 $ 461,281 Employee Benefits 175, , , ,518 Utilities & Communications 21,550 24,443 31,910 31,940 Purchased Services 75,085 74,171 77,251 79,871 Material & Supplies 2,373,073 2,327,013 2,162,672 1,983,021 Office Administration 4,907 2, Non-capital Equipment & Facilities Total $ 3,094,223 $ 3,074,622 $ 2,857,099 $ 2,719,631 Employee Count MA GENERAL AVIATION This cost center classification includes the salaries and benefits for the employees who service the general aviation community, the customer service representatives, all the expenses incurred for the FBO building and hangars such as electric, telephone and general maintenance, the purchases of aviation fuel, diesel, oil, deicing fluid, and catering for the general aviation community, the vehicles used for general aviation aircraft and customers, the credit card processing fees from general aviation sales, and all other related expenses incurred on behalf of the general aviation community. General Aviation Performance Measurements 2014 Final 2015 Projected 2016 Budget AvGas fuel sales (gallons) 55,902 53,953 53,953 Jet A fuel sales (gallons) 952, , ,397 Number of international flights General Aviation Aircraft customer transactions 6,515 6,022 6,203 Number of Aircraft arrivals 6,073 5,582 5,600 Number of Aircraft fueled 4,870 4,178 4,200 Number of ramp fees collected 1,883 1,656 1,700 Number of landing fees collected 4,060 3,860 4,000 Employees who completed the NATA Safety 1st Program Employees who completed all Safety Programs Property Accidents Quarterly reports from monthly safety meetings 100% 100% 100% Number of top 20 customers surveys completed Overtime/Personnel Services (%) 10.0% 10.1% 9.6% 6-4
92 Projected 2015 Strategic Plan Results and 2016 Strategic Goals for General Aviation Goals Objectives Activities 2015 Projected Results to be Achieved 2016 Budgeted Results to be Achieved Promote Million Air and the Albany International Airport as the Gateway to the Capital District Establish Million Air Albany as the preferred provider of FBO service in the North East Region Supply Five Star Service to the general aviation community Provide continuous professional line service training Provide continuous customer service standards training Utilize Million Air CSI informational software programs Network with all Million Air locations 100% satisfaction to the general aviation public Train professional employees Monitor fees rates and charges to meet revenue goals Enhance customer experience Expand customer data base Ensure security to the general aviation public without customer inconvenience Implement the required security programs Monitor the needs of the general aviation public Emphasis on the customer s needs while implementing the required security programs Install security cameras Increase market share of international flights Establish Albany International Airport as an international tech stop Partnered with professional flight operation companies who provide international flight plans Work with U.S. Customs to enhance customer experience Promote Albany as a clearing location through networking, marketing and tradeshows Provide service and facilities to enhance customer usage Provide clean, safe and secure lobby area and hangar facilities for the corporate and general aviation Perform weekly and daily inspections of the hangar facilities Maintain the cleanliness of the hangar facilities Have hangar facility available to show perspective clients at a moment s notice Renovate lobby area to include new carpet, paint and furniture 100% Secure Aviation Terminal Zero property accidents Monitor security and safety Promote International flights Promote general aviation leased space Safe secure hangar facilities Provide customers with clean comfortable area to lounge 100% satisfaction to the general aviation public Train professional employees Monitor fees rates and charges to meet revenue goals Enhance customer experience Expand customer data base 100% Secure Aviation Terminal Zero property accidents Monitor security and safety Promote International flights Increase general aviation leased space 3.0% Safe secure hangar facilities Provide customers with clean comfortable area to lounge 6-5
93 Summary of Expenses for MA General Aviation # Actual Budget Projected Budget Personnel Services $ 616,002 $ 589,649 $ 649,159 $ 600,006 Employee Benefits 238, , , ,553 Utilities & Communications 83,440 98,158 67,966 71,440 Purchased Services 96,524 89,131 99, ,131 Material & Supplies 4,492,748 4,342,533 3,327,537 3,406,368 Office 2,307 1, ,000 Administration 213, , , ,000 Non-capital Equipment & Facilities ,038 - Total $ 5,743,070 $ 5,584,096 $ 4,574,536 $ 4,631,498 Employee Count MA ADMINISTRATION This cost center classification includes the salaries and benefits for the employees who manage operations for the FBO and train the employees, telephone charges, and costs incurred for public relations, office supplies and administrative expenses. Million Air's Administrative Performance Measurements 2014 Final 2015 Projected 2016 Budget Million Air's total full time employment equivalents Total Million Air overtime 9.3% 8.5% 7.8% Number of marketing events attended Number of based tenants Employee turnover annum 25% 14% 6% Workers' Compensation cases Number of customers gained (prior year comparison) 6% 5% 3% Overtime/Personnel Services (%) 1.2% 0.6% 0.0% 6-6
94 Projected 2015 Strategic Plan Results and 2016 Strategic Goals for MA Administration Goals Objectives Activities 2015 Projected Results to be Achieved 2016 Budgeted Results to be Achieved Promote Million Air and the Albany International Airport as the Gateway to the Capital District Increase General Aviation services and related based services at the Albany International Airport Insure high quality of services provided Target specific general aviation companies to establish a presence at Albany International Airport Maintain Million Air branded services and procedures Increase availability of services provided to general aviation customers at Albany International Airport Industry recognition of Albany International Airport as a premier FBO service provider Increase availability of services provided to general aviation customers at Albany International Airport Industry recognition of Albany International Airport as a premier FBO service provider Promote awareness to the general aviation industry of Albany International Airport s potential Increase potential growth opportunities both short and longterm for the Albany International Airport Implement new marketing strategies Utilize Million Air s business relationships Network with Million Air chain Utilize Million Air software systems as a marketing tool Attend aviation business conferences New general aviation related businesses located at Albany International Airport Increase customer base, new customer 15% Enhance marketing ability Promote MA/Albany New general aviation related businesses located at Albany International Airport Increase customer base, new customer 2% Enhance marketing ability Promote MA/Albany Provide proficient and efficient operations to airlines and general aviation customers at Albany International Airport Develop an efficient and proficient management and administrative team and processes which would increase potential revenues generated and maintain expenses within budget guidelines Monitor staffing to insure levels are satisfactory for operational performance Develop employee talent through Million Air training programs Maintain and monitor cost control procedures Enhance data processes for more efficient P&L reporting Adjusting sources of revenue streams to yield desired net results Reduce overtime 1% Create efficient general aviation and airline operations Maintain operations within budget guidelines High quality efficient operations Provide a positive work environment Maintain overtime at budget levels Create efficient general aviation and airline operations Maintain operations within budget guidelines High quality efficient operations Provide a positive work environment 6-7
95 Summary of Expenses for MA Administration Actual Budget Projected Budget Personnel Services $ 243,421 $ 243,953 $ 232,106 $ 215,777 Employee Benefits 61,588 78,314 57,129 84,509 Utilities & Communications 681 2,050 2,665 1,080 Purchased Services 343, , , ,775 Material & Supplies Office 33,036 41,332 28,365 45,675 Administration 10,820 16,948 7,368 17,000 Non-capital Equipment & Facilities Total $ 692,744 $ 681,034 $ 667,343 $ 701,816 Employee Count
96 Albany County Airport Authority Million Air s 2016 Expenditures by Line Item MA Cost Centers 2016 Budget 2015 Projected MA MA MA MA MA DESCRIPTION ACCT Comm GA & Fac Admin Totals Totals PERSONNEL SERVICES Salaries , , ,777 1,177,496 1,215,212 Overtime (1.5) ,935 57, , ,221 Subtotal 461, , ,777 1,277,064 1,328,433 EMPLOYEE BENEFITS Social Security ,288 45,900 16,507 97,695 94,673 Health-Active , ,095 43, , ,064 Medical Exams ,500 1,500 1,213 Uniforms & Laundry ,000 3, ,000 6,329 Uniform Purchases ,000 10, ,000 7,847 NYS Disability Insurance/Life Insu , ,154 4,062 Unemployment Insurance ,629 9,808 4,180 21,617 23,323 Workers Compensation ,970 25,445 12,272 62,687 0 Retirement Plans ,860 4,968 5,412 17,240 19,166 Subtotal 163, ,553 84, , ,678 UTILITIES & COMMUNICATIONS Electric ,000 35,000 64,000 63,226 Natural Gas ,000 35,000 37,000 33,973 Water Telephone Charges - Local Telephone Charges - Long Distance Telephone Parts & Repairs ,680 Radio Communication Cable Television ,440 1,440 1,780 Subtotal 31,940 71,440 1, , ,541 PURCHASED SERVICES Insurance Airport Liability , , ,710 Environmental Liability ,100 13,100 13,100 Property Insurance ,771 13,586 50,357 50,225 Subtotal 49,871 13, , , ,035 Outside Services Refuse Removal Services ,545 2,545 2,545 Public Relations ,000 42,000 42,000 Subtotal 0 2,545 42,000 44,545 44,545 Professional Services Professional Management ,000 84, , , ,068 Code Enforcement Subtotal 30,000 84, , , ,068 Total Purchased Services 79, , , , ,648 MATERIALS AND SUPPLIES FBO Fuel Cost - Jet ,640,082 2,640,082 2,568,306 Fuel Discounts - Jet A , , ,061 Fuel Cost - Avgas , , ,616 Fuel Discounts - AvGas ,000 4,000 3,920 Fuel Cost - Auto ,000 80,000 73,752 Fuel Cost Diesel , , ,430 Fuel Cost - Avgas Commercial , , ,820 Deicing Type I - Sprayed , , ,448 Deicing Type IV - Sprayed ,918 37,918 50,231 Deicing Type I - Consortium , , ,649 Deicing Type IV - Consortium ,140 94, ,790 Catering ,000 1, Oil ,000 3,000 3,521 TKS (Deicing fluid) ,000 1,000 0 Charts, Pilot Supplies Subtotal 1,651,389 3,228, ,879,970 4,873,
97 Albany County Airport Authority Million Air s 2016 Expenditures by Line Item MA Cost Centers 2016 Budget 2015 Projected MA MA MA MA MA DESCRIPTION ACCT Comm GA & Fac Admin Totals Totals BUILDINGS Alarm and PA Systems ,923 2, Electrical Repairs & Supplies ,500 3,000 10,500 5,462 Elevator Repairs & Supplies ,400 2,400 2,379 HVAC ,000 13,500 13,000 Roof ,500 3,000 0 Plumbing Repairs & Supplies ,000 3,500 5,028 Automatic Door Repairs & Supplie ,000 4,000 1,041 Pest Control Building Maintenance ,000 15,000 17,000 36,380 Janitorial Supplies ,000 7,000 6,822 Window Washing ,200 3,200 3,200 Sign Expense Subtotal 11,500 56, ,503 74,560 GROUNDS Landscaping Pavement Repairs Sign Expense Hazardous Waste Management ,000 30,000 5,355 Liquid Waste Disposal ,000 25,000 2,770 Subtotal 55,000 1, ,100 8,974 VEHICLES AND EQUIPMENT Gasoline ,000 5,000 11,000 8,833 Diesel Fuel ,000 30,000 60,000 52,367 Oil/Grease Vehicle/Equipment Tires ,000 5,000 13,000 11,319 Vehicle Repair and Maintenance ,000 1, Veh Communication Equip. Repair ,000 1,000 2,000 0 General Equip. Repair/Maintenance ,000 5,000 55, ,048 Quality Control Testing Equipment ,000 6,000 7,287 Heavy Equipment Maintenance ,000 35, , ,494 Vehicle Shop Tools and Supplies ,500 5,000 6,500 4,051 Fuel Truck Rental ,132 33, , ,816 Subtotal 265, , , ,826 Total Materials and Supplies 1,983,021 3,406, ,389,388 5,490,209 OFFICE Office Equipment Rental , ,786 1,653 Copy Machine Use Office Equipment Service Agreeme Office Equipment Repairs Computer System Supplies ,000 8,000 1,014 Hardware/Software Maint Agreeme ,390 8,390 0 Computer Equipment Office Furniture and Fixtures ,000 1,000 2,000 0 Printed Forms/Letterhead ,000 1,000 0 Printing Outside Services Express Mail Office Supplies ,000 6,000 6,727 Payroll Services ,000 19,000 19,018 Subtotal 0 2,000 45,675 47,675 29,
98 Albany County Airport Authority Million Air s 2016 Expenditures by Line Item MA Cost Centers 2016 Budget 2015 Projected MA MA MA MA MA DESCRIPTION ACCT Comm GA & Fac Admin Totals Totals ADMINISTRATIVE Dues and Subscriptions ,000 3,000 17,000 16,171 AvPorts/MA Training & Travel ,000 12,000 17,000 4,906 Functions/Refreshments ,000 1,000 2, Incentives ,000 45,000 41,894 Economic Development ,000 1,000 0 Credit Card Service Charges , , ,859 Subtotal 0 200,000 17, , ,203 TOTAL OPERATIONS 2,719,631 4,631, ,816 8,052,944 8,084,941 Non-Capital Equipment ,038 Total Expenses 2,719,631 4,631, ,816 8,052,944 8,098,979 Albany County Airport Authority Albany International Airport 2016 Budget SCHEDULE OF SALARIES AND BENEFITS FOR MILLION AIR SUMMARY OF AUTHORIZED POSITIONS: 2014 Audited 2015 Budget 2016 Budget OF FTE POSITIONS OF FTE POSITIONS OF FTE POSITIONS FTE Count Department As of Add Transfer Count Add Transfer Count Add Transfer Count Jun 2015 Commercial Fuel Farm Technician Line Service Technician Fuel Farm /Facility Manager Airline Superviso/QC General Aviation Line Service Technician Facilities Maintenance Customer Service Representative Administration General Manager LSM-GA Trainer Operations Supervisor/AM Operations Supervisor/PM Total Million Air # of SUMMARY BY SALARIES & BENEFITS: 2014 Audited 2015 Budget 2016 Budget Additions/ Salaries Benefits Total Salaries Benefits Total Salaries Benefits Total Transfers Commercial 443, , , , , , , , , General Aviation 616, , , , , , , , , Administration 243,421 61, , ,953 78, , ,777 84, , Total MILLION AIR Salaries & Benefits 1,303, ,993 1,779,177 1,302, ,317 1,810,173 1,277, ,580 1,776,
99 MILLION AIR Organizational Chart General Manager (1) Dept 69 Manager Fuel farm/ Facilities GSE (1) Dept 60 GA Safety trainer (1) Operations Sup (2) Dept 69 Fuel Farm Techs (2.6) Dept 60 FBO / Hangar Janitorial (1) Dept 61 Line Service Professionals Airline (8.7) Dept 60 FBO (12) Dept 61 Customer Service (4.8) Dept
100 7) ALBANY COUNTY AIRPORT AUTHORITY (ACAA) -ADMINISTRATION The ACAA administration cost center is used to account for the salaries and benefits for the Airport Authority s administration and financial staff. Also included in this category are insurance, professional services and all office and administration expenses needed for the Authority. ACAA Performance 2014 Final 2015 Projected 2016 Budget ACAA's total full time employment equivalents Community meetings Aviation conferences/meetings Open Accounts Receivable/Total Operating Revenues 4.6% 4.3% 3.0% Open Accounts Payable/Total Operating Expenses 1.8% 3.3% 1.6% SPDES Permit yes yes yes FAA: Part 139 Operation Compliance yes yes yes Part 77 Airspace Compliance yes yes yes Part 150 Noise Program yes yes yes Part 121 Air Cargo Carriers yes yes yes Update maps & charts of Airport yes yes yes Landside building rent increase from previous year -2.1% 6.6% 3.7% T Hangar rent increase from previous year 6.6% -8.6% -5.3% Tie Down rent increase from previous year -50.7% 3.0% 0.0% Landside land rent increase from previous year -2.1% -1.5% 1.9% DBE Participation for construction/engineer contractors 9% 9% 9% MWBE Participation for construction/engineer contractors 39% 33% 20% Minority Representation in the Workforce-Concessions HMS Host 17% 14% 22% McDonalds 48% 48% 55% Villa Fresh Italian Kitchen/Green Leafs 48% 47% 33% Paradies 24% 24% 29% Dunkin Donuts 53% 56% 45% Ambassador Program-hours volunteered 16,647 16,119 1,600 Ambassador assistance - landside 49,516 48,029 35,000 Ambassador assistance - airside 21,301 20,109 22,000 Canine assistance-landside (new for 2015) N/A 22,831 23,000 Canine assistance-airside (new for 2015) N/A 6,504 6,500 Concession revenue increase from previous year (new 10.4% 11.1% 4.4% Community tours
101 Projected 2015 Strategic Plan Results and 2016 Strategic Goals for ACAA Administration Goals Objectives Activities 2015 Projected Results to be Achieved 2016 Budgeted Results to be Achieved Ensure the continued growth, development and viability of the Albany International Airport including all financial, legal, planning and engineering requirements and public awareness, economic development and concession and customer service enhancements, plus provide daily oversight of the Airport Management and FBO management contracts Executive Establish all policies for operating and maintaining the Airport Preserve and enhance good working relationships with the public, affected communities, regulatory agencies and airlines Attract additional and expanded air service options Review and evaluate current policies and procedures Attend meetings with community groups from the public and private sectors Participate in aviation related conferences Meet with airlines and FAA to promote new and enhanced services Direct daily activities of the Airport Improve operating efficiencies and maintain overall customer satisfaction Increase public awareness of Airport s mission and operations Growth in enplanements, service and destinations from the commercial airlines Growth in private and corporate general aviation and storage and maintenance operations for private aircraft Improve operating efficiencies and maintain overall customer satisfaction Increase public awareness of Airport s mission and operations Growth in enplanements, service and destinations from the commercial airlines Growth in private and corporate general aviation and storage and maintenance operations for private aircraft Enhance financial position through economic development opportunities Financial Maximize all sources of revenue and maintain competitive rates and charges while maintaining daily control of all purchasing and expenditure functions Legal To ensure compliance with all applicable laws, rules and regulations Expand infrastructure and net worth of Airport Procure all goods and services at the lowest price possible taking advantage of state contracts where applicable Properly record and vigorously collect all revenues Monitor the fuel market purchase of Jet A and AvGas for FBO operation at the lowest possible price Ensure all employees and departments understand the Authority s financial objectives Promote continuing professional education to remain current with applicable laws, rules and regulations Increase net worth of Airport 1.3% Maintain expenses at budget levels Increase revenue collections Monitor prices paid for fuel increasing Authority s profit margin Increase staff awareness of Authority financial objectives Legal compliance with all applicable laws, rules and regulations Minimize lawsuits Increase net worth of Airport 2.7% Maintain expenses at budget levels Increase revenue collections Monitor prices paid for fuel increasing Authority s profit margin Increase staff awareness of Authority financial objectives Legal compliance with all applicable laws, rules and regulations Minimize lawsuits 7-2
102 Planning and Engineering Preserve and enhance aeronautical safety, capacity and environmental quality through implementation of the current Capital Improvement Plan to assure optimal use of Airport infrastructure in compliance with Federal Aviation Regulations, Codes and related statutes Public Affairs Maintain strong relationships with local media, national media and trade magazines; monitor all Airport programs, services and concessions that relate to the public; facilitate communications between Airport and the public and media; and act as spokesperson for the Airport Economic Development Develop plans and identify opportunities to maintain and grow Airport facilities and services to meet current and future air traffic and user demands Concessions and Customer Service Develop plans and identify opportunities for growth of Airport facilities and services to meet future air traffic and user demands Provide project management oversight for new and ongoing design and construction projects as approved by funding and regulatory agencies and Airport Authority Board in the Capital Improvement Program Provide management oversight for regulatory compliance activities including but not limited to NEPA/ SEQR/ SPDES/ Hazardous Material/Petroleum Bulk Storage/Fire Prevention and Building Code and SWPP storm-water management permits to support project specific and Airport-wide compliance Respond to media inquiries in a timely manner Review media policy and media guide Develop media strategy for Airport events and programs Meet with advertising companies and potential clients to promote new business Maintain contact and relationship with airline station manager to further airlines mission and improve customer service Maintain Airport website Conduct outreach locally, nationally and internationally to identify and then pursue projects for new development Develop & lease existing & new properties to provide competitive rates sufficient to recover costs and provide a reasonable financial return Concessions Worked with food and beverage concessionaires to improve the appearance of Airport space and food quality Administer five-year Airport Improvement Program/Capital Improvement Plan design and construction in conformance with Federal and State guidance Project closeout certification reports for completed AIP/CIP projects See Capital History Section 9 for more information on capital projects Update Airport Layout Plan, Airport Property Map, Airport OC-10 obstruction chart, and geographic information system Monitor compliances with 2012 modified Airport-wide SPDES Permit to reflect new airfield and glycol threshold limits Renew Federal Aviation regulation Part 139 Certification Renewal Inform public of Airport program, initiatives and service changes Maintain strong local and national media presence Improve results of terminal advertising program Maintain high level of customer service Generate new interest of companies in a location at the Airport Increase tenants at the Airport Increase tenant revenue at the Airport Select new concessionaire as a result of RFP Maximize revenues while maintaining close-to-street pricing Administer five-year Airport Improvement Program/Capital Improvement Plan design and construction in conformance with Federal and State guidance Project closeout certification reports for completed AIP/CIP projects See Capital History Section 9 for more information on capital projects Update Airport Layout Plan, Airport Property Map, Airport OC-10 obstruction chart, and geographic information system Monitor compliances with 2012 modified Airport-wide SPDES Permit to reflect new airfield and glycol threshold limits Renew Federal Aviation regulation Part 139 Certification Renewal Inform public of Airport program, initiatives and service changes Maintain strong local and national media presence Improve results of terminal advertising program Maintain high level of customer service Generate new interest of companies in a location at the Airport Increase tenants at the Airport Increase tenant revenue at the Airport Select new concessionaire as a result of RFP Maximize revenues while maintaining close-to-street pricing 7-3
103 Customer Service Update ambassador handbook and tour guide handbook Organize, train, and encourage Ambassadors to be more efficient in operation Marketing Promote foreign currency exchange Promote Airport concessions on Airport website Promote parking on Airport website Ambassadors are more trained, organized and efficient Increase awareness of and maximize revenue from foreign currency exchange Increase revenue from advertising on Wi-Fi Increase revenues from concessions Increase revenues from parking Ambassadors are more trained, organized and efficient Increase awareness of and maximize revenue from foreign currency exchange Increase revenue from advertising on Wi-Fi Increase revenues from concessions Increase revenues from parking Summary of Expenses for ACAA Actual Budget Projected Budget Personnel Services $ 1,673,376 $ 1,769,960 $ 1,757,999 $ 1,825,392 Employee Benefits 1,068,488 1,152,483 1,157,902 1,183,121 Utilities & Communications 89, ,702 81, ,803 Purchased Services 704, , , ,553 Material & Supplies 25,568 33,210 37,080 28,648 Office 110, , , ,651 Administration 110, , , ,756 Non-capital Equipment & Facilities 40,475 45,600 2,320 - Total $ 3,822,697 $ 4,206,420 $ 4,061,296 $ 4,252,924 Employee Count
104 Albany County Airport Authority 2016 Expenditures by Line Item Budget Projected ACAA ACAA DESCRIPTION ACCT Admin Totals PERSONNEL SERVICES Salaries ,825,392 1,748,348 Overtime (1.5) Temporary Help ,636 Subtotal 1,825,392 1,757,999 EMPLOYEE BENEFITS Social Security , ,084 Health-Active , ,534 OPEB , ,418 Health-Dental ,557 29,643 Health-Vision ,999 5,930 Health-Aflac ,010 7,403 Capital EAP Program Smoking Cessation Class ,200 0 NYS Disability Insurance/Life Ins , Unemployment Insurance ,943 5,484 Workers Compensation ,703 8,904 Retirement Plans , ,998 Subtotal 1,183,121 1,157,902 UTILITIES & COMMUNICATIONS Electric ,000 23,037 Natural Gas ,000 7,808 Telephone Charges - Local ,500 5,100 Telephone Charges - Long Distanc ,500 1,476 Telephones-Monthly Service ,000 14,717 Telephones-Monthly Usage ,000 1,697 Telephone Parts & Repairs ,285 9,910 Internet Access ,300 17,184 Cable Television Subtotal 121,803 81,146 PURCHASED SERVICES Accounting and Auditing Financial ,000 57,873 Rates and Charges ,000 4,990 Subtotal 61,000 62,863 Insurance Airport Liability , ,646 Automotive Environmental Liability ,179 30,179 Property Insurance ,836 1,818 Crime ,025 2,351 Public Officials Liability ,321 26,321 Cyber Liability Insurance ,907 5,448 Fiduciary Liability ,236 1,249 Agent Fee ,000 30,000 Subtotal 310, ,
105 Albany County Airport Authority 2016 Expenditures by Line Item Budget Projected ACAA ACAA DESCRIPTION ACCT Admin Totals Outside Services Legal ,000 36,541 Janitorial Services ,960 13,772 Public Relations ,323 26,897 Advertising , ,578 Special Studies , ,079 GIS Services Subtotal 352, ,867 Professional Services Appraisals ,000 5,000 Architectural ,000 0 Consultant ,000 24,550 Engineering Services ,500 7,840 Code Enforcement ,160 45,160 Subtotal 124,660 82,550 Total Purchased Services 848, ,292 MATERIALS AND SUPPLIES BUILDINGS Alarm and PA Systems , Electrical Repairs & Supplies ,000 0 Elevator Repairs & Supplies ,379 2,379 HVAC ,500 0 Roof Plumbing Repairs & Supplies , Pest Control Storage Space Rental ,400 31,396 Building Maintenance , Window Washing ,289 1,251 Subtotal 28,548 37,050 GROUNDS Landscaping Subtotal Total Materials and Supplies 28,648 37,080 OFFICE Office Equipment Rental ,000 7,752 Copy Machine Use ,000 0 Office Equipment Service Agreeme ,876 3,561 Office Equipment Repairs Computer System Supplies ,000 12,959 Hardware/Software Maint Agreeme ,155 56,894 Computer Equipment ,120 2,328 Office Furniture and Fixtures ,000 1,461 Printed Forms/Letterhead ,500 2,087 Parking Ticket Stock Printing Outside Services ,000 10,130 Postage ,000 6,880 Express Mail , Reference Materials , Office Supplies ,000 10,354 Payroll Services ,500 4,429 Subtotal 117, ,
106 Albany County Airport Authority 2016 Expenditures by Line Item Budget Projected ACAA ACAA DESCRIPTION ACCT Admin Totals ADMINISTRATIVE Dues and Subscriptions ,000 21,611 Airport Membership (ACI) ,000 11,837 AAAE GFOA NYS Bar Association NY Airport Managers Association ,000 5,000 Local Chambers of Commerce ,706 5,331 Center for Economic Growth ,500 2,500 Authority Travel and Education Mgmt. Travel and Education ,000 18,164 Functions/Refreshments ,000 25,894 Outside Functions ,000 5,200 Tuition Reimbursement ,385 Advertising/Public Meetings ,000 9,921 Economic Development ,000 0 Credit Card Service Charges ,000 4,991 County Indirect ,185 13,185 Subtotal 127, ,747 TOTAL OPERATIONS 4,252,924 4,058,976 Non-Capital Equipment ,320 Total Expenses 4,252,924 4,061,296 Albany County Airport Authority Albany International Airport SCHEDULE OF SALARIES AND BENEFITS FOR AUTHORITY SUMMARY OF AUTHORIZED POSITIONS: 2014 Audited 2015 Budget 2016 Budget OF FTE POSITIONS OF FTE POSITIONS OF FTE POSITIONS FTE Count As of Add Transfer Count Add Transfer Count Jun 2015 Administration Total Authority Positions # of SUMMARY BY SALARIES & BENEFITS: 2014 Audited 2015 Budget 2016 Budget Additions/ Salaries Benefits Total Salaries Benefits Total Salaries Benefits Total Transfers Administration 1,673,376 1,068,488 2,741,864 1,769,960 1,152,483 2,922,443 1,825,392 1,183,121 3,008, Total AUTHORITY Salaries & Benefits 1,673,376 1,068,488 2,741,864 1,769,960 1,152,483 2,922,443 1,825,392 1,183,121 3,008,
107 7-8
108 8) INDEBTEDNESS DEBT POLICY The actual amount of debt the Authority may have outstanding at any one time is limited by the following: The Authority s legal debt limit ($285 million). The Authority s Master Bond Resolution which permits new borrowings only if the Authority s net revenues equal 125% of Maximum Annual Debt Service on all debt outstanding and the proposed debt to be issued. The maintenance of investment grade debt ratings from major debt rating agencies. These agencies generally suggest that the total debt outstanding should be limited to $100 per enplaned passenger. The willingness of investors in the bond market to purchase the Authority s indebtedness. Any negotiated bond sales are subject to the approval of the Comptroller of the State of New York and the Comptroller of the County of Albany. The Authority also adopted a Derivatives Policy and a Variable Rate Debt Policy as summarized below. Derivatives Policy The Authority adopted a Derivatives Policy which allows for the use of Derivative Financial products for capital financing. The Derivatives Policy prohibits the use of Derivative Financial products for either investment or speculation. The Derivatives Policy recognizes derivatives as non-traditional financial products, including but not limited to, floating to fixed rate swaps, swaptions, caps, floors, collars and municipal warrants. The Derivatives Policy requires: that transaction entered into under the policy must be for a market transaction for which competing good faith quotations may be obtained at the discretion of the Authority and with the advice and recommendation of the Authority's swap advisor, and other financial professionals; that transactions should produce material economic benefit believed to not otherwise be attainable under the current existing market conditions, or existing conventional debt structures, and improve the flexibility of debt management strategies; employ a structure that will attempt to minimize any additional floating rate basis risk, tax law risk or credit risk to the Authority and justify the acceptance of these risks for a particular transaction, based on the additional benefits to the Authority; and limits the total amount of derivative financial product transactions so as not to exceed thirty-three percent (33%) of the total authorized debt limit of the Authority (currently $285 million). Variable Rate Debt Policy The Authority adopted a Variable Rate Debt Policy which allows for the use of variable rate debt within prescribed limitations. The Variable Rate Debt Policy recognizes permanent and interim uses of variable rate debt. Interim use of variable rate debt may occur during the construction phase of a project for which the Authority intends to obtain permanent financing at the conclusion of the construction phase. The Variable Rate Debt Policy provides that: Permanent Variable Rate Debt Exposure includes variable rate debt which the Authority does not intend to be refinanced by a long-term fixed rate debt; 8-1
109 Net Permanent Variable Rate Debt Exposure exposure is permanent variable rate debt that is not offset by the cash, cash equivalent and short-term investment assets of the Authority; Permanent variable rate debt excludes, with some exceptions, variable debt that has been synthetically changed to fixed rate debt by the use of a financial derivative hedge product with a fixed-payer interest rate swap; Net permanent variable rate debt, excluding synthetic fixed rate transactions, should not generally exceed twenty percent (20%) of the Authority s outstanding indebtedness. The Authority s policy is to manage its current and future debt service requirements to be in compliance with all bond covenants, while prudently meeting the capital needs of the Airport and to continue the pursuit of higher underlying ratings from the rating agencies. DEBT LIMIT The Authority s debt limit was increased from $175 million to $285 million during 2004 by State legislation enacted (Chapter 500), amending the Albany County Airport Authority Act, Title 32 of Article 8, of the New York State Public Authorities Law. The Authority has historically only issued debt to fund major capital improvement projects in excess of $50,000 Debt Outstanding per Enplaned Passenger Audited Budget Projected Budget Debt Outstanding (par amount) $105,049,000 $96,783,000 $96,783,000 $88,216,000 Enplaned Passengers 1,230,376 1,220,872 1,286,944 1,350,000 Debt Service per Enplaned Passenger $85 $79 $75 $65 MASTER BOND RESOLUTION The Authority in 1995, as amended in 1997, established procedures for selection of underwriters for the sale of the Authority s bonds and for certain other matters. These procedures allow for public competitive sale, public negotiated sale or private negotiated sale of debt based upon a determination of the Chief Financial Officer and the recommendation of the Authority Chair. In 1997 the Authority adopted a Master Bond Resolution which authorizes the issuance of Airport Revenue Bonds; prescribing the limitations on and the conditions of issuance and the form of any bonds to be issued. Two key provisions provide for an additional bonds test before the Authority issues any new debt and a covenant to maintain 125% debt service coverage of net revenues, as defined. DEBT OUTSTANDING At the beginning of 2016, it is anticipated there will be $96,783,000 of debt outstanding. Principal payments of $8,567,000 are due and payable during The chart below exhibits for each issue the original issue amounts, the debt to be outstanding as of December 31, 2014, the principal payments due in 2016, the interest due in 2016, the amortization of bond related receipts and expenditures that were deferred into interest costs in 2016 and the amount in debt service reserve funds. 8-2
110 2016 Series Original Issue Amount Outstanding Principal Payments Due in 2016 Interest Due in 2016 net of EFC Interest Subsidy Amortization of Items deferred into Interest Cost** Total Payments Due in 2016 Available Debt Service Reserve Funds 1998 B&C Airport Revenue Bonds $ 30,695,000 $ - $ - $ - $ - $ - $ EFC Revenue Bonds 7,895,303 1,958, ,000 25, , , A EFC Revenue Bonds 2,374, B Airport Revenue Bonds 14,500, Airport Revenue Bonds 8,885,000 3,030, , ,956 6, , , EFC Revenue Bonds 388, , A&B Airport Revenue Bonds 14,230,000 9,455, , ,800 7,418 1,107,218 1,128, C Airport Revenue Bonds 6,330,000 5,180, , ,263 3, , , A Airport Refunding Bonds* 83,200, A&B Airport Refunding Bonds* 109,855,000 77,160,000 6,980,000 3,575,231 83,867 10,639,098 9,512,253 $ 278,353,555 $ 96,783,000 $ 8,567,000 $ 4,391,069 $ 100,347 $ 13,058,416 $ 11,875,436 * Before applying available PFC funds (see page 8-11) **Net of EFC interest subsidy. ***Items deferred into interest costs include bond issue costs and bond premiums and discounts Combined Annual Debt Service to Maturity $14,000,000 $12,000,000 $10,000,000 $8,000,000 $6,000,000 $4,000,000 $2,000,000 $ Year/Debt Service ,958, ,883, ,260, ,976, ,776, , ,972, ,774, , ,562, ,780, , ,863, ,264, , ,869, ,272, , ,878, ,258,
111 SCHEDULES OF DEBT ISSUED BY THE AUTHORITY AND THEIR PURPOSE: $7,895, New York State Environmental Facilities Corporation (EFC) Date: July 29, 1999 Payable: Rating Purpose Security: Principal is paid annually on October 15 with interest paid semiannual each April 15 and October 15. (not callable) N/A The bonds were issued to finance the construction of a new glycol wastewater treatment system. The bonds are secured by the full faith and credit of the Authority and are payable from general Airport revenues without limitation. Debt Service through Maturity: Fiscal Year Interest Rates Principal Interest Int Subsidy Total % 412,000 42,675 (16,856) 437, % 418,000 35,517 (13,277) 440, % 429,000 27,445 (9,241) 447, % 699,000 18,567 (4,802) 712,765 Debt outstanding $ 1,958,000 $ 124,204 $ (4,802) $ 2,038,
112 Date: May 15, 2003 $8,885, A General Airport Revenue Bonds (GARB) Payable: Principal is paid annually on December 15 with interest paid semiannual each June 15 and December 15. (Callable at par May 15, 2013) Rating (underlying) Purpose Security: Moody s: A3 Standard & Poor s: BBB+ Fitch s: A- The bonds were issued to finance various land, hangars, and equipment acquisitions, apron and runway expansions, taxiway, runway and hangar rehabilitations, certain terminal expansion and leasehold improvements. The bonds are secured by the full faith and credit of the Authority and are payable from general Airport revenues without limitation. Debt Service through Maturity: Fiscal Year Interest Rates Principal Interest Total % 345, , , % 365, , , % 370,000 94, , % 155,000 81, , % 165,000 75, , % 165,000 68, , % 175,000 61, , % 185,000 54, , % 90,000 46, , % 95,000 43, , % 100,000 39, , % 105,000 34, , % 110,000 30, , % 110,000 25, , % 115,000 21, , % 120,000 16, , % 125,000 11, , % 135,000 5, ,737 Debt outstanding $ 3,030,000 $ 935,690 $ 3,965,
113 Date: June 15, 2006 $6,315, A General Airport Revenue Bonds Payable: Rating (underlying) Purpose Security: Principal is paid annually on December 15 with interest paid semiannual each June 15 and December 15. (Callable at par June 15, 2016) Moody s: A3 Standard & Poor s: BBB+ Fitch s: A- The bonds were issued to finance certain property acquisitions, parking expansions and to purchase equipment used in the operation of the Airport. The bonds are secured by the full faith and credit of the Authority and are payable from general Airport revenues without limitation. Debt Service through Maturity: Fiscal Year Interest Rates Principal Interest Total % - 290, , % - 290, , % - 290, , % - 290, , % 500, , , % 860, ,650 1,125, % 905, ,650 1,127, % 950, ,400 1,127, % 990, ,025 1,127, % 1,030,000 94,950 1,124, % 1,080,000 48,600 1,128,600 Debt outstanding $ 6,315,000 $ 2,399,525 $ 8,714,
114 Date: June 15, 2006 $7,915, B General Airport Revenue Bonds (GARB) Payable: Rating (underlying) Purpose Security: Principal is paid annually on December 15 with interest paid semiannual each June 15 and December 15. (Callable at par June 15, 2016) Moody s: A3 Standard & Poor s: BBB+ Fitch s: A- The bonds were issued to finance certain terminal renovations, general aviation hangar renovations, construction of additional general aviation T-hangars, fuel farm upgrades and equipment for use by Airport management contractors. The bonds are secured by the full faith and credit of the Authority and are payable from general Airport revenues without limitation. Debt Service through Maturity: Fiscal Year Interest Rates Principal Interest Total % 660, , , % 695, , , % 725,000 84, , % 760,000 50, , % 300,000 14, ,250 Debt outstanding $ 3,140,000 $ 416,337 $ 3,556,
115 $6,330, C General Airport Revenue Bonds (GARB) Date: December 13, 2006 Payable: Rating (underlying) Purpose Security: Principal is paid annually on December 15 with interest paid semiannual each June 15 and December 15. (Callable at par December 13, 2016) Moody s: A3 Standard & Poor s: BBB+ Fitch s: A- The bonds were issued to finance the construction of a 42,800 square foot Aviation Service and Maintenance Facility. The bonds are secured by the full faith and credit of the Authority and are payable from general Airport revenues without limitation. Debt Service through Maturity: Fiscal Year Interest Rates Principal Interest Total % 170, , , % 175, , , % 185, , , % 190, , , % 200, , , % 210, , , % 215, , , % 225, , , % 235, , , % 245, , , % 255, , , % 265, , , % 280, , , % 290, , , % 305,000 98, , % 315,000 85, , % 330,000 71, , % 345,000 54, , % 365,000 37, , % 380,000 19, ,000 Debt outstanding $ 5,180,000 $ 2,845,816 $ 8,025,
116 $109,855, A & B Airport Revenue Refunding Bonds (Tax-exempt) (Variable Rate Demand Obligations) Date: August 10, 2010 Payable: Rating (underlying) Principal is paid annually on December 15 with interest paid semiannual each June 15 and December 15. Moody s: A3 Standard & Poor s: BBB+ Fitch s: A- Purpose The bonds were issued to refund and defease the Series 1998B, Series 2000B and Series 2008A Airport Revenue Bonds on August 10, The refunded bonds were issued to finance the 1998 Terminal Improvement and Airport redevelopment ($82,965,000 remaining), a 1,900 space parking garage ($15,965,000 remaining), and the New York State Police Executive Hangar ($11,765,000 remaining). Security: The bonds are secured by the full faith and credit of the Authority and are payable from general Airport revenues without limitation. Debt Service through Maturity: Fiscal Year Interest Rates Principal Interest Total % 6,980,000 3,575,231 10,555, % 7,335,000 3,226,231 10,561, % 7,625,000 2,932,831 10,557, % 5,555,000 2,557,581 8,112, % 5,835,000 2,281,231 8,116, % 6,115,000 1,991,981 8,106, % 6,410,000 1,703,731 8,113, % 6,730,000 1,385,731 8,115, % 7,025,000 1,085,981 8,110, % 7,305, ,981 8,109, % 7,645, ,813 8,111, % 610, , , % 640,000 88, , % 660,000 60, , % 690,000 31, ,050 Debt outstanding $ 77,160,000 $ 22,307,550 $ 99,467,

117 PASSENGER FACILITY CHARGES (PFC s) PFC s are a surcharge collected by the airlines and forwarded to the Authority to pay for Airport capital projects approved by the Federal Aviation Administration. PFC s are applied to the Airport s debt service payments on Airport revenue bonds sold to finance these capital projects. The fee was $3.00 per enplaned passenger beginning March 1, 1994 through August 31, 2009, not to exceed $40,726,364 and amended in 1996 to increase the amount of PFC s authorized for collections to $116,888,308. Beginning September 1, 2009 the fee increased to $4.50 per enplaned passenger not to exceed collections of $116,888,308. The Authority predicts that it will collect PFC s from approximately 91.0% of its enplanements. The projected 2016 deposited amount is $5,393,115 after a deduction of a $0.11 per enplanement airline service charge and the addition of interest earnings of $15,490 on PFC funds. The chart below illustrates the allocation and priority of the application of the flow of Airport Revenues from initial receipt to final deposit of residual net revenue in the Development Fund Account in accordance with the Master Bond Resolution adopted by the Authority. APPLICATION OF AUTHORITY REVENUE UNDER THE MASTER BOND RESOLUTION Source: Albany County Airport Authority Official Statement of Airport Revenue Refunding Bonds Series 2010 (July 29, 2010) 8-10
ALBANY COUNTY AIRPORT AUTHORITY 2017 Operating Budget Adopted December 12, 2016
 ALBANY COUNTY AIRPORT AUTHORITY 2017 Operating Budget Adopted December 12, 2016 New York s Tech Valley Airport A component unit of the County of Albany, located in the Town of Colonie, New York flyalbany.com
ALBANY COUNTY AIRPORT AUTHORITY
 ALBANY COUNTY AIRPORT AUTHORITY 2015 Operating Budget Adopted December 8, 2014 New York s Tech Valley Airport A component unit of the County of Albany, in the Town of Colonie, New York ALBANY COUNTY AIRPORT
ALBANY COUNTY AIRPORT AUTHORITY 2014 Operating Budget Adopted December 9, 2013
 ALBANY COUNTY AIRPORT AUTHORITY 2014 Operating Budget Adopted December 9, 2013 A component unit of the County of Albany, in the Town of Colonie, New York This page intentionally left blank ALBANY COUNTY
ALBANY COUNTY AIRPORT AUTHORITY
 2009 Operating Budget Adopted December 1, 2008 ALBANY COUNTY AIRPORT AUTHORITY A component unit of the County of Albany, Town of Colonie, New York ALBANY COUNTY AIRPORT AUTHORITY Albany, New York 12211-1057
ALBANY COUNTY AIRPORT AUTHORITY Mission Statement and Performance Measurement Report Year Ended December 31, 2016
 ALBANY COUNTY AIRPORT AUTHORITY Mission Statement and Performance Measurement Report Year Ended December 31, 216 BACKGROUND The Public Authorities Reform Act of 29 introduced a requirement that Public
ASIP2 AIR SERVICE INCENTIVE PROGRAM
 Albany International Airport ASIP2 AIR SERVICE INCENTIVE PROGRAM December 2011 Albany International Airport Air Service Incentive Program Introduction: The Albany County Airport Authority (ACAA), operator
Jacksonville Aviation Authority Annual Report The Power Within.
 Jacksonville Aviation Authority Annual Report 2007 The Power Within. Board of Directors & Executive Team Cyrus Jollivette Chairman 1 John D. Clark Executive Director / CEO Jim McCollum Vice-Chairman 2
AIRPORT FUND. Description. Summary
 Description In March 1941 construction started for the airport at its present site. After Pearl Harbor, the airport, known as Pinellas Army Airfield, was used as a military flight-training base. After
STRATEGIC BUSINESS PLAN 2017
 STRATEGIC BUSINESS PLAN 2017 INCREASE AIR SERVICE MAINTAIN A HIGH LEVEL OF COMMUNITY SUPPORT STRENGTHEN FINANCIAL SUSTAINABILITY INVEST IN PEOPLE & OPERATIONAL ASSETS ATTRACT COMMERCIAL DEVELOPMENT PLAN,
COUNTY OF ORANGE, CALIFORNIA AIRPORT REVENUE BONDS, SERIES 2009 A & B ANNUAL REPORT FOR FISCAL YEAR ENDED JUNE 30, 2013
 COUNTY OF ORANGE, CALIFORNIA AIRPORT REVENUE BONDS, SERIES 2009 A & B ANNUAL REPORT FOR FISCAL YEAR ENDED JUNE 30, 2013 Dated: January 28, 2014 COUNTY OF ORANGE, CALIFORNIA AIRPORT REVENUE BONDS, SERIES
Investor Update Issue Date: April 9, 2018
 Investor Update Issue Date: April 9, 2018 This investor update provides guidance and certain forward-looking statements about United Continental Holdings, Inc. (the Company or UAL ). The information in
CONTACT: Investor Relations Corporate Communications
 NEWS RELEASE CONTACT: Investor Relations Corporate Communications 435.634.3200 435.634.3553 Investor.relations@skywest.com corporate.communications@skywest.com SkyWest, Inc. Announces Second Quarter 2017
CONTACT: Investor Relations Corporate Communications
 NEWS RELEASE CONTACT: Investor Relations Corporate Communications 435.634.3200 435.634.3553 Investor.relations@skywest.com corporate.communications@skywest.com SkyWest, Inc. Announces Second Quarter 2016
CONTACT: Investor Relations Corporate Communications
 NEWS RELEASE CONTACT: Investor Relations Corporate Communications 435.634.3200 435.634.3553 Investor.relations@skywest.com corporate.communications@skywest.com SkyWest, Inc. Announces Fourth Quarter 2017
RAPID CITY REGIONAL AIRPORT
 RAPID CITY REGIONAL AIRPORT Budget: $16,232,274 Full time Employees: 24 Mission Statement It is the mission of the Rapid City Regional Airport Board to provide safe, efficient, environmentally sensitive,
Minutes of the Audit Committee Meeting. of the Albany County Airport Authority. March 26, 2014
 ALBANY COUNTY AIRPORT AUTHORITY TEL: 518-242-2222 ALBANY INTERNATIONAL AIRPORT ADMIN FAX: 518-242-2641 ADMINISTRATION BUILDING FINANCE FAX: 518-242-2640 SUITE 200 SITE: www.albanyairport.com ALBANY, NEW
Annual Airport Finance and Administration Conference Innovative Funding Strategies. March 4, 2013 Destin, Florida Bonnie Deger Ossege
 Annual Airport Finance and Administration Conference Innovative Funding Strategies March 4, 2013 Destin, Florida Bonnie Deger Ossege OVERVIEW Trends- Capital Improvement Programs Determine Your Airport
Chapter 9: Financial Plan Draft
 Chapter 9: Draft TABLE OF CONTENTS 9... 5 9.2.1 ABIA Accounting... 6 9.2.2 Legal Environment... 6 9.2.3 Governing Documents... 8 9.3.1 FAA AIP Grants... 13 9.3.2 Local ABIA Funds... 14 9.4.1 Defer or Delay
Columbus Regional Airport Authority. Financial Statements. August 31, Respectfully Submitted. Randy Bush, CPA, CIA. Chief Financial Officer
 Columbus Regional Airport Authority Financial Statements August 31, 2018 Respectfully Submitted Randy Bush, CPA, CIA Chief Financial Officer Unaudited for internal purposes CRAA Operating Revenue & Expenses
Tulsa Airports Improvement Trust Strategic Plan Update
 Tulsa Airports Improvement Trust Strategic Plan Update 2016-2026 TABLE OF CONTENTS I. Background II. III. IV. Existing Conditions and Future Requirements Mission, Vision, & Goals Strengths, Weakness, Opportunities
Columbus Regional Airport Authority. Financial Statements. September 30, Respectfully Submitted. Randy Bush, CPA, CIA. Chief Financial Officer
 Columbus Regional Airport Authority Financial Statements September 30, 2018 Respectfully Submitted Randy Bush, CPA, CIA Chief Financial Officer Unaudited for internal purposes CRAA Operating Revenue &
SKYWEST, INC. ANNOUNCES THIRD QUARTER 2014 RESULTS
 NEWS RELEASE For Further Information Contact: Investor Relations Telephone: (435) 634-3203 Fax: (435) 634-3205 FOR IMMEDIATE RELEASE: October 29, 2014 SKYWEST, INC. ANNOUNCES THIRD QUARTER 2014 RESULTS
Columbus Regional Airport Authority. Financial Statements. March 31, Respectfully Submitted. Randy Bush, CPA, CIA. Chief Financial Officer
 Columbus Regional Airport Authority Financial Statements March 31, 2018 Respectfully Submitted Randy Bush, CPA, CIA Chief Financial Officer Unaudited for internal purposes CRAA Operating Revenue & Expenses
Financial Feasibility Analysis Terminal Programming Study Des Moines Airport Authority
 Financial Feasibility Analysis Terminal Programming Study Des Moines Airport Authority September 12, 2017 Contents 1. Funding Sources for Airport Projects 2. Financial Metrics 3. CIP Summary and Funding
AIR CANADA REPORTS 2010 THIRD QUARTER RESULTS; Operating Income improved $259 million or 381 per cent from previous year s quarter
 AIR CANADA REPORTS 2010 THIRD QUARTER RESULTS; Operating Income improved $259 million or 381 per cent from previous year s quarter MONTRÉAL, November 4, 2010 Air Canada today reported operating income
Columbus Regional Airport Authority. Financial Statements. April 30, Respectfully Submitted. Randy Bush, CPA, CIA. Chief Financial Officer
 Columbus Regional Airport Authority Financial Statements April 30, 2018 Respectfully Submitted Randy Bush, CPA, CIA Chief Financial Officer Unaudited for internal purposes CRAA Operating Revenue & Expenses
Investor Update September 2017 PARTNER OF CHOICE EMPLOYER OF CHOICE INVESTMENT OF CHOICE
 Investor Update September 2017 PARTNER OF CHOICE EMPLOYER OF CHOICE INVESTMENT OF CHOICE 1 Forward Looking Statements In addition to historical information, this presentation contains forward-looking statements
1Q 2017 Earnings Call. April 18, 2017
 1Q 2017 Earnings Call April 18, 2017 Safe Harbor Statement Certain statements included in this presentation are forward-looking and thus reflect our current expectations and beliefs with respect to certain
Greater Orlando Aviation Authority
 Greater Orlando Aviation Authority Orlando International Airport & Orlando Executive Airport Budgets Fiscal Year 2017-2018 Greater Orlando Aviation Authority Orlando, Florida Greater Orlando Aviation Authority
September 1, Re: Project No. 3-24P. Dear Director of Research and Technical Activities:
 September 1, 2015 David R. Bean Director of Research and Technical Activities Governmental Accounting Standards Board 401 Merritt 7 PO Box 5116 Norwalk, CT 06856-5116 Re: Project No. 3-24P Dear Director
Airport Finance 101 Session 3 - Capital Funding
 Airport Finance 101 Session 3 - Capital Funding Capital Development Funding Improvement Projects usually require substantial funding to be implemented In business world capital is associated with funds
SkyWest, Inc. Announces First Quarter 2018 Profit
 NEWS RELEASE CONTACT: Investor Relations Corporate Communications 435.634.3200 435.634.3553 Investor.relations@skywest.com corporate.communications@skywest.com SkyWest, Inc. Announces First Quarter 2018
2Q 2017 Earnings Call. July 19, 2017
 2Q 2017 Earnings Call July 19, 2017 Safe Harbor Statement Certain statements included in this presentation are forward-looking and thus reflect our current expectations and beliefs with respect to certain
AIR CANADA REPORTS THIRD QUARTER RESULTS
 AIR CANADA REPORTS THIRD QUARTER RESULTS THIRD QUARTER OVERVIEW Operating income of $112 million compared to operating income of $351 million in the third quarter of 2007. Fuel expense increased 49 per
SKYWEST, INC. ANNOUNCES THIRD QUARTER 2012 RESULTS
 NEWS RELEASE For Further Information Contact: Michael J. Kraupp Chief Financial Officer and Treasurer Telephone: (435) 634-3212 Fax: (435) 634-3205 FOR IMMEDIATE RELEASE: November 7, 2012 SKYWEST, INC.
Stimulating Airports is Stimulating the Economy
 Stimulating Airports is Stimulating the Economy House of Commons Standing Committee on Finance Pre-budget 2010 Submission August 14 th, 2009 Executive Summary Atlantic Canada Airports Association s (ACAA)is
2010 FAA Great Lakes Region Annual Conference State of Airport Financing November 3, Marsha Stone, CFO Indianapolis Airport Authority
 2010 FAA Great Lakes Region Annual Conference State of Airport Financing November 3, 2010 Marsha Stone, CFO Indianapolis Airport Authority Economy and Aviation Industry U.S. Aviation Traffic: Signs of
J.P. Morgan Aviation, Transportation and Industrials Conference
 J.P. Morgan Aviation, Transportation and Industrials Conference March 3, 08 Scott Kirby President Safe Harbor Statement Certain statements included in this presentation are forward-looking and thus reflect
Rates & Charges Analysis
 Aeronautics Division Rates & Charges Analysis Executive Summary Executive Summary In This Report: Airlines Rates and Charges Other Building Rental Rates Landing Fees Parking Rates Tie-Downs Special Use
PORT OF SEATTLE PRESENTATION TO THE WESTERN STATES INSTITUTIONAL INVESTORS CONFERENCE MAY 15, 2018
 PORT OF SEATTLE PRESENTATION TO THE WESTERN STATES INSTITUTIONAL INVESTORS CONFERENCE MAY 15, 2018 Elizabeth Morrison, Port of Seattle Director of Corporate Finance 0 OVERVIEW Regional Economy Port Financial
Columbus Regional Airport Authority. Financial Statements. July 31, Respectfully Submitted. Randy Bush, CPA, CIA. Chief Financial Officer
 Columbus Regional Airport Authority Financial Statements July 31, 2018 Respectfully Submitted Randy Bush, CPA, CIA Chief Financial Officer Unaudited for internal purposes CRAA Operating Revenue & Expenses
2012 Business Travel Forecast. Understanding the Present & Analyzing the Past
 2012 Business Travel Forecast 2012 Predicting the Future by Understanding the Present & Analyzing the Past 2012 Industry Overview Although travel suppliers will continue to increase domestic rates slightly
EXHIBIT E to Signatory Airline Agreement for Palm Beach International Airport RATE AND FEE SCHEDULE
 EXHIBIT E to Signatory Airline Agreement for Palm Beach International Airport RATE AND FEE SCHEDULE SECTION I - DEFINITIONS The following words, terms and phrases used in this Exhibit E shall have the
Spirit Airlines Reports First Quarter 2017 Results
 Spirit Airlines Reports First Quarter 2017 Results MIRAMAR, Fla., April 28, 2017 - Spirit Airlines, Inc. (NASDAQ: SAVE) today reported first quarter 2017 financial results. GAAP net income for the first
VIRGIN ISLANDS PORT AUTHORITY (VIPA) 2016 PUBLIC HEARING ON PROPOSED TARIFF INCREASE. ! July
 2016 PUBLIC HEARING ON PROPOSED TARIFF INCREASE. ! July") VIRGIN ISLANDS PORT! July AUTHORITY (VIPA) 2016 2016 PUBLIC HEARING ON PROPOSED TARIFF INCREASE FINANCIAL OPERATIONS VIPA AVIATION DIVISION VIRGIN ISLANDS PORT AUTHORITY 2 5-YEAR INCOME STATEMENT SNAPSHOT-
VIRGIN ISLANDS PORT! July AUTHORITY (VIPA) 2016 2016 PUBLIC HEARING ON PROPOSED TARIFF INCREASE FINANCIAL OPERATIONS VIPA AVIATION DIVISION VIRGIN ISLANDS PORT AUTHORITY 2 5-YEAR INCOME STATEMENT SNAPSHOT-
MONTEREY REGIONAL AIRPORT MASTER PLAN TOPICAL QUESTIONS FROM THE PLANNING ADVISORY COMMITTEE AND TOPICAL RESPONSES
 MONTEREY REGIONAL AIRPORT MASTER PLAN TOPICAL QUESTIONS FROM THE PLANNING ADVISORY COMMITTEE AND TOPICAL RESPONSES Recurring topics emerged in some of the comments and questions raised by members of the
Adjusted net income of $115 million versus an adjusted net loss of $7 million in the second quarter of 2012, an improvement of $122 million
 Air Canada Reports Record Second Quarter 2013 Results Highest Adjusted Net Income, Operating Income and EBITDAR Results for Second Quarter in Air Canada s History Adjusted net income of $115 million versus
Key Statistical Indicator For The International Airports Operator In PPP/BOT/Project Finance Environment
 Key Statistical Indicator For The International Airports Operator In PPP/BOT/Project Finance Environment Introduction Taken over airports in emerging markets and in immature environments (but not always
Management Presentation. March 2016
 Management Presentation March 2016 Forward looking statements This presentation as well as oral statements made by officers or directors of Allegiant Travel Company, its advisors and affiliates (collectively
FORECASTING FUTURE ACTIVITY
 EXECUTIVE SUMMARY The Eagle County Regional Airport (EGE) is known as a gateway into the heart of the Colorado Rocky Mountains, providing access to some of the nation s top ski resort towns (Vail, Beaver
Investor Relations Update January 25, 2018
 General Overview Investor Relations Update Accounting Changes On January 1, 2018, the company adopted two new Accounting Standard Updates: (ASUs): ASU 2014-9: Revenue from Contracts with Customers (the
OPERATING AND FINANCIAL HIGHLIGHTS. Subsequent Events
 Copa Holdings Reports Net Income of $103.8 million and EPS of $2.45 for the Third Quarter of 2017 Excluding special items, adjusted net income came in at $100.8 million, or EPS of $2.38 per share Panama
Project Progress Report #1
 Project Progress Report #1 As of February 28, 2002 Sam M. McCall, CPA, CIA, CGFM City Auditor AirTran Transportation Services Agreement Report #0214 April 9, 2002 Summary On September 12, 2001, the City
E190 REPLACEMENT & FLEET UPDATE JULY 11, 2018
 1 E190 REPLACEMENT & FLEET UPDATE JULY 11, 2018 SAFE HARBOR This presentation contains forward-looking statements within the meaning of the Private Securities Litigation Reform Act of 1995, Section 27A
Westover Metropolitan Airport Master Plan Update
 Westover Metropolitan Airport Master Plan Update June 2008 INTRODUCTION Westover Metropolitan Airport (CEF) comprises the civilian portion of a joint-use facility located in Chicopee, Massachusetts. The
Thank you for participating in the financial results for fiscal 2014.
 Thank you for participating in the financial results for fiscal 2014. ANA HOLDINGS strongly believes that safety is the most important principle of our air transportation business. The expansion of slots
ACRP 01-32, Update Report 16: Guidebook for Managing Small Airports Industry Survey
 ACRP 01-32, Update Report 16: Guidebook for Managing Small Airports Industry Survey Goal of Industry Survey While there are common challenges among small airports, each airport is unique, as are their
Airline Market Shares of Enplaned Passengers. Scheduled Average Daily Aircraft Departures by Airline. Average Domestic One-Way Airline Fares
 December 31, 2009 Mr. Mark Brewer Airport Director Manchester-Boston Regional Airport One Airport Road, Suite 300 Manchester, New Hampshire 03103 Re: Continuing Disclosure Certificate Dear Mr. Brewer:
FIRST AMENDMENT AIRLINE OPERATING AGREEMENT AND TERMINAL BUILDING LEASE. between. City Of Manchester, New Hampshire Department Of Aviation.
 FIRST AMENDMENT AIRLINE OPERATING AGREEMENT AND TERMINAL BUILDING LEASE between City Of Manchester, New Hampshire Department Of Aviation and Airline December 2009 THIS FIRST AMENDMENT TO THE AIRLINE OPERATING
Finance and Implementation
 5 Finance and Implementation IMPLEMENTATION The previous chapters have presented discussions and plans for development of the airfield, terminal, and building areas at Sonoma County Airport. This chapter
Copa Holdings Reports Record Earnings of US$41.8 Million for 4Q06 and US$134.2 Million for Full Year 2006
 Copa Holdings Reports Record Earnings of US$41.8 Million for 4Q06 and US$134.2 Million for Full Year 2006 Panama City, Panama --- March 7, 2007. Copa Holdings, S.A. (NYSE: CPA), parent company of Copa
CHAPTER 1 EXECUTIVE SUMMARY
 CHAPTER 1 EXECUTIVE SUMMARY 1 1 EXECUTIVE SUMMARY INTRODUCTION William R. Fairchild International Airport (CLM) is located approximately three miles west of the city of Port Angeles, Washington. The airport
An Economic Engine in our Region
 DULUTH INTERNATIONAL AIRPORT An Economic Engine in our Region Brian Ryks Executive Director Duluth Airport Authority Duluth Airport Authority Mission/Vision: The Duluth Airport Authority is dedicated to
Chapter 1 Introduction and Project Overview
 Chapter 1 Introduction and Project Overview Kittitas County in cooperation with the Federal Aviation Administration (FAA) is updating the Airport Master Plan for Bowers Field Airport (FAA airport identifier
JOSLIN FIELD, MAGIC VALLEY REGIONAL AIRPORT DECEMBER 2012
 1. Introduction The Federal Aviation Administration (FAA) recommends that airport master plans be updated every 5 years or as necessary to keep them current. The Master Plan for Joslin Field, Magic Valley
Chapter 2 FINDINGS & CONCLUSIONS
 Chapter 2 FINDINGS & CONCLUSIONS 2.01 GENERAL Dutchess County acquired the airport facility in 1947 by deed from the War Assets Administration. Following the acquisition, several individuals who pursued
Gerry Laderman SVP Finance, Procurement and Treasurer
 Gerry Laderman SVP Finance, Procurement and Treasurer Safe Harbor Statement Certain statements included in this release are forward-looking and thus reflect our current expectations and beliefs with respect
BOARD FILE NO Rescinds: Resolution 26008
 Los Angeles World Airports BOARD FILE NO. 1615 Rescinds: Resolution 26008 TM RESOLUTION NO. 26261 WHEREAS, the Board of Airport Commissioners, in accordance with Section 632(a) of the City Charter of Los
Delta Air Lines Reports June 2009 Quarter Financial Results
 CONTACT: Investor Relations 404-715-2170 Corporate Communications 404-715-2554 Delta Air Lines Reports June 2009 Quarter Financial Results ATLANTA, July 22, 2009 Delta Air Lines (NYSE:DAL) today reported
Introduction DRAFT March 9, 2017
 Chapter Overview The City of Redmond (City) initiated an update to the Airport Master Plan ( Plan ) to assess the facility and service needs of the Redmond Municipal Airport ( the Airport ) throughout
AMR CORPORATION REPORTS SECOND QUARTER 2012 RESULTS
 CONTACT: Sean Collins Media Relations Fort Worth, Texas 817-967-1577 mediarelations@aa.com FOR RELEASE: Wednesday, REPORTS SECOND QUARTER 2012 RESULTS $6.5 Billion in Quarterly Revenue, Highest in Company
NORWEGIAN AIR SHUTTLE ASA QUARTERLY REPORT FIRST QUARTER 2004 [This document is a translation from the original Norwegian version]
![NORWEGIAN AIR SHUTTLE ASA QUARTERLY REPORT FIRST QUARTER 2004 [This document is a translation from the original Norwegian version]](/thumbs/87/95085804.jpg "NORWEGIAN AIR SHUTTLE ASA QUARTERLY REPORT FIRST QUARTER 2004 [This document is a translation from the original Norwegian version]") NORWEGIAN AIR SHUTTLE ASA QUARTERLY REPORT 2004 IN BRIEF At the start of 2003, Norwegian has become a pure low-fare airline. The Fokker F-50 operations have been terminated, and during the quarter the
NORWEGIAN AIR SHUTTLE ASA QUARTERLY REPORT 2004 IN BRIEF At the start of 2003, Norwegian has become a pure low-fare airline. The Fokker F-50 operations have been terminated, and during the quarter the
Terminal Space and Ratemaking
 Terminal Space and Ratemaking (Written by Dafang Wu on March 19, 2016; PDF version) This article discusses classification of terminal space and options for setting terminal rates and charges methodology.
MIRAMAR, Fla., April 29, 2015 (GLOBE NEWSWIRE) -- Spirit Airlines, Inc. (Nasdaq:SAVE) today reported first quarter 2015 financial results.
 -- Spirit Airlines, Inc. (Nasdaq:SAVE) today reported first quarter 2015 financial results.") April 29, 2015 Spirit Airlines Announces First Quarter 2015 Results; Adjusted Net Income Increases 87.1 Percent to $70.7 Million and Pre-Tax Margin Increases 900 Basis Points to 22.7 Percent MIRAMAR, Fla.,
April 29, 2015 Spirit Airlines Announces First Quarter 2015 Results; Adjusted Net Income Increases 87.1 Percent to $70.7 Million and Pre-Tax Margin Increases 900 Basis Points to 22.7 Percent MIRAMAR, Fla.,
6.0 Capital Improvement Program. 6.1 Capital Improvement Plan (CIP)
") 6.0 The addresses the phased scheduling of projects identified in this Master Plan and their financial implications on the resources of the Airport and the City of Prescott. The phased Capital Improvement
6.0 The addresses the phased scheduling of projects identified in this Master Plan and their financial implications on the resources of the Airport and the City of Prescott. The phased Capital Improvement
2017 Accomplishments
 CY2017 ANNUAL REPORT Vision The Chippewa Valley Regional Airport will provide our users with a safe, efficient and welcoming operation while striving to meet the needs of the communities we serve. 2017
Spirit Airlines Reports Fourth Quarter and Full Year 2016 Results
 Spirit Airlines Reports Fourth Quarter and Full Year 2016 Results MIRAMAR, FL. (February 7, 2017) - Spirit Airlines, Inc. (NASDAQ: SAVE) today reported fourth quarter and full year 2016 financial results.
TABLE OF CONTENTS. Washington Aviation System Plan Update July 2017 i
 TABLE OF CONTENTS Chapter 1 Overview... 1-1 1.1 Background... 1-1 1.2 Overview of 2015 WASP... 1-1 1.2.1 Aviation System Performance... 1-2 1.3 Prior WSDOT Aviation Planning Studies... 1-3 1.3.1 2009 Long-Term
1.0 Project Background Mission Statement and Goals Objectives of this Sustainable Master Plan
 TABLE OF CONTENTS CHAPTER 1 INTRODUCTION 10 Project Background 1-1 11 Mission Statement and Goals 1-1 12 Objectives of this Sustainable Master Plan 1-2 CHAPTER 2 INVENTORY 20 Airport Background 2-1 201
INVESTOR PRESENTATION. Imperial Capital Global Opportunities Conference September 2015
 INVESTOR PRESENTATION Imperial Capital Global Opportunities Conference September 2015 Forward-looking Statements This presentation contains forward-looking statements within the meaning of the Private
STUDY OVERVIEW MASTER PLAN GOALS AND OBJECTIVES
 INTRODUCTION An Airport Master Plan provides an evalua on of the airport s avia on demand and an overview of the systema c airport development that will best meet those demands. The Master Plan establishes
COUNTY OF MUSKEGON MUSKEGON COUNTY AIRPORT Rates, Charges and Fee for FY18 October 1, 2017 through September 30, 2018
 COUNTY OF MUSKEGON MUSKEGON COUNTY AIRPORT Rates, Charges and Fee for FY18 October 1, 2017 through September 30, 2018 GROUND & FACILITY LEASE RATES Ground Lease Rate Bare ground for development Per Individual
EXHIBIT K TERMINAL PROJECT PROCEDURES PHASE I - DEVELOPMENT OF TERMINAL PROGRAM & ALTERNATIVES
 EXHIBIT K TERMINAL PROJECT PROCEDURES PHASE I - DEVELOPMENT OF TERMINAL PROGRAM & ALTERNATIVES Over the term of the Master Amendment to the Airline Use and Lease Agreement, the Kansas City Aviation Department
REVIEW OF THE STATE EXECUTIVE AIRCRAFT POOL
 STATE OF FLORIDA Report No. 95-05 James L. Carpenter Interim Director Office of Program Policy Analysis And Government Accountability September 14, 1995 REVIEW OF THE STATE EXECUTIVE AIRCRAFT POOL PURPOSE
 AGENDA REPORT Ordinance: Approval of Proposed Fiscal Year 2017-18 Airline Landing Fee Rates, Terminal Space Rental Rates, and Other Fees, and Amendment and Restatement of Port Ordinance No. 3634. (Aviation)
Business Plan INTRODUCTION AIRPORT ENTERPRISE FUND OVERVIEW. Master Plan Guiding Principles
 5 Business Plan INTRODUCTION Just as previous chapters have outlined plans for the airport s physical development, this chapter outlines a plan for the airport s financial development. More specifically,
2009 Muskoka Airport Economic Impact Study
 2009 Muskoka Airport Economic Impact Study November 4, 2009 Prepared by The District of Muskoka Planning and Economic Development Department BACKGROUND The Muskoka Airport is situated at the north end
Aviation Operating Administration/Executive
 Aviation Operating Administration/Executive To provide the executive and administrative support necessary to the Divisions within the Aviation Department to ensure continued efficiencies, effectiveness,
AMERICAN AIRLINES GROUP REPORTS DECEMBER TRAFFIC RESULTS
 Corporate Communications 817-967-1577 mediarelations@aa.com Investor Relations 817-931-3423 investor.relations@aa.com FOR RELEASE: Monday, AMERICAN AIRLINES GROUP REPORTS DECEMBER TRAFFIC RESULTS FORT
Executive Summary. MASTER PLAN UPDATE Fort Collins-Loveland Municipal Airport
 Executive Summary MASTER PLAN UPDATE Fort Collins-Loveland Municipal Airport As a general aviation and commercial service airport, Fort Collins- Loveland Municipal Airport serves as an important niche
ACI-NA BUSINESS TERM SURVEY 2018 BUSINESS OF AIRPORTS CONFERENCE
 ACI-NA 2017-18 BUSINESS TERM SURVEY 2018 BUSINESS OF AIRPORTS CONFERENCE Airport/Airline Business Working Group Tatiana Starostina Dafang Wu Assisted by Professor Jonathan Williams, UNC Agenda Background
Session 6 Airport Finance 101 Funding Sources for Airports
 Session 6 Airport Finance 101 Funding Sources for Airports 31 st Annual AAAE Basics of Airport Law Workshop and 2015 Legal Update November 1-3, 2015 Desk Reference Chapters 2, 19, 22 Frank J. San Martin
Table of Contents. Overview Objectives Key Issues Process...1-3
 Table of Contents Chapter One Introduction Overview...1-1 Objectives...1-1 Key Issues...1-2 Process...1-3 Chapter Two Inventory of Existing Conditions Airport Setting...2-1 Locale...2-1 Airport Surroundings...2-5
The Start. Ed White, Vice President Corporate Real Estate, Alaska Airlines ACI-NA Economic and Finance Conference, April 7, 2009
 1 The Start Ed White, Vice President Corporate Real Estate, Alaska Airlines ACI-NA Economic and Finance Conference, April 7, 2009 2 The Issues Airports... Desire high ratings to reduce borrowing costs
3. Aviation Activity Forecasts
 3. Aviation Activity Forecasts This section presents forecasts of aviation activity for the Airport through 2029. Forecasts were developed for enplaned passengers, air carrier and regional/commuter airline
INTERNAL AUDIT REPORT
 REPORT SLOA III Airline Agreement Compliance with Calculation of Rates Limited Operational Audit January 1, 2013 December 31, 2014 ISSUE DATE: February 10, 2015 REPORT NO. 2015-04 TABLE OF CONTENTS TRANSMITTAL
Current and Forecast Demand
 Existing Facilities Jacksonville International Airport (JIA) is served by a number of airside and landside facilities. There are two runways that serve the airport in an open V configuration. The Annual
THIRD QUARTER RESULTS 2017
 THIRD QUARTER RESULTS 2017 KEY RESULTS In the 3Q17 Interjet total revenues added $5,835.1 million pesos that represented an increase of 22.0% over the revenue generated in the 3Q16. In the 3Q17, operating
Investor Relations Update October 25, 2018
 General Overview Investor Relations Update Revenue The company expects its fourth quarter total revenue per available seat mile (TRASM) to be up approximately 1.5 to 3.5 percent year-over-year. Fuel Based
The presentation was approximately 25 minutes The presentation is part of Working Group Meeting 3
 This is the presentation for the third Master Plan Update Working Group Meeting being conducted for the Ted Stevens Anchorage International Airport Master Plan Update. It was given on Thursday March 7