Ot her Agenda I t em s
|
|
|
- Camilla Porter
- 5 years ago
- Views:
Transcription


1 Af f i davi t of Pos t i ng Ot her Agenda I t em s AGENDA Public Works Committee Meeting Thursday, May 18, :30 AM Newburg Village Hall 614 Main Street, Newburg WI Joint Meeting of the Ozaukee County and Washington County Public Works Committees The following business will be brought before the Committee for initiation, discussion, deliberation, and possible formal action subject to the rules of the Board, which may be inspected in the office of the County Clerk. 1. Call to Order & Affidavit of Posting - Ozaukee County Public Works Committee 2. Call to Order & Affidavit of Posting - Washington County Public Works Committee 3. Pledge of Allegiance 4. Discussion Items 5. Action Items a. Regional Transit Partnership between Washington and Ozaukee Counties 6. Adjournment It is possible that individual members of other governing bodies of the County government may attend the above meeting. It is possible that such attendance may constitute a meeting of any such other governing body pursuant to State ex rel. Badke v. Greendale Village Board, 173 Wis. 2d 553, 494 N.W. 2d 408 (1993). This notice is given solely to comply with the notice requirements of the open meeting law. No action will be taken by any other governmental body except by the governing body noticed in the caption above. AFFIDAVIT OF POSTING This agenda was posted in the office of the County Clerk on the 11th day of May, Notice was sent to the West Bend Daily News, Express News, WBKV/WMBZ Radio, WTKM Radio, My Community NOW, Hartford Times Press, Kewaskum Statesman, Milwaukee Journal-Sentinel. Individuals with disabilities requiring special accommodations for attendance at the meeting should contact the County Clerk at (262) at least 48 hours prior to the meeting.
2 ATTACHMENTS: Description Regional Transit Partnership between Washington and Ozaukee Counties Regional Transit Partnership between Washington and Ozaukee Counties Regional Transit Partnership between Washington and Ozaukee Counties - WC Transit Development Plan 2015 Type Report Backup Material Backup Material
3 COMMITTEE REPORT To: From: Public Works Committee Scott M. Schmidt, PE, PLS Highway Commissioner / County Surveyor Date: May 18, 2017 Re: Regional Transit Partnership between Washington and Ozaukee Counties POLICY QUESTION: Should the Washington County Highway Department pursue the opportunity to partner with Ozaukee County for a shared services agreement with respect to transit services? DISCUSSION: Washington County and Ozaukee County currently operate separate but similar transit programs. Each county offers a shared ride taxi service and an express bus to Milwaukee County. Recent staffing changes occurring in Ozaukee County brought to the forefront the discussion of the potential merger of these services. In addition, in April of 2017 the Washington County Board of Supervisors adopted its Strategic Priorities for the Quality of Life of the Citizens of Washington County, Included in these priorities is the Regional Transit Partnerships which states the County Administrator and Highway Commissioner will Seek opportunities for collaboration and shared services with public and private partnerships. Staff from both counties and a Southeastern Wisconsin Regional Planning Commission (SEWRPC) representative met to discuss the potential impacts, standards, and process to merge the transit operations. SEWRPC has discussed the potential merger with the Wisconsin Department of Transportation to ascertain information on the process and financial considerations. In 2015, Washington County adopted its Transit System Development Plan (attached). Chapter III of that plan discusses Public Transit Service Objectives and Standards. Ozaukee County is currently in the process of working on their Transit System Development Plan. The Advisory Committee for the Ozaukee County Transit Development Plan was to meet on April 26, 2017 to consider its Chapter III, Public Transit Objectives and Standards. FISCAL EFFECT: No fiscal impact at this time. ATTACHMENTS: Washington County Strategic Priorities, page 8, Regional Transit Partnerships Washington County Transit System Development Plan, March 2015 RECOMMENDATION: Motion to direct the respective Administrators and Highway Commissioners to develop a proposed shared services agreement which achieves the goals of creating efficiencies and an overall better service the for citizens of our counties, at the same or lesser cost.

4 overwhelming demand for more multi-use path type facilities, similar to the Eisenbahn Trail, which "Offer access to unique amenities and natural resources to attract businesses and visitors." To that end, Planning and Parks Staff has initiated a Bike and Pedestrian Plan to identify opportunities for "Fravid{ingl an interconnect*d syst*,"rì r:{ saf* trails and påth$ thãt e*hanc* the m*bility of the conrrnunity" both inside and outside Washington County. o Beginning with the 20tB-2O22 ClP, an annual funding strategy will be proposed for the implementation of a Bike and Pedestrian Plan. This proposal will be recommended no later than the June 2017 meeting of the County Board. lf approved by the County Board in June 2077, and again by June 2018 in the 20L ClP, and upon completion of the Bike and Pedestrian Plan.in 2018, Staff will complete a proposal, to be included in the 20L ClP, costs related to new construction or expansion of bike and pedestrian trail(s) (i.e. surveying, engineering, property acquisition, grants, construction etc.), which will "Foster a safe, caring, well-kept and family-friendly community that supports a positive quality of life." a Regional Transit Partnerships o On a variety of occasions over the past three years, I have had a number of contacts about "Regicnaf ly partner{ingj t* *ffer and *uppert canvenient, reliable, s*fe *nd scrnumical public tr; nsit *pti*ns tt at are accessihle." As part of the County's Transit Development Plan, a number of partnership opportunities were identified with surrounding counties and communities to achieve these stated goals. o No later than the June 2017 meeting of the Public Works Committee, Staff will assist the Committee in developing key objectives to seek in a shared services agreement. No later than AugusT2OtT, these key objectives will be shared with the County Board. Subsequently, over the course of 2OL7 and 2018 the County Administrator and Highway Commissioner will "Seek opportunities for collaboration and shared services with public and private partners." On a quarterly basis, beginning no later than December 2OL7, the Administrator and Commissioner will report back to the Public Works Committee on the fruits of these discussions. 8
5 K COMMUNITY ASSISTANCE PLANNING REPORT NO. 317 MT. PLEASANT 45 WALLACE LAKE MORAINE PARK TECHNICAL INSTITUTE RD. LAC LAWRANN CONSERVANCY AREA K E Z RIDGE BICENTENNIAL PARK 15 RUN RD. 17 I UNIVERSITY OF WISCONSIN WASHINGTON COUNTY CENTER DUNST DR. LN. LUCAS LAKE SA ND SCENIC K R PARADISE DR. PARADISE E RD. E CEDAR RD. VIEW BIG 19 G RD. LAKE WEST BEND TRENTON C R E E K 14 WEST BEND AIRPORT 18 PARK 16 PARK ADDISON WEST BEND LIFE 24 CEDAR RD. 83 ADDISON HARTFORD NN FOX HILL WEST BEND TOWN LINE POLK RD VIEW MILE RD. LAKE SLEEPING DRAGON ST. LAWRENCE NN CEDAR 33 DR. 32 K MAPLE LITTLE LAKE K RD. RUSCO NN LAKE P G KEOWNS NN Z MAPLE 6 DR. 1 LN. LAWRENCE RD. ST. 3 4 MUELLER LAKE DR. 175 NN RD. RD. DR. 144 INDIAN QUAAS SILVER WASHINGTON COUNTY TRANSIT SYSTEM DEVELOPMENT PLAN RD. LAKE AURORA DR Z RD. WILLIAMS W ST. LAWRENCE LN. DEER RD. DEER Z S DR. C DIVISION WILD ALLENTON WILDLIFE AREA RD. FORK RD. 23 C R E AURORA DR. RD. BLUEBERRY RD. 22 MILE 33 RIVERSIDE RD. HILLCREST DR. R E E ALLENTON 21 7 E V IL 18 GILBERT WEST BEND S NABOB 13 DR. 41 DALE K U 15 5 DR MAPLE A W IL M 16 BARTON WEST BEND AURORA DDISON REGNER PARK 10 ALPINE 33 W B A P RT O N O D N ALBECKER PARK WALLACE 6 LENWOOD LAKE RD. ER RIV WW RD. ERCRESS DR. SANDY KNOLL PARK 1 2 DR. SCHUSTERS 9 RD. FOREST VIE NEWARK GLACIAL 3 BLUE HILL RECREATION AREA 4 BEAVER M RD. ANTHONY DW 31 D DA K C O R ST. ANTHONY ST LIZARD MOUND PARK RD. 6 R E 1 2 CLUB LN. YOUNG AMERICA WILDWOOD IV R 3 RD. 29 DR. A RD. RD. DAM RD. 33 TOWER RD. BEAVER EHNE LAKE 30 SUNNBROOK SMITH LAKE D RD WAYNE ADDISON W. VIEW RD D TOWNLINE 33 4 HI MOUNT RD. WW 34 BEAVER DAM RD. M LN. W 1 A U D KOHLSVILLE DR. W K GOODLUCK D E S RIVER AURORA DR. W 30 BARTON BEECHNUT S DR. LE KETTLE LSVIL OWNHALL KOH PLEASANT CEDAR LAKE RD. ARTHUR DIFFENBACH CORNERS NN PLEASANT VALLEY RD. VALLEY RD. JACKSON P Z DR. 41 CEDAR CREEK RD. CEDAR CREEK RD. CLOVER HILLSIDE MAYFIELD LAKE K SLINGER RD. 13 TILLY 14 EE CEDAR CREEK R DA CE 15 CR 17 R DA CE 18 DR. 14 HILLDALE C C C RD 83 HASMER LAKE C PARK. 60 R A ED JACKSON JACKSON PIKE RD. R RD. RD. LAC 41 DR E AVE. WESTERN. C 45 N E POWER KETTLE CC PIONEER POLK RICHFIELD RD. RD. WATERFORD SPRING PIONEER RI VE R SLINGER RD. GERMA ROCKY LN. 31 SCENIC P HILL RD. Y 34 E K HALL SOUTHEASTERN CC WISCONSIN RI V ER 9 RD. BONNIWELL NO RD. AN CH RICHFIELD 12 REGIONAL 175 PLANNING ROCKFIELD RD. 167 RD. 11 SHANNON E ST. PATRICK LN. H BR RT PLEASANT HILL LN. CEDAR RD. RIVER ON 5 Y 164 PLEASANT HILL RD. 6 1 RD W. MILL RD. O D. K DU RD. E 29 E 33 E D HERITAGE TRAILS PARK 30 SHERMAN C ACKERVILLE N RD. RD FO SHERMAN SHERMAN 19 MAPLE CC 27 INDEPENDENCE PARK 28 HARTFORD POLK LAKE MILL RD RD. 9 ROCKFIELD 8 7 COMMISSION 45 HOLY HILL RD. D. K POLK JACKSON 22 MUD LAKE 19 LAKE PARK BONNIE LN. MORAINE 21 D 24 PIKE STATE RD
6 SOUTHEASTERN WISCONSIN REGIONAL PLANNING COMMISSION KENOSHA COUNTY Adelene Greene, Secretary Robert W. Pitts Michael J. Skalitzky MILWAUKEE COUNTY Marina Dimitrijevic Brian R. Dranzik William R. Drew, Treasurer OZAUKEE COUNTY Thomas H. Buestrin David W. Opitz Gus W. Wirth, Jr. WAUKESHA COUNTY Michael A. Crowley Jose Delgado James T. Dwyer RACINE COUNTY Mike Dawson David Eberle Peggy L. Shumway WALWORTH COUNTY Charles L. Colman, Vice Chairman Nancy Russell Linda J. Seemeyer WASHINGTON COUNTY Daniel S. Schmidt Daniel W. Stoffel David L. Stroik, Chairman SOUTHEASTERN WISCONSIN REGIONAL PLANNING COMMISSION STAFF Kenneth R. Yunker, PE Executive Director Michael G. Hahn, PE, PH Deputy Director ElizabethA. Larsen, SPHR Assistant Director- Administration Stephen P.Adams Public Involvement and Outreach Manager Nancy M.Anderson,AICP Chief Community Assistance Planner Christopher T. Hiebert, PE..... Chief Transportation Engineer Laura L. Kletti, PE, CFM Chief Environmental Engineer John G. McDougall Geographic Information Systems Manager DavidA. Schilling Chief Land Use Planner Dr. Thomas M. Slawski Chief Biologist WASHINGTON COUNTY TRANSIT PLANNING ADVISORY COMMITTEE Daniel W. Stoffel Supervisor, Washington County Board Chairman Commissioner, Southeastern Wisconsin Regional Planning Commission R.J. Bast Director of Operations, GoRiteway Transportation Group Operator, Washington County Commuter Express John Bloor Executive Director, The Threshold, Inc. Janean Brudvig Executive Director, Interfaith Caregivers of Washington County Andrew Dresang Manager of Community Relations, Froedtert Health Justin Drew Director of Planning and Zoning, City of Hartford Jeffrey Euclide Chief Nurse Executive, Aurora Medical Center of Washington County Wes Gaedtke Operator, West Bend Taxi Daniel R. Goetz Supervisor, Washington County Board Chairperson, Washington County Board of Supervisors Transportation Committee Richard P. Gundrum Supervisor, Washington County Board Chairperson, Aging and Disability Resource Center Board of Washington County, Trustee, Village of Slinger Jim Haggerty Village Engineer, Village of Slinger Mike Hermann Director of Parks and Recreation, City of Hartford Operator, Hartford Taxi Steve Johnson President, Specialized Transportation Services, Inc. Operator, Washington County Shared-Ride Taxi Daniel Ludwig Director of Public Works, Village of Germantown Linda Olson Director, Aging and Disability Resource Center of Washington County Mark Piotrowicz City Planner/Operations Manager, West Bend Department of Community Development Deborah Reinbold Programs & Communications Coordinator, Washington County Economic Development Corporation Steve Schmeling Manager, West Bend Vehicle Maintenance Department Joshua Schoemann Administrator, Washington County Thomas H. Wenzel Vice President, Tavern League of Washington County Thomas Wondra Highway Commissioner, Washington County Highway Department Special acknowledgment is due the following individuals who served as previous members fo the Committee during the course of the planning program: Debi Genthe, Executive Director, Interfaith Caregivers of Washington County; Brydie Hill, Executive Director, Interfaith Caregivers of Washington County; Lori Hundertmark, Manager, Aurora Advanced Healthcare Hartford Clinic; and Jacob Miller, Policy & Program Analyst, Wisconsin Department of Transportation.
7 COMMUNITY ASSISTANCE PLANNING REPORT NUMBER 317 WASHINGTON COUNTY TRANSIT SYSTEM DEVELOPMENT PLAN Prepared by the Southeastern Wisconsin Regional Planning Commission W239 N1812 Rockwood Drive P.O. Box 1607 Waukesha, Wisconsin The preparation of this publication was financed in part through planning funds provided by the Wisconsin Department Transportation and the U.S. Department of Transportation, Federal Transit Administration. March 2015 Inside Region $10.00
8 (This page intentionally left blank)
9 TABLE OF CONTENTS Page Chapter I INTRODUCTION... 1 Introduction... 1 Chapter II EXISTING TRANSIT SERVICES AND TRAVEL PATTERNS... 5 Introduction and Summary... 5 Washington County Transit System... 6 Administrative Structure... 7 Washington County Commuter Express... 7 Routes... 7 Park and Ride Lots Ridership Fares Vehicle Fleet and Maintenance Facilities Expenditures and Revenue Characteristics of Users Travel Patterns of Users Washington County Shared-Ride Taxi Service Area Service Level Ridership Fares Vehicle Fleet and Maintenance Facilities Expenditures and Revenue Characteristics of Users Travel Patterns of Users Other Major Public Transit Services Hartford City Taxi Service Area Service Level Ridership Fares Vehicle Fleet and Maintenance Facilities Expenditures and Revenue Characteristics of Users Page West Bend Taxi Service Area Service Level Ridership Fares Vehicle Fleet and Maintenance Facilities Expenditures and Revenue Characteristics of Users Intercity Bus Services Taxicab Service Human Services Transportation Programs Chapter III PUBLIC TRANSIT SERVICE OBJECTIVES AND STANDARDS Introduction Objectives Principles and Standards Additional Considerations Chapter IV EVALUATION OF THE WASHINGTON COUNTY TRANSIT SYSTEM Introduction and Summary Summary of the Performance Evaluation of the Washington County Commuter Express Summary of the Performance Evaluation of the Washington County Shared-Ride Taxi Peer Systems Washington County Commuter Express Peer Group Washington County Shared-Ride Taxi Peer Group iii
10 Page Performance Evaluation of the Washington County Commuter Express Objective 1: Meeting the Need and Demand for Service Rapid Fixed-Route Transit Service Design and Operating Standard Major Activity Centers Performance Standard Population Performance Standard Employment Performance Standard Objective 2: Operating Safely, Reliably, Conveniently, Comfortably, and Efficiently Route Design and Operating Standard Bus Stop and Park and Ride Lot Design and Operating Standard Service Frequency and Availability Design and Operating Standard Service Travel Speeds Design and Operating Standard Passenger Demand Design and Operating Standard Ridership and Service Effectiveness Performance Standard On-Time Performance Standard Travel Time Performance Standard Objective 3: Utilizing Public Resources Cost Effectively Fare Structure Design and Operating Standard Operating Expenses Performance Standard Cost Effectiveness Performance Standard Analysis of Reductions in Traffic Volume and Emissions Traffic Volume Emissions Performance Evaluation of the Washington County Shared-Ride Taxi Objective 1: Meeting the Need and Demand for Service Demand-Responsive Transit Service Design and Operating Standard Major Activity Centers Performance Standard Population Performance Standard Employment Performance Standard Page Objective 2: Operating Safely, Reliably, Conveniently, Comfortably, and Efficiently Service Frequency and Availability Design and Operating Standard Service Travel Speeds Design and Operating Standard Ridership and Service Effectiveness Performance Standard On-Time Performance Standard Travel Time Performance Standard Objective 3: Utilizing Public Resources Cost-Effectively Fare Structure Design and Operating Standard Operating Expenses Performance Standard Cost Effectiveness Performance Standard Conclusion Chapter V TRANSIT SERVICE ALTERNATIVES FOR THE WASHINGTON COUNTY TRANSIT SYSTEM Introduction and Summary Summary of the Fixed-Route Service Alternatives for the Washington County Transit System No Changes to the Washington County Commuter Express Reduce Service on the Washington County Commuter Express Increase Service Frequency Washington County Commuter Express Service to Additional Destinations Washington County Commuter Express Service Originating in the City of Hartford Reverse Commute Service from Milwaukee County to Employers in Washington County Fixed-Route Service between the City of West Bend and the City of Fond du Lac iv
11 Page Summary of the Shared-Ride Taxi Service Alternatives for the Washington County Transit System Increase Fares at a Rate Greater than Inflation on the County Shared-Ride Taxi Service Merging with the Municipal Taxi Systems Merging with the Ozaukee County Shared-Ride Taxi Service Providing a Secondary Taxi Depot in the Village of Germantown Extending the Service Hours of the Shared-Ride Taxi Fixed-Route Service Alternatives and Improvements No changes to the Washington County Commuter Express Reduce Service on the Washington County Commuter Express Eliminate the Medical Center Route Eliminate Low-Performing Runs from Both Routes Increase Frequency and Service Hours of the Washington County Commuter Express Service Washington County Commuter Express Service to Additional Destinations University of Wisconsin Milwaukee General Mitchell International Airport Kohl s Department Stores Corporate Headquarters Park Place Office Complex Mayfair Mall and Offices Washington County Commuter Express Service Originating in the City of Hartford Provide Direct Service to Downtown Milwaukee Provide a Shuttle to Serve as a Feeder to Existing Washington County Commuter Express Services Reverse Commute Service from Milwaukee County to Employers in Washington County Page Service to the Germantown Industrial Park Service to the Germantown Industrial Park and West Bend via W. Fond du Lac Avenue Fixed-Route Service between the City of West Bend and the City of Fond du Lac Shared-Ride Taxi Service Alternatives and Improvements No. Changes to the Existing County Shared-Ride Taxi Services Increase Fares at a Rate Greater than Inflation in the County Shared-Ride Taxi Service Merging the Municipal and County Shared-Ride Taxi Services Existing Level of Service Alternative Reduced Level of Service Alternative Merging the Ozaukee County and Washington County Shared-Ride Taxi Services Providing a Secondary Washington County Shared-Ride Taxi Depot in the Village of Germantown Extending Washington County Shared-Ride Taxi Service Hours Conclusion Chapter VI RECOMMENDED TRANSIT SERVICE PLAN FOR THE WASHINGTON COUNTY TRANSIT SYSTEM Introduction and Summary Summary of the Recommended Transit Services if Funding is Maintained Summary of the Recommended Transit Services if Funding is Reduced Summary of the Recommended Transit Services if Funding is Increased Summary of the Transit Services Requiring Further Study Summary of the Transit Services Not Recommended for Implementation or Further Study v
12 Page Recommended Transit Services if Funding is Maintained Service to Schlitz Park Service to Summit Place Ridership, Expenses, and Revenues Recommended Transit Services if Funding is Reduced Increasing Fares at a Rate Faster than Inflation Eliminate the Lowest Performing Commuter Express Runs Recommended Transit Services if Funding is Increased Adding Vehicles and Runs to the Commuter Express Providing a Shuttle Connecting Hartford and Slinger to Existing Commuter Express Services Providing a Reverse Commute Service to Employers in Washington County Extending the Shared-Ride Taxi Service Hours Transit Services Requiring Further Study Extending the Commuter Express Downtown Route to UWM Providing Additional Evening Service on the Commuter Express Medical Center Route Merging the Ozaukee County and Washington County Shared-Ride Taxi Services Transit Services Not Recommended for Implementation or Further Study Conclusion Chapter VII SUMMARY AND CONCLUSIONS Introduction Existing Transit Services and Travel Patterns Washington County Transit System Hartford City Taxi West Bend Taxi Page Public Transit Service Objectives and Standards Evaluation of the Washington County Transit System Summary of the Performance Evaluation of the Washington County Commuter Express Summary of the Performance Evaluation of the Washington County Share-Ride Taxi Transit Service Alternatives Summary of the Fixed-Route Service Alternatives for the Washington County Transit System No Changes to the Washington County Commuter Express Reduce Service on the Washington County Commuter Express Increase and Improve Service on the Washington County Commuter Express Summary of the Shared-Ride Taxi Service Alternatives for the Washington County Transit System No Changes to the Washington County Shared-Ride Taxi Reduce Funding for the Washington County Shared-Ride Taxi Expand or Improve Service on the Washington County Shared-Ride Taxi Recommended Transit Service Plan Recommended Transit Service if Funding is Maintained Summary of the Recommended Transit Services if Funding is Reduced Summary of the Recommended Transit Services if Funding is Increased Summary of the Transit Services Requiring Further Study Conclusions vi
13 LIST OF TABLES Table Page Chapter II 1 Washington County Commuter Express Service Ridership and Service Levels: Annual Operating Expenses, Revenues, and Assistance for the Washington County Commuter Express Service: Socioeconomic Characteristics of Weekday Transit Riders on the Washington County Commuter Express Service: October Washington County Commuter Express Service Average Daily Boarding and Alightings by Park and Ride Lot: September Washington County Shared-Ride Taxi Service Ridership and Service Levels: Fares for the Washington County Shared-Ride Taxi Service: January Vehicle Fleet Used for the Washington County Shared-Ride Taxi Service: January Annual Operating Expenses, Revenues, and Assistance for the Washington County Shared-Ride Taxi Service: Socioeconomic Characteristics of Weekday Transit Ridership on the Washington County Shared-Ride Taxi Service: Hartford City Taxi Service Ridership and Service Levels: Annual Operating Expenses, Revenues, and Assistance for the Hartford City Taxi Service: Socioeconomic Characteristics of Weekday Transit Riders on the Hartford City Taxi Service: October West Bend Taxi Service Ridership and Service Levels: Annual Operating Expenses, Revenues, and Assistance for the West Bend Taxi Service: Socioeconomic Characteristics of Weekday Transit Riders on the West Bend Taxi Service: October Human Services Transportation Providers within Washington County: Chapter IV 17 Selected 2011 Service Characteristics for the Washington County Commuter Express Service and its Peer Systems Selected 2011 Service Characteristics for the Washington County Shared-Ride Taxi Service and its Peer Systems Residential Facilities for the Transit-Dependent Populations Served by the Commuter Express Major Activity Centers in Milwaukee County Served by the Washington County Commuter Express Washington County Commuter Express Peer Group Data for the Ridership and Service Effectiveness Performance Standard On-Time Performance of the Washington County Commuter Express: April-May Travel Time Comparison between the Washington County Commuter Express and Automobiles Washington County Commuter Express Peer Group Data for the Operating Expenses Performance Standard vii
14 Table Page 25 Washington County Commuter Express Peer Group Data for the Cost Effectiveness Performance Standard Washington County Shared-Ride Taxi Peer Group Data for the Ridership and Service Effectiveness Performance Standard On-Time Performance of the Washington County Shared-Ride Taxi: May Travel Time Comparison between the Washington County Shared-Ride Taxi and Automobiles for Selected Trips Washington County Shared-Ride Taxi Peer Group Data for the Operating Expenses Performance Standard Washington County Shared-Ride Taxi Peer Group Data for the Cost Effectiveness Performance Standard Chapter V 31 Projected Annual Operating Expenses, Revenues, and Ridership for the Washington County Commuter Express Service: Projected Annual Operating Expenses, Revenues, and Ridership for the Washington County Commuter Express Service if the Medical Center Route is Eliminated: Projected Annual Operating Expenses, Revenues, and Ridership for the Washington County Commuter Express Service if the Lowest Performing Runs are Eliminated: Projected Annual Operating Expenses, Revenues, and Ridership for the Washington County Commuter Express Service for Three Alternatives: Projected Annual Operating Expenses, Revenues, and Ridership for Extending the Washington County Commuter Express Downtown Route to the University of Wisconsin-Milwaukee: Washington County Commuter Express Downtown Route Runs Extended to the University of Wisconsin-Milwaukee: Projected Annual Operating Expenses, Revenues, and Ridership for Providing the Washington County Commuter Express to General Mitchell International Airport: Projected Annual Operating Expenses, Revenues, and Ridership for Providing the Washington County Commuter Express to Kohl s Department Stores Corporate Headquarters: Projected Annual Operating Expenses, Revenues, and Ridership for Modifying the Washington County Commuter Express Medical Center Route to Serve the Park Place Office Complex: Projected Annual Operating Expenses, Revenues, and Ridership for Modifying the Washington County Commuter Express Medical Center Route to Serve Mayfair Mall and Nearby Offices: Projected Annual Operating Expenses, Revenues, and Ridership for Providing the Washington County Commuter Express Service from Hartford to Downtown Milwaukee: Projected Annual Operating Expenses, Revenues, and Ridership for Providing the Washington County Commuter Express Service from Hartford to the Richfield Park & Ride Lot: viii
15 Table Page 43 Projected Annual Operating Expenses, Revenues, and Ridership for Providing Local Shuttle Service to the Germantown Industrial Park: Projected Annual Operating Expenses, Revenues, and Ridership for Providing Reverse Commute Washington County Commuter Express Service to Germantown Industrial Park and the City of West Bend: Projected Annual Operating Expenses, Revenues, and Ridership for Providing Washington County Commuter Express Service to the City of Fond du Lac: Projected Annual Operating Expenses, Revenues, and Ridership for the Washington County Shared-Ride Taxi Service: Proposed Capital Equipment Expenditures for the Washington County Shared-Ride Taxi Service: Projected Annual Operating Expenses, Revenues, and Ridership for the Washington County Shared-Ride Taxi Service if Fares are Increased at a Rate Greater than Inflation: Projected Annual Operating Expenses, Revenues, and Ridership for Maintaining the Existing Level of Service within the Cities of Hartford and West Bend Following a Merger of the Municipal Taxi Systems with the Washington County Shared-Ride Taxi Service: Projected Additional Annual Operating Expenses, Revenues, and Ridership for Providing Demand-Response Shared-Ride Taxi Service within Other Municipalities in Washington County: Projected Annual Operating Expenses, Revenues, and Ridership for Providing a Uniform Level of Service County-Wide Following a Merger of the Municipal Taxi Systems with the Washington County Shared-ride Taxi Service: Projected Additional Annual Operating Expenses, Revenues, and Ridership for a Merged Ozaukee County-Washington County Shared-Ride Taxi: Projected Additional Annual Operating Expenses, Revenues, and Ridership for Providing Extended Service Hours of the Washington County Shared-Ride Taxi Service: Chapter VI 54 Projected Annual Operating Expenses, Revenues, and Ridership for the Washington County Transit System if Funding is Maintained: Capital Equipment Expenditures for the Washington County Shared-Ride Taxi System: Projected Annual Operating Expenses, Revenues, and Ridership for the Washington County Commuter Express Service if the Lowest Performing Runs are Eliminated: Projected Annual Operating Expenses, Revenues, and Ridership for Providing Washington County Commuter Express Service from Hartford to the Richfield Park & Ride Lot: Projected Annual Operating Expenses, Revenues, and Ridership for Providing Reverse Commute Washington County Commuter Express Service: Recommended Washington County Shared-Ride Taxi Adult Fares for Extended Weekend Service Hours: ix
16 Table Page 60 Projected Annual Operating Expenses, Revenues, and Ridership for Extending Washington County Shared-Ride Taxi Service Hours: Projected Annual Operating Expenses, Revenues, and Ridership for Extending the Washington County Commuter Express Downtown Route to the University of Wisconsin-Milwaukee: Washington County Commuter Express Downtown Route Runs Extended to the University of Wisconsin-Milwaukee: Projected Annual Operating Expenses, Revenues, and Ridership for Providing a Combined Washington County Commuter Express Route on Run 25 or Run 26: Projected Additional Annual Operating Expenses, Revenues, and Ridership for a Merged Ozaukee County-Washington County Shared-Ride Taxi Service: LIST OF FIGURES Figure Page Chapter II 1 Washington County Commuter Express Service Ridership and Service Levels: Washington County Commuter Express Service Operating Revenues and Expenses: Washington County Shared-Ride Taxi Service Ridership: Washington County Shared-Ride Taxi Service Operating Revenues and Expenses: Hartford City Taxi Service Ridership: Hartford City Taxi Service Operating Revenues and Expenses: West Bend Taxi Service Ridership: West Bend Taxi Service Operating Revenues and Expenses: Chapter III 9 Public Transit Service Objectives and Standards Chapter IV 10 Summary of the Results of the Performance Evaluation of the Washington County Transit System Objective No. 1 and Associated Standards Applicable to the Evaluation of the Washington County Commuter Express Objective No. 2 and Associated Standards Applicable to the Evaluation of the Washington County Commuter Express Ridership and Service Effectiveness Standard: Comparison of Washington County Commuter Express to Peer Group for Associated Performance Measures x
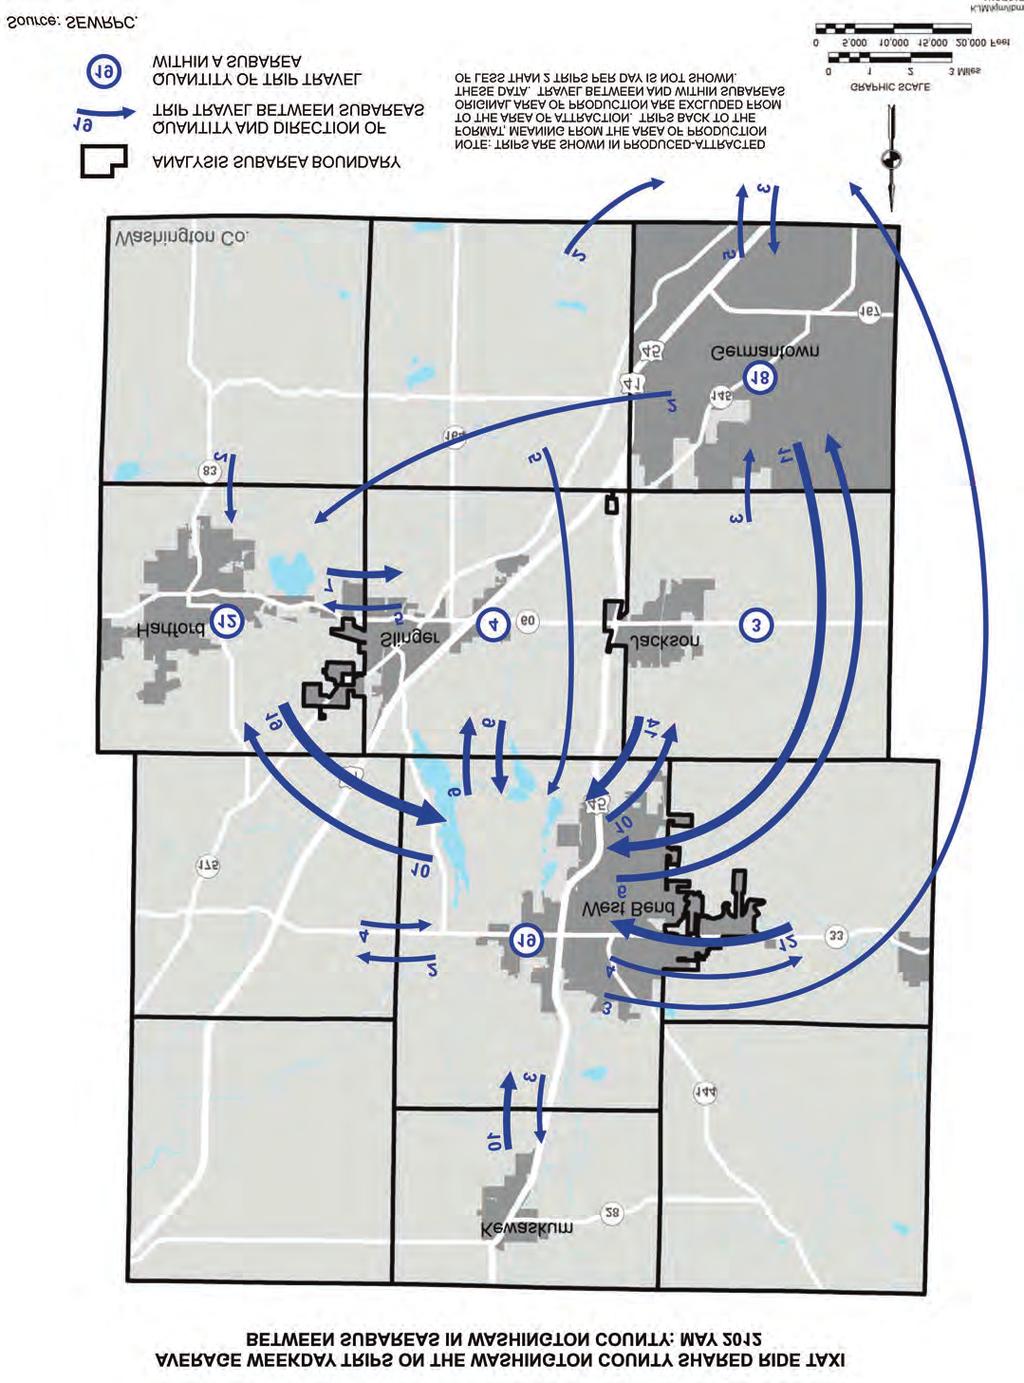
17 Figure Page 14 Objective No. 3 and Associated Standards Applicable to the Evaluation of the Washington County Commuter Express Operating Expenses Standard: Comparison of Washington County Commuter Express to Peer Group for Associated Performance Measures Cost Effectiveness Standard: Comparison of Washington County Commuter Express to Peer Group for Associated Performance Measures Objective No. 1 and Associated Standards Applicable to the Evaluation of the Washington County Shared-Ride Taxi Objective No. 2 and Associated Standards Applicable to the Evaluation of the Washington County Shared-Ride Taxi Ridership and Service Effectiveness Standard: Comparison of Washington County Shared-Ride Taxi to Peer Group for Associated Performance Measures Objective No. 3 and Associated Standards Applicable to the Evaluation of the Washington County Shared-Ride Taxi Operating Expenses Standard: Comparison of Washington County Shared-Ride Taxi Peer Group for Associated Performance Measures Cost Effectiveness Standard: Comparison of Washington County Shared-Ride Taxi to Peer Group for Associated Performance Measures Chapter VII 23 Summary of the Results of the Performance Evaluation of the Washington County Transit System LIST OF MAPS Map Page Chapter I 1 Public Transit Element of the Regional Transportation System Plan: Chapter II 2 Washington County Commuter Express Downtown Route Extension to Serve Schlitz Park Washington County Commuter Express Medical Center Route: Average Weekday Trips on the Washington County Commuter Express Service Areas of Shared-Ride Taxi Services in Washington County: Average Weekday Trips on the Washington County Shared Ride Taxi between Subareas in Washington County: May Chapter IV 7 Major Activity Centers in Washington County Served by the Washington County Commuter Express Major Activity Centers in Milwaukee County Served by the Washington County Commuter Express Population in Washington County Served by the Washington County Commuter Express xi
18 Map Page 10 Employment in Milwaukee County Served by the Washington County Commuter Express Chapter V 11 Proposed Washington County Commuter Express Route to Kohl s Headquarters Proposed Washington County Commuter Express Route Connecting Hartford and Slinger to Downtown Milwaukee Fixed-Route Service to Germantown Industrial Park Washington County Commuter Express Reverse Commute Route Alternative Proposed Washington County Commuter Express Route to the City of Fond du Lac Chapter VI 16 Recommended Washington County Commuter Express Downtown Route with Extension to Serve Schlitz Park Recommended Washington County Commuter Express Medical Center Route Modified to Serve Summit Place Recommended Washington County Commuter Express Shuttle Connecting Hartford to the Richfield Park & Ride Lot Recommended Washington County Commuter Express Reverse Commute Route Service Recommended Washington County Commuter Express Combined Route for Late Evening Runs xii
19 Chapter I INTRODUCTION INTRODUCTION At the request of Washington County, the Regional Planning Commission prepared this transit system operations analysis and short-range service plan for the County. The last short-range transit development plan prepared by the Commission for the County covered the period from 1998 through This new plan is needed in order for the transit system to respond to changes in residential, industrial, and commercial development occurring within the County and the Southeastern Wisconsin Region, as well to adjust service to reflect the needs of existing Washington County Transit System users. This operations analysis and short-range service plan was conducted within the context of the continuing regional transportation planning program. In 2010, the Commission reviewed, updated, and reaffirmed a regional transportation system plan with a design year of That plan includes a public transit element that recommends a doubling of transit service in the Region over a 30-year period (see Map 1). The regional plan also has some specific recommendations that pertain to Washington County: Initiate new and expand existing rapid transit connections provided by buses with commuter seating and amenities operating over freeways between Washington, Waukesha, and Milwaukee Counties. The regional plan recommends that the existing service be extended, with the route starting just north of the City of West Bend. A second route is recommended starting in the City of Hartford, and providing service through the Village of Slinger to Milwaukee County. Under the recommended plan, both routes would operate in both directions all day and evening, providing both traditional commuter and reversecommute service between Washington, northeastern Waukesha, and Milwaukee Counties. Buses would leave every 20 minutes during peak periods, and every 30 to 60 minutes during off-peak periods. Initiate local shuttle service within the City of West Bend and the Village of Germantown to provide access to employers from the reverse-commute rapid transit service from Milwaukee and northeastern Waukesha Counties. The shuttle service would operate a schedule that coordinates with the arrival and departure of rapid transit buses from park-ride lots in the Village of Germantown and City of West Bend. 1 See SEWRPC Community Assistance Planning Report No. 223, A Public Transit Service Plan for Washington County: , November See SEWRPC Memorandum Report No. 197, Review, Update and Reaffirmation of the Year 2035 Regional Transportation Plan, June 2010.

20 GRAPHIC SCALE Map MILES ,000 FEET 2
21 This operations analysis and short-range service planning study is considered an initial stage of implementation of the adopted regional plan. The transit development plan is short-range in nature, covering the period , and is based on a performance review of the existing county transit system, and analyses of the travel habits, patterns, and needs of system users based on travel data and surveys collected in The plan proposes a set of recommended service changes for the transit system and identifies the forecasted ridership, service levels, and operating and capital expenses that would be expected from implementing the changes. This operations analysis and service plan is documented in the following chapters of this report: Chapter 2, Existing Transit Services and Travel Patterns, which describes the public transit system in Washington County, provides the travel patterns of existing ridership, and summarizes the other major transit services presently available in the County. Chapter 3, Public Transit Service Objectives and Standards, which provides a set of transit service objectives, supporting performance standards, and design criteria that are used to evaluate the performance of the existing bus and taxi services; to design any changes to the existing transit services; and to evaluate service alternatives. Chapter 4, Evaluation of the Washington County Transit System, which describes how well the existing transit services meet the performance standards, thereby identifying service-related problems, successes, and deficiencies. Chapter 5, Transit Service Alternatives for the Washington County Transit System, which identifies, describes, and evaluates potential service changes, and provides forecasts of ridership, service levels, and costs for each alternative. Chapter 6, Recommended Transit Service Plan, which sets forth a description of the transit service improvements that have been considered and recommended by the Washington County Transit Development Plan Advisory Committee and a plan for the implementation of the identified service improvements. Chapter 7, Summary and Conclusions, which provides a brief overview of the significant findings and recommendations of the study. 3
22 (This page intentionally left blank)
23 Chapter II EXISTING TRANSIT SERVICES AND TRAVEL PATTERNS INTRODUCTION AND SUMMARY This chapter describes the public transit system in Washington County, provides the travel patterns of existing ridership, and summarizes the other major transit services presently available in the County. The chapter first presents a description of the Washington County Commuter Express and Shared-Ride Taxi services, including service operations, vehicle fleet, ridership, and costs. A description of the other major public transit service providers in the County follows, including the Hartford City Taxi and West Bend Taxi services, intercity bus service, and the principal human services transportation providers for seniors and people with disabilities. A summary of the most important findings follows: 1. The major provider of local public transit service in the County is the Washington County Transit System, which has operated since January The system has two major services, the Commuter Express traditional commute service and the Shared-Ride Taxi service. The system is owned by the County and operated by two private contractors under the supervision of the staff of the Washington County Highway Department. The Washington County Board of Supervisors Transportation Committee sets the policies of the transit system; the ultimate responsibility for review and approval of important matters, including the budget, is with the Washington County Board of Supervisors. 2. In 2013, the Washington County Commuter Express consisted of two weekday-only traditional commute routes operating from three park and ride lots in Washington County to destinations in Milwaukee County. Eight morning and 10 evening trips provided residents of Washington County with transit access to downtown Milwaukee, while four morning and four evening trips provided access to the Milwaukee Regional Medical Center and the Milwaukee County Research Park. The base adult cash fare for the Commuter Express service was $3.75 per trip. Between 2003 and 2011, ridership increased more than 150 percent from 46,600 passengers to 127,600 passengers despite the amount of service offered remaining nearly flat since From 2007 to 2011, annual operating expenditures for the transit system rose by 19 percent, to $1.2 million in Of this total, about $370,000, or 31 percent, was covered by farebox revenues. Operating expenses per hour of service rose significantly between 2007 and 2008, but held relatively steady between 2008 and Federal and State operating funding kept pace with the inflation in costs; therefore, County operating assistance was 43 percent lower in 2011 than in The Commuter Express service s passengers are predominantly between the ages of 25 and 64, with a valid driver s license, and from households with incomes above $50,000 per year. Eighty-five percent of riders have two or more vehicles in their household, and nearly all riders use the service to travel to and from work. 5
24 3. The Washington County Shared-Ride Taxi service provided county-wide mobility for County residents using a fleet of sedans, accessible vans, and accessible buses to serve trips within the County and into northeastern Waukesha County. This service excluded trips where both trip ends were within the borders of the City of Hartford or within the borders of the City of West Bend. The base adult cash fare for 2013 was distance-based, and ranged between $4.25 and $9.00 per trip. After a decade of continuous growth, ridership stabilized in 2008, and remained between 90,000 and 100,000 passengers from then until From 2001 to 2011, annual expenditures for operating the taxi service increased 141 percent, from $0.89 million to $2.14 million. Of this 2011 total, about $0.33 million, or 15.5 percent, was covered by farebox revenues. The amount of County operating assistance rose from 2007 to 2011, with two factors contributing to this significant increase. An 11 percent increase in operating expenses per hour following the start of a new operating contract on January 1, 2008, and a 24 percent decrease in State operating assistance between 2008 and 2011 (from $1.10 million to $0.84 million) combined to raise the County s annual operating assistance for the Shared-Ride Taxi service nearly 460 percent over five years, to $0.58 million in A passenger survey performed in fall of 2012 indicated that the Shared-Ride Taxi passengers were predominantly without a valid driver s license, and from households with incomes below $30,000 per year. About 25 percent of riders had no vehicle in their household and most used the transit system for work or to travel to medical appointments. 4. The Hartford City Taxi serves trips within the City of Hartford, or between the City and any point within one mile of its borders in Washington County and 10 miles of its borders in Dodge County. The City Taxi provided demand-response, curb-to-curb, accessible service to 21,000 passengers in Standard fare was $3.00 in 2013, with an additional charge of $1.25 for each mile of travel outside City limits. Operating expenses steadily increased between 2001 and 2011, but increases in farebox revenue (due to multiple fare increases) and increases in State and Federal funding helped keep the City s financial contribution ($10,400 in 2011) relatively stable. 5. The West Bend Taxi provides service for any trip within its borders or within two miles of its borders. The demand-response, curb-to-curb service provided 123,000 passenger journeys in 2011, an annual number that has been relatively stable since Service effectiveness increased significantly in 2011 compared to previous years, with passengers per vehicle mile and passengers per vehicle hour increasing 12 percent and 14 percent, respectively, over their 2010 numbers. With a standard fare of $4.00 and a new contract operator, the City was able to eliminate its share of operating assistance in Taxicab service is provided in Washington County by A-Taxi, LLC. Numerous non-profits provide transportation for seniors and individuals with disabilities. Two of the largest are Interfaith Caregivers of Washington County, and The Threshold, Inc., which offer volunteer-driven transportation services and transportation for individuals attending their programs. WASHINGTON COUNTY TRANSIT SYSTEM The Washington County Transit System has two major services. The Commuter Express service provides peak traditional commute service using long-distance, accessible motorcoaches traveling from park and ride lots in the City of West Bend, the Village of Richfield, and the Village of Germantown to the Milwaukee Regional Medical Center and downtown Milwaukee, while the Shared-Ride Taxi service provides door-to-door county-wide transit service by dispatching sedans, accessible vans, and accessible small buses using an advanced reservation system. The current Washington County Transit System is an evolution of the system recommended in SEWRPC Community Assistance Planning Report No. 223, A Public Transit Service Plan for Washington County: Following that report s publication in November 1996, County staff, with the assistance of Commission staff, worked to purchase vehicles and select an operator for the Shared-Ride Taxi, which initiated service on January 1, A Federal Highway Administration Congestion Mitigation and Air Quality (CMAQ) grant was received to begin operation of the Commuter Express service on May 3,
25 During the three-year, CMAQ-funded pilot period, traditional and reverse commute services were offered between Washington County and Milwaukee County. The reverse commute services were paired with a series of shuttle services that connected residents of Milwaukee County to jobs in Washington County, including shuttles from park and ride lots in Washington County to the Cities of Hartford and West Bend, and the Village of Slinger. An additional shuttle served the Germantown Industrial Park from Milwaukee County s Mill Road Transit Center near the intersection of N. 76th Street and W. Mill Road. At the end of the pilot period, significant modifications were made to many of the shuttle services, with all reverse commute services and associated shuttles ceasing operation by April While a recession decreased demand by Washington County employers for labor from outside the County, leading to the elimination of all reverse commute services, demand for traditional commute services has continued to increase, with more frequent service and additional destinations added (including the Milwaukee Regional Medical Center and Milwaukee County Research Park) since Administrative Structure Washington County owns the Washington County Transit System, with the Washington County Board of Supervisors Transportation Committee serving as the policy-making entity of the Transit System. The staff of the Washington County Highway Department report to the Transportation Committee, conduct the Requests for Proposals for the operations of the Commuter Express and Shared-Ride Taxi services, procure the vehicles for the Shared-Ride Taxi system, and work closely with the operators to ensure smooth and efficient operations. GoRiteway Transportation Group is the current operator, fleet owner, and maintenance facility owner for the Commuter Express service between the City of West Bend, Village of Richfield, Village of Germantown, and Milwaukee County. The park and ride lots utilized by the Commuter Express service are owned either by the Wisconsin Department of Transportation or Washington County. Specialized Transportation Services, Inc. operates and owns the maintenance facility for the Shared-Ride Taxi service. The Washington County Board of Supervisors has the ultimate responsibility for review and approval of certain important matters, including the annual budget for the Transit System. Washington County Commuter Express The Washington County Transit System provided weekday-only peak commute service during 2013 on two routes shown in Maps 2 and 3. The operating characteristics, service levels, ridership, fares, and financial data for the system are summarized below. Routes The Downtown Route provides service from the Paradise Park and Ride in West Bend, the Richfield Park and Ride, and the Lannon Park and Ride in Germantown to Wisconsin Avenue in Downtown Milwaukee, with stops stretching from Marquette University to Northwestern Mutual. Some return trips in the evening also serve Marquette University High School on N. 35th Street and W. Wisconsin Avenue. Eight morning trips leave the Paradise Park and Ride from 5:25 a.m. to 8:24 a.m., reaching downtown Milwaukee between 6:14 a.m. and 9:33 a.m. Ten evening trips leave Northwestern Mutual s campus between 12:45 p.m. and 6:35 p.m., reaching West Bend between 1:59 p.m. and 7:47 p.m. The Regional Medical Center Route provides service from the Paradise Park and Ride in West Bend, the Richfield Park and Ride, and the Lannon Park and Ride in Germantown to the Milwaukee County Research Park and Milwaukee Regional Medical Center. Some trips also serve Marquette University High School, the Veterans Administration Medical Center, and the Renaissance Faire Office Complex at S. 60th Street and W. Pierce Street Four morning trips leave the Paradise Park and Ride from 5:40 a.m. and 8:15 a.m., reaching the Regional Medical Center between 6:29 a.m. and 8:57 a.m. Four evening trips leave Marquette University High School between 12:15 p.m. and 4:40 p.m., reaching West Bend between 1:34 p.m. and 6:14 p.m. 7

26 Map 2 Source: Washington County Highway Department and SEWRPC. 8

27 Map 3 Source: Washington County Highway Department and SEWRPC. 9

28 Park and Ride Lots As discussed previously, the Commuter Express routes serve three park and ride lots in Washington County. Figure 1 WASHINGTON COUNTY COMMUTER EXPRESS SERVICE RIDERSHIP AND SERVICE LEVELS: The Paradise Park and Ride on Parkway Drive in the City of West Bend has free parking for up to 100 vehicles, and includes bicycle facilities. This lot is owned by the Wisconsin Department of Transportation, and on the typical weekday in 2011, 108 vehicles were parked (108 percent of capacity). The Richfield Park and Ride near Pioneer Road on Richfield Parkway in the Village of Richfield has free parking for up to 275 vehicles, and also provides bicycle facilities. This lot is owned by the Washington County Highway Department, and on the typical weekday in 2012, 75 vehicles were parked (27 percent of capacity). The Lannon Park and Ride in the Village of Germantown has free parking for up to Source: Wisconsin Department of Transportation, Washington County Highway Department, and SEWRPC. 155 vehicles. This lot is owned by the Wisconsin Department of Transportation, and on the typical weekday in 2011, 113 vehicles were parked (73 percent of capacity). Ridership Ridership for 2011 on the Commuter Express service was 127,600 revenue passengers. This continues a trend of ridership growth nearly every year since 2003, with only 2007 and 2009 seeing slight decreases in revenue passengers as compared to the preceding year (see Figure 1). The 2007 decrease can likely be attributed to the 30 percent fare increase enacted at the beginning of that year, while the 2009 decrease in ridership may be related to the continued economic downturn that year. Overall, ridership increased more than 150 percent between 2003 and 2011 (from 46,600 to 127,600), despite the amount of service offered (as measured by vehicle miles operated) remaining nearly flat since Table 1 details the service effectiveness, revenue passengers, and service provided per year since the reverse commute services were eliminated. Service effectiveness (as measured by passengers per vehicle mile and passengers per vehicle hour operated) improved overall, with passengers per vehicle mile seeing a steady increase during the time period shown in the table, while passengers per vehicle hour improved until 2008, then held relatively steady at 12 and 14 passengers per vehicle hour. Fares A fare increase occurred on January 1, 2012, bringing fares for the Commuter Express to their 2013 level of $3.75 each way in cash, or $32.50 for a pack of 10 one-way tickets. Historic changes in the one-way cash fare are shown in Figure 1. Vehicle Fleet and Maintenance Facilities Washington County does not own any vehicles or maintenance facilities for the Commuter Express Service. As part of their operating contract with the County, GoRiteway Transportation Group operates a fleet of longdistance, 55-seat, handicap-accessible motorcoaches maintained at a facility located at W201N13900 Fond Du Lac Avenue in the Village of Richfield. 10
29 Table 1 WASHINGTON COUNTY COMMUTER EXPRESS SERVICE RIDERSHIP AND SERVICE LEVELS: Year Characteristic Revenue Passengers Annual Passengers... 66,300 78,900 94,300 90, , , , ,600 Average Weekday Passengers Service Provided Annual Revenue Vehicle Miles , , , , , , , ,400 Annual Revenue Vehicle Hours... 7,300 7,300 11,600 11,600 8,200 8,800 9,000 9,400 Service Effectiveness Passengers per Vehicle Mile Passengers per Vehicle Hour Annual Change by Quantity Characteristic Revenue Passengers Annual Passengers... 12,600 15,400-3,700 20,800-4,900 4,700 16,400 Average Weekday Passengers Service Provided Annual Revenue Vehicle Miles ,800 20,900-24,700 3,700 26,000-2, Annual Revenue Vehicle Hours , , Service Effectiveness Passengers per Vehicle Mile Passengers per Vehicle Hour Annual Change by Percent Characteristic Revenue Passengers Annual Passengers Average Weekday Passengers Service Provided Annual Revenue Vehicle Miles Annual Revenue Vehicle Hours Service Effectiveness Passengers per Vehicle Mile Passengers per Vehicle Hour Source: Wisconsin Department of Transportation, Washington County Highway Department, and SEWRPC. Expenditures and Revenue Trends in operating expenses, State and Federal assistance, County funding, and farebox revenue for the years are shown in Figure 2. Operating expenses have continued to climb for nearly every year since 2004, when the County eliminated the last reverse commute shuttles. During that time period, operating expenses increased 71 percent, from $701,500 in 2004 to $1,201,800 in At the same time, the amount of vehicle hours of service increased 29 percent, indicating that a significant portion of the increase in operating expenses is a result of an increase in the cost per vehicle hour of the service. Some of that increase can be seen in Table 2, which shows operating expenses, revenues, and assistance for and indicates that operating expenses per vehicle hour of service climbed $40.42 over those five years. Table 2 also shows that the service became more efficient over those five years, with total and County operating assistance per passenger decreasing 23.9 percent and 59.3 percent, respectively. 11
30 Recent increases in operating expenses have not been accompanied by increases in County operational assistance, as farebox revenues and State and Federal funding have simultaneously increased. These increases have allowed County operating assistance to fall $105,000, from $246,100 in 2007 to $140,900 in Figure 2 WASHINGTON COUNTY COMMUTER EXPRESS SERVICE OPERATING REVENUES AND EXPENSES: Washington County has had no direct expenditure of funds for capital facilities and equipment for the Commuter Express service, except for the Richfield Park and Ride lot. The Richfield Park and Ride lot was recently constructed utilizing a combination of a Federal Congestion Mitigation and Air Quality Improvement Program grant, Federal Transit Enhancement funds, and County funds. The capital costs of the vehicles and other equipment have been included in the contract operating expenses of GoRiteway Transportation Group. Characteristics of Users The Southeastern Wisconsin Regional Planning Commission (SEWRPC) conducted a passenger survey of the Washington County Commuter Express system in October The survey Source: Wisconsin Department of Transportation, Washington County Highway Department, and SEWRPC. Table 2 ANNUAL OPERATING EXPENSES, REVENUES, AND ASSISTANCE FOR THE WASHINGTON COUNTY COMMUTER EXPRESS SERVICE: Year Change Characteristics Number Percent Services Provided Total Vehicle Miles , , , , ,400 28, Total Vehicle Hours... 11,600 8,200 8,800 9,000 9,400-2, Revenue Passengers 90, , , , ,600 37, Expenses and Revenues Operating Expenses... $1,014,200 $1,079,500 $1,109,800 $1,076,500 $1,201,800 $187, Farebox Revenues , , , , ,900 94, Percent of Expenses Recovered through Revenues Operating Assistance Federal... $128,200 $125,600 $206,600 $200,100 $218,700 $90, State , , , , , , County , , ,500 95, , , Total $738,600 $732,700 $810,300 $756,400 $831,900 $93, Per Trip Data Operating Expenses... $11.19 $ $9.68 $9.42 -$ Farebox Revenue Total Operating Assistance County Operating Assistance Operating Expenses Per Mile... $4.48 $4.70 $4.34 $4.24 $4.72 $ Operating Expenses Per Hour Source: Wisconsin Department of Transportation, Washington County Highway Department, and SEWRPC. 12
31 Table 3 SOCIOECONOMIC CHARACTERISTICS OF WEEKDAY TRANSIT RIDERS ON THE WASHINGTON COUNTY COMMUTER EXPRESS SERVICE: OCTOBER 2012 Percent of Category Total Trips Age 18 and under to to to to to and over Total Sex Male Female Total Licensed Driver Yes No Total Household Income Under $10, $10,000-$19, $20,000-$29, $30,000-$39, $40,000-$49, $50,000-$74, $75,000-$99, $100,000-$199, $200,000 and over Total Trip Purpose Home-Based Work Home-Based Shopping Home-Based Other Nonhome Based School Total Vehicles available per Household No vehicle One vehicle Two or more vehicles Total Frequency of Use Less than once a month times a month times a week times a week More than 5 times a week Total Source: SEWRPC. entailed distributing a prepaid, pre-addressed, mailback survey questionnaire to all passengers on each scheduled weekday bus trip operated by the transit system on the survey day. Spanish-speaking bus passengers were provided with a Spanish translation of the questionnaire. One hundred and sixty-nine completed survey questionnaires were returned, representing about 40 percent of the 421 passenger trips made on the day of the survey. Table 3 provides a summary of the socioeconomic characteristics of Washington County Commuter Express passengers using the bus service on the survey day. The following observations can be made based upon examination of this information: Washington County Commuter Express passengers were predominantly between the ages 25 and 64, had a valid driver s license, and were from households making $50,000 per year or more. Most riders, about 97 percent, used the Commuter Express to commute to and from work. Virtually no weekday riders used the Commuter Express to go shopping, while a few used it to travel to school or with their home not being a beginning or destination end of their trip. About 85 percent of the riders had two or more vehicles available in their household. Over 90 percent of the riders rode the Commuter Express three or more times per week. Travel Patterns of Users Depending on the route and run of the Commuter Express service, different park and ride lots are more popular, suggesting different production areas for the two routes, and perhaps for different runs as well. Table 4 details the boardings and alightings by park and ride lot per route and run of the Commuter Express, showing that some run times are more popular than others, and that the Paradise Park and Ride Lot in the City of West Bend is the most popular for both routes, although not on every run. Table 4 also displays the percentage of seats that are filled on each 55-seat motorcoach. Map 4 shows production-attraction flows on the Commuter Express based on the results of the transit passenger survey conducted in October 2012 by SEWRPC that is included in this section. Nearly a 13
32 Table 4 WASHINGTON COUNTY COMMUTER EXPRESS SERVICE AVERAGE DAILY BOARDINGS AND ALIGHTINGS BY PARK AND RIDE LOT: SEPTEMBER 2012 DOWNTOWN ROUTE Boardings by Park and Ride Lot Percent of Run Start Time West Bend Richfield Germantown Total Ridership Seats Filled 1 5:25 AM :44 AM :10 AM :20 AM :30 AM :01 AM :29 AM :24 AM Total Alightings by Park and Ride Lot Percent of Run Start Time West Bend Richfield Germantown Total Ridership Seats Filled 13 12:45 PM :40 PM :35 PM :35 PM :55 PM :10 PM :35 PM :15 PM :05 PM :35 PM Total Run Start Time MEDICAL CENTER ROUTE Boardings by Park and Ride Lot West Bend Richfield Germantown Total Ridership Percent of Seats Filled 3 5:40 AM :25 AM :40 AM :15 AM Total Alightings by Park and Ride Lot Percent of Run Start Time West Bend Richfield Germantown Total Ridership Seats Filled 14 12:15 PM :20 PM :55 PM :40 PM Total Source: Washington County Highway Department, GoRiteway Transportation Group, and SEWRPC. 14

33 Map 4 15 Source: SEWRPC.
34 majority of Medical Center Route trips begin in the two subareas that contain the City of West Bend, while only a third of Downtown Route trips are produced from the City of West Bend subareas. A much larger proportion of Downtown Route trips than Medical Center Route trips are produced in the Village of Germantown. Other than these differences, the trip production for both routes generally matches the distribution of population throughout the County. Washington County Shared-Ride Taxi The Washington County Shared-Ride Taxi provides county-wide mobility for all residents of Washington County and utilizes a fleet of sedans, accessible vans, and accessible buses. Service Area The Shared-Ride Taxi service is designed to serve any trip made within Washington County during its operating hours, excluding trips where both ends are within the City of Hartford or within the City of West Bend. Those trips are served by the Hartford City Taxi and the West Bend Taxi (see Map 5). Such trips are only served if they are made outside the operating hours of either city s taxi system, or are trips transferring to or from the Washington County Commuter Express service within the City of West Bend. The County Shared-Ride Taxi also provides service between Washington County and northeastern Waukesha County. Service Level The Shared-Ride Taxi provides curb-to-curb service for the general public and door-to-door service for individuals with disabilities. Service is provided on a shared-ride basis in which passengers with different origins and destinations share a vehicle for a portion of their trip. The taxi is an advanced reservation system, with riders guaranteed service if they submit a request the preceding day. If the request is made the same day, the trip will be accommodated if capacity is available. In 2013, the hours of operation for the Shared-Ride Taxi services were: Monday through Saturday, 5:00 a.m. to 10:00 p.m. Sunday, 8:00 a.m. to 4:00 p.m. Ridership Ridership for 2011 was 99,600 revenue passengers. After nearly a decade of continuous growth, ridership stabilized in 2008, and remained between 90,000 and 100,000 revenue passengers from (see Figure 3). Fare increases in 2008 and 2009 have likely contributed to the stability in ridership, so it is difficult to determine if ridership levels will continue to increase disproportionate to County population increases in the future. Table 5 displays the service effectiveness, revenue passengers, and service provided each year since the Shared-Ride Taxi began operations. Other than a slight increase in service provided between 2007 and 2008, the level of service provided during the time period shown in the table has been relatively stable. During this time period, service effectiveness fell slightly, with less passengers per vehicle mile and vehicle hour in 2011 than in Fares A fare increase occurred on January 1, 2012, bringing standard adult fares for the Shared-Ride Taxi to their 2013 level: between $4.25 and $9.00, depending on the distance traveled. A passenger transferring between the Commuter Express and Shared-Ride Taxi services paid only $1.00 to use the Shared-Ride Taxi service. Fares for 2013 are shown in Table 6, while historic changes in the one-way standard adult fare are shown in Figure 3. Vehicle Fleet and Maintenance Facilities The Shared-Ride Taxi service uses publicly owned vehicles provided by Washington County and maintained at a private facility by the service operator. Specialized Transport Services, Inc. uses a facility located at 510 Schoenhaar Drive in West Bend for activities associated with the operations and maintenance of the Shared-Ride Taxi service. The vehicles owned by the County for the Shared-Ride Taxi service have an average age of three years as of January 2013, and are catalogued in Table 7. 16

35 Map 5 SERVICE AREAS OF SHARED-RIDE TAXI SERVICES IN WASHINGTON COUNTY: 2013 Source: SEWRPC. 17
36 Table 5 WASHINGTON COUNTY SHARED-RIDE TAXI SERVICE RIDERSHIP AND SERVICE LEVELS: Characteristic Year Revenue Passengers Annual Passengers... 97,600 98,000 90,100 94,000 99,600 Average Weekday Passengers Service Provided Annual Vehicle Miles... 1,215,000 1,322,100 1,252,700 1,298,500 1,342,400 Annual Vehicle Hours... 55,200 59,600 58,000 60,200 62,400 Service Effectiveness Passengers per Vehicle Mile Passengers per Vehicle Hour Annual Change by Quantity Characteristic Revenue Passengers Annual Passengers ,900 3,900 5,600 Average Weekday Passengers Service Provided Annual Vehicle Miles ,100-69,400 45,800 43,900 Annual Vehicle Hours... 4,400-1,600 2,200 2,200 Service Effectiveness Passengers per Vehicle Mile Passengers per Vehicle Hour Annual Change by Percent Characteristic Revenue Passengers Annual Passengers Average Weekday Passengers Service Provided Annual Vehicle Miles Annual Vehicle Hours Service Effectiveness Passengers per Vehicle Mile Passengers per Vehicle Hour Source: National Transit Database, Washington County Highway Department, and SEWRPC. Expenditures and Revenue Trends in operating expenses, state and federal assistance, county funding, and farebox revenue for the years are shown in Figure 4. Operating expenses increased annually nearly every year from 2001 to During that time period, operating expenses increased 141 percent, from $885,200 in 2001 to $2,135,300 in At the same time, the amount of vehicle hours of service increased 45 percent (from 43,000 hours in 2001 to 62,400 hours in 2011) and vehicle miles of service increased 49 percent (from 0.90 million miles in 2001 to 1.34 million miles in 2011). Farebox revenue grew over this time period as a function of ridership and fares, while the level of County assistance has fluctuated in relation to the amount of service provided and changes in the level of State and Federal funding. 18
37 Table 6 FARES FOR THE WASHINGTON COUNTY SHARED-RIDE TAXI SERVICE: JANUARY 2013 Figure 3 WASHINGTON COUNTY SHARED-RIDE TAXI SERVICE RIDERSHIP: Trip Distance Fare Type Senior/Disabled Adult Student 5.0 miles or less... $2.50 $4.25 $ to 10.0 miles... $3.50 $5.75 $ to 15.0 miles... $4.25 $7.00 $ to 20.0 miles... $5.00 $8.00 $ miles or more... $5.75 $9.00 $8.00 Source: Wisconsin Department of Transportation, Washington County Highway Department, and SEWRPC. Table 8 displays more detailed operating expenditures and revenues for Due to the fare increases in 2008 and 2009, the percentage of expenses recovered through farebox revenues during the time period displayed in the table increased 25 percent, from 12.4 percent to 15.5 percent. Despite the increase in the percentage of expenses recovered through farebox revenues, the amount of County operating assistance per passenger grew 447 percent, from just over $1.00 to just over $5.75. This increase in County operating assistance per passenger can be attributed to an 11 percent increase in operating expenses per hour between 2007 and 2008 due to the start of a new operating contract on January 1, 2008, and a 23 percent decrease in State operating assistance between 2008 and 2011 (from $1.10 million to $0.84 million). Washington County procures the vehicles for the Shared-Ride Taxi, requiring an annual capital expenditure to replace vehicles as they age. The vehicles listed in Table 7 are owned by Washington County, and are replaced as needed on a schedule set by the Washington County Highway Department with the budgetary approval of the Washington County Board. From 2008 to 2012, an average of $210,100 was spent annually on new vehicle purchases, with $58,100 of that being County funds. Washington County has had no direct expenditure of funds for facilities for the Shared-Ride Taxi service, as the capital costs of the maintenance and dispatch facility have been included in the contract operating expenses of Specialized Transportation Services, Inc. Source: Wisconsin Department of Transportation, Washington County Highway Department, and SEWRPC. Figure 4 WASHINGTON COUNTY SHARED-RIDE TAXI SERVICE OPERATING REVENUES AND EXPENSES: Source: Wisconsin Department of Transportation, Washington County Highway Department, and SEWRPC. 19
38 Table 7 VEHICLE FLEET USED FOR THE WASHINGTON COUNTY SHARED-RIDE TAXI SERVICE: JANUARY 2013 Vehicle Type Year of Capacity Make Model Manufacture Ambulatory Wheelchair Mileage Age in Years Chevrolet StarTrans Candidate S , Chevrolet StarTrans Candidate S , Chevrolet StarTrans Candidate S , Chevrolet StarTrans Candidate S , Chevrolet Glaval Titan II / G , Chevrolet Glaval Titan II / G , Dodge Braun Grand Caravan , Dodge Braun Grand Caravan , Dodge Braun Grand Caravan , Dodge Braun Grand Caravan , Ford Crown Victoria , Ford Crown Victoria , Ford Crown Victoria , Ford Starcraft Starlight BUS , Ford Starcraft Starlight BUS , Ford Starcraft Starlight BUS , Ford Starcraft Starlight BUS , Ford Starcraft Starlight BUS , Ford Starcraft Starlight BUS , Chevrolet Mini-Van Braun EnterVan , Chevrolet Mini-Van Braun EnterVan , Chevrolet Mini-Van Braun EnterVan , GMC MiniBus (van) , Ford E350 Braun Van , Ford E350 Braun Van , Ford E350 Braun Van , Chevrolet Impala , Average 155, Source: Wisconsin Department of Transportation, Washington County Highway Department, and SEWRPC. Characteristics of Users SEWRPC conducted a passenger survey of the Washington County Shared-Ride Taxi system in October A prepaid, pre-addressed, mail-back survey questionnaire was provided to all passengers using the Taxi system on the survey day. Spanish-speaking passengers were provided with a Spanish translation of the questionnaire. Ninety-three completed survey questionnaires were returned, representing about 26 percent of the 358 passenger trips made on the Washington County Shared-Ride Taxi on the day of the survey. Table 9 is a summary of the socioeconomic characteristics of Washington County Shared-Ride Taxi passengers using the service on the survey day. The following observations can be made based upon examination of this information from the survey: 20 Most Washington County Shared-Ride Taxi passengers did not have a valid driver s license, and were from households making $29,999 per year or less. Most riders used the Shared-Ride Taxi service to make trips between home and work, followed by trips between home and medical visits, and home and social/recreational activities. About 25 percent of the riders had no vehicle available in their household. Over half of the weekday riders used the taxi service regularly, that is, three or more times a week.
39 Table 8 ANNUAL OPERATING EXPENSES, REVENUES, AND ASSISTANCE FOR THE WASHINGTON COUNTY SHARED-RIDE TAXI SERVICE: Year Change Characteristics Number Percent Service Provided Total Vehicle Miles... 1,215,000 1,322,100 1,252,700 1,298,500 1,342, , Total Vehicle Hours... 55,200 59,600 58,000 60,200 62,400 7, Revenue Passengers... 97,600 98,000 90,100 94,000 99,600 2, Expenses and Revenues Operating Expenses... $1,632,600 $1,950,200 $1,913,200 $1,998,800 $2,135,300 $502, Farebox Revenues , , , , , , Percent of Expenses Recovered through Revenues Operating Assistance Federal... $246,100 $284,300 $408,900 $395,900 $388,600 $142, State... 1,080,800 1,103, , , , , County , , , , , , Total $1,430,100 $1,657,700 $1,603,500 $1,681,400 $1,803,500 $373, Per Trip Data Operating Expenses... $16.73 $19.90 $21.23 $21.26 $21.44 $ Farebox Revenue Total Operating Assistance County Operating Assistance Operating Expenses Per Mile... $1.34 $1.48 $1.53 $1.54 $1.59 $ Operating Expenses Per Hour Source: National Transit Database, Wisconsin Department of Transportation, Washington County Highway Department, and SEWRPC. Travel Patterns of Users Utilizing vehicle logs from May 7 May 18, 2012, Map 6 shows travel within and between subareas of Washington County in a produced-attracted format. The production area for trips having one end at home that is, either coming from or going to home is the area containing the location of the home. The attraction area is the area containing the non-home end of that trip. The production area for trips having neither end at home is the area where the trip started; the attraction area is the location of the trip destination. Examining the map, it can be noted that the distribution of weekday trip productions in the study area reflect the concentrations of population within the County. The more urbanized areas of the County, which have the highest residential density, show the highest number of trip productions and trip attractions. In addition, it is important to note the high level of internal trips within the subarea containing the Village of Germantown, perhaps implying potential cost savings by operating a secondary vehicle base in the southeastern part of the County. OTHER MAJOR PUBLIC TRANSIT SERVICES Washington County is the principal provider of public transit service within the County. However, a number of other transit services were also available in 2013 to County residents, including local transit services for the general public and human services transportation for seniors and people with disabilities. Hartford City Taxi The City of Hartford initiated a publicly subsidized taxi system in January 1981 in response to a perceived need for better transportation for its population. The taxi system was the first public taxicab system in the Southeastern Wisconsin Region, and is staffed by employees managed through the City s Department of Recreation. 21
40 Table 9 SOCIOECONOMIC CHARACTERISTICS OF WEEKDAY TRANSIT RIDERS ON THE WASHINGTON COUNTY SHARED RIDE TAXI SERVICE: OCTOBER 2012 Category Percent of Total Trips Age 18 and under to to to to to and over Total Sex Male Female Total Licensed Driver Yes No Total Household Income Under $10, $10,000-$19, $20,000-$29, $30,000-$39, $40,000-$49, $50,000-$74, $75,000-$99, $100,000-$199, $200,000 and over Total Trip Purpose Home-Based Work Home-Based Shopping Home-Based Other Nonhome Based School Total Vehicles available per Household No vehicle One vehicle Two or more vehicles Total Frequency of Use Less than once a month times a month times a week times a week More than 5 times a week Total Source: SEWRPC. Service Area The Hartford City Taxi serves trips within the City. Additionally, the City Taxi serves trips between the City and any point within one mile of its borders in Washington County and 10 miles of its borders in Dodge County. Service Level The Hartford City Taxi provides demandresponse, curb-to-curb service for the general public. Service is provided on a shared-ride basis in which passengers with different origins and destinations share a vehicle for a portion of their trips. The hours of operation for the City Taxi are: Monday through Friday, 6:00 a.m. to 9:00 p.m. September through May, and June through August, 6:00 a.m. to 8:00 p.m. Saturday, 8:00 a.m. to 8:00 p.m. Sunday, 9:00 a.m. to 4:00 p.m. Ridership Ridership in 2011 was 21,000 revenue passengers. Figure 5 indicates that ridership was relatively stable between 1992 and 2011, varying between 17,600 and 21,400 passengers annually. Table 10 shows ridership, service provided, and service effectiveness from The figures indicate that measures of service effectiveness were, as expected, relatively stable over that time period, with slight increases in both measures every year in nearly all of that five-year period. Fares The standard fare for the Taxi in 2013 was $3.00. The 2013 fare for seniors and people with disabilities was $2.75, while all riders are charged an additional $1.25 for each mile of travel outside City limits. Historic changes in the one-way standard adult fare are shown in Figure 5. Vehicle Fleet and Maintenance Facilities The Hartford City Taxi service uses three publicly owned accessible vans provided by the City of Hartford. The administrative office and vehicles are located at the Recreation Center at 125 N. Rural Street in the City of Hartford. 22
41 Map 6 23
42 Figure 5 HARTFORD CITY TAXI SERVICE RIDERSHIP: Source: Wisconsin Department of Transportation, City of Hartford, and SEWRPC. Expenditures and Revenue Trends in operating expenses, State and Federal assistance, City funding, and farebox revenue for the years are shown in Figure 6. Although operating expenses increased over that time period, increasing farebox revenue and State and Federal funding helped keep the City s contribution to the service relatively stable. Table 11 provides more detail on operating expenses, assistance, and ridership from , and indicates that the City s operating expenses per mile and hour rose between those years, but that those increases did not result in an increase in the level of City operating assistance during this time period. Figure 6 HARTFORD CITY TAXI SERVICE OPERATING REVENUES AND EXPENSES: Characteristics of Users SEWRPC conducted a passenger survey of the Hartford City Taxi system in October A prepaid, pre-addressed, mail-back survey questionnaire was distributed to all passengers using the Taxi system on the survey day. Spanish-speaking passengers were provided with a Spanish translation of the questionnaire. Sixty-two completed survey questionnaires were returned, representing about 83 percent of the estimated 75 average weekday Source: Wisconsin Department of Transportation, City of Hartford, and SEWRPC. passenger trips made using the Hartford City Taxi system in Table 12 is a summary of the socioeconomic characteristics of Hartford City Taxi passengers using the service on the survey day. The following observations can be made based upon examination of this information from the survey: 24
43 Table 10 HARTFORD CITY TAXI SERVICE RIDERSHIP AND SERVICE LEVELS: Year Characteristic Revenue Passengers Annual Passengers... 19,100 20,300 20,300 20,600 21,000 Average Weekday Passengers Service Provided Annual Vehicle Miles... 55,700 55,400 55,000 52,700 55,200 Annual Vehicle Hours... 5,100 5,300 5,300 5,300 5,300 Service Effectiveness Passengers per Vehicle Mile Passengers per Vehicle Hour Annual Change by Quantity Characteristic Revenue Passengers Annual Passengers... 1, Average Weekday Passengers Service Provided Annual Vehicle Miles ,300 2,500 Annual Vehicle Hours Service Effectiveness Passengers per Vehicle Mile Passengers per Vehicle Hour Annual Change by Percent Characteristic Revenue Passengers Annual Passengers Average Weekday Passengers Service Provided Annual Vehicle Miles Annual Vehicle Hours Service Effectiveness Passengers per Vehicle Mile Passengers per Vehicle Hour Source: Wisconsin Department of Transportation, City of Hartford, and SEWRPC. Hartford City Taxi passengers were mostly from households with $19,999 per year or less in income. Most riders used the City Taxi service to make trips between home and shopping destinations or school destinations. About 78 percent of the riders had no vehicle available in their household. A plurality of riders used the Taxi service one to two times per week. 25
44 Table 11 ANNUAL OPERATING EXPENSES, REVENUES, AND ASSISTANCE FOR THE HARTFORD CITY TAXI SERVICE: Year Change Characteristics Number Percent Service Provided Total Vehicle Miles... 55,700 55,400 55,000 52,700 55, Total Vehicle Hours... 5,100 5,300 5,300 5,300 5, Revenue Passengers... 19,100 20,300 20,300 20,600 21,000 1, Expenses and Revenues Operating Expenses... $191,400 $214,600 $226,600 $216,600 $234,400 $43, Farebox Revenues... 53,000 66,400 67,500 67,400 71,600 18, Percent of Expenses Recovered through Revenues Operating Assistance Federal... $66,200 $73,400 $81,800 $82,700 $81,400 $15, State... 58,200 66,100 65,500 64,600 71,000 12, City... 14,000 8,700 11,800 1,900 10,400-3, Total $138,400 $148,200 $159,100 $149,200 $162,800 $24, Per Trip Data Operating Expenses... $10.02 $10.57 $11.16 $10.51 $11.16 $ Farebox Revenue Total Operating Assistance City Operating Assistance Operating Expenses Per Mile... $3.44 $3.87 $4.12 $4.11 $4.25 $ Operating Expenses Per Hour Source: Wisconsin Department of Transportation, City of Hartford, and SEWRPC. West Bend Taxi The City of West Bend initiated the operation of a publicly subsidized taxi system in January 1993 at the recommendation of a transit service feasibility study 1 completed by SEWRPC staff in February Staff of the City s Vehicle Maintenance Department administer the service, which is operated under contract by F.D.S. Enterprises, Inc. Service Area The West Bend Taxi serves trips within the City. Additionally, the Taxi serves trips between the City and any point within two miles of its borders. Service Level The West Bend Taxi provides demand-response, curb-to-curb service for the general public. Service is provided on a shared-ride basis in which passengers with different origins and destinations share a vehicle for a portion of their trips. The hours of operation for the Taxi are: Monday through Saturday, 6:00 a.m. to 10:00 p.m. Sunday and Holidays, 8:00 a.m. to 4:00 p.m. 1 See SEWRPC Community Assistance Planning Report No. 189, A Transit System Feasibility Study and Development Plan for the City of West Bend: , February
45 Table 12 SOCIOECONOMIC CHARACTERISTICS OF WEEKDAY TRANSIT RIDERS ON THE HARTFORD CITY TAXI SERVICE: OCTOBER 2012 Percent of Category Total Trips Age 18 and under to to to to to and over Total Sex Male Female Total Licensed Driver Yes No Total Household Income Under $10, $10,000-$19, $20,000-$29, $30,000-$39, $40,000-$49, $50,000-$74, $75,000-$99, $100,000-$199, $200,000 and over Total Trip Purpose Home-Based Work Home-Based Shopping Home-Based Other Nonhome Based School Total Vehicles available per Household No vehicle One vehicle Two or more vehicles Total Frequency of Use Less than once a month times a month times a week times a week More than 5 times a week Total Source: SEWRPC. Ridership Ridership in 2011 was 123,000 revenue passengers. Figure 7 indicates that ridership was relatively stable between 2001 and 2011, varying between 115,000 and 135,000 passengers annually. Information shown in Table 13 indicates little year-to-year change in service provided and service effectiveness between 2007 and 2010, but significant increases of 12 to 14 percent in service effectiveness between 2010 and This is likely related to a change in contract operators during that time period. Fares A fare increase occurred on January 1, 2013, bringing the standard fare for the Taxi to $4.00. The 2013 fare for seniors and individuals with disabilities is $3.00, and the 2013 fare for students is $3.50. Historic changes in the one-way standard adult fare are shown in Figure 7. Vehicle Fleet and Maintenance Facilities The West Bend Taxi service uses seven publicly owned accessible vans and seven publicly owned non-accessible vans provided by the City of West Bend and maintained by F.D.S. Enterprises, Inc. at their facility. Expenditures and Revenue Trends in operating expenses, State and Federal assistance, City funding, and farebox revenue for the years are shown in Figure 8. Operating expenses, and therefore State, Federal, and City assistance, have decreased dramatically since 2009 after the selection of a new contract operator. Increased farebox revenue and diminishing operating expenses have helped the City eliminate its funding contribution since The data in Table 14 demonstrate the decrease in expenses, showing a steep decline in all measures of operating expenses and assistance, and a 36 percent increase in the percentage of expenses recovered through farebox revenues. Characteristics of Users SEWRPC conducted a passenger survey of the West Bend Taxi system in October A prepaid, preaddressed, mail-back survey questionnaire was distributed to all passengers using the Taxi system on the survey day. Spanish-speaking passengers were provided with a Spanish translation of the questionnaire. Two hundred and forty-one completed survey questionnaires were returned, representing about 59 percent of the 408 passenger 27
46 Table 13 WEST BEND TAXI SERVICE RIDERSHIP AND SERVICE LEVELS: Year Characteristic Revenue Passengers Annual Passengers , , , , ,000 Average Weekday Passengers Service Provided Annual Vehicle Miles , , , , ,800 Annual Vehicle Hours... 37,000 36,900 37,100 37,300 33,300 Service Effectiveness Passengers per Vehicle Mile Passengers per Vehicle Hour Annual Change by Quantity Characteristic Revenue Passengers Annual Passengers ,300 4,300 2,600 Average Weekday Passengers Service Provided Annual Vehicle Miles... -3,600-15,200 2,800-34,000 Annual Vehicle Hours ,000 Service Effectiveness Passengers per Vehicle Mile Passengers per Vehicle Hour Annual Change by Percent Characteristic Revenue Passengers Annual Passengers Average Weekday Passengers Service Provided Annual Vehicle Miles Annual Vehicle Hours Service Effectiveness Passengers per Vehicle Mile Passengers per Vehicle Hour Source: Wisconsin Department of Transportation, City of West Bend, and SEWRPC. trips made using the West Bend Taxi system on the day of the survey. Table 15 is a summary of the socioeconomic characteristics of the West Bend Taxi passengers using the service on the survey day. The following observations can be made based upon examination of this information from the survey: West Bend Taxi passengers were predominantly age 55 or older, without a valid driver s license, and from households making less than $10,000. Most riders used the Taxi service to make trips between home and work, home and shopping destinations, and home and medical/dental visits, or home and social/recreational activities. More than 80 percent of the riders had no vehicle available in their household. About 60 percent of the weekday riders used the Taxi service regularly, that is, three or more times a week. 28
47 Figure 7 WEST BEND TAXI SERVICE RIDERSHIP: Source: Wisconsin Department of Transportation, City of West Bend, and SEWRPC. Table 14 ANNUAL OPERATING EXPENSES, REVENUES, AND ASSISTANCE FOR THE WEST BEND TAXI SERVICE: Year Change Characteristics Number Percent Services Provided Total Vehicle Miles , , , , ,800-50, Total Vehicle Hours... 37,000 36,900 37,100 37,300 33,300-3, Revenue Passengers 119, , , , ,000 4, Expenses and Revenues Operating Expenses... $1,007,900 $1,067,300 $1,108,800 $1,015,600 $791,700 -$216, Farebox Revenues , , , , ,700-12, Percent of Expenses Recovered through Revenues Operating Assistance Federal... $342,700 $356,500 $379,400 $336,600 $215,300 -$127, State , , , , ,700-88, City... 29,400 19,100 38, , Total $684,500 $712,900 $758,800 $674,200 $439,000 -$245, Per Trip Data Operating Expenses... $8.47 $8.94 $9.55 $8.44 $6.44 -$ Farebox Revenue Total Operating Assistance City Operating Assistance Operating Expenses Per Mile... $2.52 $2.69 $2.91 $2.65 $2.26 -$ Operating Expenses Per Hour... $27.24 $28.92 $29.89 $27.23 $ $ Source: Wisconsin Department of Transportation, City of West Bend, and SEWRPC. 29
48 Table 15 SOCIOECONOMIC CHARACTERISTICS OF WEEKDAY TRANSIT RIDERS ON THE WEST BEND TAXI SERVICE: OCTOBER 2012 Figure 8 WEST BEND TAXI SERVICE OPERATING REVENUES AND EXPENSES: Percent of Category Total Trips Age 18 and under to to to to to and over Total Sex Male Female Total Licensed Driver Yes No Total Household Income Under $10, $10,000-$19, $20,000-$29, $30,000-$39, $40,000-$49, $50,000-$74, $75,000-$99, $100,000-$199, $200,000 and over Total Trip Purpose Home-Based Work Home-Based Shopping Home-Based Other Nonhome Based School Total Vehicles available per Household No vehicle One vehicle Two or more vehicles Total Frequency of Use Less than once a month times a month times a week times a week More than 5 times a week Total Source: SEWRPC. Source: Wisconsin Department of Transportation, City of West Bend, and SEWRPC. Intercity Bus Services Two companies provided intercity bus service through Washington County in 2013; no stops are within the County. Lamers Bus Lines, Inc. Lamers operated service connecting the Cities of Milwaukee and Wausau that traveled through Washington County on U.S.H. 41. Greyhound Lines, Inc. Greyhound operated service between the Cities of Green Bay and Milwaukee that traveled through Washington County on U.S.H. 41. Taxicab Service In 2013, taxicab service in Washington County is provided 24 hours a day, seven days a week by A-Taxi, LLC. This service uses passenger sedans for service; fares are based on trip distance. Human Services Transportation Programs In addition to the transportation services for the general public summarized above, many agencies provided transportation services specifically for seniors or people with disabilities for trips that would be difficult to make on existing public transit services. The Regional Planning Commission in 30
49 2012 conducted a transportation coordination planning effort, which included a detailed inventory of all the human services transportation providers in Washington County, and identified some of the unmet needs for human services transportation and strategies to address those unmet needs. 2 The main human services transportation programs in the County are listed below; a comprehensive list can be found in Table 16: Interfaith Caregivers of Washington County Interfaith Caregivers provides a free transportation service to seniors ages 60 and over in the County using volunteers driving their own vehicles, and also has seven vehicles that are used for persons participating in their programs and services. The Threshold, Inc. The Threshold provides demand-response and fixed-route services to seniors or individuals with disabilities who participate in their programs and the programs of other agencies in the County coordinating with The Threshold. 2 See SEWRPC Memorandum Report No. 212, Public Transit Human Services Transportation Coordination Plan for Washington County: 2012, February
50 32 Table 16 HUMAN SERVICES TRANSPORTATION PROVIDERS WITHIN WASHINGTON COUNTY: 2013 Name of Service Provider Balance Inc. (262) Germantown Senior Van Service (262) Home Instead Senior Care (262) Interfaith Caregivers of Washington County (262) Lifestar (262) Medical Center Foundation of Hartford (262) St. Joseph s Hospital/Froedtert Health (262) The Threshold, Inc. (262) Transtar Medical Transport (800) Type of Provider Private, non-profit Public Private, for-profit Private, non-profit Private, for-profit Private, non-profit c Private, non-profit c Private, non-profit Private, for-profit Type of Service Service Area Eligible Users Scheduled for activities and day trips Advance reservation, curbto-curb Advanced reservation, doorthrough-door Advance reservation, doorto-door and doorthrough-door Advance reservation, doorto-door Advance reservation, doorto-door, for patients of Aurora clinics in Hartford, Slinger, and West Bend Advance reservation, door to door Fixed-route, fixedschedule, and doorto-door Advance reservation, doorto-door Ozaukee and Washington Counties From 5-mile radius of senior center, to destinations up to 20 miles away Washington, Milwaukee, and Ozaukee Counties Washington County and into Milwaukee county Washington and surrounding Counties Washington County Washington County Washington County Washington and Milwaukee Counties and long distance locations Participants in Balance Inc. programs Seniors 55 years and older Ambulatory individuals Residents of Washington County who are 60 years of age or older Seniors & disabled individuals Residents of Washington County who are seniors, disabled, or without other means of transport Residents of Washington County who are patients, volunteers, or employees of St. Joseph s Hospital Seniors or disabled persons who participate in daily program offerings at The Threshold and other agencies. Seniors & disabled individuals Days and Hours of Operation Fare Per Trip Vehicles Used As required No charge 4 accessible sedans 8 accessible vans Monday-Friday: 9:00 am to 3:00 pm Seven days a week, 24 hours a day Dependent on demand and availability of volunteer drivers Seven days a week, 24 hours a day Monday-Friday: 7:00 am to 5:00 pm Monday-Friday: 6:00 am to 10:00 pm Saturday: 6:00 am to 10:00 pm Sunday: 8:00 am to 4:00 pm Monday-Friday: 7:30 am to 4:00 pm Saturday: As needed Sunday: As needed Monday-Friday: 6:00 am to 6:00 pm Saturday: 6:00 am to 4:00 pm Sunday: As needed Distance-based. Germantown Residents: $1.00 to $3.50 Non-residents: $1.25 to $3.75 Private pay: $15/half hour No charge Private pay and Title 19 Medicaid reimbursement 1 4-passenger sedan 1 accessible minibus 1 non-accessible van 4 non-accessible vans 3 accessible vans Volunteers provide their own vehicles. 7 accessible vans 3 ambulatory vans $2.00 Vehicles and drivers provided by the Hartford City Taxi and the Washington County Shared-Ride Taxi. $2.00 Vehicles and drivers provided by Washington County Shared-Ride Taxi No charge Private pay and Title 19 Medicaid reimbursement passenger accessible buses 2 6-passenger accessible minivans 3 8-passenger accessible vans 1 10-passenger accessible minibus 1 13-passenger minibus 1 9-passenger van Volunteers also use own vehicles 32 Accessible vans Source: SEWRPC. 32
51 Chapter III PUBLIC TRANSIT SERVICE OBJECTIVES AND STANDARDS INTRODUCTION In order to thoroughly evaluate the existing transit services offered by Washington County and any alternatives proposed for the Washington County Transit System, this chapter establishes the objectives to be served by the transit system and identifies the standards that will be used to measure how successful the existing system and any proposed alternatives are at fulfilling those objectives. The objectives and standards provide the basis upon which the performance of existing transit services will be assessed, alternative service plans designed and evaluated, and service improvements recommended. Therefore, the objectives formulated under this study are intended to represent the level of transit service and performance desired by the residents of Washington County. Only if the objectives and standards clearly reflect the transit-related goals of the community will the recommended plan provide the desired level of service within the limits of available financial resources. Given the need for objectives to reflect the desired level of transit service for Washington County, the task of formulating objectives, principles, and standards must involve interested and knowledgeable public officials and private citizens representing a broad cross-section of interests in the community, as well as individuals familiar with the technical aspects of providing transit service. Accordingly, one of the important functions of the Washington County Transit Development Plan Advisory Committee was to articulate transit service objectives, principles, and supporting standards for the planning effort. By drawing upon the collective knowledge, experience, views, and values of the members of the Advisory Committee, a relevant set of transit service objectives, supporting principles, and standards was defined and is listed in Figure 9. OBJECTIVES The following objectives adopted by the Advisory Committee envision a transit system that will effectively serve Washington County while minimizing costs: 1. Washington County s public transit system should effectively serve existing travel patterns, meeting the demand and need for transit services, particularly the travel needs of the transit-dependent population; 2. Washington County s public transit system should promote efficient utilization of its services by operating a system that is safe, reliable, convenient, and comfortable for users; 33
52 3. Washington County s public transit system should be economical and cost effective, meeting all other objectives at the lowest possible cost. Given limited public funds, this objective may result in some standards listed under Objectives 1 and 2 becoming unattainable. PRINCIPLES AND STANDARDS Complementing each of the service objectives is a planning principle and a set of standards, as shown in Figure 9. The planning principle supports each objective, and the associated standards describe how service can fulfill the objective. The service design and operating standards are intended to provide guidelines for the design of new and improved services, for the operation of the transit system, and for purchasing capital equipment or constructing facilities. The performance standards provide the basis for evaluating the performance of the existing transit system and proposed alternative services. For each performance standard, one or more performance measures are identified that can be used to quantify the performance of the transit service or system for measurement against the standard. The service performance standards and the associated performance measures also reflect the recommendations of the Transit Advisory Council, which was created in March 1996 by the Wisconsin Department of Transportation. Among the charges to the Council was the identification of appropriate transit system performance measures and standards. The Council recommended that six measures be used to assess the performance of Wisconsin transit systems, including: operating ratio, or farebox recovery rate; operating expense per passenger; passengers per capita; passengers per revenue vehicle hour of service; operating expenses per revenue vehicle hour of service; and revenue vehicle hours of service per capita. All of these performance measures have been incorporated into the performance standards and measures included in Figure 9 or were used to identify peer transit systems for evaluating the Washington County Transit System. The performance standards in Figure 9 can also provide guidance to the transit system in establishing the multi-year service and performance goals that are required for systems receiving State transit operating assistance. The performance evaluation of the existing transit system utilized in this study included assessments of transit performance on both a system-wide and an individual service basis. The service standards set forth in this chapter represent a comprehensive list from which specific performance standards and measures, as deemed appropriate, were drawn in conducting the system-wide and service performance evaluations. A more complete description of the evaluation process is presented in Chapter VI. ADDITIONAL CONSIDERATIONS The objectives, principles, and standards set forth in Figure 9 are intended to guide the evaluation of the performance of the existing transit system and the design and evaluation of alternative service improvements. In the application of these objectives, principles, and standards, the limitations of public resources must be pragmatically considered in the following ways: An overall evaluation of the existing public transit services and the alternative service plans must be made based on costs and revenue. This analysis may show the attainment of one or more standards to be beyond the fiscal capability of the community, and, therefore, the standards cannot be practically met and must be either modified or eliminated. A transit system is unlikely to fully meet all the standards, and that the extent to which each standard is met, exceeded, or violated must serve as the final measure of the ability of the system to achieve the objective each standard supports. Certain intangible factors, including the perceived value of the transit service to the community and its potential acceptance by the concerned elected officials, may influence the preparation and selection of a recommended plan. Given that transit service may be perceived as a valuable service within the community, the community may decide to initiate or retain such services regardless of performance or cost. 34
53 Figure 9 PUBLIC TRANSIT SERVICE OBJECTIVES AND STANDARDS Objective No. 1 Washington County s public transit system should effectively serve existing travel patterns, meeting the demand and need for transit services, particularly the travel needs of the transit-dependent population. Associated Public Transit Principle Transit services can increase mobility for all segments of the population in urban and rural areas, particularly for persons residing in low- to middle-income households, students, seniors, and individuals with disabilities. Fixed-route public transit services are generally best suited for operating within and between large and medium-sized urban areas, serving the mobility needs of the population and the labor needs of employers. Demand-response public transit services are more cost effective than fixed-route transit services where demand for transit is low such as when serving areas with low-density urban development, small urban areas, and rural areas. Design and Operating Standards 1. Rapid fixed-route transit service Should serve major travel corridors, connecting major activity centers and concentrations of significant urban development within the County and the Region. 2. Local fixed-route transit services Should be designed to provide local transportation within and between residential areas, to link residential areas with nearby major activity centers, and to provide for transfer connections with rapid transit services. 3. Demand-responsive transit service Should be available to provide local transportation to the County s residents, particularly those that can be considered transit-dependent, to connect residential areas with each other and with major activity centers. Performance Standards and Associated Performance Measures 1. Major Activity Centers The number of major activity centers and facilities for transitdependent persons served should be maximized. This will be measured by the number of activity centers within onequarter mile of a local bus or shuttle route, one-half mile of a rapid transit route, or within the service area of a demandresponse service. Major activity centers include the following. a a. Commercial areas b. Educational institutions c. Medical centers d. Employers e. Facilities serving transitdependent populations 2. Population The population served should be maximized, particularly those who are transit dependent. Residents will be considered served if they are within the following distances of a fixedroute transit service, or are within the service area of a demandresponse service. Service Type Rapid Transit Local Shuttle Distance from Bus Stop Walking Driving 1/2 Mile 3 Miles 1/4 Mile This standard will be measured by the number of people residing within the appropriate service area for a transit service. 3. Employment The number of jobs served should be maximized. This will be measured by the total employment at businesses located within one-quarter mile of local bus or shuttle routes, onehalf mile of a rapid transit route, or within the service area of a demand-response service. 4. Density The transit-supportive land area accessible by public transit should be maximized. Land area is considered transit-supportive if it has a density of at least 4 dwelling units per net residential acre, or at least 4 jobs per gross acre. This standard will be measured by the proportion of the County s total transitsupportive land area within onequarter mile of a local bus or shuttle route, one-half mile of a rapid transit route, or within the service area of a demandresponse service. a In order to be considered a major activity center, the following definitions must apply: Commercial areas are concentrations of retail and service establishments that typically include a department store or a discount store along with a supermarket on 15 to 60 acres, totaling 150,000 or more square feet of gross leasable floor space; Educational institutions are the main campus of traditional four-year institutions of higher education and public technical colleges; Medical centers are all hospitals and clinics with 10 or more physicians; Employers are all employers with more than 100 employees, or clusters of adjacent employers with collectively more than 100 employees such as business or industrial parks; Facilities serving transit-dependent populations are senior centers, senior meal sites, residential facilities for seniors and/or people with disabilities, residential facilities for low-income individuals, and government facilities that provide significant services to members of transitdependent population groups. 35
54 Figure 9 (continued) Objective No. 2 Washington County s public transit system should promote efficient utilization of its services by operating a system that is safe, reliable, convenient, and comfortable for users. Associated Public Transit Principle The benefits to the entire public of a transit service are directly related to the level of utilization measured by ridership of that service. Ridership is influenced by the level of access the public has to services that are reliable and provide for quick, convenient, comfortable, and safe travel. Riders view transit services with these attributes as an effective and attractive alternative to the private automobile. Design and Operating Standards 1. Route Design Rapid bus routes should be extended as needed or paired with a local shuttle to perform a collection-distribution function at the ends of the route. Routes should have direct alignments with a limited number of turns, and should be arranged to minimize duplication of service and unnecessary transfers. 4. Service Frequency and Availability Fixed-route services should operate at least every 30 minutes during the weekday peak period, with local fixed-route services operating at least every 60 minutes during off-peak service hours. Shared-ride taxi services should offer a response time of 45 minutes or less in urban areas and four hours or less in rural areas. 2. Bus Stop and Park & Ride Lot Design Bus stops and park & ride lots should be clearly marked by easily recognizable signs and located so as to minimize the walking or driving distance over an accessible path to and from residential areas and major activity centers, and to facilitate connections with other transit services where appropriate. Stops should be placed every two to three blocks on local bus routes and placed at least one-mile apart on rapid transit routes. 5. Service Travel Speeds Transit services should be designed and operated so that average travel speeds on a trip are not less than 10 miles per hour for local fixed-route and demand-responsive services, and not less than 25 miles per hour for rapid fixed-route services. 3. Vehicle Age and Condition Vehicles should be rehabilitated or replaced once they reach the end of their normal service life. Federal Transit Administration guidelines require a transit vehicle to reach a minimum service life before it is replaced. These guidelines are listed below. Length Service Life Vehicle Type (feet) Years Mileage Heavy-duty bus ,000 Heavy duty bus ,000 Medium-duty bus ,000 Light-duty Bus a ,000 Cars and Vans a , Passenger Demand Transit services should provide adequate service and vehicle capacity to meet existing and anticipated demand. The average passenger load factor, measured as the ratio of passengers to seats, should not exceed 1.00 during any period for demand-responsive and rapid fixed-route transit services. Local bus routes and shuttles should not exceed an average passenger load factor of Performance Standards and Associated Performance Measures 1. Ridership and Service Effectiveness Ridership on transit services and the overall effectiveness of such services should be maximized. This will be measured using passengers per capita, total passengers per vehicle hour, total passengers per vehicle mile, and passenger miles per vehicle mile which will be compared to similar transit systems. Transit services with service effectiveness measures more than 20 percent below the median of the peer comparison group will be reviewed for potential changes to routes, runs, service areas, and service periods. 2. On-Time Performance The fixed-route service provided should closely adhere to published timetables and be on time. Demand-response services should be designed and operated to maximize adherence to scheduled rider pickup times. Performance should be regularly monitored and a transit service with less than 90 percent of trips on time (defined as being between zero minutes early and three minutes late for fixed-route services and between 15 minutes early and 15 minutes late for demand-response services) should be reviewed for changes. 3. Travel Time Travel times on transit services should be kept reasonable in comparison to travel time by automobiles for similar trips. This standard will be measured using the ratio of transit to automobile distance and the ratio of transit to automobile travel time. a This vehicle type is currently owned by the Washington County Transit System. 36
55 Figure 9 (continued) Objective No. 3 Washington County s public transit system should be economical and cost effective, meeting all other objectives at the lowest possible cost. Given limited public funds, achieving this objective may result in some standards listed under Objectives 1 and 2 becoming unattainable. Associated Public Transit Principle Given limited public funds, the cost of providing transit at a desired service level should be minimized and revenue gained from the service should be maximized to maintain the financial stability of services. Design and Operating Standards 1. Costs The total operating expenditures and capital investment for transit services should be minimized and reflect efficient utilization of resources. 2. Fare Structure The fare policies for transit services should provide for premium fares for premium services, as well as discounted fares for priority population groups and frequent transit riders. 3. Fare Increases Periodic increases in passenger fares should be considered to maintain the financial stability of transit service when: a. The farebox recovery ratio falls below the level determined to be acceptable by local officials b. Operating expenses per unit of service have increased by more than 10 percent since fares were last raised c. Projected levels of Federal and State operating assistance would require an increase in local operating assistance above the level deemed acceptable by local officials d. A fare increase would be projected to generate more revenue than would be lost due to potential decreases in ridership 4. Total Assistance The sum of capital investment and operating assistance in the transit system from all sources should be minimized, while meeting other objectives. Performance Standards and Associated Performance Measures 1. Operating Expenses The operating expense per total and revenue vehicle mile, the operating expense per total and revenue vehicle hour, and the operating assistance per passenger should be minimized. Annual increases in such costs should not exceed the median percentage increases experienced by comparable transit systems. 2. Farebox Revenue Operating revenues generated from passenger fares should be maximized. This will be measured using the percentage of operating expenses recovered through passenger fare revenue. 3. Cost Effectiveness Transit services with substandard cost effectiveness should be reviewed for potential changes to their routes, runs, service areas, and service periods. Cost effectiveness will be considered substandard when the operating cost per passenger, or operating expenses per passenger mile are more than 20 percent above, or the farebox recovery ratio is more than 20 percent below, the median for comparable transit systems. Source: SEWRPC. 37
56 (This page intentionally left blank)
57 Chapter IV EVALUATION OF THE WASHINGTON COUNTY TRANSIT SYSTEM INTRODUCTION AND SUMMARY This chapter details the performance evaluation of the existing Washington County Transit System, as part of preparations to study various alternatives to serve unmet transportation needs and improve or expand existing transit services, if warranted. This evaluation was performed using the standards identified in Chapter III of this report to determine if the objectives selected by the Advisory Committee for the Washington County Transit Development Plan are fulfilled by the existing transit system. The two services provided by the County Transit System were analyzed, with the applicable standards for each service listed under their associated objective in the sections of this chapter. A number of standards require comparing the Commuter Express service or the Shared-Ride Taxi service to peer groups. The peer groups are made up of six transit systems that provide a similar type, level, and quantity of service as each of the Washington County services. The process for selecting the systems that make up the peer groups is described in more detail later in this chapter. The remaining sections in this chapter present the findings of the performance evaluation of the Washington County Commuter Express service and the Washington County Shared-Ride Taxi service. Figure 10 and the remaining text in this section provide a brief summary of the results of the performance evaluation. Summary of the Performance Evaluation of the Washington County Commuter Express Objective No. 1: The Commuter Express service has relatively good performance under the standards associated with Objective No. 1, successfully fulfilling the Rapid Fixed-Route Transit Service Standard, and partially fulfilling the Major Activity Centers, Population, and Employment Standards by meeting the demand and need for transit services. Half of the residential facilities for transit-dependent populations in Washington County and over 40 percent of the County s residents are within three miles of a Commuter Express stop. The Commuter Express would perform better under the Major Activity Centers and Population Standards by locating additional stops near the unserved concentrations of population in the County, particularly the City of Hartford. Approximately onethird of major employers and nearly one-fourth of all jobs in Milwaukee County are accessible from the Commuter Express or a short ride on a connecting local bus service. About 40 percent of Milwaukee County s major medical facilities and four of the seven institutions of higher education are served by the Commuter Express or a connecting local bus service. Serving additional medical centers, institutions of higher education, major employers and concentrations of jobs in Milwaukee County would improve the Commuter Express s performance under the Major Activity Centers and Employment Standards. 39
58 Figure 10 SUMMARY OF THE RESULTS OF THE PERFORMANCE EVALUATION OF THE WASHINGTON COUNTY TRANSIT SYSTEM Objective Standard Commuter Express Shared-Ride Taxi Objective No. 1 Meeting the demand and need for transit services Objective No. 2 Operating safely, reliably, conveniently, comfortably, and efficiently Objective No. 3 Achieving the other objectives at the lowest possible cost Source: SEWRPC. Rapid Fixed-Route Transit Service Fulfilled Not Applicable Demand-Responsive Transit Service Not Applicable Fulfilled Major Activity Centers Partially Fulfilled Fulfilled Population Partially Fulfilled Fulfilled Employment Partially Fulfilled Fulfilled Route Design Partially Fulfilled Not Applicable Bus Stop and Park & Ride Lot Design Partially Fulfilled Not Applicable Service Frequency and Availability Partially Fulfilled Not Fulfilled Service Travel Speeds Fulfilled Fulfilled Passenger Demand Fulfilled Fulfilled Ridership and Service Effectiveness Partially Fulfilled Fulfilled On-Time Performance Fulfilled Fulfilled Travel Time Fulfilled Fulfilled Fare Structure Fulfilled Fulfilled Operating Expenses Partially Fulfilled Partially Fulfilled Cost Effectiveness Fulfilled Partially Fulfilled Objective No. 2: The Commuter Express was also relatively successful at fulfilling Objective No. 2, which encourages a system that operates safely, reliably, conveniently, comfortably, and efficiently. In order to completely fulfill the Route Design Standard, the two existing Commuter Express routes would need to be extended from their northern terminus to collect and distribute passengers in the neighborhoods of the City of West Bend. To fulfill the Bus Stop and Park and Ride Lot Design Standard, the Paradise Park and Ride lot in West Bend would need to have better directional signage to assist motorists in finding the lot. The Medical Center Route has peak service frequency less than that recommended by the Service Frequency and Availability Standard, and would need to have its service level increased to once every 30 minutes during peak periods to meet the standard. Service travel speeds on all Commuter Express routes are greater than 25 miles per hour, meeting the Service Travel Speeds Standard successfully. The Ridership and Service Effectiveness Standard requires comparison to the Commuter Express peer group of six systems, and the standard is fulfilled under two of the four performance measures used to compare the service to its peers. The Commuter Express performs particularly well on the passenger miles per vehicle mile standard, indicating that the service fills seats at a higher rate than many of its peers, but does not perform as well under the passengers per capita and passengers per revenue vehicle mile measures due to the limited number of routes operated by the service and the long journey distance for all passengers. Finally, the Commuter Express meets both the On-Time Performance and Travel Time Standards, with more than 90 percent of bus trips leaving stops on time and travel time for individuals taking the service remaining competitive with the automobile for comparable trips. 40
59 Objective No. 3: This objective recognizes that there are limited public funds available to support public transit, and encourages efficient use of financial resources when providing public transit. The Commuter Express rates well on two of the three applicable standards associated with this objective. The fare structure of the service recognizes its premium nature and provides discounts to priority riders such as seniors and people with disabilities, fulfilling the Fare Structure Standard. The Operating Expenses Standard uses five performance measures to determine if the Commuter Express is meeting this standard. Operating expenses per total vehicle mile, per total vehicle hour, and per revenue vehicle hour all grew faster than the median of the peer group between 2007 and 2011 failing the standard but the unit cost for each of these performance measures is low compared to systems in the peer group. Operating expenses per revenue vehicle mile grew at a slower rate than the median between 2007 and 2011, meeting that standard. Under the fifth measure of the Operating Expenses Standard, operating assistance per passenger, the Commuter Express performed well, as continued increases in ridership reduced the assistance level to $6.88 per passenger by In contrast to the Operating Expenses Standard, the Commuter Express successfully meets all the requirements of the Cost Effectiveness Standard, with an operating cost per passenger, operating cost per passenger mile, and a farebox recovery ratio well within the range recommended by the standard. Reductions in Emissions and Traffic Volume: Although it is not included as an objective for the transit system, the operations of the fixed-route part of the County s transit system were initially funded by Federal Congestion Mitigation and Air Quality (CMAQ) grants. Washington County continues to receive CMAQ funding for marketing and therefore an estimate of the reduction in traffic volumes and emissions due to the Commuter Express is included in this Chapter. Approximately 482 private automobile trips per day and 14,700 vehicle miles of travel per day were removed by the Commuter Express in The Commuter Express prevents 1,254 pounds of volatile organic compounds, 2,092 pounds of nitrous oxide, and 268 pounds of particulate matter 2.5 microns or less in size from entering the atmosphere each year. Summary of the Performance Evaluation of the Washington County Shared-Ride Taxi Objective No. 1: The Shared-Ride Taxi completely fulfills Objective No. 1 by meeting the demand and need for transit across all of Washington County. All major activity centers, residents, and jobs are served by the Shared- Ride Taxi service. Objective No. 2: Objective No. 2 encourages operating a system that is safe, comfortable, reliable, convenient, and efficient, and the Shared-Ride Taxi successfully fulfills this objective in all but one applicable standard. This one standard is the Service Frequency and Availability Standard, which requires that a demand-response service pick up customers within 45 minutes of being called in a urban area and within four hours of being called in a rural area. As the Shared-Ride Taxi only guarantees service if a reservation is made 24 hours ahead of the travel time, it does not meet this standard. A sample of trips from May 2012 verifies that the Shared-Ride Taxi has average trip speeds greater than 10 miles per hour, fulfilling the Service Travel Speeds Standard. This service also meets the Ridership and Service Effectiveness Standard, exceeding the requirements in passengers per capita, passengers per revenue vehicle hour, passengers per revenue vehicle mile, and passenger miles per vehicle mile when compared to its peer group. The Shared-Ride Taxi performs particularly well on the passengers per capita measure, especially considering that no peer system has additional shared-ride taxi systems operating within its service area. The Shared-Ride Taxi service meets both the On-Time Performance and Travel Time Standards, with more than 90 percent of trips leaving their pickup location on time and travel time for individuals taking the service remaining competitive with the automobile for comparable trips. Objective No. 3: The Shared-Ride Taxi is less successful in meeting the third objective, which involves using limited public funds cost effectively. The service meets the Fare Structure Standard by charging a premium fare for a premium service and providing discounted fares for transit-dependent population groups, but fails to fulfill the Operating Expenses and Cost Effectiveness Standards. None of the five performance measures under the Operating Expenses Standard is within the acceptable range for percent annual changes in operating expenses and operating assistance. Despite this result, the Shared-Ride Taxi service has the least expensive unit costs in 2011 among its peers under four of the five measures (all but operating assistance per passenger). The service meets 41
60 Table 17 SELECTED 2011 SERVICE CHARACTERISTICS FOR THE WASHINGTON COUNTY COMMUTER EXPRESS SERVICE AND ITS PEER SYSTEMS Transit System Ozaukee County Express Waukesha County Express Bus Clermont Transportation Connection Loudoun County Commuter Bus Cobb Community Transit Georgia Regional Transportation Authority Washington County Commuter Express Metropolitan Area Time Period Served Days Served Reverse Commute Service Adult Cash Fare Urbanized Area Population Operating Budget Revenue Vehicle Miles Operated Annual Passenger Trips Milwaukee Peak Weekdays Provided $3.25 1,320,000 $1,140, , ,000 Milwaukee Peak Weekdays Provided $3.25 1,320,000 $3,310, , ,000 Cincinnati Peak Weekdays Provided $3.75 1,530,000 $600, ,000 80,000 Washington, D.C. Peak Weekdays Provided $8.00 4,320,000 $8,660,000 1,570,000 1,210,000 Atlanta Peak Weekdays Provided $5.00 3,950,000 $15,730,000 3,380,000 4,373,551 Atlanta Peak Weekdays Provided $5.00 3,950,000 $17,490,000 2,380,000 1,590,000 Milwaukee Peak Weekdays Not Provided $3.75 1,320,000 $1,250, , ,000 Source: National Transit Database and SEWRPC. the standard for two performance measures under the Cost Effectiveness Standard operating cost per passenger and operating cost per passenger mile but does not meet the standard for farebox recovery. The low farebox recovery ratio, combined with the rapid growth in operating assistance per passenger under the Operating Expenses Standard, indicates that the County may want to consider raising the fare for the Shared-Ride Taxi to improve performance under both measures. PEER SYSTEMS As part of the evaluation of the Washington County Transit System s services, a number of standards require comparing the performance of the two County transit services to the performance of a peer group of transit systems. In order to make this comparison, six peer transit systems were identified for each County transit service. These peer systems were selected based on their service type and characteristics, annual ridership, urban area population, total vehicle miles operated annually, total annual operating budget, and proximity to Washington County. Peer systems for the County s Shared-Ride Taxi service were also selected based on the size of their respective service areas and the number of residents within their service areas. In addition, systems were eliminated from the peer group for both County services if they served a state capital or had a high percentage of college students in their urban areas. The six peer systems identified for each of the County s transit services most closely matched the characteristics of each service according to data gathered from the National Transit Database (NTD) for Washington County Commuter Express Peer Group Selecting similar peer systems for the Washington County Commuter Express service was complicated by the service type and characteristics of the Commuter Express service. Prior to 2011, local and commuter bus services were categorized as motor bus services by the NTD. Without the ability to differentiate between the service data for commuter and local bus services provided by larger regional transit authorities, only other agencies that provided only or mostly rapid commuter bus service could be used as peers. Table 17 lists the service characteristics of the systems selected for the Commuter Express peer group, all of which offer services that are generally similar to the Commuter Express. One important difference between the Commuter Express and the 42
61 Table 18 SELECTED 2011 SERVICE CHARACTERISTICS FOR THE WASHINGTON COUNTY SHARED-RIDE TAXI SERVICE AND ITS PEER SYSTEMS Transit System Ozaukee County Shared- Ride Taxi Miami County Public Transit Butler County Regional Transit Authority Greene County Area Transit Service Clermont Transportation Connection Fort Bend County Public Transit Washington County Shared-Ride Taxi Metropolitan Area Service Type Weekday Service Hours Service Days Adult Cash Fare Milwaukee Dayton Cincinnati Dayton Cincinnati Houston Milwaukee Advanced Reservation Advanced Reservation Advanced Reservation Advanced Reservation Advanced Reservation Advanced Reservation Advanced Reservation 6:00 AM - 9:00 PM 5:00 AM - 6:00 PM 7 Days a Week Weekdays and Saturday $ $6.75 $4.00 6:00 AM - 11:00 PM Weekdays $ $ :00 AM - 9:00 PM 6:00 AM - 6:00 PM 8:00 AM - 5:00 PM 5:00 AM - 10:00 PM 7 Days a Week Weekdays and Saturday 7 Days a Week 7 Days a Week $ $6.00 $4.75 $1.00 $ $9.00 Transit System Ozaukee County Shared- Ride Taxi Miami County Public Transit Butler County Regional Transit Authority Greene County Area Transit Service Clermont Transportation Connection Fort Bend County Public Transit Washington County Shared-Ride Taxi Urbanized Area Population Operating Budget Vehicle Miles Operated Service Area in Square Miles Population in Service Area Annual Passenger Trips 1,320,000 $1,520, , ,000 80, ,000 $970, , ,000 44,000 1,530,000 $1,860, , ,000 53, ,000 $2,740, , , ,000 1,530,000 $1,180, , ,000 36,000 4,400,000 $2,760, , , ,000 1,320,000 $2,140,000 1,170, ,000 99,000 Source: National Transit Database and SEWRPC. peer group is that the entire peer group provides both traditional and reverse commute peak services, whereas the Commuter Express provides only traditional commute service. Additionally, some peers are much larger than the Washington County Commuter Express, some have significantly higher passenger fares, and two Clermont Transportation Connection near Cincinnati, Ohio, and Cobb Community Transit near Atlanta, Georgia provide a small amount of local bus service in addition to their rapid commuter services. Washington County Shared-Ride Taxi Peer Group The six peer systems selected for the Washington County Shared-Ride Taxi are shown in Table 18. These systems have the most similar service characteristics of the systems with five or more years of data available from the NTD. The persons per square mile within each peer s service area is relatively similar to the County s Shared-Ride Taxi service, but no peer system has other shared-ride taxi services operating within its service area. Similar to the peer group for the Commuter Express, fares vary between the peer systems. 43
62 Figure 11 OBJECTIVE NO. 1 AND ASSOCIATED STANDARDS APPLICABLE TO THE EVALUATION OF THE WASHINGTON COUNTY COMMUTER EXPRESS Objective No. 1 Washington County s public transit system should effectively serve existing travel patterns, meeting the demand and need for transit services, particularly the travel needs of the transit-dependent population. Applicable Design and Operating Standards 1. Rapid Fixed-Route Transit Service Rapid fixed-route transit service should serve major travel corridors, connecting major activity centers and concentrations of significant urban development within the County and the Region. 1. Major Activity Centers The number of major activity centers and facilities for transit-dependent persons served should be maximized. This will be measured by the number of activity centers within one-quarter mile of a local bus or shuttle route and one-half mile of a rapid transit route. Major activity centers include the following a : a. Commercial areas b. Educational institutions c. Medical centers d. Employers e. Facilities serving transit-dependent populations Applicable Performance Standards and Associated Performance Measures 2. Population The population served should be maximized, particularly those who are transit dependent. Residents will be considered served if they are within the following distances of a fixedroute transit service. Service Type Rapid Transit Local Shuttle Distance from Bus Stop Walking Driving 1/2 Mile 3 Miles 1/4 Mile - - This standard will be measured by the number of people residing within the appropriate service area for a transit service. 3. Employment The number of jobs served should be maximized. This will be measured by the total employment at businesses located within one-quarter mile of local bus or shuttle routes or one-half mile of a rapid transit route. a In order to be considered a major activity center, the following definitions must apply: Commercial areas are concentrations of retail and service establishments that typically include a department store or a discount store along with a supermarket on 15 to 60 acres, totaling 150,000 or more square feet of gross leasable floor space; Educational institutions are the main campus of traditional four-year institutions of higher education and public technical colleges; Medical centers are all hospitals and clinics with 10 or more physicians; Employers are all employers with more than 100 employees, or clusters of adjacent employers with collectively more than 100 employees such as business or industrial parks; Facilities serving transit-dependent populations are senior centers, senior meal sites, residential facilities for seniors and/or people with disabilities, residential facilities for low-income individuals, and government facilities that provide significant services to members of transitdependent population groups. Source: SEWRPC. PERFORMANCE EVALUATION OF THE WASHINGTON COUNTY COMMUTER EXPRESS Evaluating the performance of the Commuter Express service requires identifying which standards from Figure 9 need to be examined to determine if the service is meeting the public transit service objectives established in Chapter III of this report. The three objectives in Figure 9 seek to provide a service that meets the demand and need for transit service between Washington County and other areas of the Region; operates safely, reliably, conveniently, comfortably, and efficiently; and utilizes public resources cost effectively. Objective 1: Meeting the Need and Demand for Service In order to determine if the Commuter Express effectively serves existing travel patterns, meeting the demand and need for transit services between Washington County and other areas of the Region, each applicable standard and associated performance measure was individually evaluated. These individual evaluations were collectively considered to determine how effectively the current service meets the overall objective. Figure 11 contains the full text of Objective 1, the applicable design and performance standards, and associated performance measures used to evaluate the Commuter Express service s fulfillment of the objective. 44
63 Rapid Fixed-Route Transit Service Design and Operating Standard The Commuter Express service successfully fulfills the Rapid Fixed-Route Transit Service Design and Operating Standard, as it serves a major travel corridor and connects major activity centers and concentrations of significant urban development within the Region. Major Activity Centers Performance Standard The Major Activity Centers Performance Standard encourages maximizing the number of major activity centers used by transit-dependent persons within the service area of the transit service. Determining how many major activity centers are served by the Commuter Express requires looking at different types of activity centers in both Washington County and Milwaukee County. Because the Commuter Express only provides first-shift, traditional commute service, it makes sense to consider only residential facilities for transit-dependent populations in Washington County, and the other types of major activity centers in Milwaukee County. Map 7 displays the location of the residential facilities for transit-dependent populations in Washington County, while Table 19 quantifies the number and percentage of these facilities within a three-, five-, and seven-mile drive or taxi ride of a park and ride lot served by the Commuter Express. Table 19 indicates that half of the residential facilities for transit-dependent populations are within three miles of a Commuter Express stop. Map 7 indicates that an additional route with stops in the City of Hartford and the Village of Slinger would result in all but six of these residential facilities being within the service area identified by the standard. Map 8 shows the locations of job resource centers, major employers, major medical centers, major institutions of higher education, and major commercial areas in Milwaukee County, and also outlines the areas within one-half mile of a Commuter Express stop and one-quarter mile of a 15-minute ride on a connecting local bus service provided by the Milwaukee County Transit System. Table 20 displays the quantity and percentage of these major activity centers within the service area of the Commuter Express and connecting local bus services. As data shown in Table 3 in Chapter II of this report demonstrate, the vast majority of trips served by the Commuter Express are for work purposes, and Table 20 shows that more than one-third of major employers in Milwaukee County are served by the Commuter Express and local connecting bus service. New routes or route extensions could increase this coverage. Additionally, Table 3 indicates that a number of trips on the Commuter Express are for school purposes, suggesting that an extension of the Downtown Route to serve the University of Wisconsin- Milwaukee campus may be worth considering. Forty percent of Milwaukee County s major medical facilities are accessible from the Commuter Express or a connecting local bus route, while shopping accessibility is quite limited, with only 11 percent of major commercial areas accessible by transit. Population Performance Standard The Population Performance Standard recommends maximizing the number of residents with access to transit. In the case of the Commuter Express, this is measured using the number of people within a three-mile driving access distance to the park and ride lots served. Recognizing that an individual may choose to drive farther than three miles to reach the park and ride lot, five-mile and seven-mile access distances are also measured. Map 9 displays the residential population density by quarter-section in Washington County, with three-, five-, and seven-mile access distances from each park and ride lot served by the Commuter Express included. As of the 2010 U.S. Census, approximately 54,800 residents (42 percent of all County residents) live within a three-mile drive or taxi ride of a park and ride lot served by the Commuter Express, 84,100 residents (64 percent of all County residents) live within a five-mile drive or taxi ride of a park and ride lot served by the Commuter Express, and 99,300 residents (75 percent of all County residents) live within a seven-mile drive or taxi ride of a park and ride lot served by the Commuter Express. An additional route serving the City of Hartford would result in the majority of the remaining 25 percent of County residents receiving easy access to a rapid fixed-route transit service. Employment Performance Standard The total employment within walking distance of a Commuter Express stop or a 15-minute ride on a connecting local bus service was measured to determine how well the Commuter Express fulfills the Employment Performance Standard. Map 10 displays the employment density by quarter-section in Milwaukee County, with transit service walk access distances included. Many of the highest employment density areas are served by the Commuter Express or a connecting local service, with approximately 293,400 jobs (23 percent of all Milwaukee County jobs in 2000) accessible. 45

64 Map 7 Source: SEWRPC. 46
65 Objective 2: Operating Safely, Reliably, Conveniently, Comfortably, and Efficiently Figure 12 describes the applicable standards used to determine whether the Commuter Express is providing service that is safe, reliable, convenient, and comfortable for users in order to promote the efficient utilization of transit services. Table 19 RESIDENTIAL FACILITIES FOR TRANSIT-DEPENDENT POPULATIONS SERVED BY THE COMMUTER EXPRESS Distance from Park & Ride Lot Served by Commuter Express Number of Residential Facilities Served Percentage of County Residential Facilities Served Route Design and Operating Standard Although both routes of the Commuter Express service have direct alignments with a limited number of turns, and minimize unnecessary transfers, there is a lack of a collector-distributor function at the end of the route in the City of West 3 Miles or Less... 5 Miles or Less... 7 Miles or Less... Source: SEWRPC Bend. Extending both routes north of the Paradise Park and Ride lot to provide direct service to denser West Bend neighborhoods would result in this standard being fulfilled. Bus Stop and Park and Ride Lot Design and Operating Standard The park and ride lots and bus stops served by the Commuter Express are appropriately spaced and located, with accessible driving and walking paths to each, distances of more than one mile between each park and ride, and bus stops placed at least every two blocks, on average. Although the bus stops and two of the three park and ride lots are well marked with clear signage, the Paradise Park and Ride lot in the City of West Bend is difficult to find due to poor directional signage along Paradise Drive. The County should coordinate with the Wisconsin Department of Transportation to improve this situation and also provide signage for the overflow lot across the street at Paradise Theatres. Service Frequency and Availability Design and Operating Standard Fulfilling the Service Frequency and Availability Standard requires that service be provided every 30 minutes during weekday peak periods. The Downtown Route meets this standard; the Medical Center Route provides service only about once every hour. Service Travel Speeds Design and Operating Standard The Service Travel Speeds Standard requires that rapid fixed-route transit services achieve average travel speeds of at least 25 miles per hour for the duration of the route. The slowest Commuter Express trip is scheduled for an average travel speed of 27 miles per hour, indicating that all scheduled trips exceed the standard. Passenger Demand Design and Operating Standard Due to the high speeds at which rapid fixed-route bus services travel, the ratio of passengers to seats on the services should not exceed This passenger load factor is never exceeded by the Commuter Express, fulfilling the Passenger Demand Standard. Ridership and Service Effectiveness Performance Standard The Ridership and Service Effectiveness Standard uses four performance measures (passengers per capita, passengers per revenue vehicle hour, passengers per revenue vehicle mile, and passenger miles per revenue vehicle mile) to compare the service effectiveness of the Commuter Express service to six peer transit systems from around the Nation. If the service effectiveness measures are more than 20 percent below the median of the peer comparison group, this standard encourages consideration of modifications to routes, runs, service areas, or service periods. Figure 13 shows the results of this comparison of the Commuter Express to its peers by displaying the range of the peer group s performance, the median of the peer group s performance, the range of performance that meets the standard, and the performance of the Commuter Express for each measure. The data for each peer system are presented in Table
66 Map 8 48 Source: SEWRPC.
67 Table 20 MAJOR ACTIVITY CENTERS IN MILWAUKEE COUNTY SERVED BY THE WASHINGTON COUNTY COMMUTER EXPRESS Major Activity Center Type Accessible by Walking Accessible by Walking or Connecting to Local Transit Service Number Percent Number Percent Job Resource Centers Major Employers Major Hospitals, Medical Center, or Clinics Major Institutions of Higher Education Major Commercial Areas Source: SEWRPC. Figure 13 indicates that the Commuter Express is slightly out of the acceptable range for two of the four performance measures. Passengers per capita is largely dependent on how well a system covers its service area, and with only two routes, the Commuter Express does not serve as many origin-destination pairs as many of its peer systems, leading to a relatively poor passengers per capita performance. Compared to systems in the peer group, the majority of Commuter Express passengers are traveling much longer distances per trip, which reduces the service s passengers per revenue vehicle hour and passengers per revenue vehicle mile. Because of this characteristic, the service is only slightly above the standard (within range) for the passengers per revenue vehicle hour performance measure and is only slightly below the standard (outside range) for the passengers per revenue vehicle mile performance measure. In contrast to the other three performance measures that are associated with the Ridership and Service Effectiveness Standard, the Commuter Express significantly exceeds the median of the peer group in passenger miles per vehicle mile. This performance measure essentially serves as a proxy for the average number of seats filled on a vehicle over the course of its revenue trip, and Table 21 shows that the Commuter Express outperforms all but two of its peers in this measure. Because of this strong performance in passenger miles per revenue vehicle mile, and despite being on the lower end of the peer group for three out of the four measures, the Commuter Express performs reasonably well on this standard, given its limited routes and long travel distances. On-Time Performance Standard The On-Time Performance Standard states that 90 percent of trips on a fixed-route service should be within zero minutes early and three minutes late. Data for the Commuter Express from April and May of 2013 were used to develop Table 22, which shows that the service is meeting the standard overall. However, the Medical Center Route does not meet the standard, which may be due to the ongoing construction around the Zoo Interchange. This would indicate that the on-time performance of this route should be monitored and schedule adjustments considered if vehicles are unable to meet the printed schedule. Travel Time Performance Standard The Travel Time Performance Standard encourages that travel times by transit be kept reasonable in comparison to travel times by automobiles for similar trips. Table 23 compares congested in-vehicle automobile travel times to typical in-vehicle Commuter Express travel times, and shows that the ratio between transit travel times and automobile travel times does not exceed This result indicates that the difference in travel time between private automobile travel and travel on the Commuter Express is reasonable. 49

68 Map 9 Source: SEWRPC. 50

69 Map 10 Source: SEWRPC. 51
70 Figure 12 OBJECTIVE NO. 2 AND ASSOCIATED STANDARDS APPLICABLE TO THE EVALUATION OF THE WASHINGTON COUNTY COMMUTER EXPRESS Objective No. 2 Washington County s public transit system should promote efficient utilization of its services by operating a system that is safe, reliable, convenient, and comfortable for users. Applicable Design and Operating Standards 1. Route Design Rapid bus routes should be extended as needed or paired with a local shuttle to perform a collection-distribution function at the ends of the route. Routes should have direct alignments with a limited number of turns, and should be arranged to minimize duplication of service and unnecessary transfers. 2. Bus Stop and Park & Ride Lot Design Bus stops and park & ride lots should be clearly marked by easily recognizable signs and located so as to minimize the walking or driving distance over an accessible path to and from residential areas and major activity centers, and to facilitate connections with other transit services where appropriate. Stops should be placed every two to three blocks on local bus routes and placed at least one-mile apart on rapid transit routes. 4. Service Frequency and Availability Fixed-route services should operate at least every 30 minutes during the weekday peak period. 5. Service Travel Speeds Transit services should be designed and operated so that average travel speeds on a trip are not less than 25 miles per hour for rapid fixed-route services. 6. Passenger Demand Transit services should provide adequate service and vehicle capacity to meet existing and anticipated demand. The average passenger load factor, measured as the ratio of passengers to seats, should not exceed 1.00 during any period for rapid fixed-route transit services. Applicable Performance Standards and Associated Performance Measures 1. Ridership and Service Effectiveness Ridership on transit services and the overall effectiveness of such services should be maximized. This will be measured using passengers per capita, total passengers per vehicle hour, total passengers per vehicle mile, and passenger miles per vehicle mile which will be compared to similar transit systems. Transit services with service effectiveness measures more than 20 percent below the median of the peer comparison group will be reviewed for potential changes to their routes, runs, service areas, and service periods. 2. On-Time Performance The fixed-route service provided should closely adhere to published timetables and be on time. Performance should be regularly monitored and a transit service with less than 90 percent of trips on time (defined as being between zero minutes early and three minutes late for fixed-route services) should be reviewed for changes. 3. Travel Time Travel times on transit services should be kept reasonable in comparison to travel time by automobiles for similar trips. This standard will be measured using the ratio of transit to automobile travel time. Source: SEWRPC. Objective 3: Utilizing Public Resources Cost Effectively Objective 3 recognizes that public funds are limited, and must be used efficiently. In order to determine whether public funds are being well-spent, the following analyses compare the Commuter Express to its peer group using a number of performance measures. The applicable standards and performance measures used to measure how efficiently the Commuter Express is using public funds are shown in Figure 14. Fare Structure Design and Operating Standard The Fare Structure Standard recommends premium fares for premium services and discounts for priority users, such as seniors or people with disabilities. The Commuter Express fulfills this standard, with $3.75 base standard adult fare higher than that of a typical local bus service in the Region and a discounted fare for seniors and people with disabilities. The service also offers packets of 10 discounted fare tickets for $32.50 to reduce the cost of travel for frequent passengers. 52

71 Figure 13 RIDERSHIP AND SERVICE EFFECTIVENESS STANDARD: COMPARISON OF WASHINGTON COUNTY COMMUTER EXPRESS TO PEER GROUP FOR ASSOCIATED PERFORMANCE MEASURES Passengers per Capita Passengers per Vehicle Hour Passengers per Vehicle Mile Passenger Miles per Vehicle Mile Source: National Transit Database and SEWRPC. Operating Expenses Performance Standard By comparing the annual percentage increase between 2007 and 2011 in operating expenses per total vehicle mile, operating expenses per revenue vehicle mile, operating expenses per total vehicle hour, operating expenses per revenue vehicle hour, and operating assistance per passenger, the Operating Expenses Performance Standard ensures that the inflationary growth in operating costs is comparable to that of peer systems. In order to fulfill the standard, none of the annual percentage increases in the five performance measures should exceed the median percentage increases experienced by the peer group. Figure 15 displays a comparison of the annual percentage change for each metric for 2007 to 2011 between the range of the peer group s performance, the range of performance that meets the standard, the median of the peer group s performance, and the performance of the Commuter Express. Table 24 provides the detailed data used to develop Figure 15. For the four measures that examine operating expenses per unit of service, the performance of the Commuter Express is mixed. The average annual percentage change in operating expenses per revenue vehicle mile meets the corresponding standard, with the growth rate of the Commuter Express less than the median of the peer group for that performance measure. For three of the remaining four performance measures operating expenses per revenue vehicle hour, operating expenses per total vehicle mile, and operating expenses per total vehicle hour costs for the Commuter Express have increased faster than the median of the peer group, and therefore the standard is not met. However, the actual unit costs in 2011 (shown in Table 24) for these three performance measures are lower than four or five of the systems in the peer group, depending on the measure. The growth in unit costs mostly occurred between 2007 and 2008, as the County entered into a new contract for the operation of the service at the beginning of
72 54 Table 21 WASHINGTON COUNTY COMMUTER EXPRESS PEER GROUP DATA FOR THE RIDERSHIP AND SERVICE EFFECTIVENESS PERFORMANCE STANDARD Performance Measures Passengers per Capita Passengers per Revenue Vehicle Hour Passengers per Revenue Vehicle Mile Passenger Miles per Revenue Vehicle Mile Ozaukee County Express Waukesha County Express Bus Clermont Transportation Connection Milwaukee, WI Milwaukee, WI Cincinnati, OH Loudoun County Commuter Bus Cobb Community Transit Georgia Regional Transportation Authority Washington County Commuter Express Washington, D.C. Atlanta, GA Atlanta, GA Milwaukee, WI Average Annual Change -0.21% % % 13.34% -1.34% 7.66% 8.36% Average Annual Change 4.67% % 42.93% 1.88% -3.97% 2.58% 14.46% Average Annual Change 5.34% % 49.21% 0.02% -3.01% -7.94% 6.27% Average Annual Change Source: National Transit Database and SEWRPC. 3.35% -2.95% 21.66% -0.83% -5.46% -0.48% 6.72% 54
73 Table 22 ON-TIME PERFORMANCE OF THE WASHINGTON COUNTY COMMUTER EXPRESS: APRIL MAY 2013 Direction and Route Late Runs Early Runs Total Runs Percent of Runs On-Time Inbound to Downtown Outbound from Downtown Inbound to Medical Center Outbound from Medical Center Total , Source: GoRiteway, Inc. and SEWRPC. Table 23 TRAVEL TIME COMPARISON BETWEEN THE WASHINGTON COUNTY COMMUTER EXPRESS AND AUTOMOBILES Travel Time (minutes) Ratio Commuter Difference (transit to Trip Origin Trip Destination Express Automobile (minutes) automobile) Paradise Park & Ride Richfield Park & Ride Northwestern Mutual Downtown Campus Lannon Road Park & Ride Paradise Park & Ride Richfield Park & Ride Milwaukee Regional Medical Center Lannon Road Park & Ride Source: GoRiteway, Inc. and SEWRPC. Figure 14 OBJECTIVE NO. 3 AND ASSOCIATED STANDARDS APPLICABLE TO THE EVALUATION OF THE WASHINGTON COUNTY COMMUTER EXPRESS Objective No. 3 Washington County s public transit system should be economical and cost effective, meeting all other objectives at the lowest possible cost. Given limited public funds, achieving this objective may result in some standards listed under Objectives 1 and 2 becoming unattainable. Applicable Design and Operating Standards 2. Fare Structure The fare policies for transit services should provide for premium fares for premium services, as well as discounted fares for priority population groups and frequent transit riders. Applicable Performance Standards and Associated Performance Measures 1. Operating Expenses The operating expense per total and revenue vehicle mile, the operating expense per total and revenue vehicle hour, and the operating assistance per passenger should be minimized. Annual increases in such costs should not exceed the median percentage increases experienced by comparable transit systems. 3. Cost Effectiveness Transit services with substandard cost effectiveness should be reviewed for potential changes to their routes, runs, service areas, and service periods. Cost effectiveness will be considered substandard when the operating cost per passenger, or operating expense per passenger mile are more than 20 percent above, or the farebox recovery ratio is more than 20 percent below, the median for comparable transit systems. Source: SEWRPC. 55

74 Figure 15 OPERATING EXPENSES STANDARD: COMPARISON OF WASHINGTON COUNTY COMMUTER EXPRESS TO PEER GROUP FOR ASSOCIATED PERFORMANCE MEASURES Annual Percent Change in Operating Expenses per Revenue Vehicle Mile Annual Percent Change in Operating Expenses per Revenue Vehicle Hour Annual Percent Change in Operating Expenses per Total Vehicle Mile Annual Percent Change in Operating Expenses per Total Vehicle Hour Annual Percent Change in Operating Assistance per Passenger Source: National Transit Database and SEWRPC. The Commuter Express performed quite well in the annual percentage change in operating assistance per passenger performance measure, as the continued growth in ridership reduced the assistance level to $6.88 per passenger by 2011 despite increasing costs over the five-year period. Other than Clermont Transportation Connection, which initiated service in 2007, the Commuter Express service had a larger decline in operating assistance per passenger than any system in the peer group. Cost Effectiveness Performance Standard The Cost Effectiveness Standard recommends that the operating cost per passenger and operating cost per passenger mile should be no greater than 20 percent above the median of the peer group, and that the farebox recovery ratio should not be more than 20 percent below the median of the peer group. If a transit service is substandard under any of these performance measures, it may indicate that changes to routes, runs, service areas, and service periods need to be considered. Figure 16 shows the range of the peer group s performance, the median of the peer group s performance, the range of performance that meets the standard, and the performance of the Commuter Express for these performance measures. Table 25 provides the detailed data used to develop Figure
75 Table 24 WASHINGTON COUNTY COMMUTER EXPRESS PEER GROUP DATA FOR THE OPERATING EXPENSES PERFORMANCE STANDARD Performance Measures Operating Expenses per Revenue Vehicle Mile Operating Expenses per Revenue Vehicle Hour Operating Expenses per Total Vehicle Mile Operating Expenses per Total Vehicle Hour Operating Assistance per Passenger Ozaukee County Express Waukesha County Express Bus Clermont Transportation Connection Milwaukee, WI Milwaukee, WI Cincinnati, OH Loudoun County Commuter Bus Cobb Community Transit Georgia Regional Transportation Authority Washington County Commuter Express Washington, D.C. Atlanta, GA Atlanta, GA Milwaukee, WI 2007 $5.31 $6.05 $1.84 $4.53 $4.23 $7.07 $ $6.37 $6.15 $4.10 $5.50 $4.65 $7.34 $4.89 Average Annual Change 5.03% 0.51% 36.22% 5.20% 2.83% 1.30% 2.57% 2007 $ $ $60.19 $ $85.48 $ $ $ $ $ $ $90.42 $ $ Average Annual Change 4.39% 4.34% 29.47% 7.01% 1.68% 15.18% 9.71% 2007 $3.78 $4.53 $1.51 $2.39 $3.68 $4.10 $ $4.07 $4.55 $2.23 $3.07 $4.26 $4.32 $2.55 Average Annual Change 2.05% 0.34% 15.09% 6.70% 3.86% 1.60% 3.48% 2007 $ $98.01 $49.31 $83.07 $77.30 $79.03 $ $ $ $61.07 $87.11 $86.13 $ $78.52 Average Annual Change 2.05% 3.79% 10.94% 1.37% 2.92% 13.73% 4.83% 2007 $8.27 $4.97 $8.65 $1.32 $2.10 $5.35 $ $7.73 $10.73 $5.36 $1.46 $2.26 $7.10 $6.88 Average Annual Change Source: National Transit Database and SEWRPC % 21.83% % 8.85% 3.08% 10.58% -3.08% 57 57
76 58 Table 25 WASHINGTON COUNTY COMMUTER EXPRESS PEER GROUP DATA FOR THE COST EFFECTIVENESS PERFORMANCE STANDARD Performance Measures Operating Costs per Passenger Operating Costs per Passenger Mile Farebox Recovery Ratio Ozaukee County Express Waukesha County Express Bus Clermont Transportation Connection Milwaukee, WI Milwaukee, WI Cincinnati, OH Loudoun County Commuter Bus Cobb Community Transit Georgia Regional Transportation Authority Washington County Commuter Express Washington, D.C. Atlanta, GA Atlanta, GA Milwaukee, WI 2007 $10.21 $6.65 $10.06 $5.88 $2.88 $7.37 $ $10.02 $13.78 $7.55 $7.15 $3.60 $11.00 $9.76 Average Annual Change 0.11% 20.56% -9.07% 5.08% 6.29% 12.38% -2.77% 2007 $0.46 $0.55 $0.46 $0.18 $0.34 $0.42 $ $0.49 $0.65 $0.57 $0.22 $0.47 $0.45 $0.32 Average Annual Change 2.71% 4.69% 11.40% 6.00% 8.90% 2.70% -3.40% % 25.24% 14.03% 77.50% 26.95% 27.43% 27.17% % 22.15% 28.98% 79.61% 37.28% 35.44% 29.49% Average Annual Change Source: National Transit Database and SEWRPC. 5.64% -3.03% 29.43% 0.90% 9.66% 7.94% 2.71% 58

77 Figure 16 COST EFFECTIVENESS STANDARD: COMPARISON OF WASHINGTON COUNTY COMMUTER EXPRESS TO PEER GROUP FOR ASSOCIATED PERFORMANCE MEASURES Operating Cost per Passenger Operating Cost per Passenger Mile Farebox Recovery Ratio Source: National Transit Database and SEWRPC. The Commuter Express successfully fulfills this standard, exceeding the requirements for all three performance measures. At $9.76, the operating cost per passenger for the Commuter Express is greater than the median of the peer group, but lower than both of the regional peers (Ozaukee County Express and Waukesha County Express Bus). Additionally, operating cost per passenger declined between 2007 and 2011, as ridership increased on the Commuter Express. Similarly, operating cost per passenger mile also declined over the same time period, and is lower than all but one of the peer systems. The Commuter Express has a farebox recovery ratio of 29.5 percent, which is high compared to its regional peers. Although lower than some of the systems in the peer group, it also improved between 2007 and It is important to note that the exceptionally high farebox recovery ratio experienced by the Loudoun County Commuter Bus service can be attributed to its high ticket price and use of High Occupancy Vehicle (HOV) lanes. Despite a lower farebox recovery ratio than some peers, the Commuter Express meets the standard for this performance measure. Analysis of Reductions in Traffic Volume and Emissions In addition to the evaluations of the Commuter Express required by the objectives listed in Chapter III, Committee members requested an evaluation of the effects of the Commuter Express on transportation emissions produced and the traffic volume generated in Southeastern Wisconsin. The operations of the fixed-route services 59
78 of the County transit system were originally funded by a Federal Congestion Mitigation and Air Quality (CMAQ) grant, which are intended to fund programs that reduce congestion and improve air quality. In addition, the County has continued to receive a small CMAQ grant to fund marketing efforts that encourage members of the public to ride the Commuter Express. Traffic Volume Assuming that, if the Commuter Express service was unavailable, current passengers would make the same journey in private automobiles, and that they would carpool at the same rate as the rest of the Region s travelers, approximately 482 private automobile trips per day were removed by the 26 runs of the Commuter Express in Based on the average travel distance of passengers, approximately 14,700 vehicle miles of travel per day, or 3.7 million miles per year, were removed from the Region s arterial street and highway network in 2012 by the Commuter Express. Emissions Three criteria pollutants and precursors to ozone are used as part of the evaluation of projects competing for CMAQ funding, and the reduction in those three types of emissions are used here to determine the effectiveness of the Commuter Express at reducing emissions in the Region. By eliminating 482 private automobile trips per day, and reducing the Region s total vehicle miles of travel by private automobiles by 14,700 per year, the Commuter Express prevents 1,254 pounds of volatile organic compounds, 2,092 pounds of nitrous oxide, and 268 pounds of particulate matter 2.5 microns or less in size from entering the atmosphere each year. PERFORMANCE EVALUATION OF THE WASHINGTON COUNTY SHARED-RIDE TAXI In order to evaluate the performance of the County s Shared-Ride Taxi service, the applicable standards from each of the public transit service objectives established in Chapter III of this report need to be identified from those listed in Figure 9. Those three objectives seek to provide a service that meets the demand and need for transit service between Washington County and other areas of the Region; operates safely, reliably, conveniently, comfortably, and efficiently; and utilizes public resources cost effectively. This evaluation uses the applicable standards to determine how well the Shared-Ride Taxi fulfills each objective. Objective 1: Meeting the Need and Demand for Service Determining if the Shared-Ride Taxi effectively serves existing travel patterns, meeting the demand and need for transit services within Washington County, requires each applicable standard and associated performance measure(s) to be individually evaluated. These individual evaluations were collectively considered to determine how effectively the current service meets the overall objective. Figure 17 contains the full text of Objective 1, the applicable design and performance standards, and the associated performance measures used to evaluate the Shared-Ride Taxi service. Demand-Responsive Transit Service Design and Operating Standard The Shared-Ride Taxi service successfully fulfills the Demand-Responsive Transit Service Standard, as it provides local transportation to all County residents, connecting residential areas with each other and with major activity centers. Major Activity Centers Performance Standard The Major Activity Centers Performance Standard encourages maximizing the number of major activity centers used by transit-dependent populations within the service area of the transit service. The Shared-Ride Taxi service fulfills this standard by serving all major activity centers in Washington County, and providing a connection to the Commuter Express for transit-dependent individuals. Population Performance Standard The Population Performance Standard recommends maximizing the number of residents with access to transit. The Shared-Ride Taxi fulfills this standard, serving all Washington County residents. 60
79 Figure 17 OBJECTIVE NO. 1 AND ASSOCIATED STANDARDS APPLICABLE TO THE EVALUATION OF THE WASHINGTON COUNTY SHARED-RIDE TAXI Objective No. 1 Washington County s public transit system should effectively serve existing travel patterns, meeting the demand and need for transit services, particularly the travel needs of the transit-dependent population. Applicable Design and Operating Standards 3. Demand-responsive transit service Should be available to provide local transportation to the County s residents, particularly those that can be considered transit-dependent, to connect residential areas with each other and with major activity centers. Applicable Performance Standards and Associated Performance Measures 1. Major Activity Centers The number of major activity centers and facilities for transit-dependent persons served should be maximized. This will be measured by the number of activity centers within the service area of a demandresponse service. Major activity centers include the following a : a. Commercial areas b. Educational institutions c. Medical centers d. Employers e. Facilities serving transit-dependent populations 2. Population The population served should be maximized, particularly those who are transit dependent. Residents will be considered served if they are within the service area of a demandresponse service. This standard will be measured by the number of people residing within the appropriate service area for a transit service. 3. Employment The number of jobs served should be maximized. This will be measured by the total employment at businesses located within the service area of a demand-response service. a In order to be considered a major activity center, the following definitions must apply: Commercial areas are concentrations of retail and service establishments that typically include a department store or a discount store along with a supermarket on 15 to 60 acres, totaling 150,000 or more square feet of gross leasable floor space; Educational institutions are the main campus of traditional four-year institutions of higher education and public technical colleges; Medical centers are all hospitals and clinics with 10 or more physicians; Employers are all employers with more than 100 employees, or clusters of adjacent employers with collectively more than 100 employees such as business or industrial parks; Facilities serving transit-dependent populations are senior centers, senior meal sites, residential facilities for seniors and/or people with disabilities, residential facilities for low-income individuals, and government facilities that provide significant services to members of transitdependent population groups. Source: SEWRPC. Employment Performance Standard All jobs within Washington County are served by the Shared-Ride Taxi service, fulfilling this standard. Similar to major activity centers, a number of jobs in Milwaukee County are also served through a transfer from the Shared-Ride Taxi service to the Commuter Express service. Objective 2: Operating Safely, Reliably, Conveniently, Comfortably, and Efficiently Figure 18 contains the applicable standards used to determine whether the Shared-Ride Taxi is providing a service that is safe, reliable, convenient, and comfortable for users to promote the efficient utilization of transit services. Service Frequency and Availability Design and Operating Standard The Service Frequency and Availability Standard recommends that Shared-Ride Taxi services offer a response time which is defined as the time between a call for service being placed and a vehicle arriving to pick up a passenger of 45 minutes in urban areas and four hours in rural areas. The Shared-Ride Taxi service does not meet this standard, as it requires 24-hour advanced reservation to guarantee service. 61
80 Figure 18 OBJECTIVE NO. 2 AND ASSOCIATED STANDARDS APPLICABLE TO THE EVALUATION OF THE WASHINGTON COUNTY SHARED-RIDE TAXI Objective No. 2 Washington County s public transit system should promote efficient utilization of its services by operating a system that is safe, reliable, convenient, and comfortable for users. Applicable Design and Operating Standards 4. Service Frequency and Availability Shared-ride taxi services should offer a response time of 45 minutes or less in urban areas and four hours or less in rural areas. 5. Service Travel Speeds Transit services should be designed and operated so that average travel speeds on a trip are not less than 10 miles per hour for demand-responsive services. Applicable Performance Standards and Associated Performance Measures 1. Ridership and Service Effectiveness Ridership on transit services and the overall effectiveness of such services should be maximized. This will be measured using passengers per capita, total passengers per vehicle hour, total passengers per vehicle mile, and passenger miles per vehicle mile which will be compared to similar transit systems. Transit services with service effectiveness measures more than 20 percent below the median of the peer comparison group will be reviewed for potential changes to their service policies, service areas, and service periods. 2. On-Time Performance Demand-response services should be designed and operated to maximize adherence to scheduled rider pickup times. Performance should be regularly monitored and a transit service with less than 90 percent of trips on time (defined as being between 15 minutes early and 15 minutes late for demand-response services) should be reviewed for changes. 3. Travel Time Travel times on transit services should be kept reasonable in comparison to travel time by automobiles for similar trips. This standard will be measured using the ratio of transit to automobile travel time. Source: SEWRPC. Service Travel Speeds Design and Operating Standard The Service Travel Speeds Standard requires that demand-response transit services average travel speeds of at least 10 miles per hour for the duration of a passenger s trip. The Shared-Ride Taxi exceeds this standard in a sample of trips taken from two weeks of trip logs from May Speeds in this sample of trips range from 28 to 45 miles per hour. Ridership and Service Effectiveness Performance Standard The Ridership and Service Effectiveness Standard uses four performance measures (passengers per capita, passengers per revenue vehicle hour, passengers per revenue vehicle mile, and passenger miles per revenue vehicle mile) to compare the service effectiveness of the Shared-Ride Taxi service to six peer services. If the service effectiveness measures are more than 20 percent below the median of the peer comparison group, this standard encourages modifications to routes, runs, service areas, or service periods. Figure 19 shows the results of this comparison of the Shared-Ride Taxi to its peers by displaying the range of the peer group s performance, the median of the peer group s performance, the range of performance that meets the standard, and the performance of the Shared-Ride Taxi for each measure. The data for each peer system is presented in Table 26. As indicated in Figure 19, the Shared-Ride Taxi s performance is within the range meeting the standard for all four performance measures. The passengers per capita measure is 0.76, which is well above the median of the peer group and remarkable given that none of the other peer systems have other shared-ride taxi services operating within their respective service areas. Considering the high passengers per capita utilization rate, the fact that the County s Shared-Ride Taxi service performs lower than the median on the three service effectiveness standards is notable. The service s long average trip length and high travel speeds contribute to this performance, 62
81 Table 26 WASHINGTON COUNTY SHARED-RIDE TAXI PEER GROUP DATA FOR THE RIDERSHIP AND SERVICE EFFECTIVENESS PERFORMANCE STANDARD Performance Measures Passengers per Capita Passengers per Revenue Vehicle Hour Passengers per Revenue Vehicle Mile Passenger Miles per Revenue Vehicle Mile Ozaukee County Express Waukesha County Express Bus Clermont Transportation Connection Milwaukee, WI Milwaukee, WI Cincinnati, OH Loudoun County Commuter Bus Cobb Community Transit Georgia Regional Transportation Authority Washington County Commuter Express Washington, D.C. Atlanta, GA Atlanta, GA Milwaukee, WI Average Annual Change 1.80% -2.78% 6.29% 46.72% -5.62% 29.06% 0.02% Average Annual Change -3.05% 3.64% 4.75% -3.62% -9.37% 8.83% -3.30% Average Annual Change -2.40% 2.48% 4.07% % -7.84% 1.99% -1.79% Average Annual Change Source: National Transit Database and SEWRPC % 5.04% 5.44% -2.97% -6.11% 1.14% -0.59% 63 63

82 Figure 19 RIDERSHIP AND SERVICE EFFECTIVENESS STANDARD: COMPARISON OF WASHINGTON COUNTY SHARED-RIDE TAXI TO PEER GROUP FOR ASSOCIATED PERFORMANCE MEASURES Passengers per Capita Passengers per Vehicle Hour Passengers per Vehicle Mile Passenger Miles per Vehicle Mile Source: National Transit Database and SEWRPC. as the shorter trips that would increase the Shared-Ride Taxi s passengers per revenue vehicle hour, passengers per revenue vehicle mile, and passenger miles per revenue vehicle mile, are mostly served by the Hartford City Taxi and West Bend Taxi services. On-Time Performance Standard The On-Time Performance Standard states that 90 percent of trips should begin between 15 minutes before or after their scheduled passenger pickup time for demand-response services. Data for the Shared-Ride Taxi service from May 2013 were used to develop Table 27, which shows that the service is meeting the standard, with 96 percent of trips on-time. Assuming that many if not all of the trips that were considered early left their pickup point because the passenger was onboard, the percentage of trips on time was likely even higher. Travel Time Performance Standard The Travel Time Performance Standard encourages that travel times by transit be kept reasonable in comparison to travel times by automobiles for similar trips. Table 28 compares average travel times between 10 randomly selected origin-destination pairs for users of the Shared-Ride Taxi service to travel times by private automobile for the same journey, and shows that the ratio between transit travel times and automobile travel times does not exceed This result indicates an acceptable difference in travel time between private automobile travel and travel using the Shared-Ride Taxi, fulfilling the standard. 64
83 Table 27 ON-TIME PERFORMANCE OF THE WASHINGTON COUNTY SHARED-RIDE TAXI: MAY 2013 Number of Early Pickups (minutes early) More than Total Number of Late Pickups (minutes late) More than Total Total Number of Pickups in May ,706 Percent Late Pickups 2.6 Percent Early Pickups 1.4 Percent of On-Time Pickups 96.0 Source: Specialized Transport Services, Inc. and SEWRPC. Table 28 TRAVEL TIME COMPARISON BETWEEN THE WASHINGTON COUNTY SHARED-RIDE TAXI AND AUTOMOBILES FOR SELECTED TRIPS Trip Origin Private Residence W203 N16234 White Oak Circle, Jackson Rogan s Shoes 1511 W Washington Street, West Bend Private Residence 5462 Arthur Road, Slinger New Life Church 4125 County Road D Barton The Threshold, Inc. 600 Rolfs Avenue, West Bend Private Residence 834 Center Street, Hartford Private Residence 1512 Riverview Drive, Jackson Private Residence 437 West Paradise Drive, West Bend Private Residence 5223 Indian Drive, Hartford Laser Finishing, Inc. N115 W18835 Edison Drive, Germantown Trip Destination Northbrook Church 4014 State Highway 167, Richfield Whatever s Inn 501 Main Street, Newburg Hartford Union High School 805 Cedar Street, Hartford Private Residence 7463 Brookhaven Drive, Wayne Private Residence 8059 North Salisbury Road, Barton The Threshold, Inc Stonebridge Circle, West Bend Our Savior Lutheran Church 1044 South Silverbrook Drive, West Bend Private Residence W156 N11340 Pilgrim Road, Germantown Dog Federation of Wisconsin 742 South Indiana Avenue, West Bend Apartment Complex N165 W20012 Hickory Lane, Jackson Travel Time (minutes) Shared-Ride Taxi Automobile Difference (minutes) Ratio (transit to automobile) Source: Specialized Transport Services, Inc. and SEWRPC. 65
84 Figure 20 OBJECTIVE NO. 3 AND ASSOCIATED STANDARDS APPLICABLE TO THE EVALUATION OF THE WASHINGTON COUNTY SHARED-RIDE TAXI Objective No. 3 Washington County s public transit system should be economical and cost effective, meeting all other objectives at the lowest possible cost. Given limited public funds, achieving this objective may result in some standards listed under Objectives 1 and 2 becoming unattainable. Applicable Design and Operating Standards 2. Fare Structure The fare policies for transit services should provide for premium fares for premium services, as well as discounted fares for priority population groups and frequent transit riders. Applicable Performance Standards and Associated Performance Measures 1. Operating Expenses The operating expense per total and revenue vehicle mile, the operating expense per total and revenue vehicle hour, and the operating assistance per passenger should be minimized. Annual increases in such costs should not exceed the median percentage increases experienced by comparable transit systems. 3. Cost Effectiveness Transit services with substandard cost effectiveness should be reviewed for potential changes to their routes, runs, service areas, and service periods. Cost effectiveness will be considered substandard when the operating cost per passenger, or operating expense per passenger mile are more than 20 percent above, or the farebox recovery ratio is more than 20 percent below, the median for comparable transit systems. Source: SEWRPC. Objective 3: Utilizing Public Resources Cost Effectively Objective 3 recognizes that public funds are limited, and must be used efficiently. In order to determine whether public funds are being well-spent, the following analyses compare the Shared-Ride Taxi service to its peer group using a number of performance measures. The applicable standards and performance measures used to measure how efficiently the Shared-Ride Taxi is using public funds are shown in Figure 20. Fare Structure Design and Operating Standard The Fare Structure Standard encourages premium fares for premium services, and discounts for priority users, such as seniors or people with disabilities. The Shared-Ride Taxi service fulfills both these recommendations, with a distance-based standard fare that is higher than a typical local bus service and a discounted fare for seniors and people with disabilities. Operating Expenses Performance Standard By comparing the annual percentage increase between 2007 and 2011 in operating expenses per total vehicle mile, operating expenses per revenue vehicle mile, operating expenses per total vehicle hour, operating expenses per revenue vehicle hour, and operating assistance per passenger, the Operating Expenses Performance Standard ensures that the inflationary growth in operating costs is comparable to that of peer systems. In order to fulfill the standard, none of the annual percentage increases in the five performances measures should exceed the median percentage increases experienced by the peer group. Figure 21 displays a comparison of the annual percentage change for each metric for between the range of the peer group s performance, the range of performance that meets the standard, the median of the peer group s performance, and the performance of the Shared-Ride Taxi service. Table 29 provides the detailed data used to develop Figure 21. The Shared-Ride Taxi does not meet the standard under any of the five performance measures that were examined. From 2007 to 2011, the operating expenses and operating assistance for the Shared-Ride Taxi increased faster than the median of the peer group, and for some performance measures, faster than any of the systems in the peer group. However, for the four measures that study operating expenses per unit of service, the 66

 of the Shared-Ride Taxi service are lower than all or lower than all but one of the peer systems, creating a mixed result for this standard.")
85 Figure 21 OPERATING EXPENSES STANDARD: COMPARISON OF WASHINGTON COUNTY SHARED-RIDE TAXI TO PEER GROUP FOR ASSOCIATED PERFORMANCE MEASURES Annual Percent Change in Operating Expenses per Revenue Vehicle Mile Annual Percent Change in Operating Expenses per Revenue Vehicle Hour Annual Percent Change in Operating Expenses per Total Vehicle Mile Annual Percent Change in Operating Expenses per Total Vehicle Hour Annual Percent Change in Operating Assistance per Passenger Source: National Transit Database and SEWRPC. actual unit costs (shown in Table 29) of the Shared-Ride Taxi service are lower than all or lower than all but one of the peer systems, creating a mixed result for this standard. For the fifth measure, operating assistance per passenger, the Shared-Ride Taxi s unit costs are exactly in the middle of the peer systems, with three systems with lower costs and three with higher costs. Cost Effectiveness Performance Standard The Cost Effectiveness Standard recommends that operating cost per passenger and operating cost per passenger mile should be no greater than 20 percent above the median of the peer group, and that the farebox recovery ratio should be no greater than 20 percent below the median of the peer group. If a transit service is substandard under any of these performance measures, it may indicate that changes to service policies, service areas, and service periods need to be considered. Figure 22 shows the range of the peer group s performance, the median of the peer group s performance, the range of performance that meets the standard, and the performance of the Shared-Ride Taxi service for these performance measures. Table 30 provides the detailed data used to develop Figure 22. The Shared-Ride Taxi fulfills this standard in two of the three performance measures. At $21.48, the operating cost per passenger for the Shared-Ride Taxi is lower than the median of its peer group. Additionally, operating cost per passenger mile was lower than the median of the peer group, at $1.89. Despite the low unit costs, costs under both measures increased faster than those of all but one peer system between 2007 and
86 68 Table 29 WASHINGTON COUNTY SHARED-RIDE TAXI PEER GROUP DATA FOR THE OPERATING EXPENSES PERFORMANCE STANDARD Performance Measures Operating Expenses per Revenue Vehicle Mile Operating Expenses per Revenue Vehicle Hour Operating Expenses per Total Vehicle Mile Operating Expenses per Total Vehicle Hour Operating Assistance per Passenger Ozaukee County Shared- Ride Taxi Miami County Public Transit Butler County Regional Transit Authority Greene County Area Transit Service Clermont Transportation Connection Fort Bend County Public Transit Washington County Shared- Ride Taxi Milwaukee, WI Dayton, OH Cincinnati, OH Dayton, OH Cincinnati, OH Houston, TX Milwaukee, WI 2007 $1.96 $2.21 $2.98 $4.70 $2.44 $3.06 $ $1.81 $2.38 $3.30 $3.12 $2.52 $2.94 $1.83 Average Annual Change -0.90% 2.03% 2.64% % 1.25% -0.79% 4.52% 2007 $38.60 $39.61 $56.77 $63.31 $50.74 $47.22 $ $34.07 $43.91 $64.52 $54.28 $49.53 $59.31 $38.49 Average Annual Change -1.23% 2.94% 3.32% -7.34% -0.22% 6.17% 2.91% 2007 $1.72 $1.99 $2.40 $3.87 $1.99 $2.27 $ $1.63 $2.18 $2.64 $2.50 $2.01 $2.56 $1.59 Average Annual Change -0.22% 2.55% 2.56% % 0.80% 3.24% 4.41% 2007 $33.47 $36.04 $47.53 $53.13 $45.91 $41.69 $ $30.87 $40.62 $51.95 $43.33 $38.42 $54.24 $33.80 Average Annual Change -0.66% 3.10% 2.35% -9.49% -3.28% 7.08% 3.47% 2007 $16.18 $14.36 $4.55 $29.75 $20.97 $29.13 $ $16.18 $15.58 $5.58 $24.27 $30.79 $26.44 $18.16 Average Annual Change Source: National Transit Database and SEWRPC. 0.90% 4.84% 6.69% -9.60% 10.55% -1.82% 5.67% 68
87 Table 30 WASHINGTON COUNTY SHARED-RIDE TAXI PEER GROUP DATA FOR THE COST EFFECTIVENESS PERFORMANCE STANDARD Performance Measures Operating Costs per Passenger Operating Costs per Passenger Mile Farebox Recovery Ratio Ozaukee County Shared- Ride Taxi Miami County Public Transit Butler County Regional Transit Authority Greene County Area Transit Service Clermont Transportation Connection Fort Bend County Public Transit Washington County Shared- Ride Taxi Milwaukee, WI Dayton, OH Cincinnati, OH Dayton, OH Cincinnati, OH Houston, TX Milwaukee, WI 2007 $18.63 $21.38 $18.15 $37.96 $22.51 $29.50 $ $19.01 $21.95 $17.26 $35.12 $32.59 $27.13 $21.48 Average Annual Change 1.37% 3.33% -1.09% -3.81% 10.00% -1.53% 6.71% 2007 $2.69 $2.87 $1.73 $2.82 $2.03 $2.66 $ $2.70 $2.68 $1.59 $2.04 $2.82 $2.49 $1.89 Average Annual Change 1.18% 1.00% -1.55% % 11.23% -0.27% 5.56% % 32.84% 74.91% 21.62% 6.88% 1.26% 12.39% % 29.01% 67.67% 30.91% 5.53% 2.54% 15.49% Average Annual Change Source: National Transit Database and SEWRPC. 3.85% -2.13% -2.31% 20.98% -2.74% 21.43% 6.14% 69 69

88 Figure 22 COST EFFECTIVENESS STANDARD: COMPARISON OF WASHINGTON COUNTY SHARED-RIDE TAXI TO PEER GROUP FOR ASSOCIATED PERFORMANCE MEASURES Operating Cost per Passenger Operating Cost per Passenger Mile Farebox Recovery Ratio Source: National Transit Database and SEWRPC. In contrast to operating cost per passenger and passenger mile, the Shared-Ride Taxi s farebox recovery ratio is lower than many peer systems, and does not meet the standard. It has been improving over time, but still does not reach the levels of some of its more efficient peers. This result, combined with the rapid growth in operating assistance per passenger under the Operating Expenses Standard, indicates that the County may want to consider raising the fare for the Shared-Ride Taxi to improve performance under both measures. CONCLUSION This chapter s evaluation of the Commuter Express and Shared-Ride Taxi services provided by the Washington County Transit System indicates potential areas for service changes to help the system better fulfill the objectives and standards laid out in Chapter III of this report. Additional commuter services from Hartford, reverse commute services, improvements to the Paradise Park and Ride Lot in West Bend, decreased response times on the Shared-Ride Taxi, changes in passenger fares, and other possible service improvements could increase the transit system s performance under various standards. Chapter V of this report presents potential service improvement alternatives, and analyzes their costs and influence on the performance of the transit system. 70
89 Chapter V TRANSIT SERVICE ALTERNATIVES FOR THE WASHINGTON COUNTY TRANSIT SYSTEM INTRODUCTION AND SUMMARY This chapter discusses potential service alternatives for Washington County to consider implementing as part of the Washington County Transit System, in an effort to improve services for County residents and increase accessibility to a number of locations in counties adjacent to Washington County. These alternatives also seek to improve the performance of the Washington County Transit System in response to the evaluation completed in Chapter IV of this report, and in response to comments and ideas received from the Advisory Committee for this planning effort. Future expenses, revenues, and ridership on the two existing services provided by the County Transit System were analyzed to provide a no-change alternative and to provide a base scenario to which potential service changes could be compared. The section on each potential service alternative includes a description of the alternative, a discussion of the advantages or disadvantages of a particular alternative, and a table containing the expected operating expenses, revenues, and ridership for the alternative for the year 2015, the year 2019, and an average over the five-year plan timeframe. Alternatives for the County Shared-Ride Taxi service also include the impact of the alternative on the County s capital assets and costs, if applicable. Fixed-route service alternatives are discussed in the first half of the chapter, followed by alternatives that affect the County Shared-Ride Taxi service. Summary of the Fixed-Route Service Alternatives for the Washington County Transit System A number of fixed-route service alternatives, either suggested by the Advisory Committee or in response to known unmet transportation needs and the evaluation of existing services (see Chapter IV of this report), are considered in this chapter. No Changes to the Washington County Commuter Express The no-change alternative projects a relatively stable budget for the Washington County Commuter Express with County funding expected to be flat between 2015 and Ridership is expected to fall slightly over the study period, with projected fare increases in 2016 and 2019 being the main cause. County expenses are expected to increase when compared to 2012, but this is due to the estimated loss of 9,000 riders between 2012 and Southeastern Wisconsin Regional Planning Commission staff believes this is a conservative budget, as ridership will likely grow as congestion increases due to the Zoo Interchange reconstruction. 71
90 Reduce Service on the Washington County Commuter Express Should the County need to reduce its level of funding for the Commuter Express for the plan timeframe, it could consider a $0.25 fare increase. This fare increase would reduce the required County assistance by approximately $16,000, but it would also reduce ridership. The County could also consider reducing service, either by eliminating the Medical Center Route, or by eliminating the lowest performing runs from both the Medical Center Route and the Downtown Route. Eliminating the Medical Center Route is expected to reduce the required amount of annual County assistance by $73,000, and decrease ridership by 27,500 annual revenue passengers by Under this alternative, the amount of County funding would never be greater than $150,000 during the plan timeframe. No longer operating the eight lowest-performing runs all of which average 10 or fewer revenue passengers each day would save the County $91,000 each year by 2019, and reduce annual revenue passengers by 21,000. This alternative would reduce schedule flexibility for passengers of both routes, as the Downtown Route would no longer provide northbound service before 3:30 p.m., and the Medical Center Route would only have two runs in each direction. County assistance for the Commuter Express would be less than $135,000 between under this alternative. Increase Service Frequency The County is encouraged to continue to increase service frequency to meet demand, as it has done in the past. Following schedule changes for the Commuter Express at the beginning of 2014, both routes of the Commuter Express met the Service Frequency and Availability Standard under Objective No. 2 in Chapter III of this report, which encourages service to be provided at least every 30 minutes during the peak. Washington County Commuter Express Service to Additional Destinations Additional destinations for the Commuter Express to serve are also analyzed, with service to Mayfair Mall and nearby office buildings holding the most promise. Estimated ridership and revenue projections for this service would result in improved efficiency for the Medical Center Route, with an increased percentage of operating expenses recovered through passenger revenues. Annual County funding is estimated to average $6,500 and the service is projected to result in an additional daily revenue passenger trips by 2019 on the Medical Center Route. Another destination for service on the Medical Center Route could be the Park Place office complex, but this location is not expected to generate much ridership due to the lack of pedestrian accommodations within the development. Service to the University of Wisconsin-Milwaukee (UWM) could be provided by extending certain runs of the existing Downtown Route. This service is expected to generate 4,000 additional revenue passengers annually and require the County to increase funding for the Commuter Express by $6,200 by Other destinations that could warrant fixed-route service include Kohl s Department Stores Corporate Headquarters, and General Mitchell International Airport. Both would require dedicated routes, as they are not adjacent to any existing fixed-route service provided by the County. Service to Kohl s would likely generate limited ridership, as the journey from much of the County to Kohl s is relatively short and uncongested, with free parking available at the destination. This service is estimated to cost the County $50,800 a year to operate, but would only attract about 13 passenger trips each day. In contrast, service to Mitchell Airport would require a significant commitment of financial resources by the County. In order to be useful to airport passengers, the service would need to operate every one to two hours, seven days a week. This service is expected to have 20,800 passenger trips annually by 2019 and require the County to provide $403,600 in local funding. Washington County Commuter Express Service Originating in the City of Hartford Providing service from two leased park and ride lots along STH 60 in the City of Hartford and the Village of Slinger would be anticipated to generate between 90 and 110 additional passenger trips each day. The service could be provided in two ways: either direct service to Downtown Milwaukee with four morning trips and four evening trips returning to Hartford, or shuttle service that connects the proposed Hartford park and ride lot and the proposed Slinger park and ride lot to existing services at the Richfield Park and Ride using a timed transfer. The latter option would allow Hartford-area residents to transfer to nearly every run on the existing Downtown and 72
91 Medical Center Routes, and is expected to be the higher ridership option of the two. The shuttle option is also estimated to require only $39,400 in County funds in 2019, compared to $128,900 for the direct service to Downtown Milwaukee. Reverse Commute Service from Milwaukee County to Employers in Washington County Two alternatives were considered to provide service to Washington County businesses from Milwaukee County. A local shuttle service leaving from the terminus of the Milwaukee County Transit System BlueLine could provide access to the 4,600 jobs located in the Germantown Industrial Park, and could be expected to have about 45 daily passenger trips by Providing an express route along W. Fond du Lac Avenue to the Germantown Industrial Park and the City of West Bend would generate more ridership, and would allow for some interlining with the existing Commuter Express Downtown Route, so that its costs would not be significantly more than the local shuttle, at $106,400 annually by Fixed-Route Service between the City of West Bend and the City of Fond du Lac This alternative discusses providing service from Washington County to the City of Fond du Lac s transit system, as well as numerous educational institutions located in the City of Fond du Lac. The service would leave from a leased park and ride lot in the center of the City of West Bend, stop in Kewaskum, and then provide service to the Fond du Lac Transit transfer zone and the City of Fond du Lac, with one morning trip and two evening return trips. This service is estimated to serve 20 daily revenue passengers and to require $52,400 in County funds in Summary of the Shared-Ride Taxi Service Alternatives for the Washington County Transit System Alternatives for the Shared-Ride Taxi service include merging the municipal taxi systems in the County with the County Shared-Ride Taxi, merging the Ozaukee County and Washington County Shared-Ride Taxi services, utilizing a second taxi dispatching depot in or near the Village of Germantown, and extending the service hours of the Shared-Ride Taxi to serve late-night ridership requests. One additional alternative projects the future operating expenses and revenues, capital expenses, and ridership for the Shared-Ride Taxi service if no changes are made to the existing service, and another additional alternative discusses increasing fares for the service in an effort to keep County funding constant over the plan timeframe. The no change alternative assumes flat taxi ridership, estimated from an average of taxi ridership between 2007 and 2012, and predicts that the County will have to contribute $85,800 more in local tax levy to the Shared-Ride Taxi in 2019 than it did in Capital expenses are predicted to be manageable, assuming the County is able to continue utilizing Federal Section 5307 funds to provide an 80 percent match for vehicle purchases. An average of $43,000 in County levy is expected to be needed annually to replace existing vehicles as they age. Increase Fares at a Rate Greater than Inflation on the County Shared-Ride Taxi Service If the County needs to reduce its level of assistance to the Shared-Ride Taxi service, it is limited to finding operational efficiencies and increasing fares. Because of the nature of a shared-ride taxi service, in which increased ridership results in a roughly proportional increase in service miles and hours, the County would need to either discourage ridership, find operational efficiencies, or increase the percentage of overall expenses paid by the passenger in order to lower the County s costs. To keep the level of County assistance at or below the level provided in 2012 ($548,800), the County would need to increase fares an average of $1.25 over the timeframe of the plan by $0.50 in 2015, and $0.25 in 2017, 2018, and These fare increases would reduce ridership by 7,400 annual revenue passengers in Merging with the Municipal Taxi Systems This section of the chapter provides an update to the discussion of merging the Hartford City Taxi and West Bend Taxi with the County Shared-Ride Taxi. This discussion has been ongoing as State and Federal transit funding have become more uncertain. Two alternatives are analyzed, one that keeps the existing higher level of service within West Bend and Hartford requiring $155,700 more County levy in 2019 than operating the existing system and one that proposes an advanced-reservation service across the County requiring an additional $104,200 in County levy in 2019 compared to operating the existing system. Neither service is expected to initially affect the County s capital requirements, as it is expected that the two municipalities would transfer ownership of their vehicles to the County if this option were pursued, but as the vehicles age replacing these vehicles could be expected to increase the County s capital expenses as well. 73
92 Merging with the Ozaukee County Shared-Ride Taxi Service Merging the two county shared-ride taxi systems would provide improved service to the residents of each county, but would require creating a uniform fare policy and uniform service hours, as well as signing intergovernmental agreements detailing the funding and management of the system. Based on existing travel on all modes between Washington and Ozaukee County, an estimate of 7,100 additional annual passenger trips on the merged sharedride taxi service was calculated. The cost of this service expansion would be relatively minimal, with an additional $46,500 in local support that would need to be divided between the two counties. Merging the two systems may result in longer average trips, which would increase the estimated cost of this alternative slightly. Providing a Secondary Taxi Depot in the Village of Germantown Operating a secondary depot in or near Germantown is estimated to save the County approximately $8,100 each year between 2015 and 2019, by reducing vehicle hours by 700. However, a number of potential additional capital and operating costs could offset much of these savings, and further discussions between the County and its Shared-Ride Taxi operator would need to be conducted to determine where vehicles would be fueled, how maintenance would be managed, and how staffing would need to change. Extending the Service Hours of the Shared-Ride Taxi Providing longer service hours, until 1 a.m. on Saturday and Sunday mornings, would offer an alternative to unsafe driving to patrons of dining and entertainment establishments and would provide County residents with more flexibility in their travel schedules. Requests for late-night service do not lend themselves to an advanced reservation service, so this alternative proposes that the County operate a demand-response service between 10 p.m. and 1 a.m. on those two days, with drivers available to respond to requests for service on short notice. This type of service is estimated to require $12,300 in County funding by FIXED-ROUTE SERVICE ALTERNATIVES AND IMPROVEMENTS Based on the evaluation of existing services in Chapter IV and the discussions of the Advisory Committee at a number of meetings, the following fixed-routes alternatives were analyzed as potential service alternatives and improvements for the Advisory Committee to consider including in the recommended transit system development plan. These alternatives include modifications or enhancements of the current Commuter Express service and additional fixed-route service that could be provided by Washington County. A number of the fixed-route service alternatives are entirely new services, rather than minor changes to existing routes. New services could be eligible for Federal Highway Administration Congestion Mitigation and Air Quality (CMAQ) funds, which were used by Washington County to start its original fixed-route service in These funds cover up to 80 percent of the first three years of operating expenses associated with a new service that is expected to reduce congestion or improve air quality by reducing vehicle miles traveled by private automobile. Utilizing these funds to initiate new services would significantly reduce the risk to the County, and allow experimentation with new fixed-route services. However, a statewide application process for CMAQ funds for has just been completed, meaning that CMAQ funds would likely not be available to the County until No Changes to the Washington County Commuter Express With the relatively favorable evaluation of the Commuter Express service, the County could choose to continue the existing service for the time period considered under this plan. The current system is the result of significant experimentation and refinement by the County, and, given the current financial resources available at all levels of government, it may be the most appropriate service to provide unless more resources become available. This alternative also serves as the base against which the remaining fixed-route service alternatives can be compared. Table 31 shows the expected operating expenses, revenues, and ridership on the Commuter Express if no additional revenue hours of service are provided and the schedule and routes are not modified. Unless otherwise noted, this table and similar tables for each of the other fixed-route alternatives assume that operating expenses 74
93 Table 31 PROJECTED ANNUAL OPERATING EXPENSES, REVENUES, AND RIDERSHIP FOR THE WASHINGTON COUNTY COMMUTER EXPRESS SERVICE: Actual Projected Characteristics Average Services Provided Revenue Vehicle Miles , , , ,900 Revenue Vehicle Hours... 9,300 9,300 9,300 9,300 Revenue Passengers Total , , , ,700 Passengers per Revenue Vehicle Mile Passengers per Revenue Vehicle Hour Expenses and Revenues Operating Expenses a... $1,276,700 $1,354,800 $1,466,500 $1,410,100 Farebox Revenues a , , , ,000 Percent of Expenses Recovered through Revenues Operating Assistance Federal a... $266,600 $260,800 $ 282,300 $271,400 State a , , , ,100 County a , , , ,600 Total a , ,000 1,026, ,100 Per Trip Data Operating Expenses a... $10.01 $11.37 $12.60 $11.98 Farebox Revenue a Total Operating Assistance a a Expenses and revenues are expressed in estimated year-of-expenditure dollars. Source: Washington County Highway Department and SEWRPC. per service hour will grow at a rate of 2 percent each year, and that the percentage of operating expenses covered by a combination of Federal and State funds will remain approximately 55 percent. So that the fare stays constant in 2012 dollars, fare increases of $0.25 are assumed to occur at the beginning of 2016 and again at the beginning of If these fare increases are implemented, the County can expect its level of funding in year-of-expenditure dollars to be about the same in 2019 as it is in 2015, meaning a decrease in funding in constant dollars. The County level of assistance jumps from 2012 to 2015 due to the loss of revenue from the decreased ridership the Commuter Express experienced in Reduce Service on the Washington County Commuter Express Although continuing to provide the same level of service should result in a constant level of County assistance from 2015 through 2019, the County may need to reduce its level of assistance in the future. In order to do this, the County could consider raising fares, reducing service, or some combination of the two. Increasing fares an additional $0.25 would reduce the required County assistance by approximately $16,000, but cause a reduction in annual revenue passengers of about 2,000 trips. This section includes two alternatives for the County to reduce service, based on the year 2013 Commuter Express schedule, as information on the success of the year 2014 schedule modifications was unavailable. Should the County decide to reduce service, it is important to consider that reductions beyond those described in this section shouldn t go below the amount required by the County s current contract with GoRiteway. Additionally, any reduction of service hours may cause the County s cost per revenue hour of providing service to increase beyond the rate of inflation in 2016 when the current contract expires. 75
94 Table 32 PROJECTED ANNUAL OPERATING EXPENSES, REVENUES, AND RIDERSHIP FOR THE WASHINGTON COUNTY COMMUTER EXPRESS SERVICE IF THE MEDICAL CENTER ROUTE IS ELIMINATED: Actual Service Projected Alternative Schedule Characteristics Average Services Provided Revenue Vehicle Miles , , , ,800 Revenue Vehicle Hours... 9,300 6,800 6,800 6,800 Revenue Passengers Total ,500 91,400 88,900 90,200 Passengers per Revenue Vehicle Mile Passengers per Revenue Vehicle Hour Expenses and Revenues Operating Expenses a... $1,276,700 $990,600 $1,072,300 $1,031,100 Farebox Revenues a , , , ,100 Percent of Expenses Recovered through Revenues Operating Assistance Federal a... $266,600 $190,700 $206,400 $198,500 State a , , , ,600 County a , , , ,900 Total a , , , ,000 Per Trip Data Operating Expenses a... $10.01 $10.84 $12.06 $11.43 Farebox Revenue a Total Operating Assistance a a Expenses and revenues are expressed in estimated year-of-expenditure dollars. Source: Washington County Highway Department and SEWRPC. Eliminate the Medical Center Route The Medical Center Route has never performed as well as the service to Downtown Milwaukee, due to the unusual shifts scheduled by the facilities at the Milwaukee Regional Medical Center, free parking at the destinations on the route, and the shorter, less-congested travel times between Washington County and the Medical Center. Unless this lower performance is remedied by the changes made in the year 2014 Commuter Express schedule, the County could consider eliminating this route if it needs to reduce its level of assistance. Eliminating the Medical Center Route would reduce the required amount of County assistance by approximately $73,000 in 2019, when compared to continuing to operate the year 2013 Commuter Express schedule. Under this alternative, the Commuter Express is estimated to have 27,500 fewer revenue passengers in 2019 than it would if the year 2013 schedule continued without modification. Table 32 shows the expected operating expenses, revenues, and ridership on the Commuter Express for under this alternative, compared to the existing operating expenses, revenues, and ridership on the Commuter Express in 2012 for the existing service. This alternative would decrease the required County assistance slightly from 2012, with the amount of County funding never greater than $150,000 during the plan timeframe. 76
95 Eliminate Low-Performing Runs from Both Routes Similar to eliminating the Medical Center Route, this alternative would remove eight runs from the 2013 Commuter Express service. However, this alternative would eliminate the runs with the least revenue passengers, which average 10 or fewer passengers. These runs are Runs 13, 15, 16, and 26 from the Downtown Route, and Runs 10, 12, 14, and 23 from the Medical Center Route. Eliminating Runs 13, 15, 16, and 26 from the Downtown Route would result in significantly less schedule flexibility for riders, as the earliest afternoon run from Downtown Milwaukee would start at 3:35 p.m. under this alternative. Similarly, passengers on the Medical Center Route would also have much less flexibility, with only two runs in the morning, and two in the afternoon. However, eliminating runs as proposed under this alternative should result in the Commuter Express retaining more revenue passengers than under the alternative that eliminates the Medical Center Route entirely. By eliminating the lowest performing runs, County assistance for the Commuter Express would be approximately $91,000 less in 2019 than if the County continued to operate the year 2013 Commuter Express service. The Commuter Express is estimated to have 21,000 fewer revenue passengers in 2019 under this alternative. If this alternative is implemented, it is estimated that County operating assistance for the Commuter Express would never be greater than $135,000 from 2015 to Table 33 shows the expected operating expenses, revenues, and ridership on the Commuter Express for under this alternative, compared to the existing operating expenses, revenues, and ridership on the Commuter Express for 2012 for the existing service. Table 34 compares the average expected operating expenses, revenues, and ridership for for the no change alternative, the alternative that eliminates the Medical Center Route, and the alternative eliminating some runs on both routes. Increase Frequency and Service Hours of the Washington County Commuter Express Service As demand for the Commuter Express has increased in recent years, the County has responded by adding additional trips. This could continue in the future, and County staff will need to work with the operator to ensure that there are available seats on each run of the Commuter Express. Aside from increased frequency due to crowding concerns, the County could also increase frequency to provide riders with greater flexibility (and thereby improve the quality of the service and attract new riders). In order to meet the Service Frequency and Availability Standard under Objective No. 2 in Chapter III of this report, service should be provided at least every 30 minutes during the peak on both Commuter Express routes. During the performance evaluation of the Washington County Transit System in Chapter IV of this report, it was noted that while the Downtown Route meets this standard, the Medical Center Route had less frequent service than the standard recommends. The County has remedied this with its modified service for 2014, so no additional runs need to be added for the Commuter Express to meet this standard. Washington County Commuter Express Service to Additional Destinations The County could consider serving a number of additional destinations in the Region with the Commuter Express. The following destinations are major regional activity centers currently unserved by the Commuter Express, or are significant employment destinations near the path of the existing Medical Center Route, which has spare capacity for additional riders. Serving these employment destinations with the existing Medical Center route would result in longer travel times for current passengers, which may discourage some of them from using the Commuter Express for their commutes. The estimates of additional ridership for each alternative account for any loss of existing passengers due to additional travel time. University of Wisconsin Milwaukee The University of Wisconsin-Milwaukee (UWM) has over 29,000 students, and nearly all of its students take classes on its campus on the east side of the City of Milwaukee. An estimated 300 Washington County residents currently commute to UWM to attend classes, some of whom may be interested in taking the Commuter Express. Additionally, the 130 employees of UWM who live in Washington County may also be interested in this service. Adding service to UWM would require an additional 11 minutes of revenue service on each run of the Downtown Route, but not all runs should be extended given the UWM class schedule. Table 35 shows estimates of the 77
96 Table 33 PROJECTED ANNUAL OPERATING EXPENSES, REVENUES, AND RIDERSHIP FOR THE WASHINGTON COUNTY COMMUTER EXPRESS SERVICE IF THE LOWEST PERFORMING RUNS ARE ELIMINATED: Actual Service Projected Alternative Schedule Characteristics Average Services Provided Revenue Vehicle Miles , , , ,800 Revenue Vehicle Hours... 9,300 6,900 6,900 6,900 Revenue Passengers Total ,500 98,000 95,400 96,800 Passengers per Revenue Vehicle Mile Passengers per Revenue Vehicle Hour Expenses and Revenues Operating Expenses a... $1,276,700 $1,005,200 $1,088,100 $1,046,200 Farebox Revenues a , , , ,400 Percent of Expenses Recovered through Revenues Operating Assistance Federal a... $266,600 $193,500 $209,500 $201,400 State a , , , ,000 County a , , , ,400 Total a , , , ,900 Per Trip Data Operating Expenses a... $10.01 $10.26 $11.41 $10.81 Farebox Revenue a Total Operating Assistance a a Expenses and revenues are expressed in estimated year-of-expenditure dollars. Source: Washington County Highway Department and SEWRPC. operational expenses, revenues, and ridership associated with an extension to UWM. It does not assume any additional vehicles would be needed to add this extension to the existing route, as the vehicles assigned to the runs selected for this extension are completing their morning blocks, are just starting their afternoon blocks, or have additional room in their schedules. Table 36 displays the runs selected for this estimate, the time the Commuter Express would arrive or depart from UWM while classes are in session, and the current time the vehicle arrives or departs from the corner of E. Kilbourn Avenue and N. Milwaukee Street. It is important to note that UWM is currently accessible via transit from Washington County by transferring to Milwaukee County Transit System s (MCTS) Route 30, which stops at the Commuter Express stop on E. Wisconsin Avenue and N. Jackson Street every four to eight minutes during the morning and evening peaks and then takes 16 minutes to reach UWM. Survey results from fall 2012 indicate that no current Commuter Express riders are traveling to UWM. The removal of a transfer a nine- to 13-minute reduction in travel time and targeted marketing to those students could attract them to the Commuter Express. UWM representatives have indicated they would be interested in working with the County on this issue to reduce the demand for student parking on and near the campus. 78
97 Table 34 PROJECTED ANNUAL OPERATING EXPENSES, REVENUES, AND RIDERSHIP FOR THE WASHINGTON COUNTY COMMUTER EXPRESS SERVICE FOR THREE ALTERNATIVES: Services Provided Characteristics 2012 Projected Average for Actual Service No Change Alternative Actual Service No Change Alternative Revenue Vehicle Miles , , , ,800 Revenue Vehicle Hours... 9,300 9,300 6,800 6,900 Revenue Passengers Total , ,700 90,200 96,800 Passengers per Revenue Vehicle Mile Passengers per Revenue Vehicle Hour Expenses and Revenues Operating Expenses a... $1,276,700 $1,410,100 $1,031,100 $1,046,200 Farebox Revenues a , , , ,400 Percent of Expenses Recovered through Revenues Operating Assistance Federal a... $266,600 $271,400 $198,500 $201,400 State a , , , ,000 County a , , , ,400 Total a , , , ,900 Per Trip Data Operating Expenses a... $10.01 $11.98 $11.43 $10.81 Farebox Revenue a Total Operating Assistance a a Expenses and revenues are expressed in estimated year-of-expenditure dollars. Source: Washington County Highway Department and SEWRPC. Like other alternatives considered in this chapter for the Commuter Express, the data shown in this table assume that this is the only change made to the Commuter Express. Table 35 shows fewer revenue passengers in 2015 than are estimated to use the service in the four remaining years in this plan s timeframe. The ridership in 2015 is estimated to be about 45 percent of the total ridership projected for the route, as the awareness of the service grows and potential riders switch to the new service. A similar growth rate in revenue passengers is included in all other applicable expansion alternatives in this chapter. General Mitchell International Airport General Mitchell International Airport (GMIA) is the dominant passenger airport in the Region, and members of the Advisory Committee indicated an interest in analyzing the potential of the Commuter Express to provide service to the airport. Approximately 80,000 of the airport s passengers in 2011 were residents of Washington County, making the potential market for any airport service quite large. However, serving the airport would require significant additional funding from the County, as any service to the airport would likely need to be direct in order to compete for passengers. 79
98 Table 35 PROJECTED ANNUAL OPERATING EXPENSES, REVENUES, AND RIDERSHIP FOR EXTENDING THE WASHINGTON COUNTY COMMUTER EXPRESS DOWNTOWN ROUTE TO THE UNIVERSITY OF WISCONSIN-MILWAUKEE: Projected Characteristics Average Services Provided Revenue Vehicle Miles... 6,900 6,900 6,900 Revenue Vehicle Hours Revenue Passengers Total... 1,900 4,000 3,600 Passengers per Revenue Vehicle Mile... N/A N/A N/A Passengers per Revenue Vehicle Hour... N/A N/A N/A Expenses and Revenues Operating Expenses a... $43,700 $47,300 $45,500 Farebox Revenues a... 6,300 15,100 12,900 Percent of Expenses Recovered through Revenues Operating Assistance Federal a... $ 8,400 $ 9,100 $ 8,800 State a... 15,600 16,900 16,300 County a... 13,400 6,200 7,600 Total a... 37,400 32,200 32,600 Per Trip Data Operating Expenses a... $23.00 $11.83 $13.73 Farebox Revenue a Total Operating Assistance a a Expenses and revenues are expressed in estimated year-of-expenditure dollars. Source: Washington County Highway Department and SEWRPC. Table 36 WASHINGTON COUNTY COMMUTER EXPRESS DOWNTOWN ROUTE RUNS EXTENDED TO THE UNIVERSITY OF WISCONSIN-MILWAUKEE: MORNING RUNS Run Number Scheduled Arrival Time at E. Kilbourn Ave. and N. Milwaukee St.... 7:38 a.m. 7:58 a.m. 8:25 a.m. 9:00 a.m. 9:40 a.m. Scheduled Arrival Time at the University of Wisconsin-Milwaukee... 7:49 a.m. 8:09 a.m. 8:36 a.m. 9:11 a.m. 9:51 a.m. EVENING RUNS Run Number Scheduled Departure Time from the University of Wisconsin-Milwaukee... 11:49 a.m. 1:22 p.m. 2:20 p.m. 3:40 p.m. 3:52 p.m. 4:20 p.m. Scheduled Departure Time from E. Kilbourn Ave. and N. Milwaukee St :00 p.m. 1:33 p.m. 2:31 p.m. 3:51 p.m. 4:03 p.m. 4:31 p.m. Source: SEWRPC. 80
99 Table 37 PROJECTED ANNUAL OPERATING EXPENSES, REVENUES, AND RIDERSHIP FOR PROVIDING THE WASHINGTON COUNTY COMMUTER EXPRESS TO GENERAL MITCHELL INTERNATIONAL AIRPORT: Projected Characteristics Average Services Provided Revenue Vehicle Miles , , ,200 Revenue Vehicle Hours... 6,900 6,900 6,900 Revenue Passengers Total... 9,900 20,800 18,700 Passengers per Revenue Vehicle Mile Passengers per Revenue Vehicle Hour Expenses and Revenues Operating Expenses a... $1,005,200 $1,088,100 $1,046,200 Farebox Revenues a... 33,000 78,700 67,200 Percent of Expenses Recovered through Revenues Operating Assistance Federal a... $193,500 $ 209,500 $201,400 State a , , ,000 County a , , ,600 Total a ,200 1,009, ,000 Per Trip Data Operating Expenses a... $ $52.31 $60.65 Farebox Revenue a Total Operating Assistance a a Expenses and revenues are expressed in estimated year-of-expenditure dollars. Source: General Mitchell International Airport and SEWRPC. Wisconsin Coach Lines, Inc. currently provides service to GMIA from the Chicago Region, and Amtrak provides train service from downtown Chicago and the northern suburbs of Chicago. Both companies run service approximately every one to two hours from 6 a.m. to 10 p.m. every day. A similar level of service would be required in order for the Commuter Express to adequately attract passengers and assure them that they would not be stranded at the airport should their return flight be delayed. Providing this level of service would require round trips each weekday, and 8-12 round trips on the weekends. Table 37 displays estimated operating expenses, revenues, and ridership for a service that would travel between the three currently served Washington County park and ride lots and GMIA 10 times each weekday and eight times each weekend day. Lamers Bus Lines currently provides one round trip each day between Wausau and GMIA, which could provide some access to the airport for Washington County residents if the service served a park and ride lot in Washington County as part of its Wausau-to-Milwaukee service. Kohl s Department Stores Corporate Headquarters Kohl s Department Stores is a major regional employer, with more than 5,000 employees at its headquarters location in the Village of Menomonee Falls. Serving Kohl s would provide a transit option for many of the Washington County residents who work there, and would increase the number of jobs accessible via the Commuter Express. Should the County decide to serve Kohl s using the Commuter Express, it would likely need to be a new service, as modifying the Medical Center Route to serve Kohl s would add approximately 15 to 18 minutes to current travel time. Map 11 displays the suggested route, which would travel along USH 45 and 81

100 Map 11 Source: SEWRPC. 82
101 Table 38 PROJECTED ANNUAL OPERATING EXPENSES, REVENUES, AND RIDERSHIP FOR PROVIDING THE WASHINGTON COUNTY COMMUTER EXPRESS TO KOHL S DEPARTMENT STORES CORPORATE HEADQUARTERS: Projected Characteristics Average Services Provided Revenue Vehicle Miles... 30,900 30,900 30,900 Revenue Vehicle Hours Revenue Passengers Total... 1,600 3,300 3,000 Passengers per Revenue Vehicle Mile Passengers per Revenue Vehicle Hour Expenses and Revenues Operating Expenses a... $131,100 $141,900 $136,400 Farebox Revenues a... 5,300 12,500 10,600 Percent of Expenses Recovered through Revenues Operating Assistance Federal a... $ 25,200 $ 27,300 $ 26,300 State a... 46,900 50,700 48,800 County a... 53,700 51,400 50,800 Total a , , ,900 Per Trip Data Operating Expenses a... $81.94 $43.00 $49.79 Farebox Revenue a Total Operating Assistance a a Expenses and revenues are expressed in estimated year-of-expenditure dollars. Source: SEWRPC. Pilgrim Road. This alternative assumes two southbound trips in the morning and three northbound trips in the evening, each of which would take approximately 40 to 45 minutes. Providing this level of service would fully utilize one motorcoach, but less service would be needed to serve the Kohl s employees, as most employees at the corporate offices work from 8 a.m. to 5 p.m. every day. Table 38 shows estimated operating expenses, revenues, and ridership for this service. Predicting ridership for this service is difficult, as the relatively uncongested trip and free parking at Kohl s Corporate Headquarters reduce the incentives for drivers to consider using transit. However, Kohl s is currently experiencing a parking shortage, and is requiring a number of employees to park off-site and be shuttled to the corporate office. The estimate in this table conservatively assumes limited ridership on this potential service, despite the service providing access to over 5,000 jobs previously inaccessible by transit. Park Place Office Complex Similar to a service to Kohl s Corporate Headquarters, a stop at the Park Place office complex along W. Good Hope Road and USH 41 would make additional jobs accessible by transit for Washington County residents, with about 3,100 jobs located in the office complex. These jobs could be served by adding a stop to the Medical Center Route, with exiting and reentering the freeway estimated to add approximately five minutes to each run. 83
102 Table 39 PROJECTED ANNUAL OPERATING EXPENSES, REVENUES, AND RIDERSHIP FOR MODIFYING THE WASHINGTON COUNTY COMMUTER EXPRESS MEDICAL CENTER ROUTE TO SERVE THE PARK PLACE OFFICE COMPLEX: Projected Characteristics Average Services Provided Revenue Vehicle Miles... 3,600 3,600 3,600 Revenue Vehicle Hours Revenue Passengers Total ,500 1,300 Passengers per Revenue Vehicle Mile... N/A N/A N/A Passengers per Revenue Vehicle Hour... N/A N/A N/A Expenses and Revenues Operating Expenses a... $29,100 $31,500 $30,300 Farebox Revenues a... 2,300 5,700 4,800 Percent of Expenses Recovered through Revenues Operating Assistance Federal a... $ 5,600 $ 6,100 $ 5,800 State a... 10,400 11,300 10,800 County a... 10,800 8,400 8,900 Total a... 26,800 25,800 25,500 Per Trip Data Operating Expenses a... $41.57 $21.00 $24.63 Farebox Revenue a Total Operating Assistance a a Expenses and revenues are expressed in estimated year-of-expenditure dollars. Source: SEWRPC. The additional cost of providing this service (shown in Table 39) would be minimal, but ridership may be limited by the lack of pedestrian accommodations in the complex, which would make accessing the office buildings difficult for potential riders. If the County were able to coordinate the timing of this stop and an appropriately discounted transfer fare to allow passengers to use the Milwaukee County Transit System s Route 223 which provides shuttle circulator service in this office park more ridership might be generated by this service. Mayfair Mall and Offices As with the addition of a potential stop at the Park Place Office Complex, serving Mayfair Mall and the office buildings on mall property could be accomplished using a slight modification to the existing Medical Center Route, which would add three stops on and adjacent to mall property, and make an additional 9,000 jobs transitaccessible to Washington County residents. This modification would add five to 10 minutes to the travel time of the Route, depending on the congestion level on USH 45 during each trip. Table 40 displays the estimated operating expenses, revenues, and ridership for this route modification, which could result in noticeable ridership increases on the Medical Center Route. 84
103 Table 40 PROJECTED ANNUAL OPERATING EXPENSES, REVENUES, AND RIDERSHIP FOR MODIFYING THE WASHINGTON COUNTY COMMUTER EXPRESS MEDICAL CENTER ROUTE TO SERVE MAYFAIR MALL AND NEARBY OFFICES: Projected Characteristics Average Services Provided Revenue Vehicle Miles... 3,200 3,200 3,200 Revenue Vehicle Hours Revenue Passengers Total... 2,100 4,300 3,900 Passengers per Revenue Vehicle Mile... N/A N/A N/A Passengers per Revenue Vehicle Hour... N/A N/A N/A Expenses and Revenues Operating Expenses a... $43,700 $47,300 $45,500 Farebox Revenues a... 7,000 16,300 14,000 Percent of Expenses Recovered through Revenues Operating Assistance Federal a... $ 8,400 $ 9,100 $ 8,800 State a... 15,600 16,900 16,300 County a... 12,700 5,000 6,500 Total a... 36,700 31,000 31,500 Per Trip Data Operating Expenses a... $20.81 $11.00 $12.61 Farebox Revenue a Total Operating Assistance a a Expenses and revenues are expressed in estimated year-of-expenditure dollars. Source: SEWRPC. Washington County Commuter Express Service Originating in the City of Hartford As the evaluation of the Commuter Express under the Population Standard of Objective 1 in Chapter IV indicated, the County s rapid transit service covers many of the major population centers within the County. However, the largest population center this standard considers unserved is the City of Hartford and the surrounding area. Providing a Commuter Express-served park and ride lot in the City of Hartford and another lot in the Village of Slinger would place an additional 25,200 County residents within a three-mile drive of rapid transit service. Two alternatives presented below discuss various ways the County could consider providing this service, and include estimates of operating expenses, revenues, and ridership associated with each service. Both alternatives assume that the County could lease spare parking capacity at the shopping center anchored by Kmart off of E. Sumner Street in the City of Hartford and at Kettle Moraine Bowl off of E. Commerce Boulevard in the Village of Slinger. Provide Direct Service to Downtown Milwaukee Map 12 displays the proposed route for this service, originating at the Kmart shopping center on E. Sumner Street, stopping at Kettle Moraine Bowl on E. Commerce Boulevard, and then traveling south on USH 41. The route is proposed to stop at the Richfield Park and Ride and the Lannon Park and Ride, before traveling to Downtown Milwaukee. Under this service alternative, additional runs would be added to the Commuter Express, with four 85

104 Map 12 Source: SEWRPC. 86
105 Table 41 PROJECTED ANNUAL OPERATING EXPENSES, REVENUES, AND RIDERSHIP FOR PROVIDING WASHINGTON COUNTY COMMUTER EXPRESS SERVICE FROM HARTFORD TO DOWNTOWN MILWAUKEE: Projected Characteristics Average Services Provided Revenue Vehicle Miles... 77,800 77,800 77,800 Revenue Vehicle Hours... 3,000 3,000 3,000 Revenue Passengers Total... 10,600 22,200 20,000 Passengers per Revenue Vehicle Mile... N/A N/A N/A Passengers per Revenue Vehicle Hour... N/A N/A N/A Expenses and Revenues Operating Expenses a... $437,000 $473,100 $454,900 Farebox Revenues a... 35,400 84,000 71,800 Percent of Expenses Recovered through Revenues Operating Assistance Federal a... $ 84,100 $ 91,100 $ 87,600 State a , , ,600 County a , , ,900 Total a , , ,100 Per Trip Data Operating Expenses a... $41.23 $21.31 $24.67 Farebox Revenue a Total Operating Assistance a a Expenses and revenues are expressed in estimated year-of-expenditure dollars. Source: SEWRPC. morning trips into the City of Milwaukee and four evening trips returning to Slinger and Hartford. Table 41 shows estimated operating expenses, revenues, and ridership for this service, which would require three additional vehicles to operate. This table does not include estimates of the cost of leasing parking spots from the owners of the Kmart shopping center or Kettle Moraine Bowl. Providing this route could lead to a number of changes to the existing Commuter Express services. The 90 daily revenue passengers estimated for this route are the additional daily riders added to the Commuter Express service as a whole, and do not include the approximately 60 daily revenue passengers who would be expected to shift from the existing Downtown Route to this route. Therefore, providing this route will likely reduce the utilization of the West Bend to Downtown Route. With the expected reduction in ridership on the West Bend to Downtown Route, the County could consider reducing the number of trips originating in West Bend, therefore reducing the additional cost required to provide this service. In addition, this route may also allow the County to reduce service at the Richfield Park and Ride lot, redirecting some of the existing West Bend to Downtown runs to serve the new Jackson Park and Ride lot. Finally, providing additional service to the Lannon Park and Ride lot could generate additional demand for parking spaces at that lot, which is currently near capacity. The County may need to consider not providing additional service to the Lannon Park and Ride lot if it is determined that additional parking spaces would be needed. 87
106 Table 42 PROJECTED ANNUAL OPERATING EXPENSES, REVENUES, AND RIDERSHIP FOR PROVIDING WASHINGTON COUNTY COMMUTER EXPRESS SERVICE FROM HARTFORD TO THE RICHFIELD PARK & RIDE LOT: Projected Characteristics Average Services Provided Revenue Vehicle Miles... 60,000 60,000 60,000 Revenue Vehicle Hours... 2,000 2,000 2,000 Revenue Passengers Total... 13,000 27,100 24,500 Passengers per Revenue Vehicle Mile... N/A N/A N/A Passengers per Revenue Vehicle Hour... N/A N/A N/A Expenses and Revenues Operating Expenses a... $291,400 $315,400 $303,300 Farebox Revenues a... 43, ,500 87,800 Percent of Expenses Recovered through Revenues Operating Assistance Federal a... $ 56,100 $ 60,700 $ 58,400 State a , , ,400 County a... 87,700 39,400 48,700 Total a , , ,500 Per Trip Data Operating Expenses a... $22.42 $11.64 $13.44 Farebox Revenue a Total Operating Assistance a a Expenses and revenues are expressed in estimated year-of-expenditure dollars. Source: SEWRPC. Provide a Shuttle to Serve as a Feeder to Existing Washington County Commuter Express Services In order to avoid reducing the efficiency of the existing Commuter Express Downtown Route, and provide residents of the City of Hartford and Village of Slinger with more frequent service and easier access to the Medical Center Route, the County could consider providing a local shuttle service serving the two proposed park and ride lots along STH 60 that would be timed to meet the two existing routes at the Richfield Park and Ride. Although this would require passengers to transfer from one vehicle to another, it should generate a greater number of daily revenue passengers than providing a direct service to downtown, because of the additional frequency it would provide residents within its service area. Two vehicles operating this short route should be able to provide a connection to 22 of 26 runs to and from Milwaukee County. Table 42 shows the operating expenses, revenues, and ridership estimated for this service, and, similar to the other Hartford service alternative, the 110 estimated daily revenue passengers do not include the passengers who currently use the Commuter Express but might be expected to take advantage of this service. Reverse Commute Service from Milwaukee County to Employers in Washington County The fixed-route element of the Washington County Transit System was originally focused on providing commute services for individuals living in Milwaukee County and working in Washington County, but the services were canceled due to low ridership as the early 2000 s economic downturn reduced businesses demand for labor from 88
107 outside the County. The County could consider restoring some form of reverse commute service if businesses in the County indicate that they need a larger labor pool. In addition, the County could work with businesses to determine if several have existing employees who would have an interest in using any potential reverse commute service. If the County discovers that there would be a demand for such a service, these two alternatives represent examples of the service patterns it could consider. Service to the Germantown Industrial Park This alternative would utilize the Milwaukee County Transit System s BlueLine Express to bring Milwaukee County residents to its terminus in the Park Place complex, where riders could transfer to this service and travel northwest on USH 45, exiting at Lannon Road. This service would provide access to the Germantown Industrial Park, with stops scattered throughout the park. This industrial park was last served in 2005 by a shuttle operated by Washington County from Milwaukee County s Mill Road Transit Center on the corner of W. Mill Road and N. 76th Street. A similar level of service to that which was previously provided is proposed, with four morning trips and eight evening trips. It may make sense to operate this service with a smaller vehicle not currently in GoRiteway s fleet, so the County would need to include that in any consideration of this alternative. Map 13 provides an illustration of a potential routing for this service, and Table 43 for estimates of the operating expenses, revenues, and ridership associated with this alternative. It should be noted that because a transfer is required to use this service, it is assumed that the fare would be $1.00 per ride. Since the writing of this chapter of the report, Milwaukee County has implemented a service very similar to that which is described here. Service to the Germantown Industrial Park and West Bend via W. Fond du Lac Avenue The County could also consider a more expansive reverse commute service, picking up passengers from across northwestern Milwaukee County and providing access to both the Germantown Industrial Park and employment centers in the City of West Bend. This would provide passengers with an express service, and would provide a one-seat ride from many neighborhoods in Milwaukee County between Downtown Milwaukee and the far northwest side of Milwaukee County. Map 14 shows the potential route for this service alternative, traveling from Downtown Milwaukee to STH 145 via W. Fond du Lac Avenue. This service would stop at all intersections with Milwaukee County Transit Services, with each stop and the connecting service noted on the map. This service would provide relatively easy access to businesses in Washington County for a large portion of Milwaukee County residents. In some instances, there is time in the existing Commuter Express schedule for a vehicle to make this reverse commute trip without adding an additional vehicle. This interlining of three of the 10 one-way runs proposed for this service would reduce non-revenue vehicle hours and miles on both services. Table 44 displays the estimated operating expenses, revenues, and ridership for this alternative. Providing this service by reversing the existing Commuter Express Downtown Route (starting at the intersection of N. Milwaukee Street and E. Kilbourn Avenue, traveling west on E. Wisconsin Avenue to N. 35th Street, and then using IH 94 and USH 45 to return to Washington County), was also considered, but this would reduce ridership by requiring passengers to travel out of their way to board the route on W. Wisconsin Avenue east of N. 35th Street, and would not offer a significant savings in terms of travel times and operating expenses due to congestion on IH 94 and USH 45 between Downtown Milwaukee and W. Capitol Drive. Should the County decide to pursue both the potential Hartford to Downtown Route and providing a reverse commute service, it may make more sense to provide the reverse commute to Hartford rather than West Bend, given the larger demand for labor the businesses in Hartford are currently experiencing. The end of the route could provide direct service to these businesses, or rely on the County Shared-Ride Taxi to provide a connecting service. Fixed-Route Service between the City of West Bend and the City of Fond du Lac As part of this transit development plan, County staff requested that an alternative be included analyzing the costs and benefits of providing a service linking the West Bend and Kewaskum areas with the City of Fond du Lac, north of the County. This potential alternative would provide a connection to Fond du Lac s transit system and numerous educational facilities in the City of Fond du Lac, allowing numerous businesses, employers, and schools to become transit-accessible to Washington County residents. 89

108 Map 13 Source: SEWRPC. 90
109 Table 43 PROJECTED ANNUAL OPERATING EXPENSES, REVENUES, AND RIDERSHIP FOR PROVIDING LOCAL SHUTTLE SERVICE TO THE GERMANTOWN INDUSTRIAL PARK: Projected Characteristics Average Services Provided Revenue Vehicle Miles... 39,700 39,700 39,700 Revenue Vehicle Hours... 1,800 1,800 1,800 Revenue Passengers Total... 5,300 11,400 10,100 Passengers per Revenue Vehicle Mile Passengers per Revenue Vehicle Hour Expenses and Revenues Operating Expenses a... $171,000 $185,100 $178,000 Farebox Revenues a... 5,300 11,400 10,100 Percent of Expenses Recovered through Revenues Operating Assistance Federal a... $ 32,900 $ 35,600 $ 34,200 State a... 61,100 66,200 63,600 County a... 71,700 71,900 70,000 Total a... $165, , ,800 Per Trip Data Operating Expenses a... $32.26 $16.24 $19.12 Farebox Revenue a Total Operating Assistance a a Expenses and revenues are expressed in estimated year-of-expenditure dollars. Source: SEWRPC. Map 15 shows the proposed route, which could be branded and operated as part of the Washington County Commuter Express, with the same fare structure and vehicles. The morning route would begin at the former Gehl facility parking lot, located on the corner of Water Street and Wisconsin Street in the City of West Bend. The County could consider leasing some or all of the lot s more than 100 spaces from its current owner. The route would head north and pick up more riders on the north side of West Bend, where the County could consider leasing parking spaces from The Columbian Banquet Hall on Lighthouse Lane, and then pick up additional riders in Kewaskum, where the County could consider leasing parking spaces from a retail development along USH 45, such as the center anchored by Family Dollar. The proposed alternative would then travel to the City of Fond du Lac, providing a timed transfer to the Fond du Lac Transit system via their transfer zone on the corner of W. Rees Street and N. Macy Street. The route would then continue east, serving Winnebago Lutheran Academy, Moraine Park Technical College, Marian College, University of Wisconsin-Fond du Lac, and St. Mary s Springs High School. The evening route would travel in the opposite direction. The proposed service would have three one-way trips each weekday, one in the morning and two in the afternoon and evening, utilizing one operator vehicle. If this service is pursued by the County, the County should work with the City of Fond du Lac on offering a discounted or no-fare transfer to Fond du Lac Transit services. Table 45 91

110 Map 14 Source: SEWRPC. 92
111 Table 44 PROJECTED ANNUAL OPERATING EXPENSES, REVENUES, AND RIDERSHIP FOR PROVIDING REVERSE COMMUTE WASHINGTON COUNTY COMMUTER EXPRESS SERVICE TO THE GERMANTOWN INDUSTRIAL PARK AND THE CITY OF WEST BEND: Projected Characteristics Average Services Provided Revenue Vehicle Miles... 39,800 39,800 39,800 Revenue Vehicle Hours... 3,800 3,800 3,800 Revenue Passengers Total... 9,900 21,100 19,000 Passengers per Revenue Vehicle Mile Passengers per Revenue Vehicle Hour Expenses and Revenues Operating Expenses a... $382,400 $413,900 $398,000 Farebox Revenues a... 33,000 79,800 68,300 Percent of Expenses Recovered through Revenues Operating Assistance Federal a... $ 73,600 $ 79,700 $ 76,600 State a , , ,300 County a , , ,800 Total a , , ,800 Per Trip Data Operating Expenses a... $38.63 $19.62 $22.80 Farebox Revenue a Total Operating Assistance a a Expenses and revenues are expressed in estimated year-of-expenditure dollars. Source: SEWRPC. displays the estimated operating expenses, revenues, and ridership for this route. As the table indicates, this service is estimated to increase County levy funding by $57,900 in It is expected that the educational institutions served by the route would provide a significant portion of the ridership, and that additional ridership could be expected if the service were properly marketed to potential users, including coordination with significant destinations in Fond du Lac. However, it is unlikely that this service will capture the same proportion of overall travel as the existing Commuter Express Downtown Route does between West Bend and Downtown Milwaukee, as the cost of parking and highway congestion associated with traveling to Downtown Milwaukee incentivize higher transit use. SHARED-RIDE TAXI SERVICE ALTERNATIVES AND IMPROVEMENTS The following shared-ride taxi service modifications were analyzed as potential service alternatives and improvements for the Advisory Committee to consider including in the recommended transit system development plan. These alternatives are based on the evaluation of existing services in Chapter IV and the discussions of the Advisory Committee at a number of meetings, and include an analysis of a potential merger of the three sharedride taxi systems in Washington County, a potential merger of the Washington and Ozaukee shared-ride taxi services, and other potential service modifications. 93

112 Map 15 Source: SEWRPC. 94
113 Table 45 PROJECTED ANNUAL OPERATING EXPENSES, REVENUES, AND RIDERSHIP FOR PROVIDING WASHINGTON COUNTY COMMUTER EXPRESS SERVICE TO THE CITY OF FOND DU LAC: Projected Characteristics Average Services Provided Revenue Vehicle Miles... 30,400 30,400 30,400 Revenue Vehicle Hours... 1,000 1,000 1,000 Revenue Passengers Total... 2,300 4,900 4,400 Passengers per Revenue Vehicle Mile Passengers per Revenue Vehicle Hour Expenses and Revenues Operating Expenses a... $145,700 $157,700 $151,600 Farebox Revenues a... 7,700 18,500 15,800 Percent of Expenses Recovered through Revenues Operating Assistance Federal a... $ 28,000 $ 30,400 $ 29,200 State a... 52,100 56,400 54,200 County a... 57,900 52,400 52,400 Total a , , ,800 Per Trip Data Operating Expenses a... $63.35 $32.18 $37.42 Farebox Revenue a Total Operating Assistance a a Expenses and revenues are expressed in estimated year-of-expenditure dollars. Source: Washington County Highway Department and SEWRPC. No Changes to the Existing County Shared-Ride Taxi Services Under this alternative, the County could choose to continue the existing Shared-Ride Taxi service for the time period considered under this plan. The current service s ridership and revenue hours of service have stabilized, although costs are projected to continue increasing. This alternative also serves as the base against which the remaining fixed-route service alternatives can be considered. Table 46 shows the expected operating expenses, revenues, and ridership on the Shared-Ride Taxi, assuming that ridership remains stable at about the average of the past five years. Unless otherwise noted, this table and similar tables for each of the other taxi alternatives assume that operating expenses per service hour will grow at a rate of 2 percent each year, and that the percentage of operating expenses covered by Federal and State sources will remain approximately 63 percent. So that the fare stays constant in 2012 dollars, fare increases of $0.25 are assumed to occur at the beginning of 2016 and again at the beginning of If these assumptions prove accurate, the County can expect its level of funding to increase by about $85,000 between 2012 and Table 47 displays expected capital expenses and sources of funding for these expenses between 2015 and With no change to the system, the County can expect to continue to replace its vehicles on a regular schedule as they age. Although it is difficult to predict changes in the Federal programs, this table assumes that the historic 95
114 Table 46 PROJECTED ANNUAL OPERATING EXPENSES, REVENUES, AND RIDERSHIP FOR THE WASHINGTON COUNTY SHARED-RIDE TAXI SERVICE: Actual Projected Characteristics Average Services Provided Revenue Vehicle Miles... 1,258,900 1,282,900 1,282,900 1,282,900 Revenue Vehicle Hours... 60,300 61,100 61,100 61,100 Revenue Passengers Total... 92,900 95,400 95,400 95,400 Passengers per Revenue Vehicle Mile Passengers per Revenue Vehicle Hour Expenses and Revenues Operating Expenses a... $2,347,900 $2,524,700 $2,732,800 $2,627,700 Farebox Revenues a , , , ,000 Percent of Expenses Recovered through Revenues Operating Assistance Federal a... $ 408,200 $ 436,300 $ 472,200 $ 454,100 State a... 1,086,000 1,179,500 1,276,800 1,227,700 County a , , , ,900 Total a... 2,043,000 2,211,800 2,383,600 2,296,700 Per Trip Data Operating Expenses a... $25.27 $26.46 $28.65 $27.54 Farebox Revenue a Total Operating Assistance a a Expenses and revenues are expressed in estimated year-of-expenditure dollars. Source: Washington County Highway Department and SEWRPC. match of 80 percent Federal funding for capital expenses will be continued into the future. Over the five-year plan timeframe, approximately $1.07 million (in year-of-expenditure dollars) will be spent on new vehicles for the County Shared-Ride Taxi service, with $213,000 of that being County funds. This represents an expenditure of approximately $43,000 per year from 2015 to Increase Fares at a Rate Greater than Inflation on the County Shared-Ride Taxi Service Should the County need to reduce its level of assistance to the Shared-Ride Taxi service, the County would likely need to increase fares at a rate greater than inflation. Given that the operating expenses are a function of the amount of service provided, and that the amount of service provided by a shared-ride taxi service is dependent on the number of rides provided, the County would need to increase fares in order to reduce its expenses. Raising fares would decrease the amount of operating assistance per revenue passenger, and it would also slightly discourage ridership as the service becomes more expensive to its users. Without savings from changes in operating procedures or lower wages and benefits for the taxi operators, raising fares is the County s only option to reduce its level of operating assistance. Table 48 displays expected operating expenses, revenues, and ridership under an alternative that would hold the County s level of operating assistance flat between 2012 and As discussed under the no change alternative, raising fares at the rate of inflation would result in an average fare increase of $0.25 in 2016, and 96
115 Table 47 PROPOSED CAPITAL EQUIPMENT EXPENDITURES FOR THE WASHINGTON COUNTY SHARED-RIDE TAXI SYSTEM: Year Equipment or Project Description Quantity Unit Cost a Total Cost a 2015 Replacement of Minibus with Lift... 3 $49,900 $149,700 Replacement of Minivan with Ramp ,100 74,200 Subtotal $223, Replacement of Minibus with Lift... 3 $50,900 $152,700 Replacement of Sedan ,600 43,200 Subtotal $195, Replacement of Minibus with Lift... 4 $51,900 $207,600 Replacement of Minivan with Ramp ,600 38,600 Subtotal $246, Replacement of Minibus with Lift... 3 $52,900 $158,700 Subtotal $158, Replacement of Minibus with Lift... 3 $54,000 $162,000 Replacement of Minivan with Ramp ,200 80,400 Subtotal $242,400 Total Capital Project Costs $1,067,100 Federal Capital Assistance Funds $854,000 Local Share of Costs 213,100 Average Annual Costs over Planning Period Total Costs... $213,000 Federal Share ,000 Local Share... 43,000 a Costs are expressed in estimated year of expenditure dollars. Source: Washington County Transit System and SEWRPC. again in Holding County operating assistance under the 2012 level of $548,800 would require the County to increase fares an average of $0.50 in 2015, $0.25 in 2017, $0.25 in 2018, and $0.25 in Rather than average fares increasing $0.50 over the plan timeframe, this alternative would result in average fares increasing $1.25 over the plan timeframe. Due to the increase in fares, 88,000 revenue passengers are estimated to use the service in ,400 fewer revenue passengers than under to the alternative that increases fares at the rate of inflation. Fewer service hours could also lead to an increased cost per revenue service hour at the expiration of the County s existing service contract, as the operator may need to distribute fixed costs over fewer service hours. Merging the Municipal and County Shared-Ride Taxi Services Integrating either or both the Hartford City Taxi and the West Bend Taxi with the County Shared-Ride Taxi service has been discussed in recent years as the cost of providing the services has changed and State funding has been reduced. Due to the differing levels of service between the County Shared-Ride Taxi and the two municipal taxi systems, two service alternatives are described in this section. The cost and ridership estimates included with each alternative assume that both municipalities would discontinue their taxi services, with the County expanding its service to include trips that both begin and end within the service areas of the municipal taxi systems. Should the City of Hartford or the City of West Bend decide to discontinue their taxi systems, the County could consider a number of service levels, with two potential alternatives discussed in the remainder of this section. Any plan to merge with the Hartford City Taxi must ensure that Federal labor protection (former Section 13(c)) agreements with union members are not violated, which could jeopardize Federal funding for the County s transit system. 97
116 Table 48 PROJECTED ANNUAL OPERATING EXPENSES, REVENUES, AND RIDERSHIP FOR THE WASHINGTON COUNTY SHARED-RIDE TAXI SERVICE IF FARES ARE INCREASED AT A RATE GREATER THAN INFLATION: Actual Projected Characteristics Average Services Provided Revenue Vehicle Miles... 1,258,900 1,231,500 1,183,400 1,214,400 Revenue Vehicle Hours... 60,300 58,600 56,300 57,800 Revenue Passengers Total... 92,900 91,600 88,000 90,300 Passengers per Revenue Vehicle Mile Passengers per Revenue Vehicle Hour Expenses and Revenues Operating Expenses a... $2,347,900 $2,421,400 $2,518,100 $2,484,700 Farebox Revenues a , , ,600 $ 368,000 Percent of Expenses Recovered through Revenues Operating Assistance Federal a... $ 408,200 $ 418,400 $ 435,100 $ 429,400 State a... 1,086,000 1,131,300 1,176,500 1,160,800 County a , , , ,500 Total a... 2,043,000 2,075,300 2,119,500 2,116,700 Per Trip Data Operating Expenses a... $25.27 $26.44 $28.61 $27.53 Farebox Revenue a Total Operating Assistance a a Expenses and revenues are expressed in estimated year-of-expenditure dollars. Source: Washington County Highway Department and SEWRPC. Existing Level of Service Alternative This alternative would maintain the existing level of service provided by the municipal taxi systems by serving trips within the City of Hartford and within the City of West Bend as they are requested, rather than through advanced reservation. This alternative assumes that the County service would need to provide nearly the same number of rides as all three systems currently provide, with a slight drop in ridership expected due to the higher fares on the County Shared-Ride Taxi. The estimated 136,900 additional riders would require an additional 40,100 vehicle hours of service. Table 49 contains an estimate of the ridership, operating expenses, and revenues, and County funding assistance required to provide this level of service. Compared to operating the existing service, under this alternative County levy funding would need to increase by $155,700 or 26.1 percent in Efficiency would be gained by combining the services, allowing the County Shared-Ride Taxi operator to increase its passengers per revenue vehicle mile and passengers per revenue vehicle hour slightly as more trips in a concentrated area would result in more passengers in each vehicle at a time. The additional trips are also expected to be much shorter on average than those currently made on the County Shared-Ride Taxi service, which also would contribute to increased passengers per revenue vehicle mile and passenger per revenue vehicle hour. This would result in an average 5.7 percent increase in expenses recovered through fare revenues. 98
117 Table 49 PROJECTED ANNUAL OPERATING EXPENSES, REVENUES, AND RIDERSHIP FOR MAINTAINING THE EXISTING LEVEL OF SERVICE WITHIN THE CITIES OF HARTFORD AND WEST BEND FOLLOWING A MERGER OF THE MUNICIPAL TAXI SYSTEMS WITH THE WASHINGTON COUNTY SHARED-RIDE TAXI SERVICE: Projected b Characteristics Average Services Provided Revenue Vehicle Miles... 1,704,100 1,704,100 1,704,100 Revenue Vehicle Hours , , ,200 Revenue Passengers Total , , ,800 Passengers per Revenue Vehicle Mile Passengers per Revenue Vehicle Hour Expenses and Revenues Operating Expenses a... $4,181,600 $4,526,300 $4,352,200 Farebox Revenues a , , ,400 Percent of Expenses Recovered through Revenues Operating Assistance Federal a... $ 722,600 $ 782,100 $ 752,100 State a... 1,953,600 2,114,700 2,033,400 County a , , ,400 Total a... 3,427,900 3,685,200 3,554,800 Per Trip Data Operating Expenses a... $18.20 $19.70 $18.94 Farebox Revenue a Total Operating Assistance a a Expenses and revenues are expressed in estimated year-of-expenditure dollars. b These projected operating expenses, revenues, and ridership can be compared to the County s 2012 annual operating expenses, revenues and ridership for the existing County Shared-Ride Taxi System in Table 46 on page 96. Source: Specialized Transport Services, Inc. and SEWRPC. It is assumed that the City of West Bend, the City of Hartford, and Washington County would come to an agreement regarding the vehicles currently owned by each municipality, so that the County does not need to make a significant capital purchase to add capacity to its taxi fleet. As it seems unlikely that either municipality, should it choose to eliminate its taxi service, would be able to contribute funding to the County taxi system, it may be appropriate for municipalities to transfer the vehicles associated with their systems to the County for the use of the County Shared-Ride Taxi service. It is important to emphasize the difference in operations that providing demand-response service would necessitate. A small secondary taxi depot would likely need to be based in the City of Hartford, and the existing depot in the City of West Bend would need to have vehicle operators available on standby, ready to quickly respond to residents requests for service. This would require a different staff scheduling approach than is currently used for the County s advanced-reservation service. 99
118 Table 50 PROJECTED ADDITIONAL ANNUAL OPERATING EXPENSES, REVENUES, AND RIDERSHIP FOR PROVIDING DEMAND-RESPONSE SHARED-RIDE TAXI SERVICE WITHIN OTHER MUNICIPALITIES IN WASHINGTON COUNTY: 2015 Municipality Operating Expenses Farebox Revenues Operating Assistance Federal State County Total Addison... $ 190,200 $ 34,300 $ 32,900 $ 88,900 $ 34,100 $ 155,900 Barton ,500 25,900 24,800 67,000 25, ,600 Erin... 37,400 6,700 6,500 17,500 6,700 30,700 Farmington... 75,100 13,500 13,000 35,100 13,500 61,600 Germantown (Village)... 1,076, , , , , ,400 Germantown (Town)... 13,800 2,500 2,400 6,400 2,500 11,300 Hartford (Town) ,400 35,400 33,900 91,800 35, ,000 Jackson (Village) ,200 66,400 63, ,000 66, ,800 Jackson (Town) ,900 40,500 38, ,100 40, ,400 Kewaskum (Village) ,900 39,300 37, ,800 39, ,600 Kewaskum (Town)... 57,300 10,300 9,900 26,800 10,300 47,000 Newburg... 68,200 12,300 11,800 31,900 12,200 55,900 Polk ,200 38,600 37, ,100 38, ,600 Richfield , , , , , ,400 Slinger ,400 50,200 48, ,100 50, ,200 Trenton ,500 46,400 44, ,300 46, ,100 Wayne ,000 21,300 20,400 55,100 21,200 96,700 West Bend (Town) ,800 46,800 44, ,400 46, ,000 Total for These Municipalities $4,414,900 $ 795,700 $ 763,000 $2,062,800 $ 793,400 $3,619,200 Total for Entire County $8,596,500 $1,549,400 $1,485,600 $4,016,400 $1,545,100 $7,047,100 Source: Specialized Transport Services, Inc. and SEWRPC. Should the County elect to continue the higher level of service within the Cities of Hartford and West Bend, it may also be necessary to consider a similar level of service within the Village of Germantown, and possibly the Villages of Jackson, Kewaskum, Richfield, and Slinger. Additional municipalities in the County could also request this higher level of service. Table 50 contains an estimate of the operating expenses, revenues, and assistance for 2015 associated with providing demand-response service in each of the municipalities of the County, assuming that those residents use the service at a similar rate as is expected for the residents of the Cities of West Bend and Hartford in Table 49. This estimate does not include the capital costs of additional vehicles to provide this higher level of service. Providing demand-response service to many municipalities in the County would likely introduce significant complexity and additional cost into the system, but it would bring the shared-ride taxi service in line with the recommendation of the Service Frequency and Availability Design and Operating Standard under Objective No. 2 of the Public Transit Service Objectives, which recommends a maximum of 45 minutes in urban areas between a resident placing a request for service and the arrival of the taxi. Reduced Level of Service Alternative Under this alternative, the County would extend the service area of the Shared-Ride Taxi service to cover trips with both ends inside each city, but the entire county-wide service would remain advanced reservation. This would provide a lower level of service to the residents of the Cities of Hartford and West Bend, but would treat all areas of the County equally. This lower level of service would likely reduce demand for the service, subsequently reducing the number of rides provided within Hartford and within West Bend compared to the existing municipal taxi services. 100
119 Table 51 PROJECTED ANNUAL OPERATING EXPENSES, REVENUES, AND RIDERSHIP FOR PROVIDING A UNIFORM LEVEL OF SERVICE COUNTY-WIDE FOLLOWING A MERGER OF THE MUNICIPAL TAXI SYSTEMS WITH THE WASHINGTON COUNTY SHARED-RIDE TAXI SERVICE: Projected b Characteristics Average Services Provided Revenue Vehicle Miles... 1,434,000 1,434,000 1,434,000 Revenue Vehicle Hours... 85,200 85,200 85,200 Revenue Passengers Total , , ,800 Passengers per Revenue Vehicle Mile Passengers per Revenue Vehicle Hour Expenses and Revenues Operating Expenses a... $3,518,900 $3,809,000 $3,662,500 Farebox Revenues a , , ,600 Percent of Expenses Recovered through Revenues Operating Assistance Federal a... $ 608,100 $ 658,200 $ 632,900 State a... 1,644,000 1,779,600 1,711,100 County a , , ,900 Total a... 2,952,100 3,176,600 3,062,900 Per Trip Data Operating Expenses a... $20.36 $22.04 $21.20 Farebox Revenue a Total Operating Assistance a a Expenses and revenues are expressed in estimated year-of-expenditure dollars. b These projected operating expenses, revenues, and ridership can be compared to the County s 2012 annual operating expenses, revenues and ridership for the existing County Shared-Ride Taxi System in Table 46 on page 96. Source: Specialized Transport Services, Inc. and SEWRPC. A similar service change recently occurred in Ozaukee County, when the City of Port Washington chose to discontinue its municipal taxi service on January 1, Following this change, a number of riders chose to use a new local privately owned and operated taxi service, while approximately 55 percent of riders chose to use the Ozaukee County Shared-Ride Taxi service. The operator of the Ozaukee County Shared-Ride Taxi service experienced an increase in passengers per revenue mile and passengers per revenue vehicle hour, for similar reasons to those discussed in the previous alternative. Using this nearby experience as a guide, Table 51 displays the estimated operating expenses, revenues, and ridership for the County Shared-Ride Taxi service under this alternative. This alternative is estimated to increase the County funding assistance for the Shared-Ride Taxi by $104,000, or 17 percent, in The increased efficiency of the service would result in an approximately 4 percent increase in the amount of expenses recovered through fares. Similar to the previous alternative, this alternative assumes no significant new capital expenditures for the County, as the ownership of the City of Hartford and City of West Bend taxi vehicles would be transferred to the County. 101
120 Table 52 PROJECTED ADDITIONAL ANNUAL OPERATING EXPENSES, REVENUES, AND RIDERSHIP FOR A MERGED OZAUKEE COUNTY-WASHINGTON COUNTY SHARED-RIDE TAXI SERVICE: Projected Characteristics Average Services Provided Revenue Vehicle Miles... 95,500 95,500 95,500 Revenue Vehicle Hours... 4,500 4,500 4,500 Revenue Passengers Total... 7,100 7,100 7,100 Passengers per Revenue Vehicle Mile Passengers per Revenue Vehicle Hour Expenses and Revenues Operating Expenses a... $185,900 $201,300 $193,500 Farebox Revenues a... 23,300 26,000 24,600 Percent of Expenses Recovered through Revenues Operating Assistance Federal a... $ 32,100 $ 34,800 $ 33,400 State a... 86,900 94,000 90,400 County a... 43,600 46,500 45,100 Total a , , ,900 Per Trip Data Operating Expenses a... $26.18 $28.35 $27.26 Farebox Revenue a Total Operating Assistance a a Expenses and revenues are expressed in estimated year-of-expenditure dollars. Source: Specialized Transport Services, Inc. and SEWRPC. Merging the Ozaukee County and Washington County Shared-Ride Taxi Services Across the Region, people reliant on transit services express a repeated desire for better connections across county and municipal borders. Given that Ozaukee County and Washington County operate very similar taxi services, a discussion of merging these two services was requested by the Advisory Committee and is included here. Any merger of the two systems would provide passengers with greater mobility, making many destinations in the two counties more accessible. However, merging the services would require the service hours and fare policies for the two services to be unified, and intergovernmental agreements detailing arrangements for providing funding, sharing assets, and managing the merged service would need to be negotiated. This potential merger would likely result in an increase in travel, and potentially longer trips, as passengers would be able to freely cross county lines rather than transferring only at the current transfer point in the Village of Newburg. Based on a comparison of existing travel between the two counties using all types of transportation and existing use of the Washington County Shared-Ride Taxi to travel to Ozaukee County, merging the two systems is estimated to generate an additional 7,100 passenger trips each year. The estimates of additional operating expenses, revenues, and ridership displayed in Table 52 would need to be allocated between the budgets of the two counties through a method detailed in the required intergovernmental agreements. 102
121 Providing a Secondary Washington County Shared-Ride Taxi Depot in the Village of Germantown Developing a secondary depot for the Shared-Ride Taxi service in or near the Village of Germantown may reduce the operating expenses of this service. An analysis of existing taxi logs indicates that the County should be able to reduce the number of vehicle hours and vehicle miles traveled by the Shared-Ride Taxi vehicles by storing some vehicles in Germantown each night and having some employees start their shifts at this new depot instead of at the existing location in the City of West Bend. A second taxi depot located in or near the Village of Germantown should reduce vehicle hours by approximately 700 hours per year, by eliminating the travel time to and from the existing depot when the first or last trip of the day is in Germantown or a nearby community. This should allow the County to reduce local funding by an average of $8,100 annually from 2015 to Despite this apparent cost savings, there will likely be some costs that are difficult to estimate as part of the addition of any second depot: Shared-Ride Taxi vehicles currently refuel at the County s refueling station in West Bend. The County would likely need to refuel the vehicles somewhere in Germantown, which would possibly have a higher unit fuel price. Although the Shared-Ride Taxi digital dispatching system would allow the dispatcher to manage the vehicles based in Germantown from the West Bend depot, face-to-face meetings and interactions with the service manager would likely still be necessary. This could introduce staffing complexities, with the County either paying for drivers to travel to West Bend to meet with the service manager, or rotating the drivers who start their shifts in Germantown. Given the location that the vehicles are currently maintained (West Bend), the vehicles located in Germantown would need to travel to West Bend for any scheduled maintenance or repairs, reducing County savings from this secondary depot. This could be done by coordinating the trips to and from West Bend with a passenger s trip request, but careful planning would be required. The County would need to lease space for the storage of the vehicles and any associated equipment. To provide sufficient capacity to serve the southeastern part of Washington County, the County would likely need to purchase an additional vehicle to keep at the secondary taxi depot in Germantown. The capital cost for this would range from $37,000 to $50,000 for an accessible vehicle. It is important to note that a secondary depot would not increase service quality or quantity for the residents of Germantown and the surrounding communities. As the County Shared-Ride Taxi system is an advancedreservation service, trips from, to, and within the Germantown area would not change under this alternative. Extending Washington County Shared-Ride Taxi Service Hours Another unmet transportation need that has been raised during this planning effort is the lack of transportation options for individuals outside of the current shared-ride taxi service hours, such as those who are unable to drive to receive a safe ride home from a restaurant, bar, or tavern. To address this concern, the following analysis considers the potential extension of the service hours of the Shared-Ride Taxi until 1 a.m. on Saturday and Sunday mornings. Providing this service would help alleviate a public safety concern, taking unsafe drivers off the County s roads, and would meet the needs of individuals who have limited options for traveling late at night. Requests for safe rides home from dining and entertainment establishments are unlikely to be planned events, which means they would not be satisfactorily served by an advanced-reservation service. Therefore, this alternative proposes providing a demand-response service from the end of the current service hours on Friday and Saturday evenings, 10:00 p.m., until 1 a.m. the following morning. These three additional service hours would have operators and a dispatcher available to take any requests for service from 10:00 p.m. until 12:30 a.m. The estimated operating expenses assume that only two operators would be needed. Table 53 provides estimated operating expenses, revenues, and ridership for this service. 103
122 Table 53 PROJECTED ADDITIONAL ANNUAL OPERATING EXPENSES, REVENUES, AND RIDERSHIP FOR PROVIDING EXTENDED SERVICE HOURS OF THE WASHINGTON COUNTY SHARED-RIDE TAXI SERVICE: Projected Characteristics Average Services Provided Revenue Vehicle Miles... 14,000 14,000 14,000 Revenue Vehicle Hours... 1,000 1,000 1,000 Revenue Passengers Total... 1,040 1,040 1,000 Passengers per Revenue Vehicle Mile Passengers per Revenue Vehicle Hour Expenses and Revenues Operating Expenses a... $41,300 $44,700 $43,000 Farebox Revenues a... 3,400 3,800 3,600 Percent of Expenses Recovered through Revenues Operating Assistance Federal a... $ 7,100 $ 7,700 $ 7,400 State a... 19,300 20,900 20,100 County a... 11,500 12,300 11,900 Total a... 37,900 40,900 39,400 Per Trip Data Operating Expenses a... $39.71 $42.98 $41.33 Farebox Revenue a Total Operating Assistance a a Expenses and revenues are expressed in estimated year-of-expenditure dollars. Source: Specialized Transport Services, Inc. and SEWRPC. CONCLUSION The alternatives discussed in this chapter deserve the Advisory Committee s full consideration, but very few would be able to be implemented without additional Washington County funding. Further discussion between the County and Specialized Transport Services, Inc. may confirm that a second taxi depot will reduce County funding, and raising fares or reducing service will also reduce County funding. Serving Mayfair Mall and offices nearby could make the Medical Center Route more efficient, increasing the percentage of operating expenses recovered through passenger revenues. A number of the alternative fixed-route services could be initiated using CMAQ funding, allowing the County to experiment with new services without a substantial or possibly any investment of County funds for the first three years of operation. In particular, service from the City of Hartford, service to Kohl s Department Stores Corporate Headquarters, service to General Mitchell International Airport, and the reverse commute services could be initiated in this fashion. As the County considers these alternatives and the recommended transit plan that results from this process, it will need to balance the needs of its citizens and the desire for an efficient, financially sustainable transit system. 104
123 Chapter VI RECOMMENDED TRANSIT SERVICE PLAN FOR THE WASHINGTON COUNTY TRANSIT SYSTEM INTRODUCTION AND SUMMARY This chapter describes the recommended transit service plan for the Washington County Transit System, as determined by the Advisory Committee guiding the plan following public input in March The recommended plan contains elements that should be implemented between 2015 and 2019 depending on the amount of funding the County has available for transit services. The recommended plan encourages the further development of transit service in Washington County within the framework of the transit element of the regional transportation plan, which proposes a substantial improvement and expansion of transit service in Southeastern Wisconsin over the next 20 years. This chapter also lists transit service alternatives that could be explored further to determine if they warrant implementation, and alternatives that should not be considered for implementation. Future expenses, revenues, and ridership for the transit system under each funding scenario or element of the funding scenario are included in this chapter. Summary of the Recommended Transit Services if Funding is Maintained If funding for the transit system remains relatively stable during this plan s timeframe, the following changes to the transit system are recommended: Extending the Commuter Express Downtown Route to the Schlitz Park office complex; Modifying the Commuter Express Medical Route to serve the Summit Place office complex; Coordinating with the Milwaukee County Transit System (MCTS) to allow free or reduced-fare transfers between the Commuter Express routes and MCTS services; and A fare increase of $0.25 in 2016 and 2019 for both the Shared-Ride Taxi and the Commuter Express services, which would raise fares at the rate of inflation for the duration of this plan. Summary of the Recommended Transit Services if Funding is Reduced If the County is unable to maintain existing funding levels, or if costs grow more quickly than projected, the following changes to the transit system are recommended: Increasing fares at a rate faster than inflation; and Eliminating the lowest performing runs from both Commuter Express routes. 105
124 Summary of the Recommended Transit Services if Funding is Increased If more funding becomes available for transit services in Washington County, the following changes to the transit system are recommended: Adding vehicles and runs to the Commuter Express to meet demand, increase service hours, and increase frequency; Connecting the City of Hartford and the Village of Slinger to the Richfield Park and Ride Lot and the existing Commuter Express services; Providing a reverse commute service connecting employers in Washington County with employees from Milwaukee County; and Extending the service hours of the Shared-Ride Taxi to provide service until 3 a.m. on weekend mornings. Summary of the Transit Services Requiring Further Study Implementing the following transit services is complicated by certain factors, and therefore further study is recommended before determining if implementation is appropriate: Extending Commuter Express service to the University of Wisconsin-Milwaukee; Providing an additional evening run on the Commuter Express Medical Center Route by including Medical Center Route stops on a Downtown Route run; and Merging the Washington County Shared-Ride Taxi service with the Ozaukee County Shared-Ride Taxi service. Summary of the Transit Services Not Recommended for Implementation or Further Study Due to high cost relative to projected ridership, the following transit services are not recommended for implementation or further study: Eliminating the Commuter Express Medical Center Route; Providing Commuter Express service to General Mitchell International Airport; Providing Commuter Express service from the City of West Bend to the City of Fond du Lac; Providing Commuter Express service to Kohl s Corporate Headquarters; Modifying the Commuter Express Medical Center Route to stop at the Park Place office complex; Modifying the Commuter Express Medical Center Route to stop at Mayfair Mall and nearby offices; Providing a Secondary Taxi Depot in or near the Village of Germantown; Providing county-sponsored demand-response shared-ride taxi service in and around the Villages of Germantown and Richfield; and Providing county-wide demand-response shared-ride taxi service. 106
125 RECOMMENDED TRANSIT SERVICES IF FUNDING IS MAINTAINED If Washington County chooses to maintain funding for the transit system at a relatively constant level between 2015 and 2019, and there are no significant changes to State and Federal funding, the following changes to the transit system are recommended: Extending the Commuter Express Downtown Route from N. Milwaukee St. and E. Kilbourn Avenue to N. 2nd Street and W. Cherry Street, serving the Schlitz Park office complex and its 4,500 employees; Modifying the Commuter Express Medical Route to serve the Summit Place office complex, located at S. 70th Street and W. Washington Street in West Allis; Coordinating with the Milwaukee County Transit System (MCTS) to allow free or reduced-fare transfers between the Commuter Express routes and MCTS services and exploring the adoption of a fare card system compatible with the MCTS M-Card; Coordinating with Greyhound Bus Lines, Inc. to add a stop at the Richfield Park and Ride Lot to their two daily round-trips between Green Bay and Milwaukee that travel in the USH 41 corridor; and A fare increase of $0.25 in 2016 and 2019 for both the Shared-Ride Taxi and the Commuter Express services, which would raise fares at the rate of inflation for the duration of this plan. Other than these changes, this plan recommends that existing Shared-Ride Taxi and Commuter Express services continue to operate the same as they do currently. Service to Schlitz Park Schlitz Park has recently announced a number of new tenants, some of which are moving from areas currently served by the Commuter Express, including W. Wisconsin Avenue and the Milwaukee County Research Park. Adding a stop at Schlitz Park should add about three to four minutes to the Downtown Route, with the buses traveling from their current terminus to W. Cherry Street and N. 2nd Street in the center of the Schlitz Park campus. This additional stop could be added with minimal changes to the existing schedule for the Downtown Route, but a significant number of additional riders could lead to overcrowding. This recommended service change would provide improved transit access for Washington County residents to the 4,500 jobs located at Schlitz Park. Map 16 shows the Downtown Route with the addition of a stop at Schlitz Park. Service to Summit Place The Summit Place office complex, located at S. 70th Street and W. Washington Street on land that was formerly an Allis-Chalmers plant, is another significant employment site that could be served by the Commuter Express with only a minor route modification. A number of additional office buildings are located in the area, and a stop at S. 70th Street and W. Washington Street could be served by routing the Medical Center Route on S. 70th Street instead of S. Hawley Road. Map 17 shows the Medical Route with the addition of the recommended stop at Summit Place. This rerouting would add less than two minutes to the travel time of the existing Medical Center Route. Ridership, Expenses, and Revenues Including all recommended service changes, the forecasted service levels, ridership, operating expenses, and operating revenues for the Washington County Transit System under this recommended plan are shown in Table 54. If this recommended plan is implemented, the transit system is forecast to see a slight increase in ridership due to the addition of stops at Schlitz Park and Summit Place, and the amount of operating assistance contributed by the County is projected to increase marginally due to the continued growth in costs associated with providing the Shared-Ride Taxi service. As this funding scenario assumes no significant changes in County, State, or Federal funding, it recommends that the County continue its current practice of replacing four or five Shared-Ride Taxi vehicles a year and including operator-owned vehicles in its contract for the Commuter Express. The capital expenses associated with this recommended plan are shown in Table

126 Source: SEWRPC. 108 Map 16

127 Map 17 Source: SEWRPC. 109
128 Table 54 PROJECTED ANNUAL OPERATING EXPENSES, REVENUES, AND RIDERSHIP FOR THE WASHINGTON COUNTY TRANSIT SYSTEM IF FUNDING IS MAINTAINED: Projected Characteristics Average Services Provided Revenue Vehicle Miles... 1,531,800 1,531,800 1,531,800 Revenue Vehicle Hours... 70,400 70,400 70,400 Revenue Passengers 218, , ,900 Expenses and Revenues Operating Expenses a... $3,879,500 $4,199,300 $4,037,800 Farebox Revenues a , , ,500 Percent of Expenses Recovered through Revenues Operating Assistance Federal a... $ 697,100 $ 754,500 $ 725,500 State a... 1,663,800 1,801,100 1,731,800 County a , , ,000 Total a... 3,156,400 3,395,400 3,274,300 a Expenses and revenues are expressed in estimated year-of-expenditure dollars. Source: SEWRPC. RECOMMENDED TRANSIT SERVICES IF FUNDING IS REDUCED If Washington County chooses to reduce funding for transit service, or is unable to increase funding in response to a decrease in State or Federal funding, the County should prioritize raising fares to fill the budget gap before considering reducing service. If reducing service is necessary, the County could reduce costs further and preserve more service by eliminating the lowest performing runs on both the Medical Center Route and the Downtown Route. Based on ridership information from 2012, eliminating the lowest performing runs would result in each route being reduced by four runs each day. Unless ridership on the Shared-Ride Taxi service declines more significantly than expected following fare increases, it is expected that the Transit System s capital needs would remain unchanged from those shown in Table 55. Increasing Fares at a Rate Faster than Inflation During the public comment period on the alternatives for this plan, residents of Washington County indicated a strong preference for raising fares rather than reducing transit service if the County needs to reduce funding for the transit system. Increasing fares would likely reduce ridership slightly, so each increase in fares would generate less additional revenue for the County. Increasing fares $0.25 on the Commuter Express would be expected to reduce the required amount of County assistance by approximately $20,000, while increasing fares $0.25 on the Shared-Ride Taxi would be expected to reduce the required amount of County assistance by approximately $35,000. Eliminate the Lowest Performing Commuter Express Runs A number of residents commented that their quality of life would be dramatically decreased by the elimination of the Commuter Express Medical Center Route. In addition, the alternatives analysis in Chapter V of this report indicated that the County could expect to save more if it distributed any service cuts across both lines and focused on eliminating the runs with the least ridership. Based on ridership data from 2012, there are four runs on each route that average less than 10 passengers a day. Table 56 shows the forecast service levels, ridership, operating 110
129 Table 55 CAPITAL EQUIPMENT EXPENDITURES FOR THE WASHINGTON COUNTY SHARED-RIDE TAXI SYSTEM: Year Equipment or Project Description Quantity Unit Cost a Total Cost a 2015 Replacement of Minibus with Lift... 3 $49,900 $149,700 Replacement of Minivan with Ramp ,100 74,200 Subtotal $223, Replacement of Minibus with Lift... 3 $50,900 $152,700 Replacement of Sedan ,600 43,200 Subtotal $195, Replacement of Minibus with Lift... 4 $51,900 $207,600 Replacement of Minivan with Ramp ,600 38,600 Subtotal $246, Replacement of Minibus with Lift... 3 $52,900 $158,700 Subtotal $158, Replacement of Minibus with Lift... 3 $54,000 $162,000 Replacement of Minivan with Ramp ,200 80,400 Subtotal $242,400 Total Capital Project Costs $1,067,100 Federal Capital Assistance Funds $854,000 Local Share of Costs 213,100 Average Annual Costs over Planning Period Total Costs... $213,000 Federal Share ,000 Local Share... 43,000 a Costs are expressed in estimated year of expenditure dollars. Source: Washington County Transit System and SEWRPC. expenses, and operating revenues for the Washington County Transit System if these eight runs were eliminated. Ridership for the Commuter Express would decrease, but the amount of operating assistance contributed by the County would also decrease, by $91,000 in RECOMMENDED TRANSIT SERVICES IF FUNDING IS INCREASED If Washington County chooses to increase funding for the transit system between 2015 and 2019, the following changes to the transit system are recommended: Adding additional vehicles and runs to the Commuter Express to meet demand, increase service hours, and increase frequency; Providing a shuttle connecting the City of Hartford and the Village of Slinger to the Richfield Park and Ride Lot and the existing Commuter Express services; Providing a reverse commute service starting on W. Fond du Lac Avenue in the City of Milwaukee and connecting to the Germantown Industrial Park and the Cities of Hartford and West Bend; and Extending the service hours of the Shared-Ride Taxi to provide demand-response service between 10 p.m. and 3 a.m. on Fridays and Saturdays. 111
130 Table 56 PROJECTED ANNUAL OPERATING EXPENSES, REVENUES, AND RIDERSHIP FOR THE WASHINGTON COUNTY COMMUTER EXPRESS SERVICE IF THE LOWEST PERFORMING RUNS ARE ELIMINATED: Projected Characteristics Average Services Provided Revenue Vehicle Miles , , ,800 Revenue Vehicle Hours... 9,300 6,900 6,900 Revenue Passengers Total ,500 98,000 95,400 Passengers per Revenue Vehicle Mile Passengers per Revenue Vehicle Hour Expenses and Revenues Operating Expenses a... $1,276,700 $1,005,200 $1,088,100 Farebox Revenues a , , ,900 Percent of Expenses Recovered through Revenues Operating Assistance Federal a... $266,600 $193,500 $209,500 State a , , ,000 County a , , ,700 Total a , , ,200 Per Trip Data Operating Expenses a... $10.01 $10.26 $11.41 Farebox Revenue a Total Operating Assistance a a Expenses and revenues are expressed in estimated year-of-expenditure dollars. Source: Washington County Highway Department and SEWRPC. Other than these changes, this plan recommends that existing Shared-Ride Taxi and Commuter Express services continue to operate the same as they do currently. Adding Vehicles and Runs to the Commuter Express As demand for the Commuter Express has increased in recent years, the County has responded by adding trips. This plan recommends that this continue in the future, with the County staff and the operator working together to ensure that there are available seats on each run of the Commuter Express. Aside from increasing frequency to address crowding concerns, the County could also increase frequency to provide riders with greater flexibility, thereby improving the quality of the service and attracting new riders. Each additional vehicle added, which would provide the County with the ability to provide three or four more runs on the Commuter Express, would require an additional $55,000 in annual County operating assistance. Any additional vehicles required for this service would be leased from the contract operator, so no additional capital expenses are expected with this service. Providing a Shuttle Connecting Hartford and Slinger to Existing Commuter Express Services The City of Hartford and surrounding area is the largest population center in Washington County unserved by existing Commuter Express services. Providing a Commuter Express-served park and ride lot in the City of Hartford and another lot in the Village of Slinger would place an additional 25,200 County residents within a 112
131 three-mile drive of rapid transit service. In order to avoid reducing the efficiency of the existing Commuter Express Downtown Route, and to provide residents of the City of Hartford and Village of Slinger with more frequent service and easier access to the Medical Center Route, this plan recommends that the County provide a local shuttle service that would be timed to meet the two existing routes at the Richfield Park and Ride. As part of providing this service, the County should lease spare parking capacity at the shopping center anchored by Kmart off E. Sumner Street in the City of Hartford and at Kettle Moraine Bowl off E. Commerce Boulevard in the Village of Slinger (see Map 18). Although this service would require passengers to transfer from one vehicle to another, two vehicles operating this short route should be able to provide a connection to 22 of 26 runs to and from Milwaukee County. Table 57 shows the operating expenses, revenues, and ridership estimated for this service. Any additional vehicles required for this service would be leased from the contract operator, so no additional capital expenses are expected with this service. Providing a Reverse Commute Service to Employers in Washington County The fixed-route element of the Washington County Transit System was originally focused on providing commute services for individuals living in Milwaukee County and working in Washington County, but the services were canceled due to low ridership as the early 2000 s economic downturn reduced business demand for labor from outside the County. This plan recommends that the County implement reverse commute service if discussions with businesses in the County indicate that there is demand for a larger labor pool. The recommended reverse commute service would pick up passengers from across northwestern Milwaukee County and provide access to the four Major Economic Activity Areas in Washington County, as identified by SEWRPC Planning Report No. 48: A Regional Land Use Plan for Southeastern Wisconsin: These areas include the Germantown Industrial Park, employment centers in the City of West Bend, and employment centers on the western side of the City of Hartford, all with more than 3,500 jobs. Map 19 shows the recommended route for this service, traveling from Downtown Milwaukee to STH 145 via W. Fond du Lac Avenue. This service would stop at all intersections with MCTS routes, with each stop and the connecting service noted on the map. An express, one-seat ride from many neighborhoods in Milwaukee County between Downtown Milwaukee and the far northwest side of Milwaukee County would be provided, with relatively easy transfer connections to much of the rest of Milwaukee County. Riders would be able to transfer to the County s Shared-Ride Taxi service at the Paradise Park and Ride lot to access the two employment centers in the City of West Bend. In order to provide service to the City of Hartford and its large business parks, this alternative relies on the existence of the local shuttle service described in the previous section. Riders would be able to make a timed transfer at the Richfield Park and Ride, and the local shuttle would be extended to serve the business park on the west side of the City of Hartford. Table 58 displays the estimated operating expenses, revenues, and ridership for this alternative, including the costs of increasing service on the shuttle connecting the City of Hartford to the Richfield Park and Ride lot. In some instances, there is time in the existing Commuter Express schedule for a vehicle to make this reverse commute trip without adding an additional vehicle. This interlining of three of the 10 one-way runs proposed for this service reduces the non-revenue vehicle hours and miles on both services, therefore reducing the projected cost of providing this service. Any additional vehicles required for this service would be leased from the contract operator, so no additional capital expenses are expected with this service. While this plan was being developed, additional service targeting reverse commute trips to Washington County was being added by MCTS. A settlement in 2014 between the Wisconsin Department of Transportation, the Black Health Coalition of Wisconsin, and the Milwaukee Inner-City Congregation Allied for Hope regarding the development of the Environmental Impact Statement for the Zoo Interchange reconstruction project resulted in additional funding for transit services connecting residents of parts of the City of Milwaukee to employment 113

132 Map 18 Source: SEWRPC. 114
133 Table 57 PROJECTED ANNUAL OPERATING EXPENSES, REVENUES, AND RIDERSHIP FOR PROVIDING WASHINGTON COUNTY COMMUTER EXPRESS SERVICE FROM HARTFORD TO THE RICHFIELD PARK & RIDE LOT: Projected Characteristics Average Services Provided Revenue Vehicle Miles... 60,000 60,000 60,000 Revenue Vehicle Hours... 2,000 2,000 2,000 Revenue Passengers Total... 13,000 27,100 24,500 Passengers per Revenue Vehicle Mile... N/A N/A N/A Passengers per Revenue Vehicle Hour... N/A N/A N/A Expenses and Revenues Operating Expenses a... $291,400 $315,400 $303,300 Farebox Revenues a... 43, ,500 87,800 Percent of Expenses Recovered through Revenues Operating Assistance Federal a... $ 56,100 $ 60,700 $ 58,400 State a , , ,400 County a... 87,700 39,400 48,700 Total a , , ,500 Per Trip Data Operating Expenses a... $22.42 $11.64 $13.44 Farebox Revenue a Total Operating Assistance a a Expenses and revenues are expressed in estimated year-of-expenditure dollars. Source: SEWRPC. opportunities in suburban areas. These new transit services include a stop added in August 2014 within Washington County that serves the Menomonee Falls Industrial Park, just across the border in Waukesha County. The second new transit service affecting Washington County funded by this settlement provides service from the northwest side of the City of Milwaukee to the Germantown Industrial Park in Washington County, starting in January The County should work with MCTS to assist where possible to implement this service, and closely monitor the new service to determine whether further expansion of reverse commute service may be warranted. Extending the Shared-Ride Taxi Service Hours Many of the public comments in support of demand-response shared-ride taxi service county-wide or in the Germantown area cited concern for individuals who need a safe ride home from a restaurant, bar, or tavern after the current hours of the Shared-Ride Taxi service. Although providing a county-wide demand-response service all day would be cost prohibitive, providing this type of service during limited hours when it would be most useful may provide the service when it is most needed without significant expense. 115

134 Map 19 Source: SEWRPC. 116
135 Table 58 PROJECTED ANNUAL OPERATING EXPENSES, REVENUES, AND RIDERSHIP FOR PROVIDING REVERSE COMMUTE WASHINGTON COUNTY COMMUTER EXPRESS SERVICE: Projected Characteristics Average Services Provided Revenue Vehicle Miles... 49,800 49,800 49,800 Revenue Vehicle Hours... 3,800 3,800 3,800 Revenue Passengers Total... 9,900 21,100 19,000 Passengers per Revenue Vehicle Mile... N/A N/A N/A Passengers per Revenue Vehicle Hour... N/A N/A N/A Expenses and Revenues Operating Expenses a... $546,300 $591,300 $568,600 Farebox Revenues a... 33,000 79,800 68,300 Percent of Expenses Recovered through Revenues Operating Assistance Federal a... $105,200 $113,800 $109,500 State a , , ,300 County a , , ,600 Total a , , ,300 Per Trip Data Operating Expenses a... $55.18 $28.02 $32.58 Farebox Revenue a Total Operating Assistance a a Expenses and revenues are expressed in estimated year-of-expenditure dollars. Source: SEWRPC. This plan recommends expanding the service hours of the Shared-Ride Taxi until 3 a.m. on Saturday and Sunday mornings. After 10 p.m., the County s shared-ride taxi service would switch to providing demand-response service. In recognition of this higher level of service, it is recommended that passengers without disabilities pay a higher fare during this time period. Table 59 displays the current Shared-Ride Taxi fares and the recommended fares for this service. Providing this service would help alleviate a public safety concern, taking unsafe drivers off the County s roads, and would meet the needs of individuals who have limited options for safe travel late at night. Table 59 RECOMMENDED WASHINGTON COUNTY SHARED-RIDE TAXI ADULT FARES FOR EXTENDED WEEKEND SERVICE HOURS: 2015 Travel Distance Current Fare Recommended Fare miles... $4.25 $ miles... $5.75 $ miles... $7.00 $ miles... $8.00 $ or more miles... $9.00 $26.00 Source: SEWRPC. 117
136 Table 60 PROJECTED ANNUAL OPERATING EXPENSES, REVENUES, AND RIDERSHIP FOR EXTENDING WASHINGTON COUNTY SHARED-RIDE TAXI SERVICE HOURS: Projected Characteristics Average Services Provided Revenue Vehicle Miles... 35,000 35,000 35,000 Revenue Vehicle Hours... 4,200 4,200 4,200 Revenue Passengers Total... 2,600 2,600 2,600 Passengers per Revenue Vehicle Mile Passengers per Revenue Vehicle Hour Expenses and Revenues Operating Expenses a... $173,500 $187,900 $180,600 Farebox Revenues a... 45,900 45,900 45,900 Percent of Expenses Recovered through Revenues Operating Assistance Federal a... $ 30,000 $ 32,500 $ 31,200 State a... 81,100 87,800 84,400 County a... 16,500 21,700 19,100 Total a , , ,700 Per Trip Data Operating Expenses a... $66.73 $72.27 $69.48 Farebox Revenue a Total Operating Assistance a a Expenses and revenues are expressed in estimated year-of-expenditure dollars. Source: SEWRPC. Table 60 provides estimated operating expenses, revenues, and ridership for this service. It is not expected that providing this service would require an expansion of the Shared-Ride Taxi vehicle fleet. Although the estimates in Table 60 assume implementation of extended Shared-Ride Taxi hours for an entire year, the County could consider implementing this service on a trial basis. Toward the end of this trial period, the County could evaluate the service and determine whether any adjustments need to be made to the number of vehicles and drivers available, as well as the service levels and hours. TRANSIT SERVICES REQUIRING FURTHER STUDY The following three alternatives would require only slight increases in County funding, but implementing them is complicated by other factors, such as the satisfaction of existing transit system riders or the potential for extensive negotiations between counties: Extending the Commuter Express Downtown Route to serve the University of Wisconsin-Milwaukee (UWM); Providing an additional evening run on the Commuter Express Medical Center Route by including Medical Center Route stops on a Downtown Route run, such as Run 25 or Run 26; and 118
137 Merging the Washington County Shared-Ride Taxi service with the Ozaukee County Shared-Ride Taxi service. Due to the previously mentioned complicating factors, it is recommended that the County explore each of these alternatives further by contacting potential partner entities or conducting surveys of existing and potential passengers. Extending the Commuter Express Downtown Route to UWM UWM has over 29,000 students, and nearly all of its students take classes on its campus on the east side of the City of Milwaukee. An estimated 300 Washington County residents currently commute to UWM to attend classes, some of whom may be interested in taking the Commuter Express to class. Additionally, the 130 employees of UWM who live in Washington County may also be interested in this service. Adding service to UWM would require an additional 11 minutes of revenue service on each run of the Downtown Route, but not all runs should be extended, given the UWM class schedule. This additional travel time would require adjusting the current Commuter Express schedule, which may inconvenience existing passengers. In addition, the recommended transit service plan encourages the addition of service to Schlitz Park, which moves the end of the Downtown Route further from UWM. It may not make sense to provide service to both Schlitz Park and UWM. It is important to note that UWM is currently accessible via transit from Washington County by transferring to Milwaukee County Transit System s (MCTS) Route 30, which stops at the Commuter Express stop on E. Wisconsin Avenue and N. Jackson Street every four to eight minutes during the morning and evening peaks and then takes 16 minutes to reach UWM. Survey results from 2012 indicate that no current Commuter Express riders are traveling to UWM, but the removal of a transfer, a nine- to 13-minute reduction in travel time, and targeted marketing to those students could attract them to the Commuter Express. UWM has indicated they would be interested in working with the County on this issue to reduce the demand for student parking on and near their campus, and the County could consider approaching UWM for operating assistance in exchange for providing service to UWM. If it wants to explore this alternative further, the County should also work with UWM to survey potential riders to ensure that the service meets their needs. Table 61 shows estimates of the operational expenses, revenues, and ridership associated with an extension to UWM. Table 62 displays the runs recommended to be extended to serve UWM, the time the Commuter Express would arrive or depart from UWM while classes are in session, and the current time the vehicle arrives or departs from the corner of E. Kilbourn Avenue and N. Milwaukee Street. No additional capital expenses are expected to be associated with providing this service. Providing Additional Evening Service on the Commuter Express Medical Center Route In January 2014, the Washington County Transit System combined the early afternoon run of the Downtown Route and the Medical Center Route into one run, with stops from both routes being served by one run. Map 20 shows this new route, which was implemented as a cost-saving measure. A similar service could be introduced to provide additional late evening service to the stops served by the Medical Center Route. Modifying Run 25 or Run 26 to include the Medical Center Route stops (as shown in Map 20) would provide additional service on Medical Center Route stops, and the added service may attract additional riders due to the schedule flexibility the additional run would provide. If the County chose to explore this alternative further, it would be important to consider the impact a longer commute may have on the existing late evening runs of the Downtown Route. Perhaps those riders should be surveyed to determine whether they would continue to use the service if approximately 20 minutes were added to their commute. Table 63 shows estimates of the operational expenses, revenues, and ridership associated with modifying one run to serve the stops on both the Downtown Route and the Medical Center Route. No additional capital expenses are expected to be associated with providing this service. 119
138 Table 61 PROJECTED ANNUAL OPERATING EXPENSES, REVENUES, AND RIDERSHIP FOR EXTENDING THE WASHINGTON COUNTY COMMUTER EXPRESS DOWNTOWN ROUTE TO THE UNIVERSITY OF WISCONSIN-MILWAUKEE: Projected Characteristics Average Services Provided Revenue Vehicle Miles... 6,900 6,900 6,900 Revenue Vehicle Hours Revenue Passengers Total... 1,900 4,000 3,600 Passengers per Revenue Vehicle Mile... N/A N/A N/A Passengers per Revenue Vehicle Hour... N/A N/A N/A Expenses and Revenues Operating Expenses a... $43,700 $47,300 $45,500 Farebox Revenues a... 6,300 15,100 12,900 Percent of Expenses Recovered through Revenues Operating Assistance Federal a... $ 8,400 $ 9,100 $ 8,800 State a... 15,600 16,900 16,300 County a... 13,400 6,200 7,600 Total a... 37,400 32,200 32,600 Per Trip Data Operating Expenses a... $23.00 $11.83 $13.73 Farebox Revenue a Total Operating Assistance a a Expenses and revenues are expressed in estimated year-of-expenditure dollars. Source: University of Wisconsin-Milwaukee, and SEWRPC. Table 62 WASHINGTON COUNTY COMMUTER EXPRESS DOWNTOWN ROUTE RUNS EXTENDED TO THE UNIVERSITY OF WISCONSIN-MILWAUKEE: MORNING RUNS Run Number Scheduled Arrival Time at E. Kilbourn Ave. and N. Milwaukee St.... 7:38 a.m. 7:58 a.m. 8:25 a.m. 9:00 a.m. 9:40 a.m. Scheduled Arrival Time at the University of Wisconsin-Milwaukee... 7:49 a.m. 8:09 a.m. 8:36 a.m. 9:11 a.m. 9:51 a.m. EVENING RUNS Run Number Scheduled Departure Time from the University of Wisconsin-Milwaukee... 11:49 a.m. 1:22 p.m. 2:20 p.m. 3:40 p.m. 3:52 p.m. 4:20 p.m. Scheduled Departure Time from E. Kilbourn Ave. and N. Milwaukee St :00 p.m. 1:33 p.m. 2:31 p.m. 3:51 p.m. 4:03 p.m. 4:31 p.m. Source: SEWRPC. 120

139 Map 20 Source: SEWRPC. 121
Washington County Transit Development Plan
 Washington County Transit Development Plan Washington County and the Southeastern Wisconsin Regional Planning Commission (SEWRPC) are jointly preparing a short-range, five-year plan for public transit
Minutes of the Third Meeting THE WASHINGTON COUNTY TRANSIT DEVELOPMENT PLAN ADVISORY COMMITTEE
 Minutes of the Third Meeting THE WASHINGTON COUNTY TRANSIT DEVELOPMENT PLAN ADVISORY COMMITTEE Date: May 8, 2013 Time: 9:30 a.m. Place: Conference Room 249 Washington Highway Department 900 Lang Street
WASHINGTON COUNTY TRANSPORTATION COMMITTEE. Vehicle, Maintenance & Storage Facility April 7, 2015
 1 2 3 4 5 6 7 8 9 10 11 12 13 14 15 16 17 18 19 20 21 22 23 24 25 26 27 28 29 30 31 32 33 34 35 36 37 38 39 40 41 42 43 44 45 46 47 48 49 50 51 52 53 54 55 56 57 58 59 60 61 62 63 WASHINGTON COUNTY TRANSPORTATION
RACINE COUNTY PUBLIC TRANSIT PLAN:
 RACINE COUNTY PUBLIC TRANSIT PLAN: 2013-2017 Recommended Transit Service Improvement Plan NEWSLETTER 3 SEPTEMBER 2013 This newsletter describes the final recommended public transit plan for the City of
PUBLIC TRANSIT IN KENOSHA, RACINE, AND MILWAUKEE COUNTIES
 PUBLIC TRANSIT IN KENOSHA, RACINE, AND MILWAUKEE COUNTIES #118404v1 Regional Transit Authority June 19, 2006 1 Presentation Overview Existing Public Transit Transit System Peer Comparison Recent Transit
REGIONAL WATER QUALITY MANAGEMENT PLAN WALWORTH COUNTY METROPOLITAN SEWERAGE DISTRICT / ELKHORN SANITARY SEWER SERVICE AREA
 AMENDMENT TO THE REGIONAL WATER QUALITY MANAGEMENT PLAN WALWORTH COUNTY METROPOLITAN SEWERAGE DISTRICT / ELKHORN SANITARY SEWER SERVICE AREA AS ADOPTED BY THE SOUTHEASTERN WISCONSIN REGIONAL PLANNING COMMISSION
Ozaukee County Transit Development Plan
 Ozaukee County Transit Development Plan Record of Public Comments and Recommended Transit Service Plan June 5, 2018 Kevin Muhs Deputy Director #242846 Status of the Transit Development Plan Existing Conditions
MINUTES SOUTHEASTERN WISCONSIN REGIONAL PLANNING COMMISSION PLANNING AND RESEARCH COMMITTEE MEETING. Tuesday, August 1, 2017
 MINUTES SOUTHEASTERN WISCONSIN REGIONAL PLANNING COMMISSION PLANNING AND RESEARCH COMMITTEE MEETING Tuesday, 1:30 p.m. SEWRPC Office Building Commissioners Conference Room W239 N1812 Rockwood Drive Waukesha,
Eisenbahn State Trail User Survey
 Responses to Eisenbahn State Trail User Survey (Phase 1) Washington County Segment Draft Summer/Fall 2008 Survey Report Submitted by Washington County Planning & Parks Department Planning Division Debora
8 CROSS-BOUNDARY AGREEMENT WITH BRAMPTON TRANSIT
 8 CROSS-BOUNDARY AGREEMENT WITH BRAMPTON TRANSIT The Transportation Services Committee recommends the adoption of the recommendations contained in the following report dated May 27, 2010, from the Commissioner
Providing public transportation since 1999 between Washington and Milwaukee Counties
 Providing public transportation since 1999 between Washington and Milwaukee Counties Background Information Started in 1999, funded by a three-year CMAQ grant. Employers and fare revenue covered local
Memorandum. DATE: May 9, Board of Directors. Jim Derwinski, CEO/Executive Director. Fare Structure Study Fare Pilot Program
 Memorandum DATE: May 9, 2018 TO: FROM: SUBJECT: Board of Directors Jim Derwinski, CEO/Executive Director Fare Structure Study Fare Pilot Program RECOMMENDATION Board action is requested to approve an ordinance
APPENDIX B COMMUTER BUS FAREBOX POLICY PEER REVIEW
 APPENDIX B COMMUTER BUS FAREBOX POLICY PEER REVIEW APPENDIX B COMMUTER BUS FAREBOX POLICY PEER REVIEW The following pages are excerpts from a DRAFT-version Fare Analysis report conducted by Nelson\Nygaard
All Door Boarding Title VI Service Fare Analysis. Appendix P.3
 All Door Boarding Title VI Service Fare Analysis Appendix P.3 Metro Board Report Los Angeles County Metropolitan Transportation Authority One Gateway Plaza 3rd Floor Board Room Los Angeles,
Public Meeting. December 19 th, 2018
 Public Meeting December 19 th, 2018 AGENDA Welcome Market Analysis Existing Services Peer Evaluation Outreach Summary Recommendations Discussion Next Steps MARKET ANALYSIS 3 Demographics 50% of population
Establishes a fare structure for Tacoma Link light rail, to be implemented in September 2014.
 RESOLUTION NO. R2013-24 Establish a Fare Structure and Fare Level for Tacoma Link MEETING: DATE: TYPE OF ACTION: STAFF CONTACT: PHONE: Board 09/26/2013 Final Action Ric Ilgenfritz, Executive Director,
METROPOLITAN EVANSVILLE TRANSIT SYSTEM Part I: Comprehensive Operations Analysis Overview July 9 th, 2015 Public Information Meeting
 METROPOLITAN EVANSVILLE TRANSIT SYSTEM Part I: Comprehensive Operations Analysis Overview July 9 th, 2015 Public Information Meeting AGENDA 5:30 5:40 Open House 5:40 6:30 Presentation Comprehensive Operations
WESTERN EL DORADO COUNTY SHORT AND LONG-RANGE TRANSIT PLAN Executive Summary
 WESTERN EL DORADO COUNTY SHORT AND LONG-RANGE TRANSIT PLAN Executive Summary Prepared for the El Dorado County Transportation Commission Prepared by The El Dorado County Transportation Commission (EDCTC)
Executive Summary. Introduction. Community Assessment
 Executive Summary Introduction The Red Rose Transit Authority (RRTA) Transit Development Plan provides an evaluation of existing RRTA fixed route services, with the outcome being practical recommendations
Word Count: 3,565 Number of Tables: 4 Number of Figures: 6 Number of Photographs: 0. Word Limit: 7,500 Tables/Figures Word Count = 2,250
 Katherine F. Turnbull, Ken Buckeye, Nick Thompson 1 Corresponding Author Katherine F. Turnbull Executive Associate Director Texas Transportation Institute Texas A&M University System 3135 TAMU College
4 YORK REGION TRANSIT DON MILLS SUBWAY STATION ACCESS AGREEMENT
 4 YORK REGION TRANSIT DON MILLS SUBWAY STATION ACCESS AGREEMENT The Transit Committee recommends the adoption of the recommendations contained in the following report, September 20, 2007, from the General
50 Largest U.S. Metropolitan Areas
 America s Racially : Opportunities and Challenges 50 Largest U.S. Metropolitan Areas Community types in the 50 largest metropolitan areas 39,333,003 26% 14,533,326 16,983,337 9% 10% 47,406,687 49,199,197
Chapter 3. Burke & Company
 Chapter 3 Burke & Company 3. WRTA RIDERSHIP AND RIDERSHIP TRENDS 3.1 Service Overview The Worcester Regional Transit Authority (WRTA) provides transit service to over half a million people. The service
A COMPARISON OF THE MILWAUKEE METROPOLITAN AREA TO ITS PEERS
 KRY/WJS/EDL #222377 (PDF: #223479) 1/30/15 PRELIMINARY DRAFT Memorandum Report A COMPARISON OF THE MILWAUKEE METROPOLITAN AREA TO ITS PEERS EXECUTIVE SUMMARY This memorandum report provides a statistical
METROPOLITAN COUNCIL 390 North Robert Street, St. Paul, MN Phone (651) TDD (651)
 TDD (651)") DATE: March 27, 2012 METROPOLITAN COUNCIL 390 North Robert Street, St. Paul, MN 55101 Phone (651) 602-1000 TDD (651) 291-0904 TO: Metropolitan Parks and Open Space Commission FROM: Arne Stefferud, Planning
DATE: March 27, 2012 METROPOLITAN COUNCIL 390 North Robert Street, St. Paul, MN 55101 Phone (651) 602-1000 TDD (651) 291-0904 TO: Metropolitan Parks and Open Space Commission FROM: Arne Stefferud, Planning
COUNCIL AGENDA REPORT
 COUNCIL AGENDA REPORT Meeting Date: 6 June 2016 Subject: Boards Routed Through: 2017 Airdrie Transit s Community Services Advisory Board Date: 9 May 2016 Issue: Council is being asked to endorse the 2017
ARLINGTON COUNTY, VIRGINIA. County Board Agenda Item Meeting of February 22, 2014
 ARLINGTON COUNTY, VIRGINIA County Board Agenda Item Meeting of February 22, 2014 DATE: January 23, 2014 SUBJECT: Request to authorize advertisement of a public hearing to consider an ordinance amending
Madison Metro Transit System
 Madison Metro Transit System 1101 East Washington Avenue Madison, Wisconsin, 53703 Administrative Office: 608 266 4904 Fax: 608 267 8778 TO: FROM: SUBJECT: Plan Commission Timothy Sobota, Transit Planner,
Ridership Growth Strategy (RGS) Status Update
 Status Update") For Information Ridership Growth Strategy (RGS) Status Update Date: July 10, 2018 To: TTC Board From: Deputy Chief Executive Officer Summary The TTC s Ridership Growth Strategy (RGS), with all its components,
For Information Ridership Growth Strategy (RGS) Status Update Date: July 10, 2018 To: TTC Board From: Deputy Chief Executive Officer Summary The TTC s Ridership Growth Strategy (RGS), with all its components,
2018 Service Implementation Plan Executive Summary
 2018 Service Implementation Plan Executive Summary March 2018 2018 SERVICE IMPLEMENTATION PLAN Executive Summary 2018 Service Implementation Plan Each year, Sound Transit prepares a Service Implementation
WASHINGTON COUNTY MULTI-JURISDICTIONAL COMPREHENSIVE PLANNING LAND USE AND TRANSPORTATION ELEMENT WORK GROUP MINUTES OF AUGUST 27, 2007
 WASHINGTON COUNTY MULTI-JURISDICTIONAL COMPREHENSIVE PLANNING LAND USE AND TRANSPORTATION ELEMENT WORK GROUP MINUTES OF AUGUST 27, 2007 The meeting was called to order on August 27, 2007 at 6:33 p.m. by
General Issues Committee Item Transit Operating Budget Ten Year Local Transit Strategy
 General Issues Committee Item 4.1 2017 Transit Operating Budget Ten Year Local Transit Strategy January 27, 2017 Presentation Outline 2017 Operating Budget Overview Ten Year Local Transit Strategy 2 2017
Fixed-Route Operational and Financial Review
 Chapter II CHAPTER II Fixed-Route Operational and Financial Review Chapter II presents an overview of route operations and financial information for KeyLine Transit. This information will be used to develop
March 4, Mr. H. Dale Hemmerdinger Chairman Metropolitan Transportation Authority 347 Madison Avenue New York, NY Re: Report 2007-F-31
 THOMAS P. DiNAPOLI STATE COMPTROLLER 110 STATE STREET ALBANY, NEW YORK 12236 STATE OF NEW YORK OFFICE OF THE STATE COMPTROLLER March 4, 2008 Mr. H. Dale Hemmerdinger Chairman Metropolitan Transportation
JATA Market Research Study Passenger Survey Results
 JATA Market Research Study Passenger Survey Results Prepared for the Jackson Area Transportation Authority (JATA) April, 2015 3131 South Dixie Hwy. Suite 545 Dayton, OH 45439 937.299.5007 www.rlsandassoc.com
SAMTRANS TITLE VI STANDARDS AND POLICIES
 SAMTRANS TITLE VI STANDARDS AND POLICIES Adopted March 13, 2013 Federal Title VI requirements of the Civil Rights Act of 1964 were recently updated by the Federal Transit Administration (FTA) and now require
LA Metro Rapid - Considerations in Identifying BRT Corridors. Martha Butler LACMTA, Transportation Planning Manager Los Angeles, California
 LA Metro Rapid - Considerations in Identifying BRT Corridors Martha Butler LACMTA, Transportation Planning Manager Los Angeles, California LA Metro Transportation planner/coordinator, designer, builder
AGENDA GUEMES ISLAND FERRY OPERATIONS PUBLIC FORUM
 AGENDA GUEMES ISLAND FERRY OPERATIONS PUBLIC FORUM Wednesday, August 17, 211 6: p.m. Guemes Island Community Hall ~ 7549 Guemes Island Road Thank you for attending the second Annual Public Forum in 211.
Existing Services, Ridership, and Standards Report. June 2018
 Existing Services, Ridership, and Standards Report June 2018 Prepared for: Prepared by: Contents Overview of Existing Conditions... 1 Fixed Route Service... 1 Mobility Bus... 34 Market Analysis... 41 Identification/Description
EX28.6 REPORT FOR ACTION. Advancing Fare Integration SUMMARY. Date: October 16, 2017 To: Executive Committee From: City Manager Wards: All
 EX28.6 REPORT FOR ACTION Advancing Fare Integration Date: October 16, 2017 To: Executive Committee From: City Manager Wards: All SUMMARY In July 2016, City Council considered a current state assessment
FY Transit Needs Assessment. Ventura County Transportation Commission
 FY 18-19 Transit Needs Assessment Ventura County Transportation Commission Contents List of Figures and Appendices.. 2 Appendices... 1 Chapter 1: Introduction What is the Ventura County Transportation
New System. New Routes. New Way. May 20, 2014
 Route Optimization I N I T I A T I V E New System. New Routes. New Way. May 20, 2014 1 Welcome Blueprint for Transportation Excellence (BTE) 20 year strategic plan Blueprint 2020 JTA s five-year plan for
PLEASE READ Proposal for Sustainable Service
 IMPORTANT PLEASE READ 019 Proposal for Sustainable Service 019 Service Change Proposal IMPLEMENT A SUSTAINABLE NETWORK Everett Transit completed its Long Range Plan in May, and the plan was adopted by
Chapel Hill Transit: Short Range Transit Plan. Preferred Alternative DRAFT
 : Short Range Transit Plan Preferred Alternative August 2018 Table of Contents Executive Summary... 1 Preferred Alternative... 3 Best Practices for Route Design... 3 Project Goals... 4 Preferred Alternative...
VCTC Transit Ridership and Performance Measures Quarterly Report
 VCTC Transit Ridership and Performance Measures Quarterly Report Overview Quarter 2 Fiscal Year 2018-2019 This report provides performance measures for VCTC Intercity Bus Service covering the FY 2018-19
Quarterly Report Transit Bureau, Local Transit Operations. First Quarter, Fiscal Year 2015 (July 2014 September 2014) ART & STAR
 ART & STAR") Quarterly Report Transit Bureau, Local Transit Operations First Quarter, Fiscal Year 2015 (July 2014 September 2014) ART & STAR A Arlington Transit ART 1) Introduction The purpose of ART is to provide
Quarterly Report Transit Bureau, Local Transit Operations First Quarter, Fiscal Year 2015 (July 2014 September 2014) ART & STAR A Arlington Transit ART 1) Introduction The purpose of ART is to provide
SRTA Year End Fixed Route Ridership Analysis: FY 2018
 SRTA Year End Fixed Route Ridership Analysis: FY 2018 2018 Contents Introduction... 1 A. Key Terms Used in this Report... 1 Key Findings... 2 A. Ridership... 2 B. Fare Payment... 4 Performance Analysis
Chapter 4. Ridecheck and Passenger Survey
 Chapter 4. Ridecheck and Passenger Survey YOLOBUS operates a mix of local, intercity, commute and rural routes. Because there are limited roadways that intercity and rural routes can operate on, stop by
2 YORK REGION TRANSIT MOBILITY PLUS 2004 SYSTEM PERFORMANCE REVIEW
 2 YORK REGION TRANSIT MOBILITY PLUS 2004 SYSTEM PERFORMANCE REVIEW The Joint Transit Committee and Rapid Transit Public/Private Partnership Steering Committee recommends the adoption of the recommendation
DRAFT Service Implementation Plan
 2017 Service Implementation Plan October 2016 SECTION NAME 2017 Service Implementation Plan October 2016 2017 SERVICE IMPLEMENTATION PLAN TABLE OF CONTENTS Table of Contents... I List of Tables... III
Commuter Park and Ride Steering Committee Meeting Notes August 7, :00 a.m. to 11:00 a.m. Attendees Name Organization Phone
 Commuter Park and Ride Steering Committee Meeting Notes August 7, 2013 10:00 a.m. to 11:00 a.m. Attendees Name Organization Email Phone Eileen Horn Lawrence/Douglas County ehorn@lawrenceks.org 785-330-3121
Title VI Service Equity Analysis
 Pierce Transit Title VI Service Equity Analysis Pursuant to FTA Circular 4702.1B September 2013 Service Change February 2013 Page intentionally left blank PIERCE TRANSIT TITLE VI SERVICE EQUITY ANALYSIS
3. Proposed Midwest Regional Rail System
 3. Proposed Midwest Regional Rail System 3.1 Introduction The proposed Midwest Regional Rail System (MWRRS) will operate in nine states, encompass approximately 3,000 route miles and operate on eight corridors.
(This page intentionally left blank.)
") Executive Summary (This page intentionally left blank.) Executive Summary INTRODUCTION The Cache Valley Transit District (CVTD) contracted with the team of Transportation Consultants, Inc. () and Fehr
Executive Summary (This page intentionally left blank.) Executive Summary INTRODUCTION The Cache Valley Transit District (CVTD) contracted with the team of Transportation Consultants, Inc. () and Fehr
DEMOGRAPHICS AND EXISTING SERVICE
 EXECUTIVE SUMMARY The Central Corridor light-rail transit (LRT) project will open in 2014 and operate between downtown Minneapolis and downtown St. Paul, serving the University of Minnesota and University
Tolling in Washington State. Craig J. Stone, P.E. Assistant Secretary, Toll Division
 Tolling in Washington State Craig J. Stone, P.E. Assistant Secretary, Toll Division Connecticut Department of Transportation Bridgeport, CT June 4, 2014 Tolling in Washington State Tolling is part of Washington
EXHIBIT 1. BOARD AUTHORIZATION FOR PUBLIC HEARING AND SUBSEQUENT ISSUANCE OF A JOINT DEVELOPMENT SOLICITATION
 EXHIBIT 1. BOARD AUTHORIZATION FOR PUBLIC HEARING AND SUBSEQUENT ISSUANCE OF A JOINT DEVELOPMENT SOLICITATION Washington Metropolitan Area Transit Authority Board Action/Information Summary @Action O Information
NORTHERN NAPA VALLEY TRANSIT STUDY
 NORTHERN NAPA VALLEY TRANSIT STUDY Draft Final Recommendations Report Submitted by: June 5, 2007 TABLE OF CONTENTS Executive Summary... i ES-1 Project Objectives and Approach... i ES-2 Current Service
Interstate 90 and Mercer Island Mobility Study APRIL Commissioned by. Prepared by
 Interstate 90 and Mercer Island Mobility Study APRIL 2017 Commissioned by Prepared by Interstate 90 and Mercer Island Mobility Study Commissioned by: Sound Transit Prepared by: April 2017 Contents Section
12, 14 and 16 York Street - Amendments to Section 16 Agreement and Road Closure Authorization
 REPORT FOR ACTION 12, 14 and 16 York Street - Amendments to Section 16 Agreement and Road Closure Authorization Date: April 27, 2018 To: Toronto and East York Community Council From: Senior Strategic Director,
DISTRICT EXPRESS LANES ANNUAL REPORT FISCAL YEAR 2017 JULY 1, 2016 JUNE 30, FloridaExpressLanes.com
 DISTRICT EXPRESS LANES ANNUAL REPORT FISCAL YEAR 2017 JULY 1, 2016 JUNE 30, 2017 FloridaExpressLanes.com This page intentionally left blank. TABLE OF CONTENTS List of Figures... ii List of Tables.... ii
Date: 11/6/15. Total Passengers
 Total San Diego Metropolitan Transit System POLICY 42 PERFORMANCE MONITORING REPORT Page 1 of 6 OBJECTIVE Develop a Customer-Focused and Competitive System The following measures of productivity and service
Administrative Operations Report
 Fiscal Year 2017/18 Administrative Operations Report November 1, 2018 Prepared by: El Dorado County Transit Authority 6565 Commerce Way Diamond Springs, CA 95619 (530) 642-5383 www.eldoradotransit.com
Silver Line Operating Plan
 Customer Service and Operations Committee Information Item IV-A December 6, 2012 Silver Line Operating Plan Washington Metropolitan Area Transit Authority Board Action/Information Summary Action Information
Bristol Virginia Transit
 Bristol Virginia Transit 1 Transit Overview Bristol Virginia Transit (BVT) is a Federally Funded and certified urban area transit system. BVT began operation in its current form in 1982. In Fiscal Year
SKAGIT COUNTY PUBLIC WORKS DEPARTMENT Ferry Operations Division Ferry Fare Revenue Target Report
 SKAGIT COUNTY PUBLIC WORKS DEPARTMENT Ferry Operations Division 2018 Ferry Fare Revenue Target Report Skagit County Public Works Department 2018 Ferry Fare Revenue Target Report The following report is
Approval of August 2019 Service Changes
 Approval of August 2019 Service Changes Operations, Safety & Security Committee April 9, 2019 Rob Smith AVP Service Planning and Scheduling 1 Today s Consideration Approve proposed August 2019 service
2015 Independence Day Travel Overview U.S. Intercity Bus Industry
 2015 Independence Day Travel Overview U.S. Intercity Bus Industry Chaddick Institute for Metropolitan Development, DePaul University June 25, 2015 This Intercity Bus Briefing summarizes the Chaddick Institute
Washington Metropolitan Area Transit Authority Services Utilization Study
 Washington Metropolitan Area Transit Authority Services Utilization Study Maryland House Bill 300 Table of Contents Page 2 Executive Summary Slide 3 Notes Slide 4 Metro Systemwide Fact Sheet Slide 5 How
WASHINGTON COUNTY PARKS. Washington County Park Fee Q&A
 WASHINGTON COUNTY Washington County Park Fee Q&A Index of Questions: Click a specific question below to skip to it. 1. Why are fees being implemented? 2. How much of the fees actually go towards the park
Mobile Farebox Repair Program: Setting Standards & Maximizing Regained Revenue
 Mobile Farebox Repair Program: Setting Standards & Maximizing Regained Revenue Michael J. Walk, Chief Performance Officer Larry Jackson, Directory of Treasury Maryland Transit Administration March 2012
Mount Pleasant (42, 43) and Connecticut Avenue (L1, L2) Lines Service Evaluation Study Open House Welcome! wmata.com/bus
 and Connecticut Avenue (L1, L2) Lines Service Evaluation Study Open House Welcome! wmata.com/bus") Mount Pleasant (42, 43) and Connecticut Avenue (L1, L2) Lines Service Evaluation Study Open House Welcome! Study Overview and Timeline Phase 1: Collect and Analyze Data Project Kickoff, September 2017
Mount Pleasant (42, 43) and Connecticut Avenue (L1, L2) Lines Service Evaluation Study Open House Welcome! Study Overview and Timeline Phase 1: Collect and Analyze Data Project Kickoff, September 2017
APPENDIX B. Arlington Transit Peer Review Technical Memorandum
 APPENDIX B Arlington Transit Peer Review Technical Memorandum Arlington County Appendix B December 2010 Table of Contents 1.0 OVERVIEW OF PEER ANALYSIS PROCESS... 2 1.1 National Transit Database...2 1.2
Transit System Performance Update
 Clause 5 in Report No. 4 of Committee of the Whole was adopted, without amendment, by the Council of The Regional Municipality of York at its meeting held on March 29, 2018. 5 2017 Transit System Performance
Table of Contents. TRANSIT DEVELOPMENT PLAN UPDATE i
 Table of Contents Chapter 1. Introduction... 1 Chapter 2. Financial Review... 3 2.1 Operating Costs... 3 2.2 Capital Costs... 3 2.3 Revenues... 4 2.4 Overall Funding Implications... 4 Chapter 3. Service
October REGIONAL ROUTE PERFORMANCE ANALYSIS
 October 2018 2017 REGIONAL ROUTE PERFORMANCE ANALYSIS The Council s mission is to foster efficient and economic growth for a prosperous metropolitan region Metropolitan Council Members Alene Tchourumoff
Social Services Transportation Advisory Council (SSTAC)
") 210 N. Church Street, Suite B Visalia, California 93291 (559) 623-0450 FAX (559) 733-6720 www.tularecog.org Social Services Transportation Advisory Council (SSTAC) MEETING AGENDA Tuesday, November 18,
210 N. Church Street, Suite B Visalia, California 93291 (559) 623-0450 FAX (559) 733-6720 www.tularecog.org Social Services Transportation Advisory Council (SSTAC) MEETING AGENDA Tuesday, November 18,
Aviation, Rail, & Trucking 6-1
 6-1 This chapter describes the services, facilities, and condition of air, rail, and trucking as components of the transportation system. These three intermodal areas have an impact on the factors to be
Central Oregon Intergovernmental Council
 Central Oregon Intergovernmental Council Regional Transit Master Plan (RTMP) Technical Advisory Committee March 8, 2013 Agenda Introductions (5 min) Project Update (5 min) Updated Demand Estimates (5 min)
YRT/VIVA PROPOSED FARE INCREASE
 Report No. 7 of the Transportation Services Committee Regional Council Meeting of September 22, 1 2012 YRT/VIVA PROPOSED FARE INCREASE The Transportation Services Committee recommends: 1. Receipt of the
SAN LUIS OBISPO TRANSIT + SAN LUIS OBISPO RTA JOINT SHORT RANGE TRANSIT PLANS: SERVICE STRATEGIES. Presented by: Gordon Shaw, PE, AICP; Principal
 SAN LUIS OBISPO TRANSIT + SAN LUIS OBISPO RTA JOINT SHORT RANGE TRANSIT PLANS: SERVICE STRATEGIES Presented by: Gordon Shaw, PE, AICP; Principal Project Status Review of existing services and setting complete
TransAction Overview. Introduction. Vision. NVTA Jurisdictions
 Introduction Vision NVTA Jurisdictions In the 21 st century, Northern Virginia will develop and sustain a multimodal transportation system that enhances quality of life and supports economic growth. Investments
Table of Contents. Overview Objectives Key Issues Process...1-3
 Table of Contents Chapter One Introduction Overview...1-1 Objectives...1-1 Key Issues...1-2 Process...1-3 Chapter Two Inventory of Existing Conditions Airport Setting...2-1 Locale...2-1 Airport Surroundings...2-5
LOS ALAMOS COUNTY 1000 Central Avenue, Suite Los Alamos, NM Phone (505) Fax (505) Website:
 Fax (505) Website:") 1111 1111 LOS ALAMOS COUNTY 1000 Central Avenue, Suite 350 - Los Alamos, NM 87544 Phone (505) 663-1750 Fax (505) 662-8079 Website: www.losalamosnm.us COUNTY COUNCIL Council Chair Geoff Rodgers Council
1111 1111 LOS ALAMOS COUNTY 1000 Central Avenue, Suite 350 - Los Alamos, NM 87544 Phone (505) 663-1750 Fax (505) 662-8079 Website: www.losalamosnm.us COUNTY COUNCIL Council Chair Geoff Rodgers Council
Feasibility Study Federal Inspection Service Facility at Long Beach Airport
 Feasibility Study Federal Inspection Service Facility at Long Beach Airport 13 December 2016 Long Beach City Council PLEASE NOTE: The information, analysis, assessments and opinions contained in this presentation
Honorable Members of the Mobility Solutions, Infrastructure and Sustainability Committee
 Memorandum DATE November 21, 2018 CITY OF DALLAS TO Honorable Members of the Committee SUBJECT D-Link Interlocal Funding Agreement On Monday, November 26, 2018, Michael Rogers, Director of the Department
Juneau Comprehensive Operations Analysis and Transit Development Plan DRAFT RECOMMENDATIONS January 2014
 Juneau Comprehensive Operations Analysis and Transit Development Plan DRAFT RECOMMENDATIONS January 2014 Tonight s Agenda System Strengths & Weaknesses Service Improvement Objectives Draft Recommendations
PRELIMINARY DRAFT ALTERNATIVE PLAN I RAPID TRANSIT LINES AND STATIONS M I L W A U K E E C O. MILWAUKEE WAUWATOSA WAUKESHA CO.
 PRELIMINARY DRAFT ALTERNATIVE PLAN I RAPID TRANSIT LINES AND STATIONS 64 SUSSEX LANNON 74 MENOMONEE NEW BERLIN FALLS BROWN DEER 181,- 894,- 894 GREENFIELD 24 HALES CORNERS 36 GREENDALE 57 RIVER HILLS GLENDALE
MEMORANDUM. for HOV Monitoring on I-93 North and the Southeast Expressway, Boston Region MPO, November, 2011.
 MEMORANDUM Date: January 12, 2012 To: Congestion Management Process Files From: Seth Asante, Ryan Hicks, and Efi Pagitsas MPO Staff Re: Historical Trends: Travel Times and Vehicle Occupancy Levels for
Resort Municipality Initiative Annual Report 2015
 Resort Municipality Initiative Annual Report 2015 Submitted by: City of Rossland in association with Tourism Rossland Prepared by: Deanne Steven Acknowledgements The City of Rossland would like to thank
Presentation Outline
 Presentation Outline Overview of Planning Process Initial Service and Fare Considerations RTC RIDE Fixed-route RTC ACCESS Paratransit Fares Next Steps Regional Transportation Commission, Washoe County
McLean Citizens Association Transportation Committee Project Briefing
 McLean Citizens Association Transportation Committee Project Briefing November 10, 2015 Project Map 2 Project Context Only Interstate in the Country limited to HOV only traffic during rush hours Stoplight
Prior to reviewing the various performances of Red Apple Transit, it is important to point out some key terminology, including:
 CHAPTER IV INTRODUCTION Chapter IV presents an overview of operations and financial information for Red Apple Transit. Information on the current system ridership is also presented. This information was
Why we re here: For educational purposes only
 Transportation 2050 Why we re here: For educational purposes only Transportation 2050 Bus Elements PUBLIC TRANSIT DEPARTMENT City of Phoenix Citizens Committee on the Future of Phoenix Transportation (CCFPT)
REPORT ON CHARGING FOR CAR PARKING AND THE IMPLEMENTATION OF CEL1 (2008) WITHIN NHS LOTHIAN
 WITHIN NHS LOTHIAN") NHS Lothian John Jack Director of Facilities 5th June 2008 REPORT ON CHARGING FOR CAR PARKING AND THE IMPLEMENTATION OF CEL1 (2008) WITHIN NHS LOTHIAN 1 Purpose of the Report 1.1 The purpose of this report
NHS Lothian John Jack Director of Facilities 5th June 2008 REPORT ON CHARGING FOR CAR PARKING AND THE IMPLEMENTATION OF CEL1 (2008) WITHIN NHS LOTHIAN 1 Purpose of the Report 1.1 The purpose of this report
Table of Contents. List of Tables
 Table of Contents 1. Introduction... 1 2. Service Recommendations... 1 A. Extend Service on Fort Belvoir to New Post Exchange/Commissary Complex... 1 B. Improve Service Frequencies on Sunday from Current
TRANSIT SERVICE IMPROVEMENT ALTERNATIVES
 KRY/AAB/EDL/SD/edl 1/9/13 #158971v6 (PDF: #208555) Preliminary Draft SEWRPC Community Assistance Planning Report No. 286 RACINE COUNTY PUBLIC TRANSIT PLAN: 2013-2017 Chapter VI TRANSIT SERVICE IMPROVEMENT
East Link Project Update. Maintenance of Traffic During Construction. April 21, 2015
 East Link Project Update Maintenance of Traffic During Construction April 21, 2015 1 Agenda TFP project 242 Bellevue Way HOV Bellevue Way - Maintenance of Traffic During Construction Early Work Utilities
DIRECTOR, ENVIRONMENT, FLEET, & SOLID WASTE UPDATE: REGIONAL RIDESHARE PROGRAM RECOMMENDATION
 Agenda Item # Page # 1 TO: FROM: SUBJECT: CHAIR AND MEMBERS CIVIC WORKS COMMITTEE MEETING ON APRIL 20, 2015 JAY STANFORD DIRECTOR, ENVIRONMENT, FLEET, & SOLID WASTE UPDATE: REGIONAL RIDESHARE PROGRAM RECOMMENDATION
AGENDA BILL. David Wilbrecht, Town Manager Stuart Brown, Recreation Manager
 AGENDA BILL Agenda Item I I February 1, 2012 File No. (ZiZ~. ~ -(O-- to Subject: Resolution to establish and formalize a high level of interagency cooperation with the USDA Inyo National Forest to plan,