NAS/ATM Performance Indexes
|
|
|
- Erin Lee
- 5 years ago
- Views:
Transcription
1 FAA-NEXTO NAS/ATM Performance Indexes Dr. Alexander (Sasha) Klein CENTE FO AI
2 Acknowledgments This research was funded by the FAA-NEXTO-GMU contract #DTFAWA-4-D-13 Many thanks to our FAA sponsors: Steve Bradford, ich Jehlen, Diana Liang FAA Also to: Stephane Mondoloni CSSI Glenn oberts - MITE CAASD George Donohue, Lance Sherry GMU Barry Davis, Carlton Wine FAA; Doug Williamson - Crown 2
3 Project Objectives Develop a framework for assessing NAS/ATM performance on a recurring / daily basis 3 Come up with a simple yet informative index of weather-related ATM performance on a given day ( one number ) Produce charts for each season Compare different seasons: Did we do better this year than last year? Account for major external factors: Weather Traffic Demand Enhance existing methods for NAS performance analysis efine computation of the effects of both en-route and terminal weather Consider additional metrics alongside Delay Traffic Demand (Schedules) Procedures Facilities Weather NAS ATM Delays Costs
4 Operational esponse Index (OI), 24 Components, Excluding Highest-Cost Days OI Component Analysis, 24 (excluding a few highest-cost snowstorm outliers) OI: 5-Period Moving Average of $$ Cost $14,, $12,, $1,, $8,, $6,, $4,, OI = Total daily OPSNet cost of Excess block time vs. Schedule, Excess distance vs. Flight-planned, Cancellations, and Diversions per flight Excess Block Time (pink) Cancellations (light blue) Diversions (yellow) Direct airline operating costs per flight for an averaged narrowbody fleet All OPSNet flights daily A cost-derived metric Computation details here $2,, Excess Distance (navy blue) $ Day, from lowest to highest cost 4
5 OI for 366 Days 1/1 12/31/24, sorted by Date OI, 24, All days 1, /23/24 1/7/24 1/21/24 11/4/24 11/18/24 12/2/24 12/16/24 12/3/24 Snowstorms Volatile Wx in early spring Convective season Quiet period Hurricanes and convective Wx Snowstorms Somewhat quieter period 1/1/24 1/15/24 1/29/24 2/12/24 2/26/24 3/11/24 3/25/24 4/8/24 4/22/24 5/6/24 5/2/24 6/3/24 6/17/24 7/1/24 7/15/24 7/29/24 8/12/24 8/26/24 9/9/24
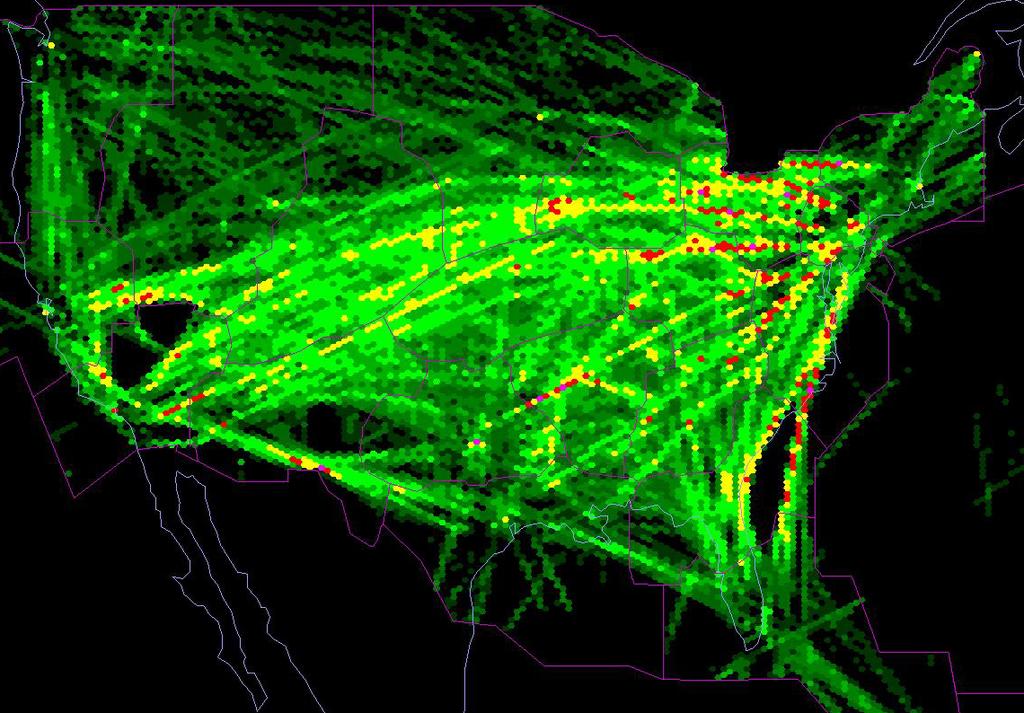
 and by # of daily flights on this flow Add up all flows: En-oute WITI Terminal WITI: Hourly surface Wx observations at major airports Capacity")
6 Weather-Impacted Traffic Index (WITI) Combined En-oute and Terminal Wx 6 En-oute WITI: Find intersections of each flow (GC track) with hex cells where convective Wx was reported Multiply by each hex cell s total NCWD count (reflects Wx duration) and by # of daily flights on this flow Add up all flows: En-oute WITI Terminal WITI: Hourly surface Wx observations at major airports Capacity degradation % for each Wx type * hourly movement rate Add up all airports: Terminal WITI Combined WITI (CWITI): Weighted sum of En-route and Terminal WITI eflects front-end impact of Wx on intended flights
7 Combined WITI and NAS Performance Metrics Example: OI & Delays, June-Oct 24 Including Outliers ASPM Arr Delays and Operational esponse Index (OI) vs. Combined WITI Hurricane Frances 9/5 9/4 Hurricane Jeanne 9/26 9/3 ASPM Arrival Delay Hurricane Ivan 9/16 Even in ideal weather, there are significant residual delays and costs OI Combined WITI 7
8 OI and Delays vs. Combined WITI Example 1: Convective Weather 9,, ASPM Arr Delay and OI vs. Combined WITI Outliers (Exceedingly high costs on or around hurricane days) are removed Jun-Nov 24 July 14, 24 8,, 7,, 6,, 5,, 4,, ASPM Arrival Delay Very high OI ($485/flight) Very high delays Medium-high WITI Checking 3,, 2,, 1,, OI 1,, 2,, 3,, 4,, 5,, Combined WITI 8
9 Zooming In on July 14, 24 OI, En-oute and Terminal WITI 1,, En-route WITI is high (July ) 9,, Terminal WITI is low 8,, 7,, 6,, 5,, 4,, 3,, E-WITI OI Comb-WITI WITI A Terminal WITI OI Combined WITI Combined WITI is medium-high Very high % of cancellations: 3x the usual High operational response cost (OI) was caused by en-route thunderstorms leading to delays and cancellations 2,, 1,, T-WITI NAS performance was worse than usual on this day
10 OI and Delays vs. Combined WITI Example 2: Non-Convective Weather 9,, ASPM Arr Delay and OI vs. Combined WITI Outliers (Exceedingly high costs on or around hurricane days) are removed Jun-Nov 24 October 2, 24 8,, 7,, 6,, 5,, 4,, ASPM Arrival Delay OI is high but in line with average trend elatively low delays Very high WITI Checking 3,, 2,, 1,, OI 1,, 2,, 3,, 4,, 5,, Combined WITI 1
 and delays were caused mostly by terminal Wx NAS performance was actually good for this IMC day 1,, (Better")
11 Zooming In on October 2, 24 OI, En-oute and Terminal WITI 7,, En-route WITI is low (late October) 6,, T-WITI But Terminal WITI is very high (rain, low ceilings etc) 5,, So the Combined WITI is high 4,, 3,, 2,, OI Comb WITI WITI A Terminal WITI OI Combined WITI That is, high OI ($/flight) and delays were caused mostly by terminal Wx NAS performance was actually good for this IMC day 1,, (Better in terms of delays than costs) E-WITI
12 OI and Delays vs. Combined WITI Example 3: Two Metrics Yield Different esults 9,, 8,, ASPM Arr Delay and OI vs. Combined WITI Outliers (Exceedingly high costs on or around hurricane days) are removed Jun-Nov 24 November 23, 24 High CWITI 7,, 6,, 5,, 4,, 3,, 2,, 1,, ASPM Arrival Delay OI 1,, 2,, 3,, 4,, 5,, Combined WITI High delays but just average OI NAS performance could be judged as poor if only delays were considered But considering costs (OI), it was about average given the weather and the demand 12
13 Comparing Delays for 24 and 25 May-September 25 delays were on average about the same as in 24 (1% diff.) ASPM Arrival Delays (avg delay for all flights, ASPM 55 airports, vs. schedule) /1 5/11 5/21 5/31 6/1 6/2 6/3 7/1 7/2 7/3 8/9 8/19 8/29 9/8 9/18 9/28 But, weather (CWITI) was on average better in May-Sep 25 (If 24 average = 1, then 25 average = 83) 13
14 Normalized Delay-to-Wx atio Comparison Delay-Based NAS/ATM Performance Index, 5 vs. 4 Normalized ASPM Arr Delay vs Weather, May-Sep 24 and 25 Against 24 Trendline (all days, including hurricane-impacted) average Delay vs. 24 WITI = 1 25 average Delay vs. 25 WITI vs. 24 WITI = average 24 benchmark 5/1/24 5/8/24 5/15/24 5/22/24 5/29/24 6/5/24 6/12/24 6/19/24 6/26/24 7/3/24 7/1/24 7/17/24 7/24/24 7/31/24 8/7/24 8/14/24 8/21/24 8/28/24 9/4/24 9/11/24 9/18/24 9/25/24
15 Delays and Traffic Demand Taking Exponential Delay-vs.-Demand Factor into Account Looking at historical monthly averages 25: a 1% traffic increase 3 25 Monthly total delays vs operations, Jan Aug 25 1% increase in traffic (from 4.3M to 4.7M ops) can lead to a 45% increase in delays (from 1.25M to 1.8M minutes) This factor ought to be taken into account when we talk about NAS / ATM performance Monthly delay total, minutes The trend doesn t depend on weather Adjusted chart is shown on next slide 1.2E+6 3.5E+6 3.7E+6 3.9E+6 4.E+6 4.1E+6 4.2E+6 4.3E+6 Monthly instrument ops, NAS OPSNet 4.4E+6 4.6E+6 15
16 ATM Performance Index, 25 vs. 24 Adjusted by Exponential Delay-vs-Demand Factor 24 benchmark = 1 25 average adjusted for Weather only = 12 Adjustment factor: divide by 145% (exponential delay increase rate), multiply by 11% (traffic increase rate; need to pro-rate 25 back to 24) 25 adjusted-for-weather-and-demand average = 12 / (1.45 / 1.1) = 91 Normalized ASPM Arr Delay vs Weather, May-Sep 24 and 25 Against 24 Trendline, Adjusted by Delay-vs-Demand Factor (all days, including hurricane-impacted) adjusted average = benchmark 25 adjusted average /1/24 5/8/24 5/15/24 5/22/24 5/29/24 6/5/24 6/12/24 6/19/24 6/26/24 7/3/24 7/1/24 7/17/24 7/24/24 7/31/24 8/7/24 8/14/24 8/21/24 8/28/24 9/4/24 9/11/24 9/18/24 9/25/24
17 Discussion Delays Did the NAS/ATM do 9% better in 25 than in 24? NAS delays were similar; delays vs. weather were worse in 25 But, relative to weather and traffic demand, the ATM component of the NAS did do better in 25 than in 24 D-VSM and other measures may have helped Even so, We are on the ascending slope of the exponential delay curve Peak delays in bad weather (July 25) were highest ever Delay variance is significant The exact proportion (45% delay increase due to 1% traffic demand growth) needs to be fine tuned Monthly delay total, minutes We are here Monthly instrument ops, NAS OPSNet 17
18 OI: Cost-to-Wx atio The uler for OI (1) is an Averaged Day Normalized Indices, Jun-Sep 24 "Cost", "Weather", and "NAS Cost-to-Wx Index", normalized (Current-day / Average) Outliers (hurricane-impacted days) removed Standard Deviation: Cost.22, Weather.4, NAS Cost-to-Wx Index Normalized Wx Normalized Cost (OI) Normalized-Cost-to-Normalized-Wx atio (is roughly inversely proportional to OI) Values below 1 are good High peaks are bad
19 Conclusions Delay, cost (OI) and weather (WITI) metrics computed for 24 and 25 Delay metric can be normalized vs. seasonal-average (e.g. 24 s) Normalized cost (OI) is a useful additional metric WITI calculation refined for both en-route and terminal parts Delay/Cost metrics should account for traffic demand, not just weather, if used as NAS/ATM performance indicators 1-15% traffic demand increase can cause 45-6% increase in delays Slightly better NAS/ATM performance in 25 if both weather and traffic demand are taken into account These metrics can advance our understanding of NAS response to external impacts 19
20 NAS esponse to External Impacts Traffic Demand NAS Weather Impact Unavoidable Avoidable Excess Demand vs. Capacity Unavoidable NAS esponse (Delays, Costs) Inefficiencies 2 1) What portion of delays/costs is due to system inefficiencies as opposed to unavoidable weather and traffic demand outside ATM s control? 2) Can we quantify positive impact of NAS/ATM efficiency improvements? A T M NAS/ATM Efficiency Improvements Excess D vs. C Unavoidable Inefficiencies
21 Back-up Slides 21
22 Operational esponse Index (OI) Components Using direct carrier costs only Passenger impact (value of pax time, ill will, re-issuing tickets etc) excluded Flights per day: OPSNet daily totals (varies between 37, and 5,) Simplifying assumption: all aircraft are narrowbodies Cost of 1 Minute of Delay Used $22/min (based on total non-fuel operating costs averaged for a narrowbody jet) Cost of 1 Extra Mile Flown (expressed in $/min) Equivalent to $18/min (based on 24 fuel cost average for a narrowbody in cruise at $1.25 / gallon) Cost of a [Narrowbody] Cancellation US carrier-reported average cost was $4,5 in 94 which equates to $6, per cancellation in 24 Cost of a [Narrowbody] Diversion Assuming 4 hrs extra block time and a $2,5 hourly operating cost for a narrowbody, we get $1, per diversion 22 Sources: OIG; BTS; MITE CAASD; FAA APO; FAA OPSNet database
23 Operational esponse Index (OI) Calculation OI = (Num_fl * Avg dist * Avg_fuelburn * Fuel_cost + Num_fl * Avg time * Avg_nonfuel_oper_cost Num_diversions * Avg_cost_of_diversion + Num_Cancellations * Avg_cost_of_cancellation) / Num_fl where: dist = average excess distance per flight (actual vs. flight-planned) time = average excess block time per flight (actual vs. scheduled) Avg_fuelburn = fuelburn for a generic narrowbody jet in cruise at FL33 Num_fl = daily number of OPSNet flights Sources of data: FAA APO Lab; FAA ASPM 23
24 Operational esponse Index eality Check Comparison with $$ Quoted in Literature For OPSNet flights: Total excess airline cost for 24 (all flights, all days) is $4.6B For a baseline ideal day (OI = $15/flight): if all days in 24 were like it, total cost would have been $2.7B Difference = $1.9B in direct operating costs eferences show comparable excess-cost estimates: Some figures have indicated that the total average direct annual costs of the irregular operations of ten U.S. major airlines for the period have been about $1.9B (M.Janic TB eport, 23) the Air Transport Association estimated that delays cost the air carriers approximately $2.B in direct operating costs in 1999 : OIG eport, 2 The Air Transport Association's amount increases to nearly $5B when indirect costs and the value of passengers' lost time are included : OIG eport, 2 (extrapolation of our calculations to include indirect costs produces comparable numbers AK) Total operating costs of delays: $ B in : FAA APO-13, Total Cost for Air Carrier Delay eport, total cost of disruptions estimated at $1.8B (Z.Shavell Effects of Schedule Disruptions on the Economics of Airline Operations. In: Air Transportation Systems Engineering, 21, Chapter 8). 24
25 25 Delay/Wx: Linear vs. Exponential Trend A Sign of a Worsening Delay Situation? Exponential trendline: a better fit for 25 Delay-vs-Weather Plot? Linear trendline is a better fit for 24 data 25 ASPM Arr Delay vs CWITI, May-Sep Excluding hurricane-impacted days 25 ASPM Arr Delay vs CWITI, May-Sep Excluding hurricane-impacted days y = e.78x A rr D elay per Flight, N orm alized to 24 average Linear trendline y =.832x Arr Delay per Flight, Normalized to 24 average Linear (25) Exponential trendline 25 Expon. (25) CWITI, Normalized to 24 average CWITI, Normalized to 24 average 25
26 Quiet Period Monthly ASPM Delays vs. Ops Year Trend: NAS Delays vs Ops, "Quiet months" (Mar,Apr,Oct,Nov) Total monthly delay minutes vs. Schedule Monthly ops
27 Terminal Capacity Degradation Weather factor Available airport capacity, % nominal THUNDESTOM 1 HEAVY_SNOW 3 HIGH_WIND (>3 kt)* 3 HEAVY_AIN 4 LOW_VISIBILITY 7 LOW_CEILING 7 SNOW 7 AIN 7 WIND (2-3 kt) 7 NO_WEATHE 1 *sustained wind above 3 kt, higher gusts 27

28 Flows and Actual Tracks Similarity 28
Performance monitoring report 2017/18
 Performance monitoring report /18 Gatwick Airport Limited 1. Introduction Date of issue: 20 July 2018 This report provides an update on performance at Gatwick in the financial year /18, ending 31 March
Performance monitoring report for 2014/15
 Performance monitoring report for 20/15 Date of issue: August 2015 Gatwick Airport Limited Summary Gatwick Airport is performing well for passengers and airlines, and in many aspects is ahead of the performance
NAS Performance and Passenger Delay
 NAS Performance and Passenger Delay Michael Ball NEXTOR University of California, Berkeley & University of Maryland Coauthors: Andy Churchill, Bargava Subramanian, Alex Tien On-Time Performance On-Time
Fewer air traffic delays in the summer of 2001
 June 21, 22 Fewer air traffic delays in the summer of 21 by Ken Lamon The MITRE Corporation Center for Advanced Aviation System Development T he FAA worries a lot about summer. Not only is summer the time
Abstract. Introduction
 COMPARISON OF EFFICIENCY OF SLOT ALLOCATION BY CONGESTION PRICING AND RATION BY SCHEDULE Saba Neyshaboury,Vivek Kumar, Lance Sherry, Karla Hoffman Center for Air Transportation Systems Research (CATSR)
Performance Metrics for Oceanic Air Traffic Management. Moving Metrics Conference Pacific Grove, California January 29, 2004 Oceanic Metrics Team
 Performance Metrics for Oceanic Air Traffic Management Moving Metrics Conference Pacific Grove, California January 29, 2004 Oceanic Metrics Team Agenda Metrics Team Michele Merkle, FAA AUA-600 Lynne Hamrick,
Appendix B Ultimate Airport Capacity and Delay Simulation Modeling Analysis
 Appendix B ULTIMATE AIRPORT CAPACITY & DELAY SIMULATION MODELING ANALYSIS B TABLE OF CONTENTS EXHIBITS TABLES B.1 Introduction... 1 B.2 Simulation Modeling Assumption and Methodology... 4 B.2.1 Runway
Evaluation of Predictability as a Performance Measure
 Evaluation of Predictability as a Performance Measure Presented by: Mark Hansen, UC Berkeley Global Challenges Workshop February 12, 2015 With Assistance From: John Gulding, FAA Lu Hao, Lei Kang, Yi Liu,
Statistics of Air, Water, and Land Transport Statistics of Air, Water, and Land. Transport Released Date: August 2015
 Statistics of Air, Water, and Land Transport 2014 2013 1 Released Date: August 2015 Table of Contents Introduction... 4 Key Points... 5 1. Air Transport... 6 1.1 Aircraft movements... 6 1.2 Number of passengers...
Estimating Domestic U.S. Airline Cost of Delay based on European Model
 Estimating Domestic U.S. Airline Cost of Delay based on European Model Abdul Qadar Kara, John Ferguson, Karla Hoffman, Lance Sherry George Mason University Fairfax, VA, USA akara;jfergus3;khoffman;lsherry@gmu.edu
Quantile Regression Based Estimation of Statistical Contingency Fuel. Lei Kang, Mark Hansen June 29, 2017
 Quantile Regression Based Estimation of Statistical Contingency Fuel Lei Kang, Mark Hansen June 29, 2017 Agenda Background Industry practice Data Methodology Benefit assessment Conclusion 2 Agenda Background
Estimating Sources of Temporal Deviations from Flight Plans
 Estimating Sources of Temporal Deviations from Flight Plans Ms. Natasha Yakovchuk (yakovn2@rpi.edu) Prof. Thomas R. Willemain (willet@rpi.edu) Department of Decision Sciences and Engineering Systems Rensselaer
Analysis of en-route vertical flight efficiency
 Analysis of en-route vertical flight efficiency Technical report on the analysis of en-route vertical flight efficiency Edition Number: 00-04 Edition Date: 19/01/2017 Status: Submitted for consultation
Use of Performance Metrics in Airspace Systems: US Perspective
 2 nd USA/EUROPE AIR TRAFFIC MANAGEMENT R&D SEMINAR Orlando,1 st - 4 th December 1998 Use of Performance Metrics in Airspace Systems: US Perspective Steve Bradford Federal Aviation Administration, ASD-13
Performance monitoring report for first half of 2016
 Performance monitoring report for first half of 2016 Gatwick Airport Limited 1. Introduction Date of issue: 5 December 2016 This report provides an update on performance at Gatwick in the first half of
Key Performance Indicators
 Key Performance Indicators The first section of this document looks at key performance indicators (KPIs) that are relevant in SkyChess. KPIs are useful as a measure of productivity, which can be sub-divided
Falcon 2000S & Challenger 350 Analysis
 Falcon 2000S & Challenger 350 Analysis Aviation's Most Real World Operating Cost Application. Annual & Hourly Cost Detail Dassault Falcon 2000S Min Crew / Max Passengers 2 / 10 Seats Full Range (NM / SM)
Active ATM Performance Management
 Active ATM Performance Management Rapporteur: Wim Post (Co-Chairs: Mark Hansen / Christoph Meier) 05 July 2007 ATM2007 Barcelona 1 This presentation: I do not pretend to be able to summarise the essence
System Wide Modeling for the JPDO. Shahab Hasan, LMI Presented on behalf of Dr. Sherry Borener, JPDO EAD Director Nov. 16, 2006
 System Wide Modeling for the JPDO Shahab Hasan, LMI Presented on behalf of Dr. Sherry Borener, JPDO EAD Director Nov. 16, 2006 Outline Quick introduction to the JPDO, NGATS, and EAD Modeling Overview Constraints
Measuring Ground Delay Program Effectiveness Using the Rate Control Index. March 29, 2000
 Measuring Ground Delay Program Effectiveness Using the Rate Control Index Robert L. Hoffman Metron Scientific Consultants 11911 Freedom Drive Reston VA 20190 hoff@metsci.com 703-787-8700 Michael O. Ball
The NESCAUM Method of Estimating Aircraft Emissions
 The NESCAUM Method of Estimating Aircraft Emissions Presentation to the OTC Mobile Source Committee December 5, 2001 Baltimore-Washington International Airport Ingrid Ulbrich Environmental Analyst NESCAUM
Validation of Runway Capacity Models
 Validation of Runway Capacity Models Amy Kim & Mark Hansen UC Berkeley ATM Seminar 2009 July 1, 2009 1 Presentation Outline Introduction Purpose Description of Models Data Methodology Conclusions & Future
A Macroscopic Tool for Measuring Delay Performance in the National Airspace System. Yu Zhang Nagesh Nayak
 A Macroscopic Tool for Measuring Delay Performance in the National Airspace System Yu Zhang Nagesh Nayak Introduction US air transportation demand has increased since the advent of 20 th Century The Geographical
Annual & Hourly Cost Detail
 King Air 350i Annual & Hourly Cost Detail GENERAL PARAMETERS Min Crew / Max Passengers 2 / 8 Seats Full Range (NM / SM) 1404.00 / 1615.69 Normal Cruise Speed (KTS / MPH) 302.25 / 347.82 Average Pre-Owned
Management Presentation. March 2016
 Management Presentation March 2016 Forward looking statements This presentation as well as oral statements made by officers or directors of Allegiant Travel Company, its advisors and affiliates (collectively
Performance monitoring report for the second half of 2015/16
 Performance monitoring report for the second half of 2015/16 Gatwick Airport Limited 1. Introduction DATE OF ISSUE: 7 JUNE 2016 This report provides an update on performance at Gatwick in the second half
Recommendations for Northbound Aircraft Departure Concerns over South Minneapolis
 Recommendations for Northbound Aircraft Departure Concerns over South Minneapolis March 21, 2012 Noise Oversight Committee Agenda Item #4 Minneapolis Council Member John Quincy Background Summer of 2011
Benchmarking Airport Airside Performance: FRA vs. EWR
 Benchmarking Airport Airside Performance: FRA vs. EWR Amedeo Odoni, Thomas Morisset, MIT Alexander Zock, Wilhelm Drotleff, ECAD ATM Research & Development Seminar Berlin, June 14, 2011 Compare airside
2017/2018 Q3 Performance Measures Report. Revised March 22, 2018 Average Daily Boardings Comparison Chart, Page 11 Q3 Boardings figures revised
 2017/2018 Q3 Performance Measures Report Revised March 22, 2018 Average Daily Boardings Comparison Chart, Page 11 Q3 Boardings figures revised Contents Ridership & Revenue... 1 Historical Revenue & Ridership...
SIA GROUP FINANCIAL RESULTS
 FINANCIAL RESULTS For Ended 30 June 2018 197200078R Operating Result Q1 Q1 Better/ FY18/19 FY17/18 R1 (Worse) ($M) ($M) (%) Total Revenue 3,844 3,864 (0.5) Q1 Better/ FY17/18 R2 (Worse) ($M) (%) 3,689
CANSO Workshop on Operational Performance. LATCAR, 2016 John Gulding Manager, ATO Performance Analysis Federal Aviation Administration
 CANSO Workshop on Operational Performance LATCAR, 2016 John Gulding Manager, ATO Performance Analysis Federal Aviation Administration Workshop Contents CANSO Guidance on Key Performance Indicators Software
Airport Capacity, Airport Delay, and Airline Service Supply: The Case of DFW
 Airport Capacity, Airport Delay, and Airline Service Supply: The Case of DFW Faculty and Staff: D. Gillen, M. Hansen, A. Kanafani, J. Tsao Visiting Scholar: G. Nero and Students: S. A. Huang and W. Wei
Estimated Fuel Burn Performance for MDW Arrivals
 Estimated Fuel Burn Performance for MDW Arrivals Akshay Belle 1 and Lance Sherry 2 Center for Air Transportation Systems Research, Fairfax, Virginia, 22030 TRACON arrival flows are an important component
PLANNING A RESILIENT AND SCALABLE AIR TRANSPORTATION SYSTEM IN A CLIMATE-IMPACTED FUTURE
 PLANNING A RESILIENT AND SCALABLE AIR TRANSPORTATION SYSTEM IN A CLIMATE-IMPACTED FUTURE Megan S. Ryerson Department of City and Regional Planning Department of Electrical and Systems Engineering University
Operational Performance and Demand Management. Mark Hansen NEXTOR Short Course 10/14/04
 Operational Performance and Demand Management Mark Hansen NEXTOR Short Course 10/14/04 1 Outline Recent trends in NAS Operational Performance The Costs of Delay Operational Impacts of Supply and Demand
EN-024 A Simulation Study on a Method of Departure Taxi Scheduling at Haneda Airport
 EN-024 A Simulation Study on a Method of Departure Taxi Scheduling at Haneda Airport Izumi YAMADA, Hisae AOYAMA, Mark BROWN, Midori SUMIYA and Ryota MORI ATM Department,ENRI i-yamada enri.go.jp Outlines
Development of Flight Inefficiency Metrics for Environmental Performance Assessment of ATM
 Development of Flight Inefficiency Metrics for Environmental Performance Assessment of ATM Tom G. Reynolds 8 th USA/Europe Air Traffic Management Research and Development Seminar Napa, California, 29 June-2
Managing And Understand The Impact Of Of The Air Air Traffic System: United Airline s Perspective
 Managing And Understand The Impact Of Of The Air Air Traffic System: United Airline s Perspective NEXTOR NEXTOR Moving Moving Metrics: Metrics: A Performance-Oriented View View of of the the Aviation Aviation
Annual & Hourly Cost Detail
 Annual & Hourly Cost Detail Embraer Phenom 300 GENERAL PARAMETERS Min Crew / Max Passengers 2 / 7 Seats Full Range (NM / SM) 1662.38 / 1913.03 Normal Cruise Speed (KTS / MPH) 419.25 / 482.46 Average Pre-Owned
ATM Network Performance Report
 ATM Network Performance Report 2018. Page 1 of 16 Table of contents Summary... 3 Network Wide Performance... 4 Airborne delay... 4 Sydney... 6 Airborne delay... 6 Notable events... 6 Melbourne... 9 Airborne
October 2013 Passenger and Cargo Traffic Statistics Reno-Tahoe International Airport
 October 2013 Passenger and Cargo Traffic Statistics Reno-Tahoe International Airport December 4, 2013 U.S. DOMESTIC INDUSTRY OVERVIEW FOR OCTOBER 2013 All RNO Carriers Systemwide year over year comparison
Hawker 800XP Versus Falcon 2000 SAMPLE
 Hawker 8XP Versus Falcon 2 SAMPLE This report is a sample report which assumes the following: 1. Cash buyer - no financing 2. Owner flown hours 15/year 3. Charter flown hours 2/year 4. Fuel is priced using
RENO-TAHOE INTERNATIONAL AIRPORT APRIL 2008 PASSENGER STATISTICS
 Inter-Office Memo Reno-Tahoe Airport Authority Date: June 5, 2008 To: Statistics Recipients From: Tom Medland, Director Air Service Business Development Subject: RENO-TAHOE INTERNATIONAL AIRPORT PASSENGER
Singapore Airlines Group Analyst/Media Briefing HALF YEAR FY RESULTS 5 NOVEMBER 2012 THE PARENT AIRLINE 1H FY2012/13 RESULTS
 Singapore Airlines Group Analyst/Media Briefing HALF YEAR FY2012-13 13 RESULTS 5 NOVEMBER 2012 THE PARENT AIRLINE 1H FY2012/13 RESULTS THE PARENT AIRLINE COMPANY RESULTS 2Q & 1H FY12/13 2Q/12 $million
SYSTEM BRIEF DAILY SUMMARY
 SYSTEM BRIEF SUMMARY * ANNUAL (PEAK HOURS 7:00 AM TO 10:00 PM MON-SAT) MaxTemp NEL (MWH) Hr Ending Hr Ending LOAD ENERGY (MWH) INCREMENTAL COST DAY DATE Civic TOTAL MAXIMUM @Max MINIMUM @Min FACTOR ON
November 2013 Passenger and Cargo Traffic Statistics Reno-Tahoe International Airport
 November 2013 Passenger and Cargo Traffic Statistics Reno-Tahoe International Airport December 26, 2013 U.S. DOMESTIC INDUSTRY OVERVIEW FOR NOVEMBER 2013 All RNO Carriers Domestic Systemwide year over
Performance monitoring report for first half of 2015
 Performance monitoring report for first half of 2015 Gatwick Airport Limited 1. Introduction Date of issue: 11 November 2015 This report provides an update on performance at Gatwick in the first half of
FIRST QUARTER 2017 RESULTS. 4 May 2017
 FIRST QUARTER 2017 RESULTS 4 May 2017 A resilient start of the year, traffic up 4.2% 20.9 million passengers carried, up 5.2%, traffic (RPK) up 4.2%, capacity (ASK) up 3.3% and load factor up 0.7pts Confirmation
Washington Dulles International Airport (IAD) Aircraft Noise Contour Map Update
 Aircraft Noise Contour Map Update") Washington Dulles International Airport (IAD) Aircraft Noise Contour Map Update Ultimate ASV, Runway Use and Flight Tracks 4th Working Group Briefing 8/13/18 Meeting Purpose Discuss Public Workshop input
Washington Dulles International Airport (IAD) Aircraft Noise Contour Map Update Ultimate ASV, Runway Use and Flight Tracks 4th Working Group Briefing 8/13/18 Meeting Purpose Discuss Public Workshop input
Citation XLS Analysis - Owner & Charter Hour Contributions. Prepared March 31, 2017
 Citation XLS Analysis - Owner & Charter Hour Contributions Prepared March 31, 2017 Aviation's Most Real World Operating Cost Application. Annual & Hourly Cost Detail Cessna Citation XLS Min Crew / Max
Evaluation of Strategic and Tactical Runway Balancing*
 Evaluation of Strategic and Tactical Runway Balancing* Adan Vela, Lanie Sandberg & Tom Reynolds June 2015 11 th USA/Europe Air Traffic Management Research and Development Seminar (ATM2015) *This work was
Interim results. 11 May 2010
 Interim results 11 May 2010 Introduction Andy Harrison Chief Executive Officer Strong performance despite disruption Improvement in revenue, margins and cash Continued network improvement has driven better
Annual & Hourly Cost Detail
 Annual & Hourly Cost Detail EADS Socata TBM 700C2 GENERAL PARAMETERS Min Crew / Max Passengers 1 / 5 Seats Full Range (NM / SM) 975.00 / 1122.01 Normal Cruise Speed (KTS / MPH) 282.75 / 325.38 Average
May 2011 Passenger and Cargo Traffic Statistics Reno-Tahoe International Airport
 May 2011 Passenger and Cargo Traffic Statistics Reno-Tahoe International Airport July 5, 2011 U.S. DOMESTIC INDUSTRY OVERVIEW FOR MAY 2011 All RNO Carriers Systemwide year over year comparison Average
Aviation Trends. Quarter Contents
 Aviation Trends Quarter 3 2014 Contents Introduction... 2 1. Historical overview of traffic... 3 a. Terminal passengers... 4 b. Commercial flights... 5 c. Cargo tonnage... 6 2. Terminal passengers at UK
JETNET & ACC Reporting Sample Report - F900EX versus G500
 JETNET & ACC Reporting Sample Report - F9EX versus G5 11 FIRST ST. STEET UTICA, NY 1351 PHONE: 8-553-8368 Aircraft Specifications Dassault Falcon 9EX GENERAL PARAMETERS Typical Passenger Capacity 2 / 12
Time-series methodologies Market share methodologies Socioeconomic methodologies
 This Chapter features aviation activity forecasts for the Asheville Regional Airport (Airport) over a next 20- year planning horizon. Aviation demand forecasts are an important step in the master planning
3. Aviation Activity Forecasts
 3. Aviation Activity Forecasts This section presents forecasts of aviation activity for the Airport through 2029. Forecasts were developed for enplaned passengers, air carrier and regional/commuter airline
IAB / AIC Joint Meeting, November 4, Douglas Fearing Vikrant Vaze
 Passenger Delay Impacts of Airline Schedules and Operations IAB / AIC Joint Meeting, November 4, 2010 Cynthia Barnhart (cbarnhart@mit edu) Cynthia Barnhart (cbarnhart@mit.edu) Douglas Fearing (dfearing@hbs.edu
Gulf Carrier Profitability on U.S. Routes
 GRA, Incorporated Economic Counsel to the Transportation Industry Gulf Carrier Profitability on U.S. Routes November 11, 2015 Prepared for: Wilmer Hale Prepared by: GRA, Incorporated 115 West Avenue Suite
Oct-17 Nov-17. Travel is expected to grow over the coming 6 months; at a slower rate
 Analysis provided by TRAVEL TRENDS INDEX OCTOBER 2018 CTI reading of 51.6 in October 2018 indicates that travel to or within the U.S. grew 3.2% in October 2018 compared to October 2017. LTI predicts travel
AUGUST 2008 MONTHLY PASSENGER AND CARGO STATISTICS
 Inter-Office Memo Reno-Tahoe Airport Authority Date: October 2, 2008 To: Statistics Recipients From: Tom Medland, Director Air Service Business Development Subject: RENO-TAHOE INTERNATIONAL AIRPORT PASSENGER
Oct-17 Nov-17. Sep-17. Travel is expected to grow over the coming 6 months; at a slightly faster rate
 Analysis provided by TRAVEL TRENDS INDEX SEPTEMBER 2018 CTI reading of.8 in September 2018 indicates that travel to or within the U.S. grew 1.6% in September 2018 compared to September 2017. LTI predicts
THE CONNECTED AIRCRAFT: Improving Dispatch Reliablity
 GEE OPERATIONAL SOLUTIONS THE CONNECTED AIRCRAFT: Improving Dispatch Reliablity PRESENTED TO World Maintenance Symposium September 23, 2015 Dr. Tulinda Larsen Vice President, Commercial Operational Excellence
January 2014 Passenger and Cargo Traffic Statistics Reno-Tahoe International Airport
 January 2014 Passenger and Cargo Traffic Statistics Reno-Tahoe International Airport March 12, 2014 U.S. DOMESTIC INDUSTRY OVERVIEW FOR DECEMBER 2013 All RNO Carriers Domestic Systemwide year over year
ANALYSIS OF THE CONTRIUBTION OF FLIGHTPLAN ROUTE SELECTION ON ENROUTE DELAYS USING RAMS
 ANALYSIS OF THE CONTRIUBTION OF FLIGHTPLAN ROUTE SELECTION ON ENROUTE DELAYS USING RAMS Akshay Belle, Lance Sherry, Ph.D, Center for Air Transportation Systems Research, Fairfax, VA Abstract The absence
Airport Characterization for the Adaptation of Surface Congestion Management Approaches*
 MIT Lincoln Laboratory Partnership for AiR Transportation Noise and Emissions Reduction MIT International Center for Air Transportation Airport Characterization for the Adaptation of Surface Congestion
Measuring the Business of the NAS
 Measuring the Business of the NAS Presented at: Moving Metrics: A Performance Oriented View of the Aviation Infrastructure NEXTOR Conference Pacific Grove, CA Richard Golaszewski 115 West Avenue Jenkintown,
IATA FUEL EFFICIENCY CAMPAIGN
 IATA FUEL EFFICIENCY CAMPAIGN Juergen Haacker Director, Operations Montreal, IATA Fuel Efficiency Campaign Jet fuel price driving airline fuel efficiency Increased 5% from 2003-2005 Industry is on track
Danyi Wang and Dr. Lance Sherry 1
 Danyi Wang and Dr. Lance Sherry 1 Trend Analysis of Airline Passenger Trip Delays Danyi Wang (Ph.D Candidate) Email: dwang2@gmu.edu Phone: 571-277-0287 Lance Sherry (Ph.D) Email: lsherry@gmu.edu Phone:
Airline Operating Costs Dr. Peter Belobaba
 Airline Operating Costs Dr. Peter Belobaba Istanbul Technical University Air Transportation Management M.Sc. Program Network, Fleet and Schedule Strategic Planning Module 12: 30 March 2016 Lecture Outline
Fuel Burn Impacts of Taxi-out Delay and their Implications for Gate-hold Benefits
 Fuel Burn Impacts of Taxi-out Delay and their Implications for Gate-hold Benefits Megan S. Ryerson, Ph.D. Assistant Professor Department of City and Regional Planning Department of Electrical and Systems
Residential Property Price Index
 An Phríomh-Oifig Staidrimh Central Statistics Office 28 December 2012 Residential Property Price Index Residential Property Price Index November 2012 Nov 05 Nov 06 Nov 07 Nov 08 Nov 09 Nov 10 Nov 11 140
Passenger and Cargo Statistics Report
 Passenger and Cargo Statistics Report RenoTahoe International Airport September 2015 U.S. DOMESTIC INDUSTRY OVERVIEW FOR SEPTEMBER 2015 All RNO Carriers Domestic Systemwide year over year comparison Average
Management Presentation. November 2018
 Management Presentation November 2018 Forward looking statements This presentation as well as oral statements made by officers or directors of Allegiant Travel Company, its advisors and affiliates (collectively
Passenger and Cargo Statistics Report
 Passenger and Cargo Statistics Report RenoTahoe International Airport August 2015 U.S. DOMESTIC INDUSTRY OVERVIEW FOR AUGUST 2015 All RNO Carriers Domestic Systemwide year over year comparison Average
December 2013 Passenger and Cargo Traffic Statistics Reno-Tahoe International Airport
 December 2013 Passenger and Cargo Traffic Statistics Reno-Tahoe International Airport January 24, 2014 U.S. DOMESTIC INDUSTRY OVERVIEW FOR DECEMBER 2013 All RNO Carriers Domestic Systemwide year over year
F L I G H T S A F E T Y F O U N D A T I O N. For Everyone Concerned with the Safety of Flight
 F L I G H T S A F E T Y F O U N D A T I O N Airport Operations Vol. 2 No. 1 For Everyone Concerned with the Safety of Flight January/February 1994 U.S. Federal Aviation Administration Aviation System Indicators
Evidence for the Safety- Capacity Trade-Off in the Air Transportation System
 Evidence for the Safety- Capacity Trade-Off in the Air Transportation System G. L. Donohue R. C. Haynie D. Wang J. F. Shortle Dept. of Systems Engineering & Operations Research George Mason University
August 2014 Passenger and Cargo Traffic Statistics Reno-Tahoe International Airport
 August 2014 Passenger and Cargo Traffic Statistics Reno-Tahoe International Airport October 8, 2014 U.S. DOMESTIC INDUSTRY OVERVIEW FOR AUGUST 2014 All RNO Carriers Domestic Systemwide year over year comparison
Cross-sectional time-series analysis of airspace capacity in Europe
 Cross-sectional time-series analysis of airspace capacity in Europe Dr. A. Majumdar Dr. W.Y. Ochieng Gerard McAuley (EUROCONTROL) Jean Michel Lenzi (EUROCONTROL) Catalin Lepadatu (EUROCONTROL) 1 Introduction
July 2012 Passenger and Cargo Traffic Statistics Reno-Tahoe International Airport
 July 2012 Passenger and Cargo Traffic Statistics Reno-Tahoe International Airport August 31, 2012 U.S. DOMESTIC INDUSTRY OVERVIEW FOR JULY 2012 All RNO Carriers Systemwide year over year comparison Average
Temporal Deviations from Flight Plans:
 Temporal Deviations from Flight Plans: New Perspectives on En Route and Terminal Airspace Professor Tom Willemain Dr. Natasha Yakovchuk Department of Decision Sciences & Engineering Systems Rensselaer
Airline Response to Changing Economics and Policy
 Airline Response to Changing Economics and Policy John Ferguson (Ph.D. Candidate), Karla Hoffman (Ph.D.), Lance Sherry (Ph.D.), George Donohue (Ph.D.), Abdul Qadar Kara (Ph.D. Candidate), Rosa Oseguera-Lohr
Efficiency and Environment KPAs
 Efficiency and Environment KPAs Regional Performance Framework Workshop, Bishkek, Kyrgyzstan, 21 23 May 2013 ICAO European and North Atlantic Office 20 May 2013 Page 1 Efficiency (Doc 9854) Doc 9854 Appendix
Technical Report. Aircraft Overflight and Noise Analysis. Brisbane, California. December Prepared by:
 Aircraft Noise Abatement Office Technical Report Aircraft Overflight and Noise Analysis Brisbane, California Prepared by: P.O. Box 8097 San Francisco, California 94128 (650) 821-5100 Introduction In response
Master Plan Update Technical Advisory Committee Meeting
 Nashville International Airport Master Plan Update Technical Advisory Committee Meeting February 14, 2019 Agenda Welcome and Introductions Aviation Activity Forecast Facility Requirements Alternatives
LCCs: in it for the long-haul?
 October 217 ANALYSIS LCCs: in it for the long-haul? Exploring the current state of long-haul low-cost (LHLC) using schedules, fleet and flight status data Data is powerful on its own, but even more powerful
NOTES ON COST AND COST ESTIMATION by D. Gillen
 NOTES ON COST AND COST ESTIMATION by D. Gillen The basic unit of the cost analysis is the flight segment. In describing the carrier s cost we distinguish costs which vary by segment and those which vary
Estimating Avoidable Delay in the NAS
 Estimating Avoidable Delay in the NAS Bala Chandran Avijit Mukherjee Mark Hansen Jim Evans University of California at Berkeley Outline Motivation The Bertsimas-Stock model for TFMP. A case study: Aug
Department of Transportation, Federal Aviation Administration (FAA). SUMMARY: Under this notice, the FAA announces the submission deadline of
. SUMMARY: Under this notice, the FAA announces the submission deadline of") This document is scheduled to be published in the Federal Register on 10/02/2017 and available online at https://federalregister.gov/d/2017-21045, and on FDsys.gov [4910-13] DEPARTMENT OF TRANSPORTATION
This document is scheduled to be published in the Federal Register on 10/02/2017 and available online at https://federalregister.gov/d/2017-21045, and on FDsys.gov [4910-13] DEPARTMENT OF TRANSPORTATION
Corporate Productivity Case Study
 BOMBARDIER BUSINESS AIRCRAFT Corporate Productivity Case Study April 2009 Marketing Executive Summary» In today's environment it is critical to have the right tools to demonstrate the contribution of business
The purpose of this Demand/Capacity. The airfield configuration for SPG. Methods for determining airport AIRPORT DEMAND CAPACITY. Runway Configuration
 Chapter 4 Page 65 AIRPORT DEMAND CAPACITY The purpose of this Demand/Capacity Analysis is to examine the capability of the Albert Whitted Airport (SPG) to meet the needs of its users. In doing so, this
Passenger and Cargo Statistics Report
 Passenger and Cargo Statistics Report RenoTahoe International Airport December 2015 U.S. DOMESTIC INDUSTRY OVERVIEW FOR DECEMBER 2015 All RNO Carriers Domestic Systemwide year over year comparison Average
According to FAA Advisory Circular 150/5060-5, Airport Capacity and Delay, the elements that affect airfield capacity include:
 4.1 INTRODUCTION The previous chapters have described the existing facilities and provided planning guidelines as well as a forecast of demand for aviation activity at North Perry Airport. The demand/capacity
Third Quarter 2014 Results. 29 October 2014
 Third Quarter 2014 Results 29 October 2014 Highlights of the Third Quarter Operating environment Air France-KLM Economic environment remains weak Further currency volatility affecting revenues and results
Singapore Airlines Group Analyst/Media Briefing HALF YEAR FY RESULTS. 13 November 2013 THE PARENT AIRLINE 1H FY2013/14 RESULTS
 Singapore Airlines Group Analyst/Media Briefing HALF YEAR FY2013-14 14 RESULTS 13 November 2013 THE PARENT AIRLINE 1H FY2013/14 RESULTS THE PARENT AIRLINE COMPANY RESULTS 2Q & 1H FY13/14 2Q/13 $million
Jumpstart 2017 Lukas Johnson SVP, Commercial. June 2017
 Jumpstart 2017 Lukas Johnson SVP, Commercial June 2017 Forward looking statements This presentation as well as oral statements made by officers or directors of Allegiant Travel Company, its advisors and
Danyi Wang and Dr. Lance Sherry 1
 Danyi Wang and Dr. Lance Sherry 1 Trend Analysis of Airline Passenger Trip Delays Danyi Wang (Ph.D Candidate) Email: dwang2@gmu.edu Phone: 571-277-0287 Lance Sherry (Ph.D) Email: lsherry@gmu.edu Phone:
Yasmine El Alj & Amedeo Odoni Massachusetts Institute of Technology International Center for Air Transportation
 Estimating the True Extent of Air Traffic Delays Yasmine El Alj & Amedeo Odoni Massachusetts Institute of Technology International Center for Air Transportation Motivation Goal: assess congestion-related