Columbia Glacier in 1984: Disintegration Underway
|
|
|
- Coleen Mitchell
- 5 years ago
- Views:
Transcription


1 Columbia Glacier in 1984: Disintegration Underway U.S. GEOLOGICAL SURVEY Open-f ile Report


2 Cover -----Aerial vi ew of the 6-ki lometer wide terminus of Col umbi a Glacier, taken on August 14, In front of the glacier trapped iceberys and smaller ice blocks are confined by a submerged moraine shoal. Beyond this, icebergs drift south along the west side of Heather Island (left center), and then sometimes to the east into Valdez Arm and Prince William Sound (left distance). USGS photo by M. F. Meier.


3 UNITED STATES DEPARTMENT OF THE INTERIOR GEOLOGICAL SURVEY COLUMBIA GLACIER IN 1984: DISINTEGRATION UNDERWAY By M. F. Meier, L. A. Rasmussen, and 0. S. Miller U.S. Geological Survey, Project Office - Glaciology, Tacoma, WA U.S. GEOLOGICAL SURVEY OPEN-FILE REPORT Tacoma, WA 1985


4 UNITED STATES DEPARTMENT OF THE INTERIOR Wi 11 iam Clark, Secretary GEOLOGICAL SURVEY Dallas L. Peck, Director For additional information write to: U.S. Geological Survey Project Office - Glaciology 1201 Pacific Avenue, Suite 450 Tacoma, Washington 98402
 near Valdet, Alaska.")


5 Col umbi a Gl aci er in 1984: Di si ntegrat i on Underway by M.F. ~eier, L. A. Rasmussen and D. S. Miller Columbia Glacier is a large, iceberg-calving glacier (fig. 1) near Valdet, Alaska. The terminus of this glacier was relatively stable from the time of the first scientific studies in 1899 until During this period the glacier terminated partly on Heather Island and partly on a submerged moraine shoal. Post (1975) suggested that if it were to retreat from the stabilizing moraine shoal, a period of drastic retreat would ensue. Detailed studies were made during , and monitoring has continued through In June, 1980, a prediction of drastic retreat was issued (Meier and others,- 1980). In December, 1978, the glacier terminus retreated from Heather Island, and retreat has accelerated each year since then, except during a period of anomalously low calving in Although the glacier has not terminated on Heather Island since 1978, a portion of the terminus remained on the crest of the moraine shoal until the fall of By December 8, 1983, that feature had receded more than 300 m from the crest of the shoal, and by December 14, 1984, had disappeared completely, leaving most of the terminus more than 2,000 meters behind the crest of the shoal. Recession of the glacier from the shoal has placed the terminus in deeper water, although the glacier does not float. The active calving face of the glacier now terminates in seawater that is about 300 meters deep at the glacier centerline. Rapid calving appears to be associated with buoyancy effects due to deep water at the terminus (Post, 1975; Brown and others, 1982; Sikonia, 1982) and subglacial runoff (Sikonia, 1982).
.")


, a fini te-el ement dynamic model (Si konia, 1982), and a")


 on top of seracs (ice pinnacles) on the extremely")
6 Columbia Glacier has shown a seasonal pattern of fluctuation superimposed on a long-term trend of accelerating retreat since 1976 (fig. 2). These seasonal changes in length, due to seasonal changes in iceberg calving, are also displayed in figure 3. The 1,100 meter retreat during 1984 (through December 14) was far greater than in any previous year, the next greatest was 600 meters in The observed long-term retreat is compared with that predicted by a continuity- equation model (Rasmussen and Meier, 1982), a fini te-el ement dynamic model (Si konia, 1982), and a finite-difference dynamic model (Bindschadler and Rasmussen, 1983) in figure 2. The acceleration of the observed retreat is roughly consistent with results of predictive models although the models all predicted that rapid retreat would occur somewhat sooner than observed. It should be noted, however, that the timing of the retreat determined by models was expressed only to the nearest one or two years. The retreat is shown in map view in figure 4; positions of the terminus are shown at the end of the summer retreat period for the years 1974 and from 1978 through Deep embayments In the terminus occurred in most earlier years, but since 1982 the terminus has been approximately straight. The positions of markers set out on the glacier surface in August 1984 to measure the rate of flow are shown in figure 4. These markers were set (by use of a he1 icopter) on top of seracs (ice pinnacles) on the extremely rough glacier surface (fig. 5). The markers were surveyed frequently, from two survey stations on ridges to the east of the glacier, over a period of about three weeks. One marker (number 11) was tracked by an automated distance-measuring device from Heather Island every 15 minutes during the same period. Changes in the surface altitude are examined by plotting the altitude change since July 27, 1974 for each of 17 markers. Topographic maps exist for that date and for September 1, 1981 and, for only the lower part of the region, for
, based on")


 occurred in 1981.")


7 September 10, A detailed surface topography analysis (Rasmussen and Meier, 1985), based on photogrammetrically determined altitudes, gives the altitude at the position of each of 6 markers between June 2, 1977 and September 1, 1981, and for 11 other markers between July 24, 1976 and September 1, A prelim- inary analysis of the photography from two more flights, on August 2, 1982 and October 15, 1982, and surveys on August 13, 1984 yielded additional altitude data. The altitude change since July 27, 1974 is shown (fig. 7) in terms of the average for 6 upper markers and the average for 11 lower markers. acceleration of surface lowering (thinning) occurred in A strong The bed topography has recently been estimgted (Brown and others, in preparation) for the lower part of the region, thus enabling estimation of the glacier thickness at the positions of 6 markers (numbers 7-11 and 17) forming a progression down the centerline of the glacier. By using the ratio of seawater density to ice density, it is possible to determine the part of the thickness unsupported by buoyancy. This is shown in figure 8 as a function of time since 1977 for each of the 6 markers. The seasonal variation has been removed by choosing maps or other surface topography analyses on or near September 1 of each of the five years for which data are shown, and by cprrecting to that date any altitude values that were not exactly on.septernber 1. For each marker, a curve Ss drawn through the five points and is extrapolated for about a year into the future, Although this graph suggests that the lowest kilometer or two along the centerline will float within about a year, ice has generally calved before this occurs; this calving increase as the unsupported thickness becomes small is what forms the basis of a calving law (Sikonia, 1982) used in modeling Columbia Glacier. The ice thickness unsupported by buoyancy at marker 17 in 1984 is very' close to that predicted at the terminus by Sikonia (1982, p. 824). During late winter and spring of 1984, the ice cliff at the terminus was

 as low as a few meters, indicating that it was floating.")


, it is possible to")


8 abnormally low and irregular. In one segment,-where the water depth is 100 t o 170 m, a portion of the glacier flowed out as a tongue about 500 m long and 500 m wide (fig. 9). This tongue had a freeboard (height above sea level) as low as a few meters, indicating that it was floating. Such a phenomenon has not been observed before at Columbia Glacier, and indicates that the thickness unsupported by buoyancy had, for a short time, locally diminished to zero. The velocity trend over the past several years is shown in figure 10 for a point fixed in space near the position of 1984 marker number 17; the trend of glacier thickness is shown as we1 1. As with the unsupported thickness data (fig. 8), the seasonal variation has been removed from these two curves. Because the transverse variation of velocity is known (Fountain, 1982; Meier and other;, 1985), it is possible to estimate the total volumetric flux through the glacier cross- section containing this point by using the estimated bed topography. The flux values corresponding to the five points on the curves in figure 10 are, from 1977 to 1984: 1.34, 1.36, 1.40, 2.56, and 3.95 km3/year. The sharp increase in flux is caused by the sharp increase in velocity and is only slightly tempered by the mild decline in thickness. The volumetric discharge of icebergs from Columbia GI acier is increasing. The iceberg cal viny flux from June 17, 1983 to October 4, 1984 is shown in figure 11. During the measurement. year the calving flux averaged about 1.4 km3/year; in the second half of 1983 the average value was about 3 km3/year and from January 1 through October 4, 1984, almost 4 km3/year. The iceberg discharge on September 1, 1984 (about 5 km3/year) was appreciably greater than the volumetric flow of the glacier near marker 17 (3.95 km3/year) on that date. Thus glacier flow, although it has increased markedly, is not keeping up with the discharge of iceberys.
.")


9 All the evidence indicates that Columbia Glacier is now in a phase of rapid and accelerating disintegration. The rate of terminus retreat is increasing (fig, 2, 3). The glacier is thinning at an ever more rapid rate (fig. 7). Because of this thinning, a condition of flotation is being approached (fig. 8) and has been attained briefly in at least one local area (fig. 9). Although the glacier is thinning, the velocity is increasing rapidly so that the volumetric flow rate is accelerating, especially since early 1982 (fig, 10). The rate of discharge of icebergs is also accelerating (fig. 11) and is appreciably larger than the glacier flow rate. Thus the glacier, in spite of a rapid drawdown of its ice reserves, is unable to balance'the increasing losses by iceberg discharge. Clearly, disintegration is now underway. There is no evidence that disintegration and iceberg discharge will decelerate soon. The rate of change of almost all pertinent variables is toward ever faster breakup, which is consistent with the predictions based on numerical model i ng. It should not be assumed, however, that the increasing iceberg discharge will cause greatly increased iceberg problems with shipping in Valdez Arm. The moraine shoal, which had a maximum sill depth of 23 m below lower low water in the late 19701s, prevents the escape of large icebergs into open water, and thus acts as a filter to prevent large outbreaks of ice.


 : U. S.")


.")


10 REFERENCES Bindschadler, H. A,, and Rasmussen, L. A., 1983, Finite-difference model predictions of the drastic retreat of Columbia Glacier, Alaska: U.S. Geological Survey Professional Paper 1258-D, 17 p. Brown, C S., Meier, M. F., and Post, Austin, 1982, Calving speed of A1 aska tidewater glaciers, with application to Columbia Glacier: U.S. Geological Survey Professional Paper 12584, 13 p. Brown, C S., Rasmussen, L. A., and Meier, M. F., 1985, Bed topography inferred from ai rborne radio-echo sounding of Columbia Glacier, A1 aska: U.S. Geological Survey Professional Paper (in preparation). Fountain, A. G., 1982, Columbia Glacier altitude and velocity: data set ( ) : U. S. Geological Survey Open-Fi l e Report , 225 p. Meier, M. F., Rasmussen, L. A., Post, ust tin, Brown, C S., Sikonia, W. G., Bindschadler, R. A., Mayo, L. R., and Trabant, 0. C., 1980, Predicted timing of the disintegration of the lower reach of Columbia Glacier, Alaska: U.S. Geological Survey Open-Fi 1 e Report , 47 p. Meier, M. F., Rasmussen, L. A., Krimmel, R. M., Olsen, R. W., and Frank, David, 1985, Photogrammetric determination of surface altitude, terminus position, and ice velocity of Columbia Glacier, Alaska: U.S. Geological Survey Professional Paper 1258-F (in press). Post, Austin, 1967, Effects of the March 1964 Alaska earthquake on glaciers: U.S. Geological Survey Professional Paper 544-0, 42 p. Post, Austin, 1975, ~rel'irninar~ hydrography and historic terminal changes of Columbia Glacier, Alaska: U.S. Geological Survey Hydrologic Investigations Atlas 559, 3 sheets. Rasmussen, L. A., and Meier, M. F., 1982, Continuity equation model of the predicted drastic retreat of Columbia Glacier, A1 aska: U.S. Geological Survey Professional Paper 1258-A, 23 p. Rasmussen, L. A., and Meier, M. F., 1985, Surface topography of the lower part of Columbia Glacier, Alaska : U.S. Geological Survey Professional Paper 1258-E (in press). Sikonia, W. G., 1982, Finite element glacier dynamics model applied to Columbia Glacier, Alaska: U.S. Geological Survey Professional Paper , 74 p. Sikonia, W. G., and Post, Austin, 1980, Columbia Glacier, Alaska: recent ice loss and its relationship to seasonal terminal embayments, thinning, and glacial flow: U.S. Geological Survey Hydrologic Investigations Atlas 61 9, 3 sheets.


 side!")
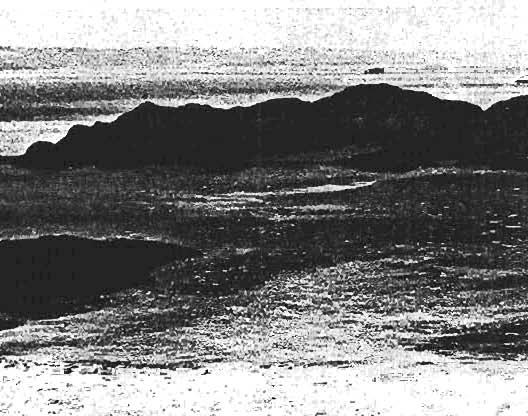
11 >- % ; + *- PI;', lr-p a ti I act er M IS t C I ---0bl ique der. -. tog to graph of the lower rnllrm~i the north, and Heather Island is in 'eground. Th e ice 1 cliff * about 30 to 70 m high and makes up 5 the width of the tr ermi nus -.*LA- The position of a terminal moraine sl I :onnecting Heacner- Island with both s f the fiord, can be inferr m the lines of stranded icebergs >lock the movement of othc.es of ice, causing much of the wdcer surface near the terminus ro oe covered with ice. The point of ice near the west (left) side! termi nus (m, arked with streaks of debris) disappeared eolnplet I Oecem ber 14, 1984, USGS photograph by Robert M. Krimmet., Augur 1984,


, (b), and (d) show")


12 Figure 2.--Changes in the length of Columbia Glacier since Upwards trend represents advance, downwards trend represents retreat. Heavy 1 ine is observed behavior of the terminus, averaged over the width. Light lines labeled (a), (b), and (d) show published predictions using different kinds of nume~ical models: a, Rasmussen and Meier (1982); b, S i koni a (1 982) ; d, Bi ndschadl er and Rasmussen (1 983).


, open")
, and")


13 - 1 1 YEAR Figure 3.--Seasonal advance and retreat of Columbia Glacier for the years , superimposed onto one year for comparison. The curves are repeated in the gray areas to either side to help visualize trends. Solid dots are data points abtained by photograrranetry (error is about 10 m), open circles are observations by 1 ess-accurate methods (ship-borne radar, ground surveys), and smooth curves are drawn through data points. Data from aerial photographs taken on March 12 and April 24, 1984, are plotted as vertical lines because of the difficulty in differentiating the low, irregular ice cliff from floating ice. Values are averaged over the width of the active terminus.


 and survey")


14 Figure 4.--Map showing the configuration of the terminus of Columbia Glacier after summer retreat, for the years 1974 and Small crosses represent the Universal Transverse Mercator coordinates in meters. Also indicated are the marker locations (dots) and survey stations (triangles) used during the August, 1984 field program. Markers numbers 2, 3, 5-11 and 17 are on or near the main stream of the glacier flow. Marker 17 was on the glacier in August but the terminus subsequently retreated back from that location.


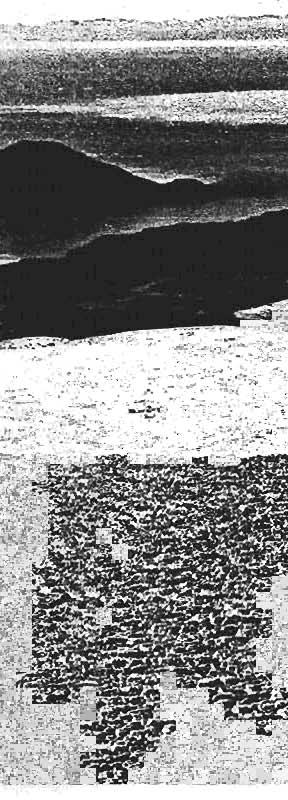
15 Figure 5.--Oblique aerial photograph showing the roughness of the glacier surface. View is to the west, about 2 km above the terminus. Average relief from summits to valleys is about 25 m; local re1 i ef may range up to m. USGS photograph by M. F. Meier, August 14, 1984.


16 Figure 6.--Longitudinal section of the terminus of Columbia Glacfer, as of August, 1984, The 1981 and 1974 profiles a're also shown. Note that the terminus of the glacier has retreated into water about 300 meters deep, but that the ice is not floating. Also, large icebergs are grounded against the moraine shoal, trapping other floating ice blocks and delaying their release to navigable waters.

 in")


: in 1984")

17 Figure 7.--A1 titude decline since July 27, 1974 for the average of 6 markers (numbers 2, 3, 5, 6, 13 and 14) in the upper part of the region and for 11 markers (numbers 7-12, 15, 17, 19-21) in the lower part. The 1984 values are probably high compared with the other values (as indicated by the arrows): in 1984 markers on serac tops were surveyed, whereas the other values were determined photogrammetrically at points usually at the lips of crevasses.


.")

18 Figure 8.--Part of glacier thickness unsupported by the buoyant effect of the seawater. Marker numbers 7-11 and 17 form a progression downglacier approximately along the centerline (fig. 4). Arrows indicate that the 1984 values are probably high compared with the other values because surveys were to serac tops.


 is choked with")


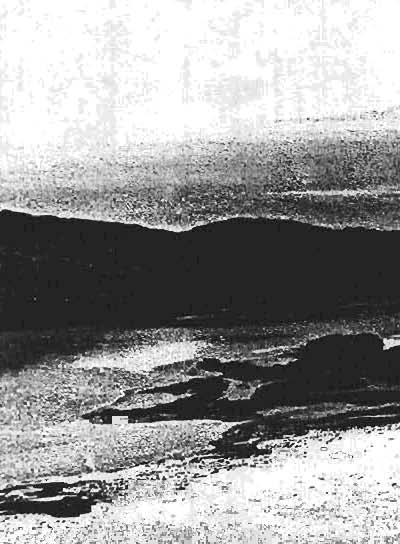
19 Figure 9.--0bl ique aerial photograph showing the glacier terminus on March 29, The water in front of the glacier (foreground and left) is choked with iceblocks. Note that the ice cliff is low, indistinct, and irregular, and that a tongue of ice (arrow) has flowed out in advance of the ice cliff. The freeboard of this tongue is very low, indicating that it is floating. USGS photograph by R. M. Krimrnel.


20 Figure 10.--Surface speed (component to the south).and.'glacier thickness for a point fixed in space near the 1984 position of marker number 17 (fig. 4).


21 Figure 11.--Calving flux from June 17, 1983 through October 4, The values are averages between tlmes of aerial photography, and thus are plotted as a histogram. The arrow indicates the average value for the year September 1, 1977 to August 31, The circle indicates the flux of ice towards the terminus on September 1, 1984.
Tidewater Glaciers: McCarthy 2018 Notes
 Tidewater Glaciers: McCarthy 2018 Notes Martin Truffer, University of Alaska Fairbanks June 1, 2018 What makes water terminating glaciers special? In a normal glacier surface mass balance is always close
Iceberg prediction model to reduce navigation hazards: Columbia Glacier, Alaska
 Iceberg prediction model to reduce navigation hazards: Columbia Glacier, Alaska W. Tangborn Iceberg Monitoring Project, Seattle, Washington A. Post Iceberg Monitoring Project, Vashon Island, Washington
Fifty-Year Record of Glacier Change Reveals Shifting Climate in the Pacific Northwest and Alaska, USA
 Fact Sheet 2009 3046 >> Pubs Warehouse > FS 2009 3046 USGS Home Contact USGS Search USGS Fifty-Year Record of Glacier Change Reveals Shifting Climate in the Pacific Northwest and Alaska, USA Fifty years
Regional Glacier Mass Balance Variation in the North Cascades
 1 STUDY PLAN NATURAL RESOURCE PROTECTION PROGRAM Regional Glacier Mass Balance Variation in the North Cascades PRINCIPLE INVESTIGATORS JON L. RIEDEL NORTH CASCADES NATIONAL PARK ANDREW FOUNTAIN AND BOB
GLACIER STUDIES OF THE McCALL GLACIER, ALASKA
 GLACIER STUDIES OF THE McCALL GLACIER, ALASKA T John E. Sater* HE McCall Glacier is a long thin body of ice shaped roughly like a crescent. Its overall length is approximately 8 km. and its average width
WATER, ICE, AND METEOROLOGICAL MEASUREMENTS AT SOUTH CASCADE GLACIER, WASHINGTON, BALANCE YEARS
 WATER, ICE, AND METEOROLOGICAL MEASUREMENTS AT SOUTH CASCADE GLACIER, WASHINGTON, 2-1 BALANCE YEARS U.S. GEOLOGICAL SURVEY Water-Resources Investigations Report 2-4165 South Cascade Glacier, looking approximately
Alaskan landscape evolution and glacier change in response to changing climate
 Alaskan landscape evolution and glacier change in response to changing climate Following the publication of two pictures comparing the length of the Muir Glacier in Alaska, USA in the June 2005 issue of
Chapter 2 A minimal model of a tidewater glacier
 Chapter 2 A minimal model of a tidewater glacier We propose a simple, highly parameterized model of a tidewater glacier. The mean ice thickness and the ice thickness at the glacier front are parameterized
TEACHER PAGE Trial Version
 TEACHER PAGE Trial Version * After completion of the lesson, please take a moment to fill out the feedback form on our web site (https://www.cresis.ku.edu/education/k-12/online-data-portal)* Lesson Title:
The Portland State University study of shrinking Mt. Adams glaciers a good example of bad science.
 The Portland State University study of shrinking Mt. Adams glaciers a good example of bad science. Don J. Easterbrook, Dept. of Geology, Western Washington University, Bellingham, WA The recent Portland
Seasonal fluctuations in the advance of a tidewater glacier and potential causes: Hubbard Glacier, Alaska, USA
 Journal of Glaciology, Vol. 54, No. 186, 2008 401 Seasonal fluctuations in the advance of a tidewater glacier and potential causes: Hubbard Glacier, Alaska, USA J. Brent RITCHIE, Craig S. LINGLE, Roman
THE DISEQUILBRIUM OF NORTH CASCADE, WASHINGTON GLACIERS
 THE DISEQUILBRIUM OF NORTH CASCADE, WASHINGTON GLACIERS CIRMOUNT 2006, Mount Hood, OR Mauri S. Pelto, North Cascade Glacier Climate Project, Nichols College Dudley, MA 01571 peltoms@nichols.edu NORTH CASCADE
Chapter 5 Controls on advance of tidewater glaciers: Results from numerical modeling applied to Columbia Glacier
 Chapter 5 Controls on advance of tidewater glaciers: Results from numerical modeling applied to Columbia Glacier A one-dimensional numerical ice-flow model is used to study the advance of a tidewater glacier
Mendenhall Glacier Facts And other Local Glaciers (updated 3/13/14)
") University of Alaska Southeast School of Arts & Sciences A distinctive learning community Juneau Ketchikan Sitka Mendenhall Glacier Facts And other Local Glaciers (updated 3/13/14) This document can be
University of Alaska Southeast School of Arts & Sciences A distinctive learning community Juneau Ketchikan Sitka Mendenhall Glacier Facts And other Local Glaciers (updated 3/13/14) This document can be
glacier Little Ice Age continental glacier valley glacier ice cap glaciation firn glacial ice plastic flow basal slip Chapter 14
 Little Ice Age glacier valley glacier continental glacier ice cap glaciation firn glacial ice plastic flow basal slip glacial budget zone of accumulation zone of wastage glacial surge abrasion glacial
NORTH CASCADE SLACIER CLIMATE PROJECT Director: Dr. Mauri S. Pelto Department of Environmental Science Nichols College, Dudley MA 01571
 NORTH CASCADE SLACIER CLIMATE PROJECT Director: Dr. Mauri S. Pelto Department of Environmental Science Nichols College, Dudley MA 01571 INTRODUCTION The North Cascade Glacier-Climate Project was founded
Geomorphology. Glacial Flow and Reconstruction
 Geomorphology Glacial Flow and Reconstruction We will use simple mathematical models to understand ice dynamics, recreate a profile of the Laurentide ice sheet, and determine the climate change of the
12: MELTWATER LANDFORM IDENTIFICATION
 Glacial Geology 12. Meltwater Landform Identification 12: MELTWATER LANDFORM IDENTIFICATION 60 Points Objective: learn how to identify meltwater landforms and their characteristics in photos and on topographic
Geography 120, Instructor: Chaddock In Class 13: Glaciers and Icecaps Name: Fill in the correct terms for these descriptions: Ablation zone: n zne:
 Geography 120, Instructor: Chaddock In Class 13: Glaciers and Icecaps Name: Fill in the correct terms for these descriptions: Ablation zone: The area of a glacier where mass is lost through melting or
Comparison Pictures of Receding Glaciers
 Comparison Pictures of Receding Glaciers In the photo above, the west shoreline of Muir Inlet in Alaska's Glacier Bay National Park & Preserve is shown as it appeared in 1895. Notice the lack of vegetation
Lidar Imagery Reveals Maine's Land Surface in Unprecedented Detail
 Maine Geologic Facts and Localities December, 2011 Lidar Imagery Reveals Maine's Land Surface in Unprecedented Detail Text by Woodrow Thompson, Department of Agriculture, Conservation & Forestry 1 Introduction
AGAP Antarctic Research Project Visualizing Data Learning About Antarctica From RADAR Data? Student Version
 AGAP Antarctic Research Project Visualizing Data Learning About Antarctica From RADAR Data? Student Version Name Date Image of Subglacial Lake network courtesy of NSF Ice Sheet: A large glacier that covers
Glaciology. Water. Glacier. Moraine. Types of glacier-dammed lakes. Mechanics of jökulhlaup
 A Jökulhlaup Jökulhlaup. Catastrophic events where large amounts of water are suddenly discharged. Jökulhlaup s are a sudden and rapid draining of a glacier dammed lake or of water impounded within a glacier.
Revised Draft: May 8, 2000
 Revised Draft: May 8, 2000 Accepted for publication by the International Association of Hydrological Sciences. Paper will be presented at the Debris-Covered Glaciers Workshop in September 2000 at the University
Glaciers. Clicker Question. Glaciers and Glaciation. How familiar are you with glaciers? West Greenland. Types of Glaciers.
 Chapter 21 Glaciers A glacier is a large, permanent (nonseasonal) mass of ice that is formed on land and moves under the force of gravity. Glaciers may form anywhere that snow accumulation exceeds seasonal
Rapid decrease of mass balance observed in the Xiao (Lesser) Dongkemadi Glacier, in the central Tibetan Plateau
 Dongkemadi Glacier, in the central Tibetan Plateau") HYDROLOGICAL PROCESSES Hydrol. Process. 22, 2953 2958 (2008) Published online 8 October 2007 in Wiley InterScience (www.interscience.wiley.com).6865 Rapid decrease of mass balance observed in the Xiao
HYDROLOGICAL PROCESSES Hydrol. Process. 22, 2953 2958 (2008) Published online 8 October 2007 in Wiley InterScience (www.interscience.wiley.com).6865 Rapid decrease of mass balance observed in the Xiao
Mapping the Snout. Subjects. Skills. Materials
 Subjects Mapping the Snout science math physical education Skills measuring cooperative action inferring map reading data interpretation questioning Materials - rulers - Mapping the Snout outline map and
Glaciers Earth 9th Edition Chapter 18 Mass wasting: summary in haiku form Glaciers Glaciers Glaciers Glaciers Formation of glacial ice
 1 2 3 4 5 6 7 8 9 10 11 12 13 14 15 Earth 9 th Edition Chapter 18 Mass wasting: summary in haiku form Ten thousand years thence big glaciers began to melt - called "global warming." are parts of two basic
Recrystallization of snow to form LARGE. called FIRN: like packed snowballs. the weight of overlying firn and snow.
 Chapter 11 Glaciers BFRB P. 103-104, 104, 108, 117-120120 Process of Glacier Formation Snow does NOT melt in summer Recrystallization of snow to form LARGE crystals of ice (rough and granular) called
2. (1pt) From an aircraft, how can you tell the difference between a snowfield and a snow-covered glacier?
 From an aircraft, how can you tell the difference between a snowfield and a snow-covered glacier?") 1 GLACIERS 1. (2pts) Define a glacier: 2. (1pt) From an aircraft, how can you tell the difference between a snowfield and a snow-covered glacier? 3. (2pts) What is the relative size of Antarctica, Greenland,
1 GLACIERS 1. (2pts) Define a glacier: 2. (1pt) From an aircraft, how can you tell the difference between a snowfield and a snow-covered glacier? 3. (2pts) What is the relative size of Antarctica, Greenland,
Glaciers. Glacier Dynamics. Glacier Dynamics. Glaciers and Glaciation. Types of Glaciers. Chapter 15
 Chapter 15 Glaciers and Glaciation Glaciers A glacier is a large, permanent (nonseasonal) mass of ice that is formed on land and moves under the force of gravity. Glaciers may form anywhere that snow accumulation
Eastern Snow Conference: 2017 Student Award Recipient
 Eastern Snow Conference: 2017 Student Award Recipient Presentation title: Tracking changes in iceberg calving events and characteristics from Trinity and Wykeham Glaciers, SE Ellesmere, Canada Authors:
Three-dimensional modelling of calving processes on Johnsons Glacier, Livingston Island, Antarctica
 Geophysical Research Abstracts Vol. 12, EGU2010-6973, 2010 EGU General Assembly 2010 Author(s) 2010 Three-dimensional modelling of calving processes on Johnsons Glacier, Livingston Island, Antarctica Jaime
I. Types of Glaciers 11/22/2011. I. Types of Glaciers. Glaciers and Glaciation. Chapter 11 Temp. B. Types of glaciers
 Why should I care about glaciers? Look closely at this graph to understand why we should care? and Glaciation Chapter 11 Temp I. Types of A. Glacier a thick mass of ice that originates on land from the
The terillinus of Hubbard Glacier, Alaska
 Annals of Glaciology 16 1992 nternational Glaciological Society The terllinus of Hubbard Glacier, Alaska ROBERT M. KRMMEL ce and Climate Project, U.S. Geological Survry, University of Puget Sound, Tacoma,
Glaciers. Glacier Dynamics. Glaciers and Glaciation. East Greenland. Types of Glaciers. Chapter 16
 Chapter 16 Glaciers A glacier is a large, permanent (nonseasonal) mass of ice that is formed on land and moves under the force of gravity. Glaciers may form anywhere that snow accumulation exceeds seasonal
Glaciers and Glaciation Earth - Chapter 18 Stan Hatfield Southwestern Illinois College
 Glaciers and Glaciation Earth - Chapter 18 Stan Hatfield Southwestern Illinois College Glaciers Glaciers are parts of two basic cycles: 1. Hydrologic cycle 2. Rock cycle A glacier is a thick mass of ice
Mass balance of a cirque glacier in the U.S. Rocky Mountains
 Mass balance of a cirque glacier in the U.S. Rocky Mountains B. A. REARDON 1, J. T. HARPER 1 and D.B. FAGRE 2 1 Department of Geosciences, University of Montana, 32 Campus Drive #1296,Missoula, MT 59812-1296
Warming planet, melting glaciers
 Warming planet, melting glaciers Arun B Shrestha abshrestha@icimod.org International Centre for Integrated Mountain Development Kathmandu, Nepal Asia-Pacific Youth forum on Climate Actions and Mountain
Twentieth century surface elevation change of the Miage Glacier, Italian Alps
 Debris-Covered Glaciers (Proceedings of a workshop held at Seattle, Washington, USA, September 2000). IAHS Publ. no. 264, 2000. 219 Twentieth century surface elevation change of the Miage Glacier, Italian
Glacier change, kinematic waves, and outburst floods at. Nisqually Glacier, Mountain Rainier, Washington
 Glacier change, kinematic waves, and outburst floods at Introduction Nisqually Glacier, Mountain Rainier, Washington Data Analysis and Review By Jonathan Skloven Gill and Andrew G. Fountain, Department
Glaciers and Glaciation
 Chapter 18 Lecture Earth: An Introduction to Physical Geology Eleventh Edition Glaciers and Glaciation Tarbuck and Lutgens Glaciers: A Part of Two Basic Cycles A glacier is a thick mass of ice that forms,
HEATHROW COMMUNITY NOISE FORUM
 HEATHROW COMMUNITY NOISE FORUM 3Villages flight path analysis report January 216 1 Contents 1. Executive summary 2. Introduction 3. Evolution of traffic from 25 to 215 4. Easterly departures 5. Westerly
Egg-streme Parachuting Flinn STEM Design Challenge
 Egg-streme Parachuting Flinn STEM Design Challenge 6 07, Flinn Scientific, Inc. All Rights Reserved. Reproduced for one-time use with permission from Flinn Scientific, Inc. Batavia, Illinois, U.S.A. No
MAURI PELTO, Nichols College, Dudley, MA
 MAURI PELTO, Nichols College, Dudley, MA 01571(mspelto@nichols.edu) Advice I am looking for Better schemes for utilizing atmospheric circulation indices to provide a better forecast for glacier mass balance?
Lesson 5: Ice in Action
 Everest Education Expedition Curriculum Lesson 5: Ice in Action Created by Montana State University Extended University and Montana NSF EPSCoR http://www.montana.edu/everest Lesson Overview: Explore glaciers
Integration Of Reflectance To Study Glacier Surface Using Landsat 7 ETM+: A Case Study Of The Petermann Glacier In Greenland
 Integration Of Reflectance To Study Glacier Surface Using Landsat 7 ETM+: A Case Study Of The Petermann Glacier In Greenland Félix O. Rivera Santiago Department Of Geology, University Of Puerto Rico, Mayaguez
Glacier variations of Hielo Patagónico Norte, Chile, for +3.././,**./*/
 Bulletin of Glaciological Research,. (,1) /3 1 Japanese Society of Snow and Ice 59 Glacier variations of Hielo Patagónico Norte, Chile, for +3.././,.// Masamu ANIYA Graduate School of Life and Environmental
Barbara Borowiecki University of Wisconsin - Milwaukee
 POTENTIAL SIGNIFICANCE OF DRu}~IN FIELD MODIFICATION Barbara Borowiecki University of Wisconsin - Milwaukee Spatial characteristics of numerous drumlin fields, including the one in Wisconsin, have been
Chapter 16 Glaciers and Glaciations
 Chapter 16 Glaciers and Glaciations Name: Page 419-454 (2nd Ed.) ; Page 406-439 (1st Ed.) Part A: Anticipation Guide: Please read through these statements before reading and mark them as true or false.
Chapter 14. Glaciers and Glaciation
 Chapter 14 Glaciers and Glaciation Introduction Pleistocene Glaciations: A series of "ice ages" and warmer intervals that occurred 2.6 million to 10,000 years ago. The Little Ice Age was a time of colder
HYDRAULIC DESIGN OF THE TOURISTIC BERTHING IN ASWAN CITY
 HYDRAULIC DESIGN OF THE TOURISTIC BERTHING IN ASWAN CITY Dr. Hossam El-Sersawy Researcher, Nile Research Institute (NRI), National Water Research Center (NWRC), Egypt E-mail: h_sersawy@hotmail.com Dr.
EFFECT OF THE COASTAL CONSERVATION DUE TO BEACH NOURISHMENT OF TOTORI SAND DUNE COAST
 Proceedings of the 7 th International Conference on Asian and Pacific Coasts (APAC 203) Bali, Indonesia, September 2-26, 203 EFFECT OF THE COASTAL CONSERVATION DUE TO BEACH NOURISHMENT OF TOTORI SAND DUNE
Chapter 7 Snow and ice
 Chapter 7 Snow and ice Throughout the solar system there are different types of large ice bodies, not only water ice but also ice made up of ammonia, carbon dioxide and other substances that are gases
HEATHROW COMMUNITY NOISE FORUM. Sunninghill flight path analysis report February 2016
 HEATHROW COMMUNITY NOISE FORUM Sunninghill flight path analysis report February 2016 1 Contents 1. Executive summary 2. Introduction 3. Evolution of traffic from 2005 to 2015 4. Easterly departures 5.
MIDDLE SCHOOL CURRICULUM TR AILING ICE AGE M YST ERI E S ICE AGE TREKKING
 MIDDLE SCHOOL CURRICULUM TR AILING ICE AGE M YST ERI E S ICE AGE TREKKING CONTENTS I. Enduring Knowledge... 3 II. Teacher Background... 3 III. Before Viewing this Video... 5 IV. Viewing Guide... 5 V. Discussion
Mighty Glaciers. Mighty Glaciers. Visit for thousands of books and materials.
 Mighty Glaciers A Reading A Z Level M Leveled Reader Word Count: 684 LEVELED READER M Mighty Glaciers Written by Ned Jensen Visit www.readinga-z.com for thousands of books and materials. www.readinga-z.com
Climate Change Impact on Water Resources of Pakistan
 Pakistan Water and Power Development Authority (WAPDA) Climate Change Impact on Water Resources of Pakistan Glacier Monitoring & Research Centre Muhammad Arshad Pervez Project Director (GMRC) Outline of
AIR TRANSPORT MARKET ANALYSIS MAY 2011
 AIR TRANSPORT MARKET ANALYSIS MAY 2011 KEY POINTS May saw a renewed expansion in both air travel and freight, after a soft patch during the previous three months. Air travel volumes were 6.8% higher than
What is a Glacier? GLACIOLOGY vs. GLACIAL GEOLOGY. snow corn firn glacier snow = neve ice
 What is a Glacier? Mass of Ice Derived from Snow Lasts from Year to Year Moves Due to Its Own Weight GLACIOLOGY vs. GLACIAL GEOLOGY Transformation of Snow to Glacial Ice snow corn firn glacier snow = neve
A TOPOGRAPHIC FEATURE OF THE HANGING VALLEYS OF THE YOSEMITE.
 A TOPOGRAPHIC FEATURE OF THE HANGING VALLEYS OF THE YOSEMITE. THE larger hanging valleys around the Yosemite valley have topographic features in common that are interesting in themselves, and they likewise
BLASTING GLACIAL ICE AND SNOW ABSTRACT
 BLASTING GLACIAL ICE AND SNOW HERB BLEUER ABSTRACT This presentation, with the aid of slides, is about methods of blasting large quantities of glacial ice and snow. The project illustrated here involved
Comparison of Arrival Tracks at Different Airports
 Comparison of Arrival Tracks at Different Airports Yimin Zhang, Ph.D. Student Systems Engineering and Operations Research Center for Air Transportation Systems Research Fairfax, VA yzhangk@gmu.edu John
IATA ECONOMIC BRIEFING DECEMBER 2008
 ECONOMIC BRIEFING DECEMBER 28 THE IMPACT OF RECESSION ON AIR TRAFFIC VOLUMES Recession is now forecast for North America, Europe and Japan late this year and into 29. The last major downturn in air traffic,
LAB P - GLACIAL PROCESSES AND LANDSCAPES
 Introduction LAB P - GLACIAL PROCESSES AND LANDSCAPES Ice has been a significant force in modifying the surface of the earth at numerous times throughout Earth s history. Though more important during the
CHAPTER 4: PERFORMANCE
 CHAPTER 4: PERFORMANCE Soaring is all about performance. When you are flying an aircraft without an engine, efficiency counts! In this chapter, you will learn about the factors that affect your glider
Blocking Sea Intrusion in Brackish Karstic Springs
 European Water 1/2: 17-23, 3. 3 E.W. Publications Blocking Sea Intrusion in Brackish Karstic Springs The Case of Almiros Spring at Heraklion Crete, Greece A. Maramathas, Z. Maroulis, D. Marinos-Kouris
North Cascades National Park Complex Glacier Mass Balance Monitoring Annual Report, Water Year 2013
 National Park Service U.S. Department of the Interior Natural Resource Stewardship and Science North Cascades National Park Complex Glacier Mass Balance Monitoring Annual Report, Water Year 2013 North
Global Warming in New Zealand
 Reading Practice Global Warming in New Zealand For many environmentalists, the world seems to be getting warmer. As the nearest country of South Polar Region, New Zealand has maintained an upward trend
Physical Science in Kenai Fjords
 12 Physical Science in Kenai Fjords Harding Icefield s Clues to Climate Change by Virginia Valentine, Keith Echelmeyer, Susan Campbell, Sandra Zirnheld Visitors to Kenai Fjords National Park can watch
Remote Sensing into the Study of Ancient Beiting City in North-Western China
 Dingwall, L., S. Exon, V. Gaffney, S. Laflin and M. van Leusen (eds.) 1999. Archaeology in the Age of the Internet. CAA97. Computer Applications and Quantitative Methods in Archaeology. Proceedings of
IATA ECONOMICS BRIEFING AIRLINE BUSINESS CONFIDENCE INDEX OCTOBER 2010 SURVEY
 IATA ECONOMICS BRIEFING AIRLINE BUSINESS CONFIDENCE INDEX OCTOBER SURVEY KEY POINTS Results from IATA s quarterly survey conducted in October show business conditions continued to improve during the third
TECHNICAL NOTE NO. 1869
 NATIONAL ADVISORY COMMITI'E3 FOR AXRONAUTICS TECHNICAL NOTE NO. 1869 WIND-TITNNEL IlIYVESTEATmN OF THE OPENING CBARACTWISTICS, DRAG, AlYD STABILITY OF SERERAL By Stanley H. Scher and Lawrence J. Gale An
GLACIER INVENTORY OF JAMES ROSS AND VEGA ISLANDS, ANTARCTIC PENINSULA*
 Annals of Glaciology 3 1982 International Glaciological Society GLACIER INVENTORY OF JAMES ROSS AND VEGA ISLANDS, ANTARCTIC PENINSULA* by Jorge Rabassa, (Comisi6n de Investigaciones Cientificas, Provincia
Alaska Day 6 - Glacier Bay
 Alaska Day 6 - Glacier Bay Entering Glacier Bay National Park. Books about Alaska and its wildlife. Books about glaciers and Glacier Bay. Glacier Bay is a homeland, a natural lab, a wilderness, a national
GC 225 Lecture Exam #2
 GC 225 Lecture Exam #2 Direction- path along which something is moving. 3 Types; - COMPASS DIRECTIONAL NAME (32 in total) - BEARING (four 0 o - 90 o ) - AZIMUTHS (0 o - 360 o ) Compass (32 named points)
Using LiDAR to study alpine watersheds. Chris Hopkinson, Mike Demuth, Laura Chasmer, Scott Munro, Masaki Hayashi, Karen Miller, Derek Peddle
 Using LiDAR to study alpine watersheds Chris Hopkinson, Mike Demuth, Laura Chasmer, Scott Munro, Masaki Hayashi, Karen Miller, Derek Peddle Light Detection And Ranging r t LASER pulse emitted and reflection
Glaciological and Historical Analyses at the Boundary Glacier, Canadian Rocky Mountains
 Western Geography, 10/11(2000/01), pp. 30 42 Western Division, Canadian Association of Geographers Glaciological and Historical Analyses at the Boundary Glacier, Canadian Rocky Mountains N.K. Jones Professor
Thirteenth International Water Technology Conference, IWTC , Hurghada, Egypt 1249
 Thirteenth International Water Technology Conference, IWTC 13 2009, Hurghada, Egypt 1249 EVALUATION OF LOCAL SCOUR AROUND BRIDGE PIERS (RIVER NILE BRIDGES AS CASE STUDY) Sherine Ismail Assoc. Prof., Survey
Authentic Assessment in Algebra NCCTM Undersea Treasure. Jeffrey Williams. Wake Forest University.
 Undersea Treasure Jeffrey Williams Wake Forest University Willjd9@wfu.edu INTRODUCTION: Everyone wants to find a treasure in their life, especially when it deals with money. Many movies come out each year
CHAPTER 12: AERONAUTICAL CHARTS AND NAVIGATION
 CHAPTER 12: AERONAUTICAL CHARTS AND NAVIGATION Once you start to venture out from your home gliderport, you need to be able to figure out where you are and how to get where you want to go. Aeronautical
Impact of Climate Change on North Cascade Alpine Glaciers, and Alpine Runoff
 Mauri S. Pelto 1, Nichols College, Dudley, Massachusetts 01571 Impact of Climate Change on North Cascade Alpine Glaciers, and Alpine Runoff Abstract Analysis of key components of the alpine North Cascade
Dynamic Planet C Test
 Northern Regional: January 19 th, 2019 Dynamic Planet C Test Name(s): Team Name: School Name: Team Number: Rank: Score: Dynamic Planet B/C Glaciers (87 total points) Multiple choice/fill in the blank (23
THE NET VOLUMETRIC LOSS OF GLACIER COVER WITHIN THE BOW VALLEY ABOVE BANFF, /
 THE NET VOLUMETRIC LOSS OF GLACIER COVER WITHIN THE BOW VALLEY ABOVE BANFF, 1951-1993 1/ ABSTRACT CHRIS HOPKINSON 2/ Three methods have been used to explore the volumetric change of glaciers in the Bow
HYDROLOGY OF GLACIAL LAKES, FORT SISSETON AREA
 PROC. S.D. ACAD. SCI., VOL. 77 (1998) 59 HYDROLOGY OF GLACIAL LAKES, FORT SISSETON AREA Perry H. Rahn Department of Geology & Geological Engineering South Dakota School of Mines and Technology Rapid City,
CRYOSPHERE NEPAL. BIKRAM SHRESTHA ZOOWA Sr. Hydrologist Department of Hydrology and Meteorology NEPAL 2016
 CRYOSPHERE NEPAL BIKRAM SHRESTHA ZOOWA Sr. Hydrologist Department of Hydrology and Meteorology NEPAL 2016 ORGANISATIONAL STRUCTURE Ministry of Science, Technology and Environment DEPARTMENT OF HYDROLOGY
Evolution of Ossoue glacier, French Pyrenees: Tools and methods to generate a regional climate-proxy
 Evolution of Ossoue glacier, French Pyrenees: Tools and methods to generate a regional climate-proxy Renaud MARTI ab, Simon GASCOIN a, Thomas HOUET b, Dominique LAFFLY b, Pierre RENE c a CESBIO b GEODE,
J. Oerlemans - SIMPLE GLACIER MODELS
 J. Oerlemans - SIMPE GACIER MODES Figure 1. The slope of a glacier determines to a large extent its sensitivity to climate change. 1. A slab of ice on a sloping bed The really simple glacier has a uniform
Glacier variations of Hielo Patagónico Norte, Chile, over 70 years from 1945 to 2015
 Glacier variations of Hielo Patagónico Norte, Chile, over 70 years from 1945 to 2015 Masamu ANIYA 1 Abstract 1. Introduction Background Glacier variations of Hielo Patagónico Norte, Chile, over 70 years
APPENDIX J MODIFICATIONS PERFORMED TO THE TOR
 APPENDIX J MODIFICATIONS PERFORMED TO THE TOR This appendix summarizes the modifications that were performed in years 2012 and 2017 to rectify calculation errors that were observed in the data presented
The dynamic response of Kolohai Glacier to climate change
 Article The dynamic response of Kolohai Glacier to climate change Asifa Rashid 1, M. R. G. Sayyed 2, Fayaz. A. Bhat 3 1 Department of Geology, Savitribai Phule Pune University, Pune 411007, India 2 Department
The Role of Glaciers in the Hydrologic Regime of the Nepal Himalaya. Donald Alford Richard Armstrong NSIDC Adina Racoviteanu NSIDC
 The Role of Glaciers in the Hydrologic Regime of the Nepal Himalaya Donald Alford Richard Armstrong NSIDC Adina Racoviteanu NSIDC Outline of the talk Study area and data bases Area altitude distributed
PHYSICAL GEOGRAPHY GEOGRAPHY EARTH SYSTEMS COASTAL SYSTEMS FLUVIAL SYSTEMS
 PHYSICAL GEOGRAPHY EARTH SYSTEMS FLUVIAL SYSTEMS COASTAL SYSTEMS PHYSICAL GEOGRAPHY CORRIES / CIRQUES A Corrie or Cirque is the armchair shaped hollow that was the birthplace of a glacier. It has steep,
Motion 2. 1 Purpose. 2 Theory
 Motion 2 Equipment Capstone, motion sensor, meter stick, air track+ 2 gliders, 2 blocks, and index cards. Air Tracks In this experiment you will be using an air track. This is a long straight triangular
Some of the numbered sections of the track are described to the right. The times correspond to a graph found on page 58.
 QUALITATIVE QUESTIONS If the track were stretch out so that it were entirely in a single plane, the profile would look like the diagram below. Some of the numbered sections of the track are described to
1 Glacial Erosion and
 www.ck12.org Chapter 1. Glacial Erosion and Deposition CHAPTER 1 Glacial Erosion and Deposition Lesson Objectives Discuss the different erosional features formed by alpine glaciers. Describe the processes
World on the Edge - Climate Data - Ice Melt and Sea Level Rise
 World on the Edge - Climate Data - Ice Melt and Sea Level Rise Major Ice Disintegration and Calving Events, 1995-2010 September and Annual Average Arctic Sea Ice Extent, 1979-2010 GRAPH: September Arctic
The Potentially Dangerous Glacial Lakes
 Chapter 11 The Potentially Dangerous Glacial Lakes On the basis of actively retreating glaciers and other criteria, the potentially dangerous glacial lakes were identified using the spatial and attribute
MIDDLE SCHOOL CURRICULUM TR AILING ICE AGE M YST ERI E S SEARCHING GLACIAL FEATURES
 MIDDLE SCHOOL CURRICULUM TR AILING ICE AGE M YST ERI E S SEARCHING GLACIAL FEATURES CONTENTS I. Enduring Knowledge... 3 II. Teacher Background... 3 III. Before Viewing the Video... 5 IV. Viewing Guide...
Physical Geography: Learning and teaching in a discipline so dynamic that textbooks can t keep up!
 MATTERS Physical Geography: Learning and teaching in a discipline so dynamic that textbooks can t keep up! PETER G. KNIGHT ABSTRACT: Physical geography is a dynamic discipline. This makes geography exciting,