First Quarter Grupo Aeroportuario del Centro Norte S.A.B. de C.V.
|
|
|
- Arabella Parker
- 5 years ago
- Views:
Transcription

1 First Quarter 204 Grupo Aeroportuario del Centro Norte S.A.B. de C.V.
2 Investment Highlights Mexican airport portfolio positioned to take full advantage of global growth. 2 Diversified business model contributing to earnings resilience. 3 Well-defined strategy to capitalize favorable industry dynamic in traffic increases and profitability. 4 Successful implementation of commercial and diversification strategy. 5 Track record of operating and financial performance and solid capital structure. 6 Well-defined capital investment program to meet expected traffic growth. 7 Focus on total return with strong growth and dividend yield. 8 World-class, strong and experienced strategic shareholder. 9 Experienced management team with proven track record. 0 Transparent regulatory regime with clear parameters. 2


3 Company Overview


4 Broad Portfolio of Mexican airports Airport Distribution: Metropolitan 7 Regional 3 Tourist 2 Border City Hotel NH T2 Portfolio of 3 airports across 9 Mexican states. 50-year Federal concessions with 34 years of remaining life. 20-year lease to operate the NH Hotel T2 in the Mexico City airport that expires in Passenger Distribution (Q4 +6.8%) Domestic International Presence in important industrial states. In 204 Nuevo León received 70 new foreign companies. Chihuahua and Nuevo León are 2 nd and 3 rd place respectively in FDI inflows to México. 7% 46% 7% 8% Chihuahua doubled FDI between 202 and % 29% Presence in key domestic tourist destinations. Tourist Border City Source: INEGI, Secretaria de Economía. As of December 202. FDI (Foreign Direct Investment). Regional Metropolitan 4
5 A History of Successful Milestones Positive trend in passenger traffic. Sustained growth in revenues. Track record of operating efficiency and profitability. Business model resilient due to increasing Non-Aeronautical revenues. Consistent Growth and Operating Performance Revenue figures in MXN million ,37,204 4% 6% 9.7,334 9% 0.6,480 9% 86% 84% 8% 8%.8,687 9% 8% ,459 2,44,897,988,896 24% 8% 9% 9% 23% 82% 8% 8% 77% 76% ,065 3,30 2,820 26% 26% 24% 76% 74% 74% LTM Aeronautical Revenues Non Aeronautical Revenues Passenger Traffic (million) 3 Adjusted EBITDA Margin 2 39% 42% 47% 50% 54% 56% 53% 5% 44% 5% 54% 55% 54% Note: From 200 to 203 figures expressed under IFRS; figures expressed under MFRS. Represent the sum of aeronautical and non-aeronautical revenues (exclude construction). 2 Adjusted EBITDA Margin = Adjusted EBITDA / (Aeronautical + Non-Aeronautical Revenues). Adjusted EBITDA = Operating income + Depreciation and Amortization + Maintenance Provision. 3 As of March


6 World Class and Experienced Shareholders AEROINVEST, 24.70% SETA 6.70% SETA-AEROINVEST, 2.40% PUBLIC FLOAT, 58.60% 2 SETA-ADP, 4.30% Mexico s leading construction and infrastructure operations company, with important operations in Latin America and Europe. Company that specializes in airport management around the world, as well as participation in specialized management. SETA: Servicios de Tecnología Aeroportuaria S.A. de C.V. 2 include 2,88,977 repurchased shares as of March 3,


7 Strong Strategic Partner AEROINVEST, 24.70% 6.70% SETA SETA-AEROINVEST, 2.40% 2 PUBLIC FLOAT, 58.30% SETA-ADP, 4.30% Aeroinvest, Mexico s leading construction and infrastructure operations company, with important operations in Latin America and Europe. SETA: Servicios de Tecnología Aeroportuaria S.A. de C.V. 2 includes 2,88,977 repurchased shares as of March 3, 204. Company that specializes in airport management around the world, as well as participation in specialized management. Industry Outlook 7
8 Positive Trends in Aeronautical Industry Projected GDP GAGR Projected Domestic Passenger Traffic CAGR % 3.2% 3.5% 5.0% 5.0% 5.7% 5.7% 2.6% 3.2%.9% 2.% 2.3% Mexico Brazil Argentina Colombia Mexico Brazil Argentina Colombia Source: Economist Intelligence Unit. GDP Forecast. CAGR: Compound annual growth rate. Mexico United States Eastern Europe Canada Middle East Source: Airbus (Global Market Forecast ). South Africa Asia Central America Growth Passenger Traffic by Region GDP Recovery vs. Aeronautical Industry Recovery.0% 9.0% 7.0% 5.0% 3.0%.0% -.0% % -5.0% -7.0% Europe LatAm North America Asia/Pacific Source: World Bank. Last information available of % 8.0% 6.0% 4.0% 2.0% 0.0% -2.0% % Global Passenger Traffic Growth(ASK) World's Real GDP Growth Source: IATA, World Bank. Last information available of

9 Positive Outlook in Mexico Travelers in Mexico by Type of Transportation Air Passenger Transport per Capita 23.9% Economy bus Airplane Executive bus Train Sea Transportation Luxury bus.5% 0.4%.6%.9% Source: Ministry of Communication and Transportation 202 Report. Number of airplanes Mexican Commercial Fleet 70.7% Mexico Argentina Brazil Chile Canada United States Source: World Bank, Last information available of 202. Airlines Fleet and Expansion Plans airplanes Airplanes Orders/ additional Average Age Source: DGAC. Last information available as of December 203. Source: DGAC, Airlines. 9


10 Operational, Security, and Efficiency Leadership Increase Aeronautical Revenues Develop Air Traffic and Connectivity Increase Non- Aeronautical Revenues New Concession Opportunities OMA Strategy Diversification Sustainable Company Improve Passenger Experience


11 Air Traffic Development Strategy
12 Well-Defined Strategy to Drive Increase in Traffic and Profitability Incentive Strategy to Increase Aggregate Traffic 2 Increase and Capture Growing LCC Passenger Traffic Million of Passengers Increase New Routes Limited-Time Discounts Complementary Marketing Focus + Increase New Frequencies Low Cost Carriers Legacy Carriers Low cost carriers (LCC) include VivaAerobús, Interjet and Volaris Increase Domestic and International Routes 3 4 Las Vegas Tijuana Chicago Cd. Juárez Dallas Develop Monterrey as Regional HUB Tijuana Las Vegas Chicago Cd. Juárez Detroit Atlanta Dallas La Paz Culiacán Hermosillo 9 new routes opened in Q4 ( Volaris 8 TAR). Chihuahua Durango Mazatlán Zacatecas Guadalajara Torreón Zihuatanejo Acapulco McAllen Reynosa Monterrey Tampico San Luis Potosí Querétaro México Toluca Mérida Cancún Hermosillo 0 new routes opened in Q4. Increased connectivity. Chihuahua Culiacán La Paz Durango Los Cabos Mazatlán Monterrey AGS San Antonio Tampico Bajío Veracruz Puerto Vallarta Guadalajara Querétaro Toluca Houston Brownsville Mérida Orlando La Habana Cancún México Villahermosa Oaxaca Costa Rica Acapulco Tuxtla Gutiérrez Panamá 2

13 Commercial Strategy


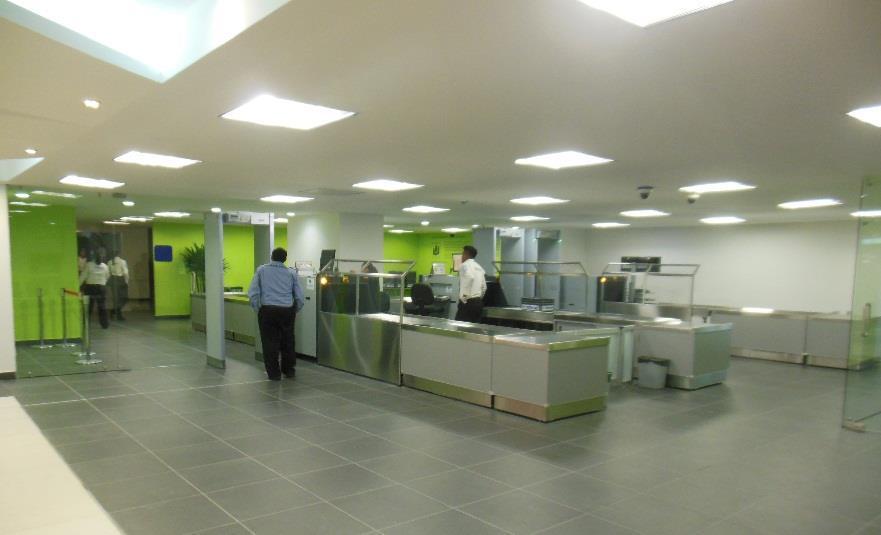
14 Improve Passenger Experience Commercial Key Points Maximize commercial areas. Improve commercial offerings. Increase presence of international franchises and renowned local brands. New services and sales channels. Introduce Premium strategy focus and loyalty programs. Marketing strategy: campaigns and special offers. Innovative and alternative advertising. Control and improve operation with commercial partners. 4


15 Diversification Strategy


16 Diversification Strategy Moving Forward Hotels Intermodal Centers Industrial and Logistic Parks Expansion plan through new businesses in our land reserve. Offices Service Stations Commercial and Retail Centers 6


17 Monterrey Airport Hotel Terminal A Partnership: Grupo Hotelero Santa Fe with5% stake and OMA 85%. Completition and opening Q5. Hotel Terminal B 34 rooms. Restaurant-bar services. Gym. Business center. Expected Hotel investment Ps. 60 million. 7


18 Industrial Park at Monterrey Airport Joint venture: OMA 5%-VYNMSA 49%. 32 hectares. Urbanization works and first warehouse (5,000 m2) expected to be finished on late 204. Expected investment Ps.600 million. Commercial area (future) Industrial Park 8


19 Operational and Sustainability Leadership

20 Sustainable Management Model OMA is part of the Mexican Stock Exchange Sustainability Index since 202. OMA Sustainability Report issued according to Global Reporting Initiative Guidelines. Quality Assurance Corporate Social Responsibility Occupational Health and Safety Environmental Care ISO 900 Certified since Customer satisfaction: OMA Mazatlán Airport awarded as Best Regional Airport in Latin American and Caribbean in years 20 and 203. Total Customer Satisfaction Index = 79% (Passengers + Airlines). Increasing communication with customers: 80% more feedbacks received against previous year. OMA ranked # out of 24 Social Responsible Companies recognized by CEMEFI. OMA is #53 of the Top 00 Best Place to Work Companies in México. Ciudad Juárez and Reynosa Airports certified as Family Responsible Company by the Mexican Ministry of Labor. OHSAS 800 Certified since 20. Drugs Free Workplace Certified since Airports certified as Safe Workplace by Mexican Ministry of Labor. ISO 400 Certified since 20. Environmental Quality Certified by Federal Environmental Protection Agency since OMA recognized by The United Nations Development Program and The Global Environment Fund for its participation in the PCB s Responsible Disposal Program. Mazatlán Airport won National Award for Electrical Energy Savings. Solar park at Zacatecas Airport. Source: Company filings, GRI Report. Conservation and Reforestation of Mangrove in Zihuatanejo Airport. 20


21 Results Track Record & & Track Results Record
22 Diversified Business Model Contributing to Earnings Resilience Aeronautical and Non-Aeronautical Revenue Mix Q4 Aeronautical Revenue/pax: Ps vs. Q3. 73% 27% Non Aeronautical Revenue/pax:Ps % vs. Q3. Million Pesos Aeronautical Revenues +7.9% 558 Non-Aeronautical Revenues Million Pesos Comercial Activities Diversification Activities Complementary Activities +2.7% Q 3 Q 4 Revenue Composition Q 3 Q 4 Revenue Composition Commercial Diversification Complementary +7% QoQ 2 +20% QoQ 2 +6% QoQ 2 TUA (Tarifa de Uso de Aeropuerto) is the charge to departure passengers from our airports. It is collected by airlines and then paid to us. 2 Quarter over quarter. Domestic TUA International TUA 23% Other Airport Services 9% Time Shares & Hotel 4% Car Rentals % Restaurants 2% Retail 6% Other 8% Parking 32% Advertising 7% OMA Carga 8% Real Estate 3% Hotel 79% Acces rights 6% Leasing of Space 46% Baggage Screening 48% 22


23 Commercial Strategy Results 6.8% increase in commercial revenues: 96.2% occupation rate in commercial areas. +3.8% increase in parking revenues % increase in restaurant revenues. +0.% increase in advertising revenues. +3.9% increase in car rentals revenues. +8.8% increase in retail revenues.

,898 25.6 Quarter over quarter.")
24 Occupancy Rate NH Hotel Strong Results Now operates its own parking area. Well positioned in market. 3 new events salons. Ps. million Q4 %Change QoQ Total Revenues Operating Result EBITDA EBITDA Margin 4.7% 56 bp Mexico City Airport Hotel Market RevPAR 2 :, % vs Q3 Occupancy Rate 75% 640 bp Average Daily Room Rate (pesos), Quarter over quarter. 2 Rev PAR: Revenue per available room. Average Rate 24
25 Operating Cost and Expenses Ps. million Total Operating Costs and Expenses Q4 % Change QoQ Cost of Services General and Administrative Expenses Major Maintenance Provision Construction Cost 74 (4.5) Concession Taxes Technical Assistance Fee Depreciation & Amortization Other Expenses (Revenues), Net Total Operating Cost and Expense Cost control initiatives: Increase efficiency in conjunction with suppliers. Strengthen audit and cost control system. Develop a savings culture program. Develop projects to save power consumption (Solar Park in Zacatecas airport and change to LED light in several airports). Major increase in: Minor maintenance (+88.8%). Payroll (+0.3%). Quarter over quarter. 25
26 Q4 Highlights Million pax/pesos Q4 % Change QoQ Passenger Traffic Aeronautical Revenues Non Aeronautical Revenues Total Aeronautical + Non Aeronautical Revenues Construction Revenues 74 (4.5) Income from Operations Adjusted EBITDA Adjusted EBITDA Margin 52.8% (39) bp Consolidated Net Income Strategy execution across all business lines: +7.9% Aeronautical Revenues: 9 new routes. 6.8% increase in passenger traffic. +2.7% Non Aeronautical Revenues Ps.64.0 revenues/pax: 24 quarters with NAR/PAX growth. Commercial: 96.2% occupancy rate. +3.8% parking revenues % restaurants revenues. Diversification: +8.3% NH Hotel revenues. +2.6% OMA Carga revenues. Complementary: +29.4% checked baggage screening. MDP and Strategic Investments 39 Quarter over quarter. 2 OMA calculates Adjusted EBITDA, which further adjusts EBITDA for the maintenance provision, construction revenue, and construction expense. The Adjusted EBITDA margin is calculated against the sum of aeronautical and non-aeronautical revenues. 26
27 3,500 3,000 2,500 2,000,500, OMA s Strategy has resulted in Strong Traffic, Revenues and Adjusted EBITDA Growth Passenger Traffic and Revenue Growth Pesos and million of terminal passengers LTM Total Passenger Revenue/Passenger Sum of aeronautical and non-aeronautical revenues divided by terminal passenger traffic. Focus On Cost Control CAGR % 900 Passenger Traffic and Non Aeronautical Revenue Growth Million of terminal passengers and Million of Pesos CAGR % LTM NAR Total Passenger Non Aeronautical Revenues (NAR) has increased faster than passenger traffic as a result of commercial initiatives and diversification projects. Adjusted EBITDA Margin CAGR % CAGR % Y-o-Y growth Financial Downturn 5% 4% 2% 3% 5% -5% 0% % 3% 2% 0% 9% 5% 9% 9% 2% 9% 3% 2,900 2,400,900, % 56% 53% 5% 44% 5% 54% 55% 54% CAGR % LTM Aeronautical+Non Aeronautical Revenues Operating Cost 2 As of March Operating costs excludes construction costs, maintenance provision, and other (expenses) income LTM Note: figures expressed under MFRS. 200 and forward figures under IFRS. 2 27
28 Focus on Generate Value ROA / ROE ROA ROE Pesos EPS 20.0% 8.0% 6.0% 8.8% % 2.0% 0.0% 8.0% 6.0% 4.0% 2.0% 7.2% 5.5% 6.% 4.6% 7.6%.2% 6.6% 0.% 8.2% 2.8% 0.9% % Historical Dividend / Capital Reimbursement Dividend Yield and Payout Ratio,400,200, Million Pesos,200,200,600,400,200, % 4.5% Título del gráfico 4.2% 5.7% 8.6% 6.9% 47% 00% 9.0% 8.0% 7.0% 6.0% 5.0% % % 85% 6% 8% 3.0% 2.0%.0% Note: 202, 20 and 200 figures expressed under IFRS; figures expressed under MFRS Payout Ratio Dividend Yield Dividend per share divided by year end closing share price. Include capital reimbursements. Denotes declared dividends for the results in the stated period different from the cash flow in the period %
29 Solid Balance Sheet and Capital Structure Total Debt Profile as of March 204 Debt Maturity Profile 7%,600,400,200 Million Pesos,300,500, % year 2 year 3 years 4 years 5 years + Pesos USD USD Debt OMACP OMA OMA3 Million Pesos Net Debt as of March 204 3,06, Million Pesos Net Debt /Adjusted EBITDA Industry average 3.x,573,573 Total Debt Cash Net Debt LTM As of March
30 High Visibility for Capital Investments MDP,2 Additional Recognition of Land Acquired Million Pesos Programmed MDP Investments = Ps. 2,745.2 Oriented to improve quality of services. MDP include major maintenance that is neither capitalized. nor amortized. It is recorded as major maintenance. provision in the income statement. Some MDP investments may be deferred for efficiency purposes. Federal Government agreed to recognize land reserve for Ps million acquired for Culiacan and Monterrey airports as improvement in concession assets. Diversification Projects under study CUU and CJS OMA Carga restarting. TAM shopping center. SLP & REX bonded warehouses. Million Pesos CUU Industrial Park CUL Hotel Diversification Investments In 204 OMA expects to invest in Diversification projects between Ps.250 and Ps. 450 million MDP Investment in Land Recognized Pesos of December 3, MDP: Master Development Plan. 30
 to be paid in four installments. US$ additional Debt of US$ 3. million, guaranteed by ExIM Bank. Quarterly amortization, maturity 209. Floating rate Libor 3M + 265 bp. Ps.")
31 Subsequent Events Capital Reimbursement Approved Additional Line of Credit The Annual Shareholders Meeting approved on April 0, 204 a capital reimbursement to shareholders of Ps,200 million (Ps per share) to be paid in four installments. US$ additional Debt of US$ 3. million, guaranteed by ExIM Bank. Quarterly amortization, maturity 209. Floating rate Libor 3M bp. Ps. 400 million (Ps..00 per share) no later than May 30, 204. Ps. 300 million (Ps per share) no later than July 3,204. Ps. 300 million (Ps per share) no later than September 30,204. Ps. 200 million (Ps per share) no later than November 30,

32 Outlook
33 Outlook Real Q4 Expected 204 Traffic growth 6.8% 4%-6% Aeronautical revenue + Non-Aeronautical revenue growth 9.2% 8%-0% Adjusted EBITDA Margin 52.8% 5%-53% MDP CAPEX(million pesos) Strategic CAPEX (million pesos) OMA is providing this outlook based on internal estimates. A number of factors could have a significant effect on the estimates of passenger traffic, revenue growth, Adjusted EBITDA, and Capex. These include changes in airline expansion plans, ticket prices and other factors affecting traffic volumes, the evolution of commercial and diversification projects, and economic conditions, among others. OMA can provide no assurance that the Company will achieve these results. 33

34 Our Airports


35 San Luis Potosí


36 Acapulco

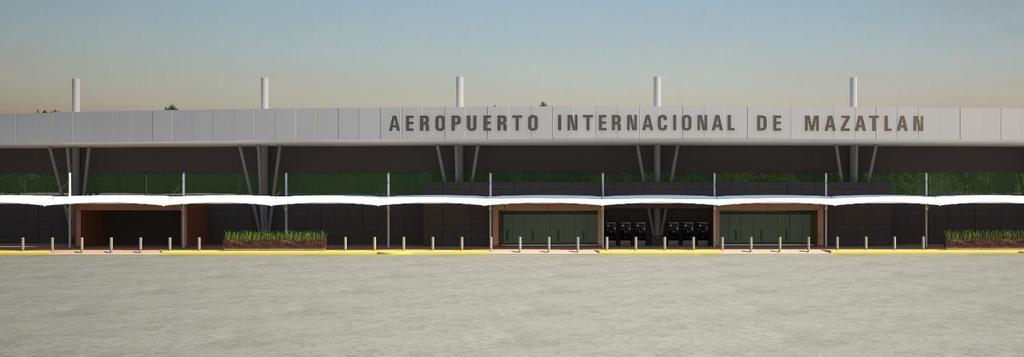


37 Mazatlán
Investment Highlights
 Second Quarter 2014 Investment Highlights 1 Mexican airport portfolio positioned to take full advantage of global growth. 2 Diversified business model contributing to earnings resilience. 3 Well-defined
Investment Highlights
 Third Quarter 2014 Investment Highlights 1 Mexican airport portfolio positioned to take full advantage of global growth. 2 Diversified business model contributing to earnings resilience. 3 Well-defined
Third Quarter 2015 Results
 Third Quarter 2015 Results Investment Highlights Positioned to take full advantage of global growth Diversified business model Well-defined strategy to capitalize on favorable industry dynamic Successful
First Quarter 2016 Results
 First Quarter 2016 Results This presentation may contain forward-looking information and statements. Forward-looking statements are statements that are not historical facts. These statements are only predictions
INVESTOR PRESENTATION FOURTH QUARTER 2017 RESULTS
 INVESTOR PRESENTATION FOURTH QUARTER 2017 RESULTS This presentation may contain forward-looking information and statements. Forward-looking statements are statements that are not historical facts. These
Grupo Aeroportuario del Centro Norte SAB de CV SECOND QUARTER 2018 RESULTS
 Grupo Aeroportuario del Centro Norte SAB de CV SECOND QUARTER 2018 RESULTS This presentation may contain forward-looking information and statements. Forward-looking statements are statements that are not
INVESTOR PRESENTATION THIRD QUARTER 2017 RESULTS
 INVESTOR PRESENTATION THIRD QUARTER 2017 RESULTS This presentation may contain forward-looking information and statements. Forward-looking statements are statements that are not historical facts. These
INVESTOR PRESENTATION SECOND QUARTER 2017 RESULTS
 INVESTOR PRESENTATION SECOND QUARTER 2017 RESULTS This presentation may contain forward-looking information and statements. Forward-looking statements are statements that are not historical facts. These
UBS Latin American New Opportunities Conference. June 11 th -12 th, 2007
 UBS Latin American New Opportunities Conference June 11 th -12 th, 2007 Company Overview OMA operates a diversified portfolio of 13 airports distributed throughout Northern and Central Mexico and is diversified
First Quarter 2010 Earnings Report
 First Quarter 2010 Earnings Report April 23, 2010 Mexican airport operator Grupo Aeroportuario del Centro Norte, S.A.B. de C.V., known as OMA (NASDAQ: OMAB; BMV: OMA), reported its unaudited, preliminary
Santander Conference Acapulco. January 2007
 Santander Conference Acapulco January 2007 Post-IPO Shareholder Ownership IPO on November 29, 2006; 47% free float Aeroinvest* 74.5% 25.5% SETA Public Float B Shares (Mexico) 50% ADSs 50% 36.0%* 16.7%
Third Quarter 2010 Earnings Report
 Third Quarter 2010 Earnings Report October 19, 2010 Mexican airport operator Grupo Aeroportuario del Centro Norte, S.A.B. de C.V., known as OMA (NASDAQ: OMAB; BMV: OMA), reported its unaudited, preliminary
OMA Announces Fourth Quarter 2011 Earnings
 OMA Announces Fourth Quarter 2011 Earnings Monterrey, Mexico, February 23, 2012 -Mexican airport operator Grupo Aeroportuario del Centro Norte, S.A.B. de C.V., known as OMA (NASDAQ: OMAB; BMV: OMA), reported
Corporate Presentation April 2018
 Corporate Presentation April 2018 1 Grupo Hotelero Santa Fe Ticker: HOTEL (BMV) Financial Highlights (LTM March 31, 2018 ) Revenue: Ps. 1,769 million (US 96 million) EBITDA: Ps. 603 million (US 33 million)
Corporate Presentation April 2018
 Corporate Presentation April 2018 1 Grupo Hotelero Santa Fe Ticker: HOTEL (BMV) Financial Highlights (LTM June 30, 2018 ) Revenue: Ps. 1,873 million (US 94 million) EBITDA: Ps. 627 million (US 32 million)
Corporate Presentation February 2018 NOMBRE DE LA PRESENTACIÓN
 Corporate Presentation February 2018 NOMBRE DE LA PRESENTACIÓN 1 1 Grupo Hotelero Santa Fe Ticker: HOTEL (BMV) 2017 Financial Highlights Revenue: Ps. 1,582 million (US 80 million) EBITDA: Ps. 528 million
UBS 14 th Global Emerging Markets Conference. New York, November 2016
 UBS 14 th Global Emerging Markets Conference New York, November 2016 This presentation may include forward-looking comments regarding the Company s business outlook and anticipated financial and operating
FibraHotel ended the quarter with 37 hotels and 5,132 rooms, with 34 hotels in operation (4,798 rooms) and 3 hotels under development (334 rooms).
 and 3 hotels under development (334 rooms).") FibraHotel ( FibraHotel ), the first real estate investment trust specialized in urban business-class hotels in Mexico, announces its financial results and distribution corresponding to the second quarter
FibraHotel ( FibraHotel ), the first real estate investment trust specialized in urban business-class hotels in Mexico, announces its financial results and distribution corresponding to the second quarter
Corporate Presentation February 2019
 Corporate Presentation February 2019 1 Grupo Hotelero Santa Fe Ticker: HOTEL (BMV) Financial Highlights (LTM Dec 31, 2018 ) Revenue: Ps. 2,064 million (US 105 million) EBITDA: Ps. 676 million (US 34 million)
FIRST QUARTER RESULTS 2017
 FIRST QUARTER RESULTS 2017 KEY RESULTS In the 1Q17 Interjet total revenues added $4,421.5 million pesos that represented an increase of 14.8% over the income generated in the 1Q16. In the 1Q17, operating
OMA announces Third Quarter 2017 Operational and Financial Results
 OMA announces Third Quarter 2017 Operational and Financial Results Monterrey, Mexico, October 17, 2017 Mexican airport operator Grupo Aeroportuario del Centro Norte, S.A.B. de C.V., known as OMA (NASDAQ:
Deutsche Bank 16 th Annual Global Emerging Markets. New York, September 2017
 Deutsche Bank 16 th Annual Global Emerging Markets New York, September 2017 This presentation may include forward-looking comments regarding the Company s business outlook and anticipated financial and
Results 1 st Quarter 2005
 Grupo Posadas, s, S.A. de C.V. & Subsidiaries April 28, 2005 Results 1 st Quarter 2005 Total revenues increase 13% in the quarter Higher demand in urban hotels Better results in coastal hotels 3 openings
THIRD QUARTER AND NINE MONTHS OF 2014 KEY RESULTS
 THIRD QUARTER AND NINE MONTHS OF 2014 KEY RESULTS In 3Q14 INTERJET total revenues were $ 3,643.4 million, representing an increase of 9.9% on revenues generated in the 3Q13. Accumulated 9M14 INTERJET total
THIRD QUARTER RESULTS 2017
 THIRD QUARTER RESULTS 2017 KEY RESULTS In the 3Q17 Interjet total revenues added $5,835.1 million pesos that represented an increase of 22.0% over the revenue generated in the 3Q16. In the 3Q17, operating
Santander 22 nd Annual Latin American Conference. Cancun, January 2018
 Santander 22 nd Annual Latin American Conference Cancun, January 2018 This presentation may include forward-looking comments regarding the Company s business outlook and anticipated financial and operating
FOURTH QUARTER RESULTS 2017
 FOURTH QUARTER RESULTS 2017 KEY RESULTS In the 4Q17 Interjet total revenues added $5,824.8 million pesos that represented an increase of 10.8% over the revenue generated in the 4Q16. In the 4Q17, operating
Bank of America Merrill Lynch 2018 Emerging Markets Corporate Credit Conference. Miami, May 2018
 Bank of America Merrill Lynch 2018 Emerging Markets Corporate Credit Conference Miami, May 2018 This presentation may include forward-looking comments regarding the Company s business outlook and anticipated
Bank of America Merrill Lynch Emerging Markets Corporate Conference. Miami, June 2016
 Bank of America Merrill Lynch Emerging Markets Corporate Conference Miami, June 2016 This presentation may include forward-looking comments regarding the Company s business outlook and anticipated financial
Results 2 nd Quarter 2004
 Grupo Posadas, s, S.A. de C.V. & Subsidiaries July 28 th, 2004 Results 2 nd Quarter 2004 Cosolidated revenues increased 11% EBITDA increased 15% Recovery on REVPAR 3 new openings in the 2Q04, which sum
Operative & Financial Results:
 Operative & Financial Results: F i r s t Q u a r t e r 2 0 1 4 Grupo Posadas, S.A.B. de C.V. & Subsidiaries Mexico City April 29, 2014 Information presented with respect to the same quarter of last year
Grupo Hotelero Santa Fe Reports Increase of 36% in Total Revenue and 46% EBITDA for 1Q16
 Grupo Hotelero Santa Fe Reports Increase of 36% in Total Revenue and 46% EBITDA for 1Q16 Mexico City, April 21, 2016 Grupo Hotelero Santa Fe S.A.B. de C.V. (BMV: HOTEL) ( HOTEL or the Company ), announced
4 th and 7 th, 2014, respectively. 2
 FibraHotel ( FibraHotel ), the first real estate investment trust specialized in business-class hotels in Mexico, announces its financial results and distribution corresponding to the first quarter of
Enhancing air travel options through a strong focus on profitability and innovation. 4 th Quarter 2017 Earnings Report Grupo Viva Aerobus
 4 th Quarter 2017 Earnings Report Grupo Viva Aerobus Enhancing air travel options through a strong focus on profitability and innovation 1 VIVA AEROBUS REPORTS GROWTH OF 17.9% IN TOTAL OPERATING REVENUE
Thank you for participating in the financial results for fiscal 2014.
 Thank you for participating in the financial results for fiscal 2014. ANA HOLDINGS strongly believes that safety is the most important principle of our air transportation business. The expansion of slots
 FibraHotel ( FibraHotel ), the first real estate investment trust specialized in hotels in Mexico, announces its financial results and distribution corresponding to the second quarter of 2018. Mexico City,
 FibraHotel ( FibraHotel ), the first real estate investment trust specialized in hotels in Mexico, announces its financial results and distribution corresponding to the third quarter of 2018. Mexico City,
ASUR 2Q11 PASSENGER TRAFFIC UP 2.89% YOY
 In Mexico ASUR Lic. Adolfo Castro (52) 5552-84-04-08 acastro@asur.com.mx In the U.S. Breakstone Group Susan Borinelli (646) 330-5907 sborinelli@breakstone-group.com ASUR 2Q11 PASSENGER TRAFFIC UP 2.89%
THIRD QUARTER RESULTS 2018
 THIRD QUARTER RESULTS 2018 KEY RESULTS In the 3Q18 Interjet total revenues added $ 6,244.8 million pesos that represented an increase of 7.0% over the revenue generated in the 3Q17. In the 3Q18, operating
FIRST QUARTER RESULTS 2016
 FIRST QUARTER RESULTS 2016 KEY RESULTS In 1Q16 Interjet total revenues added $3,850.8 million pesos that represented an increase of 21.9% over the income generated in the 1Q15. In 1Q16 total passengers
HOTEL reports 49% and 50% increases in Total Revenues and EBITDA respectively for 1Q18
 HOTEL reports 49% and 50% increases in Total Revenues and EBITDA respectively for 1Q18 Mexico City, April 19 th, 2018 Grupo Hotelero Santa Fe S.A.B. de C.V. (BMV: HOTEL) ( HOTEL or the Company ), announced
Volaris: the leading ULCC airline serving Mexico, USA and Central America. March 2018
 Volaris: the leading ULCC airline serving Mexico, USA and Central America March 2018 1 Disclaimer The information ("Confidential Information") contained in this presentation is confidential and is provided
OPERATING AND FINANCIAL HIGHLIGHTS. Subsequent Events
 Copa Holdings Reports Financial Results for the First Quarter of 2016 Excluding special items, adjusted net income came in at US$69.9 million, or EPS of US$1.66 per share Panama City, Panama --- May 5,
J.P. Morgan 2019 Global Emerging Markets Corporate Conference. Miami, February 2019
 J.P. Morgan 2019 Global Emerging Markets Corporate Conference Miami, February 2019 This presentation may include forward-looking comments regarding the Company s business outlook and anticipated financial
Volaris: the leading ultra-low-cost airline serving Mexico, USA and Central America
 Volaris: the leading ultra-low-cost airline serving Mexico, USA and Central America January 2018 Disclaimer The information ("Confidential Information") contained in this presentation is confidential and
TOKYO MEETINGS NOVEMBER 2016
 TOKYO MEETINGS NOVEMBER 2016 CONTENTS AEROMEXICO AT A GLANCE BUILDING A STRONG AND FLEXIBLE AIRLINE STRATEGIC INITIATIVES 2 AEROMEXICO: MEXICO S PREMIUM NETWORK CARRIER. Mexico s only full service carrier,
Operative & Financial Results:
 Operative & Fincial Results: S e c o n d Q u a r t e r 2 0 1 4 Grupo Posadas, S.A.B. de C.V. & Subsidiaries Mexico City, July 28, 2014 Information presented with respect to the same quarter of last year
Toluca Tollocan and development of One Toluca Tollocan) representing 401 rooms.
 representing 401 rooms.") FibraHotel ( FibraHotel ), the first real estate investment trust specialized in urban business-class hotels in Mexico, announces (i) the execution and approval of agreements for the acquisition of 15
FibraHotel ( FibraHotel ), the first real estate investment trust specialized in urban business-class hotels in Mexico, announces (i) the execution and approval of agreements for the acquisition of 15
Enhancing air travel options through a strong focus on profitability and innovation innovation
 2 nd Quarter 2018 Earnings Report Grupo Viva Aerobus Enhancing air travel options through a strong focus on profitability and innovation innovation 1 VIVA AEROBUS REPORTS GROWTH OF 32.3% IN EBITDAR AND
Investment Highlights
 Investment Highlights Key value drivers Long-term concession investments in attractive locations in Mexico Established regulatory framework Track record of consistent passenger growth Balanced mix of international
Enhancing air travel options through a strong focus on profitability and innovation. 3 rd Quarter 2018 Earnings Release Grupo Viva Aerobus
 3 rd Quarter 2018 Earnings Release Grupo Viva Aerobus Enhancing air travel options through a strong focus on profitability and innovation 1 VIVA AEROBUS REPORTS GROWTH OF 25.8% IN TOTAL REVENUE & 20.5%
Grupo Posadas, S.A.B. de C.V. & Subsidiaries Mexico City, October 23, 2014
 Operative & Fincial Results: Third Quarter 2014 Grupo Posadas, S.A.B. de C.V. & Subsidiaries Mexico City, October 23, 2014 Information presented with respect to the same quarter of last year under IFRS
NOVEMBER YEAR III LATIN AMERICA&CARIBBEAN MID-MARKETS: OPPORTUNITIES IN THE REGION
 NOVEMBER 2011 - YEAR III MARKETWATCH LATIN AMERICA&CARIBBEAN MID-MARKETS: OPPORTUNITIES IN THE REGION THE REGION IN PERSPECTIVE LAC in Perspective - 2011 Facts % of the world 595 mi people 9,3 $ 5,8 tri
 FibraHotel ( FibraHotel ), the first real estate investment trust specialized in business-class hotels in Mexico, announces its financial results and distribution corresponding to the fourth quarter of
 FibraHotel ( FibraHotel ), the first real estate investment trust specialized in hotels in Mexico, announces its financial results and distribution corresponding to the first quarter of 2018. Mexico City,
Operative & Financial Results: FIESTA INN HOTELES BUSINESS CLASS
 Operative & Fincial Results: F o u r t h Q u a r t e r 2 0 1 4 FIESTA INN HOTELES BUSINESS CLASS Grupo Posadas, S.A.B. de C.V. & Subsidiaries Mexico City, February 26, 2015 Information presented with respect
Volaris: the leading ultra-low-cost airline serving Mexico, USA and Central America
 Volaris: the leading ultra-low-cost airline serving Mexico, USA and Central America May 2017 Disclaimer The information ("Confidential Information") contained in this presentation is confidential and is
HOTEL reports double-digit growth in both Total Revenues and EBITDA for 3Q17
 HOTEL reports double-digit growth in both Total Revenues and EBITDA for 3Q17 Mexico City, October 25, 2017 Grupo Hotelero Santa Fe S.A.B. de C.V. (BMV: HOTEL) ( HOTEL or the Company ), announced its consolidated
Investor Relations Presentation. March 2018
 Investor Relations Presentation March 2018 Aeromexico: Mexico s premium revenue carrier Aeromexico Delta relationship: A new chapter Building a strong and flexible airline 2 Aeromexico s business model
Grupo Hotelero Santa Fe Reports 24% Increase in Total Revenue and 28% in EBITDA for 2Q16
 Grupo Hotelero Santa Fe Reports 24% Increase in Total Revenue and 28% in EBITDA for 2Q16 Mexico City, July 21, 2016 Grupo Hotelero Santa Fe S.A.B. de C.V. (BMV: HOTEL) ( HOTEL or the Company ), announced
HOTEL reports 24% and 19% growth in Total Revenues and EBITDA respectively for 3Q18
 Mexico City, October 25 th, 2018 Grupo Hotelero Santa Fe S.A.B. de C.V. (BMV: HOTEL) ( HOTEL or the Company ), announced its consolidated results for the third quarter ( 3Q18 ) ended September 30 th, 2018.
OPERATING AND FINANCIAL HIGHLIGHTS SUBSEQUENT EVENTS
 Copa Holdings Reports Net Income of US$6.2 Million and EPS of US$0.14 for the Third Quarter of 2015 Excluding special items, adjusted net income came in at $37.4 million, or EPS of $0.85 per share Panama
Volaris Reports Strong First Quarter 2015: 32% Adjusted EBITDAR Margin, 9% Operating Margin
 Volaris Reports Strong First Quarter 2015: 32% Adjusted EBITDAR Margin, 9% Operating Margin Mexico City, Mexico, April 22, 2015 Volaris* (NYSE: VLRS and BMV: VOLAR), the ultra-low-cost airline serving
INVESTOR RELATIONS PRESENTATION Investor Relations Presentation September 2015
 INVESTOR RELATIONS PRESENTATION Investor Relations Presentation September 2015 AEROMEXICO: MEXICO S PREMIUM REVENUE CARRIER. Mexico s only full service carrier, offering customers up to a three-class service.
ASUR 2Q15 PASSENGER TRAFFIC UP 14.27% YOY
 In Mexico ASUR Lic. Adolfo Castro (52) 5552-84-04-08 acastro@asur.com.mx In the U.S. MBS Value Partners Susan Borinelli (646) 330-5907 susan.borinelli@mbsvalue.com For Immediate Release ASUR 2Q15 PASSENGER
Results 3 rd Quarter 2003
 Grupo Posadas, s, S.A. de C.V. & Subsidiaries October 28 th, 2003 Results 3 rd Quarter 2003 Total revenue and EBITDA increased by 10 and 12 % respectively Coastal hotels continue to improve, rates on urban
Results 1 st Quarter 2004
 Grupo Posadas, s, S.A. de C.V. & Subsidiaries April 30 th, 2004 Results 1 st Quarter 2004 Consolidated revenue decreased 1.3%. Revenew and Conectum progress is on track in order to improve the profitability
Total revenues for the quarter were Ps. $635 million. Lodging contribution 2 for the quarter was Ps. $201 million.
 FibraHotel ( FibraHotel ), the first real estate investment trust specialized in business-class hotels in Mexico, announces its financial results and distribution corresponding to the second quarter of
OPERATING AND FINANCIAL HIGHLIGHTS
 Copa Holdings Reports Financial Results for the Fourth Quarter of 2015 Excluding special items, adjusted net income came in at $31.7 million, or EPS of $0.73 per share Panama City, Panama --- February
Mexico at a Glance. Toronto, December 2013
 Mexico at a Glance Toronto, December 2013 1990 1991 1992 1993 1994 1995 1996 1997 1998 1999 Billion Dollars 1990 s the land of opportunity but not for the faint of heart NAFTA Dynamic growth in the industrial
SECOND QUARTER RESULTS 2018
 SECOND QUARTER RESULTS 2018 KEY RESULTS In the 2Q18 Interjet total revenues added $ 5,781.9 million pesos that represented an increase of 9.6% over the revenue generated in the 2Q17. In the 2Q18, operating
OPERATING AND FINANCIAL HIGHLIGHTS
 Copa Holdings Reports Net Income of US$32.0 Million and EPS of US$0.72 for the Second Quarter of 2012 Excluding special items, adjusted net income came in at $58.6 million, or EPS of $1.32 per share Panama
Results of Tourist Activity
 Results of Tourist Activity México, January, 2014 Ministry of Tourism Tourist Planning and Policy Undersecretariat Index Relevant Results, January, 2014.. Analysis of Main Results in the Sector..... 1
During the quarter, FibraHotel announced the development of the One Durango hotel, adding 126 rooms in development.
 FibraHotel ( FibraHotel ), the first real estate investment trust specialized in business-class hotels in Mexico, announces its financial results and distribution corresponding to the second quarter of
ASUR 2Q14 PASSENGER TRAFFIC UP 10.65% YOY
 In Mexico ASUR Lic. Adolfo Castro (52) 5552-84-04-08 acastro@asur.com.mx In the U.S. Breakstone Group Susan Borinelli (646) 330-5907 sborinelli@breakstone-group.com ASUR 2Q14, Page 1 of 21 For Immediate
5. Economic performance
 AT 1 1 Economic performance STOCK MAINTAINING LEADERSHIP EFFICIENCY AND COMPETITIVENESS Income Costs INVESTMENT GENERATING CAPACITY AND VALUE AT 1 1 Profitability CHALLENGES AIMS 2018 PROGRESS IN SDG The
Results of Tourism Activity
 Results of Tourism Activity Mexico, October 2014 Puebla, Puebla. Tlacotalpan, Veracruz. Ex plaza de toros, Zacatecas. San José de García, Aguascalientes. Undersecretariat of Planning and Tourism Policy
Results of Tourism Activity
 Results of Tourism Activity Mexico, September 2014 CINTERMEX, Monterrey. Pantanos de Centla, Tabasco. Zacatlán, Puebla. Cd. de Durango, Durango. Undersecretariat of Planning and Tourism Policy Index Outstanding
ABX. Holdings, Inc. BB&T Transportation Conference. February 2008
 ABX Holdings, Inc. BB&T Transportation Conference February 2008 1 Safe Harbor Statement Except for historical information contained herein, the matters discussed in this presentation contain forward-looking
OPERATING AND FINANCIAL HIGHLIGHTS
 Copa Holdings Reports Financial Results for the Fourth Quarter of 2018 Excluding special items, adjusted net profit came in at $44.0 million, or Adjusted EPS of $1.04 Panama City, Panama --- February 13,
OPERATING AND FINANCIAL HIGHLIGHTS SUBSEQUENT EVENTS
 Copa Holdings Reports Financial Results for the Third Quarter of 2016 Excluding special items, adjusted net income came in at $55.3 million, or adjusted EPS of $1.30 per share Panama City, Panama --- November
J.P. Morgan 9 th Annual Global Emerging Markets Corporate Conference. Miami, February 2018
 J.P. Morgan 9 th Annual Global Emerging Markets Corporate Conference Miami, February 2018 This presentation may include forward-looking comments regarding the Company s business outlook and anticipated
Santander 20 th Annual Latin America CEO Conference Cancun, January 2016
 Santander 20 th Annual Latin America CEO Conference Cancun, January 2016 This presentation may include forward-looking comments regarding the Company s business outlook and anticipated financial and operating
Copa Holdings Reports Record Earnings of US$41.8 Million for 4Q06 and US$134.2 Million for Full Year 2006
 Copa Holdings Reports Record Earnings of US$41.8 Million for 4Q06 and US$134.2 Million for Full Year 2006 Panama City, Panama --- March 7, 2007. Copa Holdings, S.A. (NYSE: CPA), parent company of Copa
Agenda. I. The Mexican Market. II. What Next in 2012? Financial Results. IV. Key Initiatives (Medium and Long Term)
") Agenda I. The Mexican Market II. What Next in 2012? III. Financial Results IV. Key Initiatives (Medium and Long Term) Agenda The Mexican Market Mexico: A Growing Market Mexican equity markets are outperforming,
Agenda I. The Mexican Market II. What Next in 2012? III. Financial Results IV. Key Initiatives (Medium and Long Term) Agenda The Mexican Market Mexico: A Growing Market Mexican equity markets are outperforming,
During the fourth quarter, FibraHotel announced the developments of the Live Aqua San Miguel de Allende and Fiesta Americana Tlalnepantla hotels.
 FibraHotel ( FibraHotel ), the first real estate investment trust specialized in business-class hotels in Mexico, announces its financial results and distribution corresponding to the fourth quarter of
ACI Annual Assembly Conference & Exhibition
 ACI Annual Assembly Conference & Exhibition Benefits and efficiencies of managing a group of airports versus just one Revenue side: More Competiveness Promoting intra-company routes GAP gets the advantage
2Q Earnings Results Presentation
 2Q Earnings Results Presentation SAFE HARBOR The present document consolidates information from Avianca Holdings S.A. and its subsidiaries, including unaudited financial figures, operational managerial
MRO Market Update & Industry Trends
 January 25-26, 2017 Cancun, Mexico Presented by: Jonathan M. Berger Vice President ICF jberger@icf.com MRO Market Update & Industry Trends 0 Today s Agenda Fleet & MRO Forecast 2016: What a long strange
Management Presentation. March 2016
 Management Presentation March 2016 Forward looking statements This presentation as well as oral statements made by officers or directors of Allegiant Travel Company, its advisors and affiliates (collectively
OPERATING AND FINANCIAL HIGHLIGHTS. Subsequent Events
 Copa Holdings Reports Net Income of $103.8 million and EPS of $2.45 for the Third Quarter of 2017 Excluding special items, adjusted net income came in at $100.8 million, or EPS of $2.38 per share Panama
Copa Holdings Reports Net Income of $49.9 million and EPS of $1.18 for the Second Quarter of 2018
 Copa Holdings Reports Net Income of $49.9 million and EPS of $1.18 for the Second Quarter of 2018 Panama City, Panama --- Aug 8, 2018. Copa Holdings, S.A. (NYSE: CPA), today announced financial results
Grupo Hotelero Santa Fe Reports Increase of 33% in Total Revenue and 51% EBITDA for 2015
 Grupo Hotelero Santa Fe Reports Increase of 33% in Total Revenue and 51% EBITDA for 2015 Mexico City, February 25, 2016 Grupo Hotelero Santa Fe S.A.B. de C.V. (BMV: HOTEL) ( HOTEL or the Company ), announced
Enhancing air travel options through a strong focus on profitability and innovation. 1 rst Quarter 2018 Earnings Report Grupo Viva Aerobus
 1 rst Quarter 2018 Earnings Report Grupo Viva Aerobus Enhancing air travel options through a strong focus on profitability and innovation 1 VIVA AEROBUS REPORTS GROWTH OF 49.2% IN REVENUE AND 83.2% IN
OPERATING AND FINANCIAL HIGHLIGHTS. Subsequent Events
 Copa Holdings Reports Net Income of US$113.1 Million and EPS of US$2.57 for the First Quarter of 2015 Excluding special items, adjusted net income came in at US$106.0 million, or EPS of US$2.41 per share
Management Presentation. May 2013
 Management Presentation May 2013 Forward looking statements This presentation as well as oral statements made by officers or directors of Allegiant Travel Company, its advisors and affiliates (collectively
Heathrow (SP) Limited
 Limited") 28 April 2014 Heathrow (SP) Limited Results for three months ended 31 March 2014 Strong operational and financial performance at the outset of the new regulatory period Highest ever passenger satisfaction
28 April 2014 Heathrow (SP) Limited Results for three months ended 31 March 2014 Strong operational and financial performance at the outset of the new regulatory period Highest ever passenger satisfaction
MGM Resorts International Reports Second Quarter Financial Results
 NEWS RELEASE MGM Resorts International Reports Second Quarter Financial Results 8/5/2014 Consolidated Adjusted EBITDA Increased 8%, Led By 10% Growth In Wholly Owned Domestic Resorts MGM China Declares
Mexico's Logistics Infrastructure Update " Ciudad Juárez, Chihuahua May 16,2008
 Mexico's Logistics Infrastructure Update " Ciudad Juárez, Chihuahua May 16,2008 Global Logistics Update Comparative Country Rankings (Quality of Infrastructure) MEXICO USA BRAZIL JAPAN GERMANY CHINA 61
VIVA AEROBUS COMPANY PRESENTATION SEPTEMBER 2018
 VIVA AEROBUS COMPANY PRESENTATION SEPTEMBER 2018 Disclaimer This presentation contains certain statements related to the comprehensive overview Grupo VivaAerobus, S.A. de C.V. Viva" regarding its activities