OMA Announces Fourth Quarter 2011 Earnings
|
|
|
- Patience Griffith
- 5 years ago
- Views:
Transcription
, reported its unaudited results for the fourth quarter of 2011 today. 1 OMA recorded solid results in the fourth quarter 2011.")
1 OMA Announces Fourth Quarter 2011 Earnings Monterrey, Mexico, February 23, Mexican airport operator Grupo Aeroportuario del Centro Norte, S.A.B. de C.V., known as OMA (NASDAQ: OMAB; BMV: OMA), reported its unaudited results for the fourth quarter of 2011 today. 1 OMA recorded solid results in the fourth quarter The recovery of passenger traffic (+7.1%) benefited both aeronautical revenues and non-aeronautical revenues, which increased a combined 29%. Passenger traffic increased 7.1% to 3.0 million in 4Q11; domestic traffic increased 9.4%, while international traffic decreased 4.7%. Aeronautical revenues increased 32.7% as the result of the growth in passenger traffic and the increase in passenger charges and aeronautical services tariffs. Non-aeronautical revenues increased 18.3% as the result of the development and implementation of commercial and diversification initiatives. The NH T2 hotel in the Mexico City International Airport increased revenues 9.6%, as a result of an increase in the occupancy rate and higher room rates. The sum of aeronautical and non-aeronautical revenues per passenger increased 20.4% to Ps Seven new international routes were opened, as a result of route development efforts. 37 new commercial spaces, car rental, advertising, restaurant, passenger service, and time share locals opened in the 13 airports, as part of the commercial strategy. The sum of costs and general and administrative expenses, not including the maintenance provision or construction costs, increased 12.1% to Ps. 300 million. The increase reflected principally higher electricity charges, a new security services contract, and severance paid in the quarter. Adjusted EBITDA 2 was Ps. 342 million in 4Q11, an increase of 50.7%. The Adjusted EBITDA margin of 49.5%, reflecting OMA'S efforts to sustain cash flow generation. Consolidated net income increased 25.5% to Ps. 231 million, principally because of the growth in revenues. Earnings per share were Ps. 0.58, or US$0.33 per American Depositary Share (ADS). Capital expenditures were Ps. 233 million in 4Q11.
 terminal passengers). Traffic increased most in the Monterrey (+3.7%) and Tampico (+33.2%) airports.")
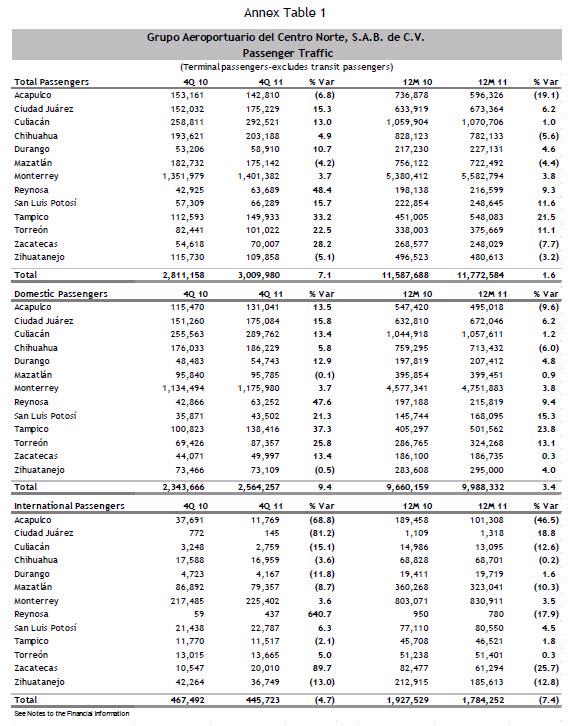
2 The total number of flight operations (takeoffs and landings) increased 1.4%, to 85,350 operations. Domestic flight operations increased 1.9%, and international operations decreased 1.6%. Total passenger traffic increased 7.1% (+198,822) terminal passengers). Traffic increased most in the Monterrey (+3.7%) and Tampico (+33.2%) airports. Copa, Volaris, Interjet, Aeromar, VivaAerobus, Magnicharter, and American Airlines saw increases in passenger volumes. The Acapulco (-6.8%) and Mazatlán (-4.2%) airports had the largest decreases. See Annex Table 1, Passenger Traffic for more detail. Of total passenger traffic, 85.2% was domestic, and 14.8% was international. Commercial aviation accounted for 96.8% of passenger traffic and general aviation 3.2%. Monterrey generated 46.6% of passenger traffic, Culiacán 9.7%, and Chihuahua 6.8%. Domestic passenger traffic increased 9.4%. Eleven airports had increases in domestic traffic. Monterrey (+3.7%) had increases principally on the routes to Mexico City, Cancún, and San José del Cabo. Tampico (+37.3%) had increases on the routes to Mexico City and Monterrey. Culiacán (+13.4%) had increases on the Mexico City and Tijuana routes. The Ciudad Juárez (+15.8%) and Reynosa (+47.6%) airports had increases on their Mexico City routes. Mazatlán (-0.1%) and Zihuatanejo (-0.5%) saw decreases in domestic traffic, principally as a result of decreases on the routes to La Paz and Toluca, respectively. No domestic routes were opened or closed during the quarter. International passenger traffic decreased 4.7%. Five airports had increases in international traffic. The most significant increases were in Zacatecas (+89.7%) and Monterrey (+3.6%). Zacatecas benefited from the Chicago and Los Angeles routes, while Monterrey had growth on the San Antonio and Chicago routes. Eight airports had reductions in international passenger traffic, with the most significant decreases in Acapulco (-68.8%), Mazatlán (-8.7%), and Zihuatanejo (-13.0%). The affected routes were those to Houston, Dallas, and Denver. Seven international routes opened in the quarter.

3 Non-aeronautical and commercial operations During 4Q11, we continued to increase and improve the commercial offering and passenger services available in our airport terminals. Thirty-seven new retail, car rental, advertising, restaurant, passenger service, and time-share services operations opened in all 13 airports, improving our services. The occupancy rate of our commercial space was 92%, as a result of the initiatives to achieve steady growth of commercial revenues even while expanding the total amount of space available. One initiative should be noted. In October 2011, we started operating the strip mall on the access road to the Monterrey Airport; the first tenant is a 7-Eleven convenience store. NH Terminal 2 Hotel Operations The NH T2 hotel in Mexico City had an average occupancy rate of 82.8%, as compared to 81.8% in 4Q10. Revenue per available room (RevPAR) was Ps. 1,554 in 4Q11. The NH T2 hotel had 20.7% market share in the Mexico City airport hotel market, compared to 19.4% share of the total rooms. Financial Results Revenues


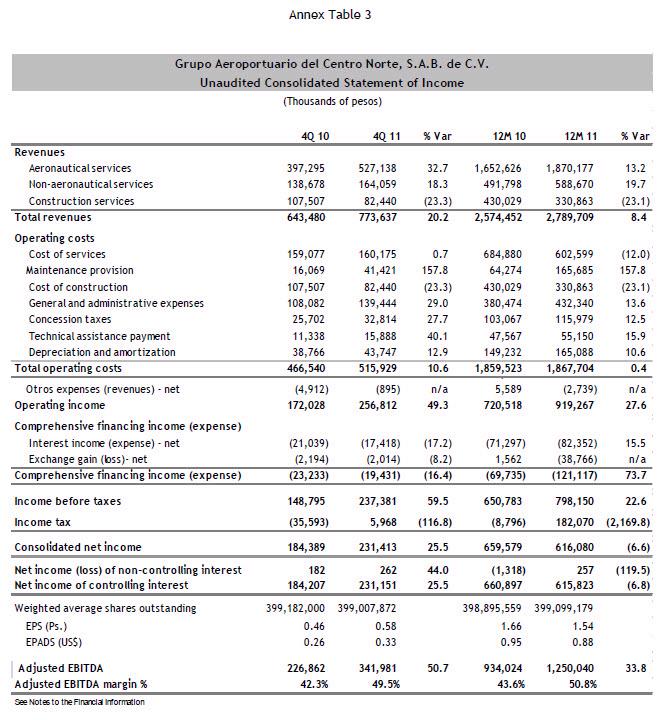
4 The sum of aeronautical and non-aeronautical revenues increased 29.0% to Ps. 691 million. Total revenues, which also include construction revenue, increased 20.2% to Ps. 774 million. The increase in aeronautical revenues was the result of the increase in passenger traffic and the increase in passenger charges and tariffs for airport services effective April and October Non-aeronautical revenues rose 18.3%, principally because of the commercial and advertising initiatives and higher revenue from the NH T2 hotel. In 4Q11, non-aeronautical revenues were 23.7% of total aeronautical and non-aeronautical revenues. In 2006, when OMA carried out its IPO, non-aeronautical revenues were only 18.8% of the total. The Monterrey airport contributed 48.7% of the sum of aeronautical and non-aeronautical revenues, Culiacán 8.7%, and Mazatlán 6.2%. Construction revenues were Ps. 82 million, which is the value of improvements to concessioned assets made during the quarter, compared to Ps. 108 million in 4Q10. (See Notes to the Financial Information.) Aeronautical revenues increased 32.7% to Ps. 527 million. Domestic passenger charges increased 45.3% as a result of tariff increases under the maximum rate agreement and increased domestic traffic. International passenger charges increased 32.5%. Aeronautical revenue per passenger increased 23.9% to Ps Non-aeronautical revenues increased 18.3%, largely because of the commercial and advertising initiatives in our airports. NH T2 hotel revenues increased 9.6% to Ps. 38 million. Room rental was 80.8% of hotel revenues, food and beverages 15.7%, and other services 3.5%. Advertising revenues increased 83.9%, principally because of the renegotiation of the advertising agreement and new, alternative advertising initiatives in our airports. Car rental revenues rose 28.1% as a result of a new system for selecting car rental brands. OMA Carga revenues rose 25.4% as a result of an increase in market share in the handling of imports. Other commercial revenues rose 16.4% as a result of the increased volume of passenger service establishments. Monterrey contributed 44.4% of non-aeronautical revenues, the NH T2 hotel 23.0%, Mazatlán 5.3%, and Culiacán 4.4%. Non-aeronautical revenue per passenger increased 10.5% to Ps Non-aeronautical revenues per passenger, excluding the NH T2 hotel, increased 13.2% to Ps


5 Costs and operating expenses Total cost of services and general and administrative expenses, excluding the maintenance provision and construction costs, increased 12.0%, principally because of higher electricity rates, a new security services contract, minor maintenance, and severance payments. The airport concession tax increased 27.7% because of the growth in revenues. The technical assistance fee increased 40.1%, in line with the increase in EBITDA generated by the airports. Depreciation and amortization increased 12.9%, as a result of increased investments, particularly for checked baggage screening equipment. Total costs and expenses in 4Q11 were Ps. 516 million, an increase of 10.6%. Adjusted EBITDA and Operating Income

6 Adjusted EBITDA was Ps. 342 million in 4Q11, an increase of 50.7%. The Adjusted EBITDA margin was 49.5%. OMA calculates Adjusted EBITDA as shown in the table below. The Adjusted EBITDA margin is calculated against the sum of aeronautical and non-aeronautical revenues. (See Notes to the Financial Information for additional discussion of Adjusted EBITDA.) Operating income was Ps. 257 million, and the operating margin was 33.2%. The increase in operating margin principally results from higher revenues. Comprehensive financing expense was Ps. 19 million in 4Q11, a decrease of 16% resulting from the refinancing of debt during the year on more favorable terms. In July 2011, OMA completed the placement of Ps. 1,300 million 5-year pesodenominated bonds (Certificados Bursátiles) in the domestic market at an interest rate of 28-day TIIE plus 70 basis points. The income tax provision reflects the adoption of IFRS accounting. On the one hand, depreciation and amortization was lower as a result of not recognizing the effects of inflation on the valuation of assets and concessioned properties; this increased operating income and generated higher cash income tax. On the other hand, there was a benefit from the provision for deferred single rate corporate tax (IETU). While the effects of inflation are no longer recorded in the financial accounts, they are still included in tax accounting, generating a credit for deferred IETU. In addition, there is an increase in deferred income tax as a result of new financial projections, which are based on the master development plan and maximum rates for the period approved by the SCT in December The projection of higher revenues required an increase in the deferred income tax provision.
 Capital expenditures During 4Q11, capital expenditures were Ps.")
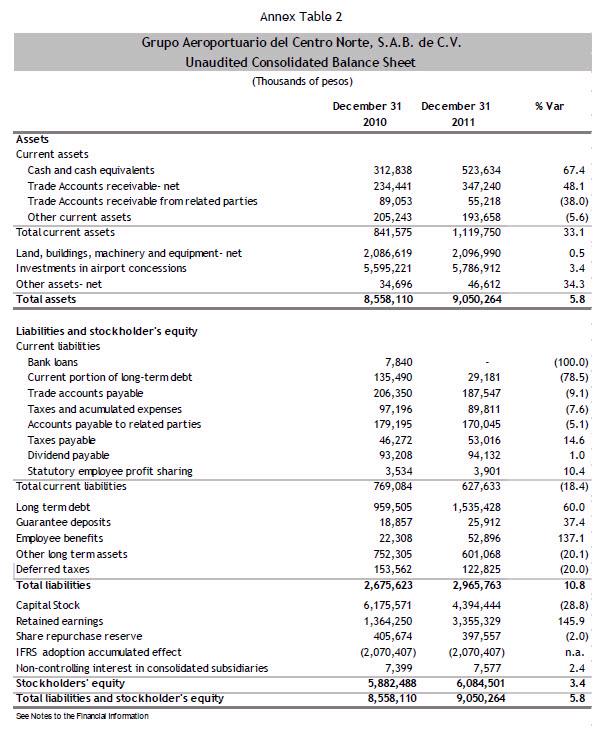
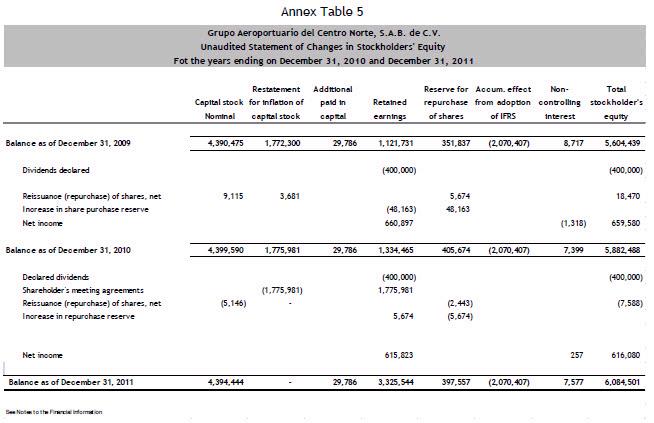
7 Consolidated net income and Net income of controlling interest were each Ps. 231 million, increasing 26%. The increases resulted principally from higher revenues. Earnings per share were Ps. 0.58, and earnings per ADS were US$0.33 per ADS. Each ADS represents eight Series B shares. (See Annex Table 3.) Capital expenditures During 4Q11, capital expenditures were Ps. 233 million, including Master Development Plan (MDP) investments and strategic investments. The most important investments during the fourth quarter were: Expansion of Terminal C at the Monterrey airport. Rehabilitation of the Zacatecas runway and platforms. Rehabilitation of the asphaltic carpet of the Culiacán runway and commercial aviation platform. Acquisition of the checked baggage screening equipment for Monterrey. Design, construction, and installation of equipment and systems for the checked baggage screening system for the Monterrey airport. Design, installation, and putting into service closed-circuit TV systems in 10 airports, including Acapulco, Ciudad Juárez, Culiacán, Mazatlán, and Zihuatanejo. Building of a perimeter wall at the Acapulco airport. Build-out and construction of corporate office space. Cash flow statement In the full year 2011, operating activities generated cash of Ps. 684 million compared to Ps. 410 million during The increase was principally because of increased revenues and improved working capital management in As of December 31, 2011, the balance sheet had a total of Ps. 1,535 million in long-term debt, of which Ps. 1,300 million was the 5-year Notes that OMA placed in the domestic market in July 2011, at an interest rate of 28-day TIIE plus 70 basis points. OMA used part of the proceeds to prepay Ps. 1,006 million in debt. In addition, OMA is continuing to acquire baggage screening equipment; accordingly, the UPS Capital loan was increased by US$ 2 million. Of the Ps. 1,535 million in long-term debt, Ps. 462 million net were an inflow in the year. These resources were principally used to finance capital expenditures. Investment activities used cash of Ps. 430 million. Dividend payments during 2011 were Ps. 399 million. OMA had a net increase in cash of Ps. 211 million during 2011, with a balance of cash and cash equivalents of Ps. 524 million as of December 31, (See Annex Table 4). OMA has no exposure to any financial derivative instruments as of the date of this report. Full Year 2011 Summary OMA generated 14.7% growth in the sum of aeronautical and non-aeronautical revenues in 2011, with an increase of passenger traffic volumes of 1.6%. Aeronautical revenues per passenger increased 11.4% and non-aeronautical revenues per
8 passenger increased 17.8%. The increase in non-aeronautical revenues of 19.7% was driven by the maturation of the NH Terminal 2 Hotel (+42.3% revenue growth), advertising (+61.8%), commercial leases (+10.6%), and OMA Carga (+17.2%). The decrease of 3.6% in costs and general and administrative expenses (not including the maintenance provision, construction costs, or hotel expenses) was principally the result of the provision for doubtful accounts from the bankruptcy of Mexicana during Adjusted EBITDA increased 33.8% to Ps. 1,250 million; operating income reached Ps. 919 million, and net income was Ps. 616 million. Earnings per share were Ps.1.54 and earnings per ADS were US$ OMA's investment program focused on meeting its investment commitments to provide services that meet the highest standards of quality and security. The acquisition and installation of the Baggage Handling System was completed. Total Capex in 2011 was Ps. 741 million Outlook OMA estimates that passenger traffic growth in 2012 will be between 2.5% and 3.5%. The sum of aeronautical and nonaeronautical revenues is expected to increase between 8% and 12%. The Adjusted EBITDA margin is expected to be in the range of 48.5% to 51.0%. Capital expenditures in 2012 under the Master Development Plan will be approximately Ps. 700 million. OMA is providing this outlook based on internal estimates. A number of factors could have a significant effect on the estimates of traffic, revenue growth, Adjusted EBITDA, and Capex. These include changes in airline expansion plans, ticket prices and other factors affecting traffic volumes, the evolution of commercial and diversification projects, and economic conditions, among others. OMA can provide no assurance that the Company will achieve these results. Subsequent developments Third quarterly payment of 2010 dividend: On January 16, 2012, the third quarterly installment of the dividend declared by the Annual Shareholders' Meeting on April 14, 2011 was paid. The amount was Ps.0.25 per share. Mazatlán Airport recognized for Airport Service Quality (ASQ): On February 15, 2012, the Mazatlán International Airport was awarded the ASQ prize from Airports Council International (ACI) in the category Best Airport in Latin America with under 2 million passengers per year. OMA (NASDAQ: OMAB; BMV: OMA) will hold a conference call on February 24, 2012 at 11:00 am Eastern time, 10:00 am Mexico City time. The conference call is accessible by calling toll-free from the U.S. or from outside the U.S. The conference ID is A taped replay will be available through March 2, 2012 at toll free or , using the same ID.,/p. The conference call will also be available by webcast at
9
10
11
12
13
14 Notes to the financial information Financial statements are prepared in accordance with International Financial Reporting Standards ("IFRS"), and presented in accordance with IAS 34 "Interim Financial Reporting." Results for 2010 have been reformulated in accordance with IFRS. Adjusted EBITDA: OMA defines Adjusted EBITDA as net income minus net comprehensive financing income plus taxes and depreciation and amortization minus construction revenue plus construction expense and maintenance provision. Adjusted EBITDA should be not considered as an alternative to net income, as an indicator of our operating performance, or as an alternative to cash flow as an indicator of liquidity. Our management believes that Adjusted EBITDA provide a useful measure of our performance that is widely used by investors and analysts to evaluate our performance and compare it with other companies. Financial ratios calculated on the base of Adjusted EBITDA are also widely used by credit providers in order to gauge the debt servicing capacity of companies. Adjusted EBITDA is not defined under IFRS or U.S. GAAP, and may be calculated differently by different companies. Aeronautical revenues: are revenues from rate-regulated services. These include revenue from airport services, regulated leases, and access fees from third parties to provide complementary and ground transportation services. Airport service revenues include principally departing domestic and international passenger charges (TUA), landing fees, aircraft parking charges, passenger and carry-on baggage screening, and use of passenger jetways, among others. Revenue from third party access fees to provide complementary services include revenue sharing for ramp services, aircraft towing, water loading and unloading, cabin cleaning, electricity supply, catering, security, and aircraft maintenance, among others. Revenues from regulated leases include principally rental to airlines of office space, hangars, and check-in and ticket sales counters. Revenues from access charges for providers of ground transportation services include charges for taxis and buses. Airport Concession Tax (DUAC): This tax, the Derecho de Uso de Activos Concesionados, is equal to 5% of gross revenues, in accordance with the Federal Royalties Law. American Depositary Shares (ADS): Securities issued by a U.S. depositary institution representing ownership interests in the deposited securities of non-u.s. companies. OMA's depositary bank is Bank of New York Mellon. Each OMA ADS represents eight Series B shares. Capital expenditures, Capex: includes investments in fixed assets (including investments in land, machinery, and equipment) and improvements to concessioned properties. Cargo unit: equivalent to 100 kg of cargo. Construction revenue, construction cost: IFRIC 12 "Service Concession Arrangements" addresses how service concession operators should apply existing International Financial Reporting Standards (IFRSs) to account for the obligations they undertake and rights they receive in service concession arrangements. The concession contracts for each of OMA's airport subsidiaries establishes that the concessionaire is obligated to carry out construction or improvements to the infrastructure transferred in exchange for the rights over the concession granted by the Federal Government. The latter will receive all the assets at the end of the concession period. As a result the concessionaire should recognize, using the percentage of completion method, the revenues and costs associated with the improvements to the concessioned assets. The amount of the revenues and costs so recognized should be the price that the concessionaire pays or would pay in an arm's length transaction for the execution of the works or the purchase of machinery and equipment, with no profit recognized for the construction or improvement. The change does not affect operating income, net income, or EBITDA, but does affect calculations of margins based on total revenues. Earnings per share and ADS: use the weighted average of shares or ADS outstanding for each period, excluding Treasury shares from the operation of the share purchase program. IAS 34 "Interim Financial Reporting": This norm establishes the minimum content that interim financial statements should include, as well as the criteria for the formulation of the financial statements. International Financial Reporting Standards (IFRS) In January 2009, the National Banking and Securities Commission (CNBV) published amendments to its Circular for Issuers to make mandatory the presentation of financial statements prepared in accordance with International Financial Reporting
.")
15 Standards (IFRS) starting with the year ending December 31, 2012, but allowing for early adoption. OMA's Board of Directors approved early adoption of IFRS for the year ending December 31, The financial statements for the year ended December 31, 2010 are the last statements that were prepared in accordance with Mexican Financial Reporting Standards (MFRS). The first consolidated financial statements prepared under IFRS will be those for the year ending December 31, 2011, and consider January 1, 2010 as the start date for the transition to IFRS. As a result, the accounting policies and the valuation methods used by the Company in the preparation of the intermediate financial information differ from those used in the preparation of the financial information for the year ended December 31, The results reported in the financial statements for December 31, 2010 and for the twelve months ended December 31, 2010 apply the transition rules for numbers previously reported under MFRS. These financial statements have been reformulated for comparative effects under IFRS with effect from the transition date. Financial statements and other information are presented in accordance with IFRS and their Interpretations. These standards differ in certain significant respects from Mexican Financial Reporting Standards and U.S. GAAP. The early adoption is intended to meet international requirements in terms of disclosure and transparency of financial information, as well as to aid investors in their evaluation and comparisons with other companies in the same sector, in order to facilitate making investment decisions in the Company. Following is a description of the changes in the principal accounting policies resulting from the adoption of IFRS: Adoption of IFRS. The financial statements for the year ended December 31, 2010 were the last to be prepared in accordance with MFRS. Effective January 1, 2011, the Company suspended the application of MFRS as the result of the early adoption of IFRS. For comparative purposes, the Company has reformulated the financial statements for 2010 under IFRS. The following table shows the principal income statement and balance sheet effects for 4Q10 and 12M10 as the result of the adoption of IFRS. The principal changes in accounting policies and their effects on the balance sheet and income statement are as follows. Investment in Airport Concessions: Effects of inflation: In accordance with IFRS, the effects of inflation are recognized when accumulated inflation during the prior three years reaches or exceeds 100%. Given that the Mexican environment ceased being hyperinflationary since 1999, the effects of inflation registered through 2007 are cancelled, except for the valuation of certain plant, machinery and equipment accounts that use the assumed cost exception contemplated in IFRS 1. Amortization of the concession: In accordance with IFRS, the amortization of the concession is based on the term of the concession, which is 50 years. In accordance with MFRS, the amortization of the concession is based on the estimated
16 useful life of the various components that make up the investment in the airport concessions. Maintenance expenses: In accordance with IFRS, maintenance costs in airports that are approved as part of the Master Development Plan are charged as expenses during the reporting period. In accordance with MFRS, such costs are capitalized as part of assets in the period the outflow is made. Income taxes: The Company recalculated its deferred taxes under IFRS based on adjusted values for assets and liabilities that require modifications based on the adoption of the new standards. Employee benefits: Under IFRS, the provision for employee severance is only recorded when it generates the payment obligation or when there are formal retirement plans. Employee bonuses: Incentives based on earnings are recognized in the period that the employee provided services when the company has a legal or constructive obligation and can estimate the amount of such bonuses. Under MFRS, these amounts were charged against results when they were paid. Maintenance Provision: represents the obligation for future disbursements resulting from wear and tear or deterioration of the concessioned assets used in operations including: runways, platforms, taxiways, and terminal buildings. The provision is increased periodically for the wear and tear to the concessioned assets and the Company's estimates of the disbursements it need to make. The use of the provision corresponds to the outflows made for the conservation of these operational assets. Master Development Plan (MDP): The investment plan agreed to with the government every five years, under the terms of the concession agreement. These include capital investments and maintenance for aeronautical activities, and exclude commercial and other non-aeronautical investments. The investment horizon is 15 years, of which the first five years are committed investments. Maximum Rate System: The Ministry of Communications and Transportation (SCT) regulates all our aeronautical revenues under a maximum rate system, which establishes the maximum amount of revenues per workload unit (one terminal passenger or 100kg of cargo) that may be earned by each airport each year from all regulated revenue sources. The concessionaire sets and registers the specific prices for services subject to regulation, which may be adjusted every six months as long as the combined revenue from regulated services per workload unit at an airport does not exceed the maximum rate. The SCT reviews compliance with maximum rates on an annual basis after the close of each year. NH T2 hotel: The NH hotel in Terminal 2 of the Mexico City International Airport. Non-aeronautical revenues: are revenues that are not subject to rate regulation. These include commercial services such as parking, advertising, car rentals, leasing of commercial space, freight management and handling, and other lease income, among others. Passengers: all references to passenger traffic volumes are to terminal passengers. Passenger charges (TUA, Tarifa de Uso de Aeropuerto): are paid by departing passengers (excluding connecting passengers, diplomats, and infants). Rates are established for each airport and are different for domestic and international travel. Prior period comparisons: unless stated otherwise, all comparisons of operating or financial results are made with respect to the comparable prior year period. Percentage changes for passenger traffic or financial items are calculated based on actual numbers. Strategic investments: refers only to those investments that are additional to those in the Master Development Plan. Technical Assistance Fee: This fee is charged as the higher of US$3.0 million per year or 5% of EBITDA before technical assistance. The operating results of the NH T2 hotel are not included in calculating the airport concession tax or the technical assistance fee. Terminal passengers: includes passengers on the three types of aviation (commercial, charter, and general aviation), and excludes passengers in transit. Unaudited financials: financial statements are unaudited statements for the periods covered by the report. Workload Unit: one terminal passenger or one cargo unit.
17 This report contains forward-looking information and statements. Forward-looking statements are statements that are not historical facts. These statements are only predictions based on our current expectations and projections about future events. Forward-looking statements may be identified by the words "believe," "expect," "anticipate," "target," or similar expressions. While OMA's management believes that the expectations reflected in such forward-looking statements are reasonable, investors are cautioned that forward-looking information and statements are subject to various risks and uncertainties, many of which are difficult to predict and are generally beyond the control of OMA, that could cause actual results and developments to differ materially from those expressed in, or implied or projected by, the forward-looking information and statements. These risks and uncertainties include, but are not limited to, those discussed in our most recent annual report filed on Form 20-F under the caption "Risk Factors." OMA undertakes no obligation to publicly update its forward-looking statements, whether as a result of new information, future events, or otherwise. About OMA Grupo Aeroportuario del Centro Norte, S.A.B. de C.V., known as OMA, operates 13 international airports in nine states of central and northern Mexico. OMA's airports serve Monterrey, Mexico's third largest metropolitan area, the tourist destinations of Acapulco, Mazatlán, and Zihuatanejo, and nine other regional centers and border cities. OMA also operates a hotel and commercial areas inside Terminal 2 of the Mexico City airport. OMA employs over 1,000 persons in order to offer passengers and clients, airport and commercial services in facilities that comply with all applicable international safety, security standards, and ISO 9001:2008. OMA's strategic shareholder members are ICA, Mexico's largest engineering, procurement, and construction company, and Aéroports de Paris Management, subsidiary of Aéroports de Paris, the second largest European airports operator. OMA is listed on the Mexican Stock Exchange (OMA) and on the NASDAQ Global Select Market (OMAB). For more information, please visit us at: Website: Twitter: Facebook: 1 Unless otherwise stated, all references are to the fourth quarter of 2011 (4Q11), and all percentage changes are with respect to the same period of the prior year. The exchange rate used to convert foreign currency amounts was Ps per U.S. dollar. 2 Adjusted EBITDA excludes the non-cash maintenance provision and construction revenue and construction expense. OMA provides a full reconciliation of Adjusted EBITDA in the corresponding section of this report as well as in the Notes to the Financial Information.
First Quarter 2010 Earnings Report
 First Quarter 2010 Earnings Report April 23, 2010 Mexican airport operator Grupo Aeroportuario del Centro Norte, S.A.B. de C.V., known as OMA (NASDAQ: OMAB; BMV: OMA), reported its unaudited, preliminary
Third Quarter 2010 Earnings Report
 Third Quarter 2010 Earnings Report October 19, 2010 Mexican airport operator Grupo Aeroportuario del Centro Norte, S.A.B. de C.V., known as OMA (NASDAQ: OMAB; BMV: OMA), reported its unaudited, preliminary
UBS Latin American New Opportunities Conference. June 11 th -12 th, 2007
 UBS Latin American New Opportunities Conference June 11 th -12 th, 2007 Company Overview OMA operates a diversified portfolio of 13 airports distributed throughout Northern and Central Mexico and is diversified
First Quarter 2016 Results
 First Quarter 2016 Results This presentation may contain forward-looking information and statements. Forward-looking statements are statements that are not historical facts. These statements are only predictions
Investment Highlights
 Third Quarter 2014 Investment Highlights 1 Mexican airport portfolio positioned to take full advantage of global growth. 2 Diversified business model contributing to earnings resilience. 3 Well-defined
Third Quarter 2015 Results
 Third Quarter 2015 Results Investment Highlights Positioned to take full advantage of global growth Diversified business model Well-defined strategy to capitalize on favorable industry dynamic Successful
Investment Highlights
 Second Quarter 2014 Investment Highlights 1 Mexican airport portfolio positioned to take full advantage of global growth. 2 Diversified business model contributing to earnings resilience. 3 Well-defined
ASUR 2Q11 PASSENGER TRAFFIC UP 2.89% YOY
 In Mexico ASUR Lic. Adolfo Castro (52) 5552-84-04-08 acastro@asur.com.mx In the U.S. Breakstone Group Susan Borinelli (646) 330-5907 sborinelli@breakstone-group.com ASUR 2Q11 PASSENGER TRAFFIC UP 2.89%
Grupo Aeroportuario del Centro Norte SAB de CV SECOND QUARTER 2018 RESULTS
 Grupo Aeroportuario del Centro Norte SAB de CV SECOND QUARTER 2018 RESULTS This presentation may contain forward-looking information and statements. Forward-looking statements are statements that are not
Copa Holdings Reports Net Income of $57.7 million and EPS of $1.36 for the Third Quarter of 2018
 Copa Holdings Reports Net Income of $57.7 million and EPS of $1.36 for the Third Quarter of 2018 November 14, 2018 PANAMA CITY, Nov. 14, 2018 /PRNewswire/ -- Copa Holdings, S.A. (NYSE: CPA), today announced
Santander Conference Acapulco. January 2007
 Santander Conference Acapulco January 2007 Post-IPO Shareholder Ownership IPO on November 29, 2006; 47% free float Aeroinvest* 74.5% 25.5% SETA Public Float B Shares (Mexico) 50% ADSs 50% 36.0%* 16.7%
MIRAMAR, Fla., April 29, 2015 (GLOBE NEWSWIRE) -- Spirit Airlines, Inc. (Nasdaq:SAVE) today reported first quarter 2015 financial results.
 -- Spirit Airlines, Inc. (Nasdaq:SAVE) today reported first quarter 2015 financial results.") April 29, 2015 Spirit Airlines Announces First Quarter 2015 Results; Adjusted Net Income Increases 87.1 Percent to $70.7 Million and Pre-Tax Margin Increases 900 Basis Points to 22.7 Percent MIRAMAR, Fla.,
April 29, 2015 Spirit Airlines Announces First Quarter 2015 Results; Adjusted Net Income Increases 87.1 Percent to $70.7 Million and Pre-Tax Margin Increases 900 Basis Points to 22.7 Percent MIRAMAR, Fla.,
Copa Holdings Reports Net Income of $136.5 million and EPS of $3.22 for the First Quarter of 2018
 Copa Holdings Reports Net Income of $136.5 million and EPS of $3.22 for the First Quarter of 2018 May 9, 2018 PANAMA CITY, May 9, 2018 /PRNewswire/ -- Copa Holdings, S.A. (NYSE: CPA), today announced financial
Volaris Reports Strong First Quarter 2015: 32% Adjusted EBITDAR Margin, 9% Operating Margin
 Volaris Reports Strong First Quarter 2015: 32% Adjusted EBITDAR Margin, 9% Operating Margin Mexico City, Mexico, April 22, 2015 Volaris* (NYSE: VLRS and BMV: VOLAR), the ultra-low-cost airline serving
Copa Holdings Reports Record Earnings of US$41.8 Million for 4Q06 and US$134.2 Million for Full Year 2006
 Copa Holdings Reports Record Earnings of US$41.8 Million for 4Q06 and US$134.2 Million for Full Year 2006 Panama City, Panama --- March 7, 2007. Copa Holdings, S.A. (NYSE: CPA), parent company of Copa
INVESTOR PRESENTATION FOURTH QUARTER 2017 RESULTS
 INVESTOR PRESENTATION FOURTH QUARTER 2017 RESULTS This presentation may contain forward-looking information and statements. Forward-looking statements are statements that are not historical facts. These
Spirit Airlines Reports First Quarter 2017 Results
 Spirit Airlines Reports First Quarter 2017 Results MIRAMAR, Fla., April 28, 2017 - Spirit Airlines, Inc. (NASDAQ: SAVE) today reported first quarter 2017 financial results. GAAP net income for the first
THIRD QUARTER RESULTS 2018
 THIRD QUARTER RESULTS 2018 KEY RESULTS In the 3Q18 Interjet total revenues added $ 6,244.8 million pesos that represented an increase of 7.0% over the revenue generated in the 3Q17. In the 3Q18, operating
OPERATING AND FINANCIAL HIGHLIGHTS. Subsequent Events
 Copa Holdings Reports Financial Results for the First Quarter of 2016 Excluding special items, adjusted net income came in at US$69.9 million, or EPS of US$1.66 per share Panama City, Panama --- May 5,
Copa Holdings Reports Net Income of $49.9 million and EPS of $1.18 for the Second Quarter of 2018
 Copa Holdings Reports Net Income of $49.9 million and EPS of $1.18 for the Second Quarter of 2018 Panama City, Panama --- Aug 8, 2018. Copa Holdings, S.A. (NYSE: CPA), today announced financial results
Spirit Airlines Reports Fourth Quarter and Full Year 2016 Results
 Spirit Airlines Reports Fourth Quarter and Full Year 2016 Results MIRAMAR, FL. (February 7, 2017) - Spirit Airlines, Inc. (NASDAQ: SAVE) today reported fourth quarter and full year 2016 financial results.
First Quarter Grupo Aeroportuario del Centro Norte S.A.B. de C.V.
 First Quarter 204 Grupo Aeroportuario del Centro Norte S.A.B. de C.V. Investment Highlights Mexican airport portfolio positioned to take full advantage of global growth. 2 Diversified business model contributing
OPERATING AND FINANCIAL HIGHLIGHTS. Subsequent Events
 Copa Holdings Reports Net Income of $103.8 million and EPS of $2.45 for the Third Quarter of 2017 Excluding special items, adjusted net income came in at $100.8 million, or EPS of $2.38 per share Panama
OPERATING AND FINANCIAL HIGHLIGHTS SUBSEQUENT EVENTS
 Copa Holdings Reports Net Income of US$6.2 Million and EPS of US$0.14 for the Third Quarter of 2015 Excluding special items, adjusted net income came in at $37.4 million, or EPS of $0.85 per share Panama
FOURTH QUARTER RESULTS 2017
 FOURTH QUARTER RESULTS 2017 KEY RESULTS In the 4Q17 Interjet total revenues added $5,824.8 million pesos that represented an increase of 10.8% over the revenue generated in the 4Q16. In the 4Q17, operating
OPERATING AND FINANCIAL HIGHLIGHTS SUBSEQUENT EVENTS
 Copa Holdings Reports Financial Results for the Third Quarter of 2016 Excluding special items, adjusted net income came in at $55.3 million, or adjusted EPS of $1.30 per share Panama City, Panama --- November
OPERATING AND FINANCIAL HIGHLIGHTS. Subsequent Events
 Copa Holdings Reports Net Income of US$113.1 Million and EPS of US$2.57 for the First Quarter of 2015 Excluding special items, adjusted net income came in at US$106.0 million, or EPS of US$2.41 per share
ASUR 2Q15 PASSENGER TRAFFIC UP 14.27% YOY
 In Mexico ASUR Lic. Adolfo Castro (52) 5552-84-04-08 acastro@asur.com.mx In the U.S. MBS Value Partners Susan Borinelli (646) 330-5907 susan.borinelli@mbsvalue.com For Immediate Release ASUR 2Q15 PASSENGER
FIRST QUARTER RESULTS 2017
 FIRST QUARTER RESULTS 2017 KEY RESULTS In the 1Q17 Interjet total revenues added $4,421.5 million pesos that represented an increase of 14.8% over the income generated in the 1Q16. In the 1Q17, operating
OPERATING AND FINANCIAL HIGHLIGHTS
 Copa Holdings Reports Financial Results for the Fourth Quarter of 2015 Excluding special items, adjusted net income came in at $31.7 million, or EPS of $0.73 per share Panama City, Panama --- February
THIRD QUARTER RESULTS 2017
 THIRD QUARTER RESULTS 2017 KEY RESULTS In the 3Q17 Interjet total revenues added $5,835.1 million pesos that represented an increase of 22.0% over the revenue generated in the 3Q16. In the 3Q17, operating
OPERATING AND FINANCIAL HIGHLIGHTS
 Copa Holdings Reports Financial Results for the Fourth Quarter of 2018 Excluding special items, adjusted net profit came in at $44.0 million, or Adjusted EPS of $1.04 Panama City, Panama --- February 13,
THIRD QUARTER AND NINE MONTHS OF 2014 KEY RESULTS
 THIRD QUARTER AND NINE MONTHS OF 2014 KEY RESULTS In 3Q14 INTERJET total revenues were $ 3,643.4 million, representing an increase of 9.9% on revenues generated in the 3Q13. Accumulated 9M14 INTERJET total
INVESTOR PRESENTATION THIRD QUARTER 2017 RESULTS
 INVESTOR PRESENTATION THIRD QUARTER 2017 RESULTS This presentation may contain forward-looking information and statements. Forward-looking statements are statements that are not historical facts. These
Spirit Airlines Reports First Quarter 2018 Results
 Spirit Airlines Reports First Quarter 2018 Results MIRAMAR, Fla., April 26, 2018 - Spirit Airlines, Inc. (NYSE: SAVE) today reported first quarter 2018 financial results. For the first quarter 2018, Spirit
FIRST QUARTER RESULTS 2016
 FIRST QUARTER RESULTS 2016 KEY RESULTS In 1Q16 Interjet total revenues added $3,850.8 million pesos that represented an increase of 21.9% over the income generated in the 1Q15. In 1Q16 total passengers
Copa Holdings Reports Net Income of US$113.9 Million for the Fourth Quarter of 2013
 Copa Holdings Reports Net Income of US$113.9 Million for the Fourth Quarter of 2013 Panama City, Panama --- February 12, 2014. Copa Holdings, S.A. (NYSE: CPA), today announced financial results for the
CONTACT: Investor Relations Corporate Communications
 NEWS RELEASE CONTACT: Investor Relations Corporate Communications 435.634.3200 435.634.3553 Investor.relations@skywest.com corporate.communications@skywest.com SkyWest, Inc. Announces Fourth Quarter 2017
Spirit Airlines Reports Third Quarter 2017 Results
 Spirit Airlines Reports Third Quarter 2017 Results MIRAMAR, Fla., October 26, 2017 - Spirit Airlines, Inc. (NASDAQ: SAVE) today reported third quarter 2017 financial results. GAAP net income for the third
SECOND QUARTER RESULTS 2018
 SECOND QUARTER RESULTS 2018 KEY RESULTS In the 2Q18 Interjet total revenues added $ 5,781.9 million pesos that represented an increase of 9.6% over the revenue generated in the 2Q17. In the 2Q18, operating
OMA announces Third Quarter 2017 Operational and Financial Results
 OMA announces Third Quarter 2017 Operational and Financial Results Monterrey, Mexico, October 17, 2017 Mexican airport operator Grupo Aeroportuario del Centro Norte, S.A.B. de C.V., known as OMA (NASDAQ:
Spirit Airlines Reports Third Quarter 2015 Pre-Tax Margin of 26.9 Percent
 October 27, 2015 Spirit Airlines Reports Third Quarter 2015 Pre-Tax Margin of 26.9 Percent MIRAMAR, Fla., Oct. 27, 2015 (GLOBE NEWSWIRE) -- Spirit Airlines, Inc. (NASDAQ:SAVE) today reported third quarter
CONTACT: Investor Relations Corporate Communications
 NEWS RELEASE CONTACT: Investor Relations Corporate Communications 435.634.3200 435.634.3553 Investor.relations@skywest.com corporate.communications@skywest.com SkyWest, Inc. Announces Second Quarter 2017
INVESTOR PRESENTATION SECOND QUARTER 2017 RESULTS
 INVESTOR PRESENTATION SECOND QUARTER 2017 RESULTS This presentation may contain forward-looking information and statements. Forward-looking statements are statements that are not historical facts. These
Spirit Airlines Reports Second Quarter 2018 Results
 Spirit Airlines Reports Second Quarter 2018 Results MIRAMAR, Fla., July 25, 2018 - Spirit Airlines, Inc. (NYSE: SAVE) today reported second quarter 2018 financial results. GAAP net income for the second
OPERATING AND FINANCIAL HIGHLIGHTS
 Copa Holdings Reports Net Income of US$18.6 Million and EPS of US$0.42 for the Second Quarter of 2010 Excluding special items, adjusted net income came in at $26.3 million, or $0.60 per share Panama City,
OPERATING AND FINANCIAL HIGHLIGHTS
 Copa Holdings Reports Net Income of US$32.0 Million and EPS of US$0.72 for the Second Quarter of 2012 Excluding special items, adjusted net income came in at $58.6 million, or EPS of $1.32 per share Panama
MGM Resorts International Reports Second Quarter Financial Results
 NEWS RELEASE MGM Resorts International Reports Second Quarter Financial Results 8/5/2014 Consolidated Adjusted EBITDA Increased 8%, Led By 10% Growth In Wholly Owned Domestic Resorts MGM China Declares
Copa Holdings Reports Fourth Quarter and Full Year 2007 Results
 Copa Holdings Reports Fourth Quarter and Full Year 2007 Results Panama City, Panama --- February 21, 2008. Copa Holdings, S.A. (NYSE: CPA), parent company of Copa Airlines and Aero Republica, today announced
SkyWest, Inc. Announces First Quarter 2018 Profit
 NEWS RELEASE CONTACT: Investor Relations Corporate Communications 435.634.3200 435.634.3553 Investor.relations@skywest.com corporate.communications@skywest.com SkyWest, Inc. Announces First Quarter 2018
CONTACT: Investor Relations Corporate Communications
 NEWS RELEASE CONTACT: Investor Relations Corporate Communications 435.634.3200 435.634.3553 Investor.relations@skywest.com corporate.communications@skywest.com SkyWest, Inc. Announces Second Quarter 2016
ASUR 4Q13 PASSENGER TRAFFIC UP 8.99% YOY
 `In Mexico ASUR Lic. Adolfo Castro (52) 5552-84-04-08 acastro@asur.com.mx In the U.S. Breakstone Group Susan Borinelli (646) 330-5907 sborinelli@breakstone-group.com ASUR 4Q13 PASSENGER TRAFFIC UP 8.99%
Results 1 st Quarter 2005
 Grupo Posadas, s, S.A. de C.V. & Subsidiaries April 28, 2005 Results 1 st Quarter 2005 Total revenues increase 13% in the quarter Higher demand in urban hotels Better results in coastal hotels 3 openings
ASUR 2Q14 PASSENGER TRAFFIC UP 10.65% YOY
 In Mexico ASUR Lic. Adolfo Castro (52) 5552-84-04-08 acastro@asur.com.mx In the U.S. Breakstone Group Susan Borinelli (646) 330-5907 sborinelli@breakstone-group.com ASUR 2Q14, Page 1 of 21 For Immediate
Earnings Report 1 st Quarter 2016 Grupo Viva Aerobus
 Earnings Report 1 st Quarter 2016 Grupo Viva Aerobus Grupo Viva Aerobus announces results for the first quarter of 2016 Mexico City, Mexico, April 29, 2016- Grupo Viva Aerobus S.A. de C.V. ( Grupo Viva
Investor Relations Update January 25, 2018
 General Overview Investor Relations Update Accounting Changes On January 1, 2018, the company adopted two new Accounting Standard Updates: (ASUs): ASU 2014-9: Revenue from Contracts with Customers (the
Spirit Airlines Reports Highest Second Quarter Pre-Tax Margin in Company History
 July 24, 2013 Spirit Airlines Reports Highest Second Quarter Pre-Tax Margin in Company History MIRAMAR, Fla., July 24, 2013 (GLOBE NEWSWIRE) -- Spirit Airlines, Inc. (Nasdaq:SAVE) today reported second
Azul Increases Net Income by R$152 Million in 1Q18 Operating margin was a record 12.5% despite the 21% increase in oil year over year
 Azul Increases Net Income by R$152 Million in 1Q18 Operating margin was a record 12.5% despite the 21% increase in oil year over year São Paulo, May 10, Azul S.A., Azul, (B3:AZUL4, NYSE:AZUL) the largest
Forward-Looking Statements Statements in this presentation that are not historical facts are "forward-looking" statements and "safe harbor
 2017 Annual Meeting of Shareholders Presentation May 2017 Forward-Looking Statements Statements in this presentation that are not historical facts are "forward-looking" statements and "safe harbor statements"
American Airlines Group Reports Second-Quarter Profit
 NEWS RELEASE American Airlines Group Reports Second-Quarter Profit 7/28/2017 FORT WORTH, Texas American Airlines Group Inc. (NASDAQ:AAL) today reported its second-quarter 2017 results, including these
Copa Holdings Reports Net Income of US$51.9 Million for the Fourth Quarter of 2008 and US$152.2 Million for Full Year 2008
 Copa Holdings Reports Net Income of US$51.9 Million for the Fourth Quarter of 2008 and US$152.2 Million for Full Year 2008 Panama City, Panama --- February 19, 2009. Copa Holdings, S.A. (NYSE: CPA), parent
Volaris Reports First Quarter 2018 Results: Ancillary Revenue Expansion, Unit Cost Reduction and Cash Flow Generation
 Volaris Reports First Quarter 2018 Results: Ancillary Revenue Expansion, Unit Cost Reduction and Cash Flow Generation Mexico City, Mexico, April 20, 2018 Volaris* (NYSE: VLRS and BMV: VOLAR), the ultra-low-cost
Melco International Development Limited (Incorporated in Hong Kong with limited liability) Website : (Stock Code : 200)
 Website : (Stock Code : 200)") Hong Kong Exchanges and Clearing Limited and The Stock Exchange of Hong Kong Limited take no responsibility for the contents of this announcement, make no representation as to its accuracy or completeness
Hong Kong Exchanges and Clearing Limited and The Stock Exchange of Hong Kong Limited take no responsibility for the contents of this announcement, make no representation as to its accuracy or completeness
Grupo Viva Aerobus announces results for the third quarter of 2016
 Earnings Earnings Report Report 3 rd rd Quarter Quarter 2016 2016 Grupo Grupo Viva Viva Aerobus Aerobus Grupo Viva Aerobus announces results for the third quarter of 2016 Mexico City, Mexico, October 27,
Copa Holdings Reports Earnings of US$30.3 Million and EPS of US$0.70 for 3Q08
 Copa Holdings Reports Earnings of US$30.3 Million and EPS of US$0.70 for 3Q08 Panama City, Panama --- November 13, 2008. Copa Holdings, S.A. (NYSE: CPA), parent company of Copa Airlines and Aero Republica,
AIR CANADA REPORTS 2010 THIRD QUARTER RESULTS; Operating Income improved $259 million or 381 per cent from previous year s quarter
 AIR CANADA REPORTS 2010 THIRD QUARTER RESULTS; Operating Income improved $259 million or 381 per cent from previous year s quarter MONTRÉAL, November 4, 2010 Air Canada today reported operating income
44th Consecutive Profitable Quarter Fourth Quarter Fully Diluted Earnings per Share of $0.94 Full Year Fully Diluted Earnings per Share of $4.
 Allegiant Travel Company Fourth Quarter and Full Year 2013 Financial Results January 29, 2014 1:00 PM PT 44th Consecutive Profitable Quarter Fourth Quarter Fully Diluted Earnings per Share of $0.94 Full
Volaris Reports Second Quarter 2017 Results: 26% Adjusted EBITDAR Margin. Non-Ticket Revenues Reached 29%
 Volaris Reports Second Quarter 2017 Results: 26% Adjusted EBITDAR Margin. Non-Ticket Revenues Reached 29% Mexico City, Mexico, July 21, 2017 Volaris* (NYSE: VLRS and BMV: VOLAR), the ultra-low-cost airline
Investor Update Issue Date: April 9, 2018
 Investor Update Issue Date: April 9, 2018 This investor update provides guidance and certain forward-looking statements about United Continental Holdings, Inc. (the Company or UAL ). The information in
Heathrow (SP) Limited
 Limited") Draft v2.0 10 Feb Heathrow (SP) Limited Results for year ended 31 December 2013 24 February 2014 Strong operational and financial performance in 2013 Passenger satisfaction at record high and over 72 million
Draft v2.0 10 Feb Heathrow (SP) Limited Results for year ended 31 December 2013 24 February 2014 Strong operational and financial performance in 2013 Passenger satisfaction at record high and over 72 million
Management Presentation. March 2016
 Management Presentation March 2016 Forward looking statements This presentation as well as oral statements made by officers or directors of Allegiant Travel Company, its advisors and affiliates (collectively
INVESTOR PRESENTATION. Imperial Capital Global Opportunities Conference September 2015
 INVESTOR PRESENTATION Imperial Capital Global Opportunities Conference September 2015 Forward-looking Statements This presentation contains forward-looking statements within the meaning of the Private
ABX. Holdings, Inc. BB&T Transportation Conference. February 2008
 ABX Holdings, Inc. BB&T Transportation Conference February 2008 1 Safe Harbor Statement Except for historical information contained herein, the matters discussed in this presentation contain forward-looking
1Q 2017 Earnings Call. April 18, 2017
 1Q 2017 Earnings Call April 18, 2017 Safe Harbor Statement Certain statements included in this presentation are forward-looking and thus reflect our current expectations and beliefs with respect to certain
HOTEL reports 49% and 50% increases in Total Revenues and EBITDA respectively for 1Q18
 HOTEL reports 49% and 50% increases in Total Revenues and EBITDA respectively for 1Q18 Mexico City, April 19 th, 2018 Grupo Hotelero Santa Fe S.A.B. de C.V. (BMV: HOTEL) ( HOTEL or the Company ), announced
STANSTED AIRPORT LIMITED REGULATORY ACCOUNTS PERFORMANCE REPORT FOR THE YEAR ENDED 31 MARCH Financial Review...1. Performance Report...
 PERFORMANCE REPORT CONTENTS Page Financial Review...1 Performance Report...3 Notes to the Performance Report...4 Stansted Regulatory Accounts PERFORMANCE REPORT Financial Review General overview Stansted
Volaris Reports First Quarter 2017 Results: 19% Adjusted EBITDAR Margin
 Volaris Reports First Quarter 2017 Results: 19% Adjusted EBITDAR Margin Mexico City, Mexico, April 20, 2017 Volaris* (NYSE: VLRS and BMV: VOLAR), the ultra-low-cost airline serving Mexico, the United States
Grupo Hotelero Santa Fe Reports Increase of 36% in Total Revenue and 46% EBITDA for 1Q16
 Grupo Hotelero Santa Fe Reports Increase of 36% in Total Revenue and 46% EBITDA for 1Q16 Mexico City, April 21, 2016 Grupo Hotelero Santa Fe S.A.B. de C.V. (BMV: HOTEL) ( HOTEL or the Company ), announced
Thank you for participating in the financial results for fiscal 2014.
 Thank you for participating in the financial results for fiscal 2014. ANA HOLDINGS strongly believes that safety is the most important principle of our air transportation business. The expansion of slots
Investor Relations Update October 25, 2018
 General Overview Investor Relations Update Revenue The company expects its fourth quarter total revenue per available seat mile (TRASM) to be up approximately 1.5 to 3.5 percent year-over-year. Fuel Based
Toluca Tollocan and development of One Toluca Tollocan) representing 401 rooms.
 representing 401 rooms.") FibraHotel ( FibraHotel ), the first real estate investment trust specialized in urban business-class hotels in Mexico, announces (i) the execution and approval of agreements for the acquisition of 15
FibraHotel ( FibraHotel ), the first real estate investment trust specialized in urban business-class hotels in Mexico, announces (i) the execution and approval of agreements for the acquisition of 15
AIR CANADA REPORTS THIRD QUARTER RESULTS
 AIR CANADA REPORTS THIRD QUARTER RESULTS THIRD QUARTER OVERVIEW Operating income of $112 million compared to operating income of $351 million in the third quarter of 2007. Fuel expense increased 49 per
Heathrow (SP) Limited
 Limited") 28 April 2014 Heathrow (SP) Limited Results for three months ended 31 March 2014 Strong operational and financial performance at the outset of the new regulatory period Highest ever passenger satisfaction
28 April 2014 Heathrow (SP) Limited Results for three months ended 31 March 2014 Strong operational and financial performance at the outset of the new regulatory period Highest ever passenger satisfaction
MGM Resorts International Reports First Quarter Financial And Operating Results
 NEWS RELEASE MGM Resorts International Reports First Quarter Financial And Operating Results 4/27/2017 LAS VEGAS, April 27, 2017 /PRNewswire/ -- MGM Resorts International (NYSE: MGM) ("MGM Resorts" or
INVESTOR PRESENTATION. May 2015
 INVESTOR PRESENTATION May 2015 Forward-looking Statements This presentation contains forward-looking statements within the meaning of the Private Securities Litigation Reform Act of 1995 that reflect the
Results 3 rd Quarter 2003
 Grupo Posadas, s, S.A. de C.V. & Subsidiaries October 28 th, 2003 Results 3 rd Quarter 2003 Total revenue and EBITDA increased by 10 and 12 % respectively Coastal hotels continue to improve, rates on urban
Adjusted net income of $115 million versus an adjusted net loss of $7 million in the second quarter of 2012, an improvement of $122 million
 Air Canada Reports Record Second Quarter 2013 Results Highest Adjusted Net Income, Operating Income and EBITDAR Results for Second Quarter in Air Canada s History Adjusted net income of $115 million versus
Volaris Reports Third Quarter 2018 Results: Ancillary Revenue Expansion And Reduction Of Unit Cost Excluding Fuel
 Volaris Reports Third Quarter 2018 Results: Ancillary Revenue Expansion And Reduction Of Unit Cost Excluding Fuel Mexico City, Mexico, October 25, 2018 Volaris* (NYSE: VLRS and BMV: VOLAR), the ultra-low-cost
Melco International Development Limited (Incorporated in Hong Kong with limited liability) Website : (Stock Code : 200)
 Website : (Stock Code : 200)") Hong Kong Exchanges and Clearing Limited and The Stock Exchange of Hong Kong Limited take no responsibility for the contents of this announcement, make no representation as to its accuracy or completeness
Hong Kong Exchanges and Clearing Limited and The Stock Exchange of Hong Kong Limited take no responsibility for the contents of this announcement, make no representation as to its accuracy or completeness
Grupo Hotelero Santa Fe Reports 24% Increase in Total Revenue and 28% in EBITDA for 2Q16
 Grupo Hotelero Santa Fe Reports 24% Increase in Total Revenue and 28% in EBITDA for 2Q16 Mexico City, July 21, 2016 Grupo Hotelero Santa Fe S.A.B. de C.V. (BMV: HOTEL) ( HOTEL or the Company ), announced
FibraHotel ended the quarter with 37 hotels and 5,132 rooms, with 34 hotels in operation (4,798 rooms) and 3 hotels under development (334 rooms).
 and 3 hotels under development (334 rooms).") FibraHotel ( FibraHotel ), the first real estate investment trust specialized in urban business-class hotels in Mexico, announces its financial results and distribution corresponding to the second quarter
FibraHotel ( FibraHotel ), the first real estate investment trust specialized in urban business-class hotels in Mexico, announces its financial results and distribution corresponding to the second quarter
First Quarter Results August 31 st, 2006
 First Quarter Results 2006-07 August 31 st, 2006 Key features of the First Quarter Market context Sustained global economic growth, and a recovery in Europe Average jet fuel price of 691 $/t, up 25% year-on-year
Results 2 nd Quarter 2004
 Grupo Posadas, s, S.A. de C.V. & Subsidiaries July 28 th, 2004 Results 2 nd Quarter 2004 Cosolidated revenues increased 11% EBITDA increased 15% Recovery on REVPAR 3 new openings in the 2Q04, which sum
Grupo Aeroportuario del Pacífico, S.A.B. de C.V.
 UNITED STATES SECURITIES AND EXCHANGE COMMISSION WASHINGTON, D.C. 20549 FORM 20-F ANNUAL REPORT PURSUANT TO SECTION 13 OR 15(d) OF THE SECURITIES EXCHANGE ACT OF 1934 For the fiscal year ended December
HOTEL reports double-digit growth in both Total Revenues and EBITDA for 3Q17
 HOTEL reports double-digit growth in both Total Revenues and EBITDA for 3Q17 Mexico City, October 25, 2017 Grupo Hotelero Santa Fe S.A.B. de C.V. (BMV: HOTEL) ( HOTEL or the Company ), announced its consolidated
Interim Release Q3/9M 2017
 Overview by the Executive Board November 2, 207 In the first nine months of 207, the airports of the Fraport Group recorded strong passenger development. At approximately 48.9 million, passenger numbers
ABX HOLDINGS, INC. Shareholders Meeting. May 13, 2008
 Shareholders Meeting May 13, 2008 1 1 1 Safe Harbor Statement Except for historical information contained herein, the matters discussed in this presentation contain forward-looking statements that involve
FIRST QUARTER 2014 RESULTS
 FIRST QUARTER 2014 RESULTS Mexico City, April 29, 2014 - Grupo Aeromexico S.A.B de C.V. ( Aeromexico ) (BMV: AEROMEX), the largest airline in Mexico, today reported its unaudited consolidated results for
Grupo Sanborns S.A.B. de C.V. Earnings Report 3Q 2018
 Grupo Sanborns S.A.B. de C.V. Earnings Report 3Q 2018 Mexico City, October 24, 2018 Grupo Sanborns, S.A.B. de C.V. (BMV: GSANBOR OTC: GSAOY) announced today its results for the third quarter of 2018. HIGHLIGHTS
Historical Statistics
 Historical Statistics FedEx Corporation Financial and Operating Statistics FY 2005 FY 2014 This report is a statistical supplement to FedEx s interim financial reports and is prepared quarterly. Additional