Weekly Market Insight Friday, 25th January 2019
|
|
|
- Felicia Robbins
- 5 years ago
- Views:
Transcription

1 Weekly Market Insight With such a discouraging week start, it would have been of a great surprise to see things progressing on a merry tone. China s economic growth dropped to its slowest annual rate in almost three decades last year as the US trade war and Beijing s crackdown on a debt-fuelled corporate spending had a negative bearing on the world s second largest economy. The data released on Monday showed the Chinese economy growing at 6.6 per cent in 2018, the lowest rate since Most importantly though, by growing just 6.4 per cent in the fourth quarter, Chinese economy reported a decelerating growth for three consecutive quarters, spreading concerns in most markets around the globe that the front runner losing its pace. With this in view, the International Monetary Fund pointed out that the global expansion has weakened. As in the October 2018 World Economic Outlook (WEO) forecast and despite weaker performance in some economies, notably Europe and Asia, global growth for 2018 is estimated at 3.7 percent. However, the global economy is projected to grow at 3.5 percent in 2019 and 3.6 per cent in 2020, 0.2 and 0.1 percentage points below last October s projections. Specifically, growth in advanced economies is projected to slow down from an estimated 2.3 percent in 2018 to 2.0 percent in 2019 and 1.7 percent in For the emerging markets and developing economy group, growth is expected to tick down to 4.5 percent in 2019 (from 4.6 percent in 2018), before improving to 4.9 percent in The projection for 2019 is 0.2 percentage points lower than in the October 2018 WEO. Contents Spot Market...2 FFA Market..5 Bunker Market..8 S&P Market.9 Distant Past Market.12 In this macro environment and with Chinese trading absence echoing in the iron ore and coal runs, the Baltic Dry Index dropped below the 1000-point mark for the first time in the last nine months. Although it is nothing unusual in a downward trending BDI during the first two months of a trading year, it is the prevailing atmosphere coupled with the fact that the index has already slid below its 2018 minima not letting the market sentiment to turn positive. Doric Shipbrokers S.A. Tel: Fax: drycargo@doric.gr Inquiries about the content of this report Michalis Voutsinas research@doric.gr Looking for glimpses of hope, both global growth and BDI have turned their focus on Chinese stimulus packages for yet another time trying to guesstimate their levels and their positive externalities. In any case, a freight market with rates very close or even below sector s OPEX cannot be at a state of sustainable balance. Freight market 120yrs ago (page 12): Chartering continues active, although in some directions lower rates have been accepted, more especially from the Black Sea and Mediterranean Doric Shipbrokers, Research Page 1

2 Dry Cargo Spot Market Double-digit losses across the board sent the Baltic Dry Index plummeting at 905 points on this week closing. The Baltic Capesize Index returned below the 200-point mark, concluding at 1730 points. Being in a freefalling state, the Baltic Panamax Index balanced this Friday at 748 points, last seen in early October The geared segments remained under severe pressure as well, finishing considerably lower. In particular, the Baltic Supramax index lay at 576 points, 17.8% lower than the previous Friday closing. With a 56- point decrease, the Baltic Handy Index ended at 395 points. At the box office, Capesize returns managed to stay marginally positive, whilst those of all other segments plummeted deeply in the negative territory of our ROCE graph. Particularly, Capesize ROCE balanced at 0.39% and Panamax ROCE at -4.74%, or down 208 and 340 bps on a weekly basis respectively. Supramax ROCE went further down to -2.39% at the same time as handy ROCE was balancing at -3.19%. Baltic Freight Indices Date BDI BCI 5TC BPI - TCA BSI - TCA BHSI - TCA 21-Jan $15,606 $7,974 $7,631 $6, Jan $14,608 $7,644 $7,396 $6, Jan $13,823 $7,187 $7,122 $6, Jan $13,373 $6,671 $6,784 $5, Jan $13,288 $6,020 $6,436 $5, month High 1774 $27,283 $14,385 $13,431 $9, month Low 905 $7,051 $6,020 $6,436 $5, month Avg 1340 $16,364 $11,492 $11,294 $8,605 Avg. Cal $16,529 $11,609 $11,487 $8,700 Avg. Cal $15,129 $9,766 $9,168 $7,636 *Return on Capital Employed (ROCE) is the ratio of net operating profit of an investment to its capital employed. It measures the profitability of an investment by expressing its operating profit as a percentage of its capital employed. In other words, ROCE assesses how much profit an investment earns on every dollar employed. Doric Shipbrokers, Research Page 2
3 Following an attempt to move higher towards the end of last week, the Baltic Capesize 5TC index retreated to $13,288 daily, down 15.6% W-o-W. Being influenced by the softer tone of the Cape market during the last quarter of 2018, JP Morgan has cut back its Capesize rate forecasts for 2019 and In the Pacific basin, BHP warned investors this week of a reduction to its earnings following 2018 production disruptions. According to the Anglo-Australian miner, a runway iron ore train in Western Australia last year and an unexpected outage at its mine in South Australia led to lower than expected volumes during However, BHP has maintained its iron ore production forecast for the current year at 241 to 250m tones. In the spot market, the C5 Baltic Index concluded 13.1% lower W-o-W at $6.045 pmt. For such a run, BHP was linked with a 6-8 February cargo from Port Hedland to Qingdao at $6.00 pmt. The 'Ugo De Carlini' (176,153 dwt, 20010) with prompt delivery Zhoushan was fixed for a trip via EC Australia to Singapore-Japan at $7,600 daily and the same charterer also took the 'H S C ' (173,799 dwt, 2006) basis delivery Zhoushan 26/27 Jan for a trip via EC Australia with redelivery Singapore-Japan at $9,000. On the same tone, the Transpacific index (C10_14) dropped 26.2% M-o-M concluding at $10,642. In the Atlantic, disruptions at Anglo s Minas Rio iron ore Brazilian mine impacted their production figures of 2018, with steel making output in the last quarter of the last year decreasing by 13% compared to the respective quarter of Anglo s American South African mine is expected to produce circa 43.5 million tons of iron ore this year, and its Brazilian mine circa 19 million tons. In reference to the freight market, the Baltic C3 index despite the recent downward pressure, ended the week at $16,318 pmt, without material change on a monthly basis. For a C3 cargo, the MSXT Trinity (178,076 dwt, 2010) was reported fixed at $16.40 pmt for second half February, and the Stella Lucy (180,012 dwt, 2015) at $15,000, with delivery retro Lanshan 20 January for a trip via Brazil to Singapore-Japan with Hyundai Glovis. The fronthaul index balanced at $26,614 daily. The Gotia (178,012 dwt, 2012) was fixed basis delivery Passero early February for a trip via Nouadhibou to Japan at $25,000 with MOL. Period activity again remained thin, with the Navios Melodia (179,132 dwt,2010) reported fixed for 4/6 months with delivery China at $14,500 daily with Hyundai Glovis and with Rio Tinto taking the Cape Stork for 1 year period with retro delivery Dalian at $ 16,000 daily. Representative Capesize Fixtures Vessel DWT Built Delivery Date Re-del Rate Charterers Comment Ugo De Carlini 176, Zhoushan Prompt Singapore-Japan $7,600 Pacific Bulk via Australia HSC 173, Zhoushan 26/27Jan Singapore-Japan $9,000 Pacific Bulk via Australia Stella Lucy 180, Retro Lanshan 20 Jan Singapore-Japan $15,000 Huandai Glovis via Brazil Gotia 178, Passero 1-5 Feb Japan $25,500 Mol via Nouadhibou Navios Melodia 179, China End Jan WW $14,500 Hyundai Glovis 4/6 Months Cape Stork 175, Retro Dalian 18 Jan WW $16,000 Rio Tinto 11/13 Months For a fourth consecutive week, all Panamax indices continued to fall, with cargo in absentia and spot tonnage inundating the market. In the Pacific, activity was almost put at a halt with Charterers continuously reducing their bids and Owners unable to resist. In the South East Asia region, trading was thin, Alpha Afovos (74,427 dwt, 2001) has gone for a coal trip with delivery Indonesia for Fareast destination at $6,000 daily. Further south, only a few fresh mineral cargoes came out of Australia, but not enough to support the long spot/prompt tonnage list. Seagull Wind (82,908 dwt, 2013) fixed at $6,000 daily with 27 January delivery Sakaide for one T/C trip via East Australia to India. No Pac grain activity was present yet seemingly lesser compared last week. Eva (82,620 dwt, 2013) was reported at $9,000 daily for a round trip with prompt delivery Ishinomaki. With the pacific basin under such strong pressure, some owners turned a Nelson s eye to the low rates and initiated the long ballast option to South Africa and/or South America. In the Atlantic region, any cargo is valuable commodity to the spot-prompt ships that admittedly are being fixed. All routes have taken a strong hit leaving Owners with two extreme options, fix at any cost or remain unfixed awaiting for better options with most owners taking the former option. On the Trans-Atlantic trade, Clio (73,691 dwt, 2005) got $4,000 daily with 23 January delivery Hamburg for 1 T/C round trip via Baltic. On the other side of the Atlantic, the kamsarmax Oceana (81,600 dwt, 2014) was concluded at equivalent levels albeit with APS delivery NC South America for one T/C trip to Skaw-Gibraltar range at $11,000 daily. The front-hauls, where no exception to the Atlantic rates collapse. Silver Dragon (74,748 dwt, 2006) reported fixed at $12,750 daily plus $275,000 gbb for one T/C trip on APS EC South America delivery 15 February to China. The US Gulf and US East Coast market remained quiet this past week as well with the odd mineral requirements breaking the deafening silence. Athina (76,635 dwt, 2007) surfaced at $15,000 daily with 22 January delivery Ghent for one T/C trip via USEC to India. Similar levels to the latter fixture were being bid for grain cargoes out of black sea and redelivery PMO-Japan and the offer standing at mid high teens with delivery Canakkale. It is worth noting that many operators are seeing these rock botton levels as an opportunity to commit cheap tonnage which at least depicts an upward expectation in the medium term. Aeneas (81,586 dwt, 2011) was reported at $8,000 daily for the first 40 days and $11,000 thereafter for 3 to 5 months with 25/28 January delivery at Hong Kong. On the longer period, MBA Liberty (82,217 dwt, 2010) fixed $9,000 daily for the first 30 days and $11,300 thereafter for 8 to 12 months with later dates (5/10 February) delivery at Cai Lan. Representative Panamax Fixtures Vessel DWT Built Delivery Date Re-del Rate Charterers Comment Alpha Afovos 74, Indonesia 26 Jan Singapore-Japan $6,000 cnr Seagull Wind 82, Sakaide 27 Jan India $6,000 Cargill via Eaus Eva 82, Ishinomaki prompt Singapore-Japan $9,000 Dreyfus via NoPac Silver Dragon 74, ECSA 15 Feb China $12,750 + $275,000 gbb Cargill Oceana 81, NCSA end Jan Skaw-Gibraltar $11,000 Bunge Clio 73, Hamburg 23 Jan Continent $4,000 ACB Aeneas 81, Hong Kong 25/28 Jan worldwide $8,000 for 1st 40d, $11,000 balance Norden 3/5 mos MBA Liberty 82, Cai Lan 05/10 Feb worldwide $9,000 for 1st 30d, $11,300 balance Norden 8/12 mos Doric Shipbrokers, Research Page 3
4 With a 17.8% weekly decrease, the Baltic Supramax TC index plunged to $6,436 daily this Friday. As we are approaching the Chinese New Year, the market in the Pacific is getting heavily affected by the sluggish demand in the area. Whilst the majority of the market participants are familiar with the slow-down prior and during this period, this time the indices broke the resistance levels of the past 2 years. The time charter average of the 4 routes representing Far East today is $5,575 compared to $7,469 on the same day a year ago. The activity in the coal front was minimal with fixtures getting concluded mostly basis aps Indonesia in the region of 7k for China direction. For a nickel ore trade, the "Kiran America" (56,569 dwt, 2010) open in Zhanjiang fixed a poor $6,000 basis delivery Philippines to China. On the backhaul front, it was heard that an Ultramax was offering aps Cjk $2,000 for the first 55 days and $10,000 thereafter for a trip to Mediterranean with charterers on the other hand not reacting. From the Persian Gulf, rumours had the "Kibali" (57,260 dwt, 2011) open in Mumbai on subs for delivery Fujairah trip to Bangladesh at $9,000 daily. In the Atlantic, the picture remained grim as the market has been unable to find any support and time charter rates kept dropping by about $600 day by day, while the Atlantic routes of the BSI shed on average 23% w-o-w. Spot activity out of the USG remained scarce, with only a limited number of fixtures being reported. One such was the Nefeli (63,466 dwt, 2016) which was fixed for a trip to Peru at $14,000 daily. ECSA didn t manage to hold close to last done levels either, despite a high cargo activity regionally. We heard that Ultramaxes were being fixed for fronthaul trips from South Brazil to the Far East at $11,000 daily plus $120,000 ballast bonus. Moving on to the Continent, the ES Leader (64,012 dwt, 2018) was fixed at $14,000 daily basis delivery Liverpool for a trip via Baltic to Bangladesh with grains. On transatlantic trades, the Seven Lady (51,241 dwt, 2009) was fixed for a trip from Antwerp to USEC at $3,100 daily. Having lost its momentum, the Black Sea hovered at marginally higher levels than the Continent. The Amis Kalon (58,107 dwt, 2010) was fixed for a trip to Bangladesh at $15,000 basis delivery passing Canakkale. On the period front, the Soho Merchant (63,800 dwt, 2015) locked $11,750 daily for 5-7 months trading basis delivery Kwangyang and redelivery worldwide. Representative Supramax Fixtures Vessel DWT Built Delivery Date Re-del Rate Charterers Comment Kiran America 56, Zhanjiang 26/27 Jan China $6,000 Cnr Nickel ore via Philippines Sage Sanaga 63, Kohsichang Prompt China $7,200 Tongli Tapioca Chips Nefeli 63, USG 18 Jan Peru $14,000 Centurion Intention grains ES Leader 64, Liverpool Prompt Bangladesh $14,000 Norvic Trip via Baltic with grains Seven Lady 51, Antwerp Prompt USEC $3,100 Clipper Amis Kalon 58, Canakkal Prompt Bangladesh $15,000 cnr Trip via Black Sea Soho Merchant 63, Kwangyang Prompt Worldwide $11,750 Panocean 5-7 months period No light at the end of the tunnel in the for Far East - Speechless in the Atlantic for the Handysize. Despite the approaching Chinese Lunar New Year holidays, the market in the Far East, for yet another week, was declining. This causes anxiety among participants and on some occasions panic is being noticed especially from owners. In fact, the BHSI index closed at 395 points today at its lowest since February In order to have a perspective on this, one year back, to the day, the BHSI stood at 581 points. Rates across the board are dropping consistently and market participants have started recalling memories of The time charter average is about $5,700 in the East whilst the list of spot ships is getting larger day by day. However, news of a new stimulus package from the Chinese government have revived hopes for a recovery in the market, albeit after the Chinese New Year hiatus of business. On the fixtures front, amid rumours and exaggerations, we heard of mv Leap Heart (28,328 dwt, 2012) which was spot in Kuantan, conceding at $4,000 daily with delivery Singapore for a trip with alumina via west Australia back to Seasia. Koombana Bay (28,382 dwt, 2009) also spot at Taichung fixed a CIS round trip at $5,100 basis passing Busan. Earlier in the week Irongate (28,316 dwt, 2015) opening in Kohsichang was reported covered at $7,150 basis delivery Singapore for a trip via Australia to China. Once again, we were all surprised from the abysmal drop in rates for the Atlantic Handy this past week. In ECSA, the almost complete non-existence of new cargo caused some serious pain in owners who saw their ships idling around and about the coast. Rates are well into the 4 digits and have gone as low as $6,250 for a steels cargo from Praia Mole to Continent on a 32,836dwt. Despair has settled in also in the USG, where owners were actually ready to book any business that seemed to be even remotely firm. Large Handies were willing to fix $5,000 from SW Pass for trips to EC Mexico and just a bit more at $7,500 for trips to Peru. The Continent followed en suite and saw almost no new cargoes. No surprise to that one could say. Just a couple of fresh scrap cargoes which could not hold the whole area intact. We have heard of a 32,000 dwt fixing $6,000 from inside the Baltic for a trip to Caribs, whereas a 38,981 dwt fixed just a bit more from Bremen to USEC earlier this week. Stampede for firm cargoes also in the Med/Bl. Sea. Any cargo that popped up was fixed within a couple of hours and most of the time at levels a bit lower than first expressed. We heard rumours of large Handies looking at $5-6,000 for trips to USG. And the question remains. Is USG still considered a reposition for handy tonnage? No activity was heard on the period desk which some might consider logical. Representative Handysize Fixtures Vessel DWT Built Delivery Date Re-del Rate Charterers Comment Leap Heart 28, Singapore Prompt Seasia $4,000 cnr alumina via Australia Koombana Bay 28, Busan Prompt China $5,100 cnr via CIS Irongate 28, Japan Prompt China $7,150 cnr via Australia African Bulker 36, Recalada ppt Kaliningrad $8,000 White Lake Elm K 32, Praia Mole ppt Continent $6,250 WBC steels Giovanna 34, Bblanca ppt N.Brazil $8,000 Norden Warmia 38, Bremen ppt USEC $8,000 cnr Strategic Explorer 39, Savannah ppt UK/Cont $5,500 Norden New Island 47, Canakkale ppt W.Africa $8,500 Conti GMT Doric Shipbrokers, Research Page 4


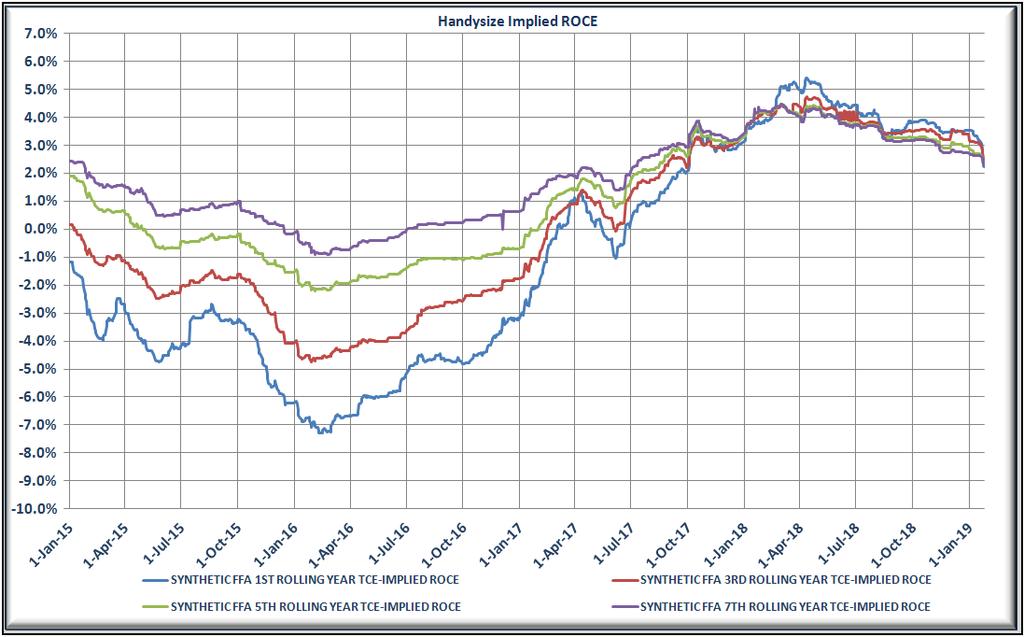
5 FFA Market One should search in every corner of the forward market to find an upward movement and still it would be in vein. Particularly, the prompt months of the Capesize forward curve reported significant losses, with February contracts balancing at $11,600 and March at $12,383. In sync, the Panamax curve moved down to $7,108 and $9,000 for February and March respectively. Being in the red as well, Supramax forward market stood below previous week closing, with February balancing at $7,063 and March at $8,567. Losing further ground, prompt Handy contracts drifted lower to February levels of $7,088. Capesize first rolling year implied ROCE decreased to 2.5% this week at the same time as that of Panamax was balancing lower at just 1.3%. Geared segments implied ROCEs trended downwards, with Supramax at 2.7% and Handy at 2.2%. Doric Shipbrokers, Research Page 5

6 Doric Shipbrokers, Research Page 6
7 BFA Cape 5TC Date Jan (19) Feb (19) Mar (19) Q2 (19) Q3 (19) Q4 (19) Cal 20 Cal 24 Cal Jan-19 $14,896 $12,483 $13,267 $14,492 $17,042 $20,058 $15,208 $13,925 $13, Jan-19 $14,508 $11,608 $12,575 $13,729 $16,658 $19,704 $14,967 $13,875 $13, Jan-19 $14,500 $11,858 $12,775 $13,921 $16,846 $19,879 $15,058 $13,858 $13, Jan-19 $14,358 $11,683 $12,608 $13,850 $16,850 $19,875 $15,017 $13,846 $13, Jan-19 $14,421 $11,600 $12,383 $13,675 $16,613 $19,733 $14,925 $13,833 $13,833 Week High $14,896 $12,483 $13,267 $14,492 $17,042 $20,058 $15,208 $13,925 $13,925 Week Low $14,358 $11,600 $12,383 $13,675 $16,613 $19,704 $14,925 $13,833 $13,833 Week Avg $14,537 $11,846 $12,722 $13,933 $16,802 $19,850 $15,035 $13,867 $13,867 BFA Panamax 4TC Date Jan (19) Feb (19) Mar (19) Q2 (19) Q3 (19) Q4 (19) Cal 20 Cal 24 Cal Jan-19 $8,825 $8,667 $10,033 $10,829 $10,788 $11,396 $10,108 $8,675 $8, Jan-19 $8,708 $8,383 $9,633 $10,533 $10,575 $11,429 $10,104 $8,679 $8, Jan-19 $8,613 $8,017 $9,550 $10,442 $10,496 $11,458 $10,021 $8,681 $8, Jan-19 $8,433 $7,300 $8,913 $9,975 $10,092 $11,071 $9,800 $8,625 $8, Jan-19 $8,367 $7,108 $9,000 $9,950 $10,075 $11,050 $9,725 $8,596 $8,604 Week High $14,896 $12,483 $13,267 $14,492 $17,042 $20,058 $15,208 $13,925 $13,925 Week Low $14,358 $11,600 $12,383 $13,675 $16,613 $19,704 $14,925 $13,833 $13,833 Week Avg $14,537 $11,846 $12,722 $13,933 $16,802 $19,850 $15,035 $13,867 $13,867 BFA Supra 10TC Date Jan (19) Feb (19) Mar (19) Q2 (19) Q3 (19) Q4 (19) Cal 20 Cal 24 Cal Jan-19 $8,633 $8,329 $9,758 $10,667 $10,796 $11,475 $10,017 $9,211 $9, Jan-19 $8,517 $7,875 $9,088 $10,333 $10,550 $11,275 $9,833 $9,179 $9, Jan-19 $8,521 $7,504 $8,729 $10,208 $10,471 $11,258 $9,750 $9,163 $9, Jan-19 $8,513 $7,213 $8,633 $9,892 $10,250 $11,075 $9,658 $9,108 $9, Jan-19 $8,467 $7,063 $8,567 $9,750 $10,171 $11,067 $9,600 $9,079 $9,075 Week High $14,896 $12,483 $13,267 $14,492 $17,042 $20,058 $15,208 $13,925 $13,925 Week Low $14,358 $11,600 $12,383 $13,675 $16,613 $19,704 $14,925 $13,833 $13,833 Week Avg $14,537 $11,846 $12,722 $13,933 $16,802 $19,850 $15,035 $13,867 $13,867 BFA Handysize TC Date Jan (19) Feb (19) Mar (19) Q2 (19) Q3 (19) Q4 (19) Cal 20 Cal 24 Cal Jan-19 $7,944 $7,894 $8,375 $8,931 $8,775 $9,456 $8,813 $8,644 $8, Jan-19 $7,519 $7,606 $8,238 $8,831 $8,675 $9,381 $8,738 $8,600 $8, Jan-19 $7,363 $7,550 $8,150 $8,763 $8,600 $9,325 $8,713 $8,588 $8, Jan-19 $7,050 $7,150 $7,850 $8,513 $8,463 $9,138 $8,575 $8,513 $8, Jan-19 $6,988 $7,088 $7,788 $8,488 $8,450 $9,113 $8,569 $8,506 $8,525 Week High $14,896 $12,483 $13,267 $14,492 $17,042 $20,058 $15,208 $13,925 $13,925 Week Low $14,358 $11,600 $12,383 $13,675 $16,613 $19,704 $14,925 $13,833 $13,833 Week Avg $14,537 $11,846 $12,722 $13,933 $16,802 $19,850 $15,035 $13,867 $13,867 Doric Shipbrokers, Research Page 7
8 Bunker Market Rotterdam Singapore Fujairah Gibraltar Houston Date ($/mt) IFO 380 MGO IFO 380 MGO IFO 380 MGO IFO 380 MGO IFO 380 MGO 21-Jan-19 $364 $531 $406 $576 $387 $734 $395 $604 $378 $ Jan-19 $366 $533 $411 $573 $392 $732 $398 $604 $380 $ Jan-19 $367 $528 $409 $574 $388 $723 $397 $606 $380 $ Jan-19 $366 $527 $409 $573 $387 $721 $395 $605 $374 $ Jan-19 $362 $522 $400 $569 $382 $718 $390 $600 $370 $ month High $483 $712 $526 $759 $529 $798 $510 $768 $750 $ month Low $309 $469 $347 $502 $336 $660 $352 $545 $328 $ month Avg $401 $609 $435 $641 $433 $721 $430 $667 $405 $654 Singapore 25-Jan-18 Week max Week low Week Avg RTDM Jan-18 Week max Week low Week Avg Feb-19 $386.2 $388.3 $380.3 $384.5 Feb-19 $358.5 $361.3 $352.8 $357.1 Mar-19 $381.7 $389.2 $375.5 $381.8 Mar-19 $355.7 $358.6 $350.0 $354.2 Apr-19 $377.5 $385.0 $371.0 $377.5 Apr-19 $352.5 $355.6 $346.8 $350.9 May-19 $372.5 $379.7 $366.3 $372.5 May-19 $348.2 $351.6 $342.5 $346.7 Jun-19 $366.0 $373.7 $360.5 $366.4 Jun-19 $343.2 $346.8 $337.8 $341.7 Jul-19 $359.2 $367.0 $354.0 $359.8 Jul-19 $337.0 $341.3 $331.8 $335.7 Q2-19 $372.0 $379.5 $365.9 $372.1 Q2-19 $348.0 $351.3 $342.4 $346.5 Q3-19 $351.2 $359.0 $346.7 $352.1 Q3-19 $328.7 $333.8 $324.9 $328.2 Q4-19 $325.0 $335.0 $322.1 $327.3 Q4-19 $300.7 $307.1 $297.3 $301.0 Q1-20 $302.5 $314.0 $299.6 $305.6 Q1-20 $280.0 $287.3 $276.5 $280.6 CAL20 $296.5 $303.6 $295.0 $297.7 CAL20 $277.0 $284.1 $275.5 $278.2 CAL21 $309.0 $313.3 $306.1 $308.9 CAL21 $287.0 $291.1 $284.4 $286.8 CAL22 $330.5 $334.8 $327.6 $330.4 CAL22 $303.0 $307.1 $300.4 $302.8 CAL23 $346.5 $350.8 $343.6 $346.4 CAL23 $305.3 $309.3 $302.6 $305.1 Doric Shipbrokers, Research Page 8
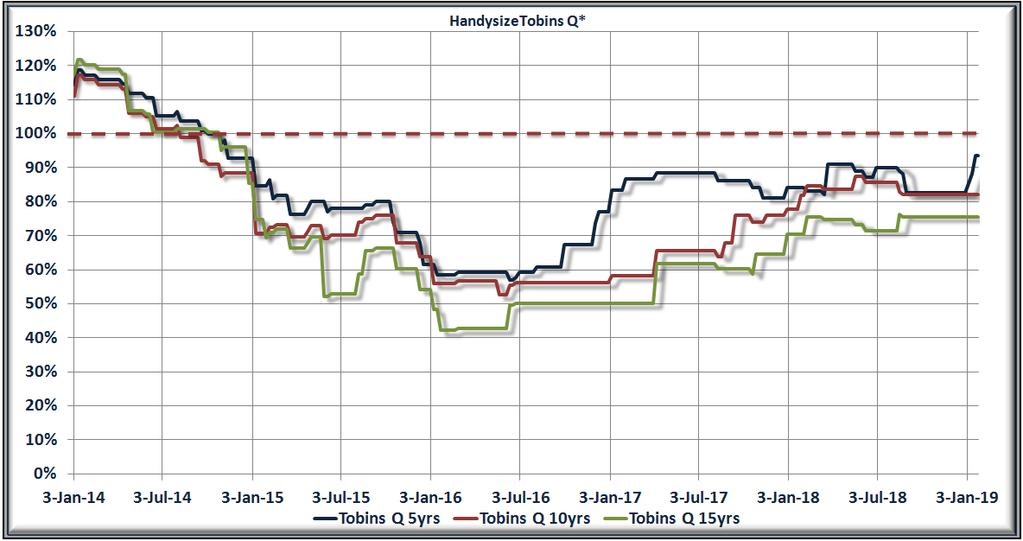
9 Dry Bulk S&P Market The only change worth mentioning in the indicative prices during the past week was in the Capesize newbuilding market. Being unaffected from the tumbling freight market, newbuilding Capes are on an upward trend lately, currently hovering at circa USD 51m or up USD 7m year-on-year. The rest of the S&P market decided to wait for the freight market to send a clear sign of its intentions in order to shape its future path. In reference to the real action, we ve heard this week that the MV Mineral Beijing (174,083dwt, 2004) changed hands at USD 13mil. Thus, with the vast majority of newbulding and secondhand prices trending sideways this week, Tobin s Q ratios remained in most cases at previously reported levels. Indicatively, the market for ten-year-old Capesizes and same-aged Handies balanced at 17% and 18% off from their adjusted newbuilding prices respectively, with the former being the only ratio that moved lower. Ten-year-old Panamaxes and same-aged Supramaxes are in the market at a discount of 12% and 11% respectively to their newbulding prices, if we compare them on the same age basis. Indicative Newbuilding Prices Date Capesize 180K DWT Panamax 76K DWT Supramax 56K DWT Handysize 32K DWT 25-Jan Jan Jan Δ% Y-o-Y 21.4% 14.6% 16.9% 23.1% Δ% % 6.8% 7.2% 17.1% Indicative Five-Year-Old Prices Date Capesize 176K DWT Panamax 75K DWT Supramax 52K DWT Handysize 28K DWT 25-Jan Jan Jan Δ% Y-o-Y 34.0% 26.7% 20.0% 25.9% Δ% % 46.2% 38.5% 78.9% Reported Recent S&P Activity Vessel Name DWT Built Yard/Country Price $Mil. Buyer Comments Amorito 179, Sungdong/Korea 33 Undisclosed Five Stars Beijing 181, Sasebo/Japan 23 Greek buyers Auction Mineral Beijing 174, Shanghai Waigaoqiao/China 13 Undisclosed Atlantic Sun 82, Jiangsu/China 26.5 Undisclosed Crystal Star 82, Sanoyas /Japan 24.5 Greek buyers Grand Amanda 79, Jinhai/China low 12 Undisclosed An Ho 77, China Shipbuilding/Taiwan 7.8 Undisclosed Reborn 74, Tsuneishi/Japan 6.2 Undisclosed Loch Nevis 61, Shin Kurushima/Japan low 24 Undisclosed C 4 X31 Queen Cuki 63, COSCO Zhoushan/China 20.5 Undisclosed C 4x30 Ocean Colossus 58, Kawasaki/Japan 15.4 Greek buyers C 4x30 Paros Seas 56, Jiangdong/China low-mid 12.2 Chinese buyers C 4x30 Topaz Halo 55, Mitsui/Japan 15.4 Undisclosed C 4x30 Luisia Colossus 55, Kawasaki/Japan 14.8 Greek buyers C 4 X 30,5 SSI Expedition 56, Zhejiang Zhenghe/China 12.4 Chinese buyers C 4x36 Tigris 52, Tsuneishi/Japan 8 Undisclosed C 4 X30 Zebra Wind 50, Oshima/Japan 12.5 Undisclosed C 4 X30 Sea Confidence 52, Oshima/Japan 9 Chinese buyers C 4x30 Uniorder 47, Oshima/Japan 4.7 Undisclosed C 4 X30 Nanning 38, Huanghai/China 21 Chinese buyers Tc Back C 4 X30 Grand Marais 35, Jiangdong/China low 16 Undisclosed C 4x30 Ocean Neptune 37, Hyundai/S.Korea 13 Undisclosed C 4x30 Bonnie Venture 32, Zhejiang Hongxin 10 Undisclosed C 4 X 30 Trade Star 29, Shikoku/Japan 9.2 Greek buyers C 4x31 Pacific Future 29, Dalian/China 3.7 Chinese buyers C 5 X30 Di Xiang 23, Zhejiang Tianshi/China 5.3 Chinese buyers Auction Tobin's Q* Capesize-Panamax Date Capesize 5yrs Capesize 10yrs Capesize 15yrs Panamax 5yrs Panamax 10yrs Panamax 15yrs Current ratio 80% 83% 68% 85% 88% 76% 12months High 95% 88% 80% 91% 102% 102% 12months Low 80% 77% 68% 85% 88% 76% 12months Avg 89% 84% 75% 87% 94% 89% Tobin's Q* Supramax-Handysize Date Supramax 5yrs Supramax 10yrs Supramax 15yrs Handysize 5yrs Handysize 10yrs Handysize 15yrs Current ratio 86% 89% 86% 94% 82% 76% 12months High 91% 98% 107% 94% 87% 76% 12months Low 86% 89% 86% 82% 82% 71% 12months Avg 88% 93% 94% 87% 84% 74% Doric Shipbrokers, Research Page 9


10 Doric Shipbrokers, Research Page 10

11 Doric Shipbrokers, Research Page 11

12 Market Insight 120 years ago By: Michalis Voutsinas, Doric Shipbrokers S.A. and Angela Papanastasatou, Tufton Oceanic Ltd. Weekly Spot Market Current week Previous week Dec-97 Nov-97 Oct-97 Implied Spot Roce 11.1% 11.3% 17.0% 16.9% 13.5% Global Spot TCE BlackSea Round East Round Med Round US Round River Plate Round S&P Market (5,000dwt) Current week Previous week Dec-97 Nov-97 Oct-97 NB 32,367 32,367 32,110 31,599 31,087 SH 5yrs old 25,962 25,962 24,820 24,584 24,642 SH 10yrs old 19,843 19,843 18,795 18,580 18,635 SH 15yrs old 14,775 14,775 13,696 13,477 13,534 Doric Shipbrokers, Research Page 12
13 History does not repeat itself but it does rhyme If the current rates tumble down much further, we shall next be hearing of boats of 3,700 tonnes and upwards leaving the Mediterranean after discharge of their coal cargoes, in ballast for South America or for India. Those large boats, for instance, which have got about 11s for Port Said, can make a satisfactory voyage by running in ballast to Burmah for 30s rice, or even to Bombay for 19s mixed cargo. We consider that 11s Wales to Port Said is equal to, or better than 12s now being accepted from Blyth to Bombay that is after allowing for the reduction in Canal dues etc. Then again, tonnage is now offering at 11s 9d. Wales to the Plate, so that thoe now on passage or discharging at the West Italian ports, etc., at about 10s 6d can afford to run in ballast for the Plate, filling up with bunkers at Las Palmas or St. Vincent on the way out. At Genoa discharging costs about 7d per tonne, against 1s per tonne on the majority of Plate charters, while the discharge in the Mediterranean is 500 to 700 against 200 tonnes at Buenos Ayres, so that the difference in rates is about made up by the increased despatch and saving in cost of discharging. We admit that there is some deviation and cost of bunkers may prove a serious consideration, but at the same time, such points do not present such insurmountable difficulties as to deter owners from giving these voyages favourable attention. There is a good miscellaneous all-round demand for tonnage, although rates are weak in some spots. General fixing ahead therefore hardly seems justified, but if owners think this judicious then great caution is necessary. Of course, there are circumstances that may justify operating ahead: Eastern business, for instance, just now would seem to warrant this, for outward rates have got down to such a low and unprofitable level that owners are naturally chary in regard to getting their boats the other side of the Canal with a loss on this outward voyage without first securing homeward business that will ensure the round being profitable. Much the same applies to the River Plate market. Outward rates have dropped during the last week or two to the extent of shillings, but at the same time owners have not been deterred from vigorously inquiring for such outward employment. Homeward rates, on the other hand, are good, and the prospects of an upward or downward move for April loading seem about balanced, so that an owner having taken a low rate out is naturally anxious to limit or close the speculation as soon as he can, by fixing home at such a rate as will make the round satisfactory. When outward Plate rates went to 20s some time ago, and also when the US market was booming, there was no occasion to fix ahead from the Plate, as owners could even return home in ballast and still be on the right side. However, with such an outward coal rate as 11s 6d and the US market demoralized, circumstances in regard to homeward fixing are now quite different. In the spot arena, the Black Sea market continues very dull. Berth rates from Odessa to L.H.A.R. being only 8s 9d. From Poti to UK or Rotterdam prompt boats are worth 14s, but for later loading only 13s 4d is quoted. Mediterranean rates are dull. From Sicily to the US, prompt suitable boats for fruit are worth 24s 3d, partial tween-deckers without wood sheathing to the upper deck command 22s 6d. The American market is very quite as far as grain chartering is concerned and rates are down to almost an unprofitable basis, except for very large carriers. Berth grain rates from the Northern range to UK/Cont. are 3s 3d per quarter. From the Gulf ports, February boats are worth 14s 6d to 15s per tonne. Additionally, there is a large demand for timber tonnage from the Gulf port to UK/Cont. The River Plate market continues very firm at splendid rates. From the San Lorenzo limit, berth rates for L.H.A.R. are 22s 10d and for March loading 22s 6d per tonne. From Buenos Ayres or La Plata 19s 3d is quoted. For wool to Antwerp or Dunkirk 16 fcs and for Hamburg 15 marks. The Eastern market is firm all round. From Bombay spot tonnage is worth 19s and for second half of February loading 18s 9d. Calcutta berth rates to UK/Cont. are 28s jute basis. On the S&P front, both the newbulding market and the secondhand market trended sideways. A typical newbuilding 5,000dwt Britishbuild steamer is currently at the market for 39,600, up 27.5% on a yearly basis, whereas a fifteen-year-old of the same dwt and specification at 18,900, or up 39.5% Y-o-Y. Doric Shipbrokers, Research Page 13
Weekly Dry Bulk Report
 2-215 -Shipbrokers and consultants since 1919- ly Dry Bulk Report 22 May 3th 214 12 1 8 6 4 2 HIGHLIGHTS Capesize: Still quiet market Panamax: Continued slide in rates L&S INDEX OF DRY BULK STOCKS* Index
Weekly Dry Bulk Report
 49 -Shipbrokers and consultants since 1919- ly Dry Bulk Report 22 May 3th 214 15 95 85 75 65 55 45 35 HIGHLIGHTS Capesize: BCI down 31% w-o-w Panamax: Slightly firming BPI L&S INDEX OF DRY BULK STOCKS*
Weekly Dry Bulk Report
 9 -Shipbrokers and consultants since 1919- ly Dry Bulk Report 22 May 3th 214 15 85 65 45 25 HIGHLIGHTS Capesize: Boost in fixtures for C5 towards the weekend Panamax: Pacific activity slowly increasing
Weekly Dry Bulk Report
 5 ly Dry Bulk Report 22 May 3th 214 15 85 65 45 25 HIGHLIGHTS Capesize: Few shipments into China Panamax: Rates still declining L&S INDEX OF DRY BULK STOCKS* Index 214 Index 215 CAPESIZE PANAMAX Rates
Weekly Dry Bulk Report
 Week 46 -Shipbrokers and consultants since 1919- Weekly Dry Bulk Report Week 22 May 30th 2014 Capesize: Market continues to fall Panamax: BPI-TCA falling 9 per cent from last Friday CAPESIZE The Capesize
Weekly Dry Bulk Report
 12 -Shipbrokers and consultants since 1919- ly Dry Bulk Report 22 May 3th 214 HIGHLIGHTS Capesize: Relatively flat in the Pacific Front haul, reasonably quiet Panamax: Firming rates for tonnage fixing
Dry Bulk Market Weekly Highlights Week 17 - Dry Cargo Market Highlights for the period of 21-April-2011 until 28-April-2011
 Dry Bulk Market ly Highlights 17 - Dry Cargo Market Highlights for the period of 21-April-211 until 28-April-211 17 28/4/211 Baltic Indices / Dry Bulk Spot Rates 16 21/4/211 ±% $/day $/day Point Diff 211
GULF MARITIME SHIPBROKERS & CONSULTANTS K U W A I T beyond shipbrokers
 GULF MARITIME SHIPBROKERS & CONSULTANTS K U W A I T beyond shipbrokers First Licensed Shipbroker in Kuwait 13 May 212 Dry Cargo Weekly Market Report Department Phone email General Info +965 2259 8822 general@gulf-maritime.com
Weekly Dry Bulk Report
 22 -Shipbrokers and consultants since 1919- ly Dry Bulk Report 22 May 3th 214 HIGHLIGHTS Capesize: A more active market throughout the week Panamax: Front haul market saw slightly more activity, not enough
Weekly Dry Bulk Report
 Week 36 -Shipbrokers and consultants since 1919- Weekly Dry Bulk Report Week 22 May 3th 214 HIGHLIGHTS Capesize: Generally lower rates this week Supramax/Handymax: Continued improved market for both segments
Weekly Dry Bulk Report
 44 ly Dry Bulk Report 22 May 3th 214 HIGHLIGHTS Capesize: Firming rates throughout the week in both basins Panamax: Another week of firming rates in all sectors CAPESIZE During an active Monday, both the
Weekly Market Insight Friday, 20th July 2018
 Weekly Market Insight Amid fresh escalation in trade tension between the US and China, commodity prices followed a downward path during the last period. Concerns that the tit-for-tat tariff war could derail
Weekly Market Insight Friday, 19th October 2018
 Weekly Market Insight Fuelled by an upward trending freight market, asset prices in the secondhand market started off the current trading year on the right foot. After the typically weakest month of the
Weekly Market Insight Friday, 14th September 2018
 Weekly Market Insight Although sentiment and analysts projections remain bullish for the rest of the trading year, the BDI decided to ruin the party moving further south this week balancing below 1400
Weekly Market Insight Friday, 22nd June 2018
 Weekly Market Insight While forecasts remain positive for the short-term prospects of the sector and many market participants have taken long positions in the period market, spot market seems directionless
NILIMAR Ships Sale & Purchase MARKET REPORT WEEK 35 BASED ON SALES AND PURCHASES OF VESSELS WEEK ENDED FRIDAY 2 nd SEPTEMBER 2011.
 MARKET REPORT WEEK 35 BASED ON SALES AND PURCHASES OF VESSELS WEEK ENDED FRIDAY 2 nd SEPTEMBER 2011. The BDI moved up by nearly 13% last week mainly because the BCI enjoyed a fantastic week increasing
Golden Ocean Group Limited Q results March 1, 2007
 Golden Ocean Group Limited Q4 2006 results March 1, 2007 PROFIT & LOSS 2005 2006 (in thousands of $) 2006 2005 Oct-Dec Oct-Dec Jan - Dec Jan - Dec Operating Revenues 37 292 91 253 Time charter revenues
LPG & Petrochemical Shipping: Current Status & Outlook. A better market, but for how long? Nicola Williams, Clarksons March 16th 2005
 LPG & Petrochemical Shipping: Current Status & Outlook A better market, but for how long? Nicola Williams, Clarksons March 16th 2005 The LPG Shipping Market today The LPG freight market started to move
WEEKLY SHIPPING MARKET REPORT
 WEEKLY SHIPPING MARKET REPORT WEEK 42 (10 rd October to 16 th October 2015) Legal Disclaimer The information contained herein has been obtained by various sources. Although every effort has been made to
Weekly Market Insight Friday, 16th November 2018
 Weekly Market Insight Shortly before it collided with the 1000-point wall, Baltic Dry Index managed to hit the brakes, avoiding the crash on the last moment. Whilst the major threes of the dry bulk spectrum,
OPTIMA SHIPBROKERS LTD Sales & Purchase / Dry Cargo Chartering Tanker Chartering / Newbuildings
 OPTIMA - WEEKLY October 3rd, 2008 OPTIMA SHIPBROKERS LTD Sales & Purchase / Dry Cargo Chartering Tanker Chartering / Newbuildings BULK CARRIERS 'Marigold' 46,745tdw Blt 04/82 Korea, Krs M/E Sulzer Cr 3x20t,
This Week s Overview of Shipping Investments SECONDHAND / DEMOLITION / NEW BUILDING MARKET ANALYSIS
 This Week s Overview of Shipping Investments SECONDHAND / DEMOLITION / NEW BUILDING MARKET ANALYSIS Week Ending: 1 st November 2013 (Week 44, Report No: 44/13) (Given in good faith but without guarantee)
MONTHLY MARKET OVERVIEW
 MONTHLY MARKET OVERVIEW 1 st 31 st August 217 SUMMARY OF CONTENT Value analysis Second hand S&P activity Newbuilding activity Demolition activity Charter rate analysis BULKER VALUES THROUGH AUGUST 217
COSCO CORPORATION. (SINGAPORE) LTD FY2003 Full Year Results. Presentation
 LTD FY2003 Full Year Results. Presentation") COSCO CORPORATION (SINGAPORE) LTD FY2003 Full Year Results Presentation 11 February 2004 1 Outline of Presentation 1. Background & Corporate Restructuring Exercise 2. Operations Review 3. Financial Review
COSCO CORPORATION (SINGAPORE) LTD FY2003 Full Year Results Presentation 11 February 2004 1 Outline of Presentation 1. Background & Corporate Restructuring Exercise 2. Operations Review 3. Financial Review
This Week s Overview of Shipping Investments SECONDHAND / DEMOLITION / NEW BUILDING MARKET ANALYSIS
 This Week s Overview of Shipping Investments SECONDHAND / DEMOLITION / NEW BUILDING MARKET ANALYSIS Week Ending: 15 th November 2013 (Week 46, Report No: 46/13) (Given in good faith but without guarantee)
MONTHLY MARKET OVERVIEW
 MONTHLY MARKET OVERVIEW 1 st 28 th February 219 SUMMARY OF CONTENT Value analysis Total second hand S&P activity Newbuilding activity Demolition activity Charter rate analysis +44 () 23 26 5555 vesselsvalue.com
OPTIMA SHIPBROKERS LTD Sales & Purchase / Dry Cargo Chartering Tanker Chartering / Newbuildings
 OPTIMA SHIPBROKERS LTD Sales & Purchase / Dry Cargo Chartering Tanker Chartering / Newbuildings Monday 11th October, 21 Volume 326 Week 41 Sale & Purchase Activity Week 41 SECOND HAND SALES DRY TONNAGE
NILIMAR Ships Sale & Purchase MARKET REPORT WEEK 30 BASED ON SALES AND PURCHASES OF VESSELS WEEK ENDED FRIDAY 29 th JULY 2011.
 MARKET REPORT WEEK 30 BASED ON SALES AND PURCHASES OF VESSELS WEEK ENDED FRIDAY 29 th JULY 2011. The dry freight market continues to fall with the BCI losing another -5% w-o-w, the BPI -1.5%, the BSI -1%
NILIMAR Ships Sale & Purchase MARKET REPORT WEEK 34 BASED ON SALES AND PURCHASES OF VESSELS WEEK ENDED FRIDAY 26 th AUGUST 2011.
 MARKET REPORT WEEK 34 BASED ON SALES AND PURCHASES OF VESSELS WEEK ENDED FRIDAY 26 th AUGUST 2011. Whilst world financial markets continue to concern, and the gold price continues to rise (being seen as
WEEKLY SHIPPING MARKET REPORT WEEK 7
 WEEKLY SHIPPING MARKET REPORT WEEK 7 WEEK 7 (13 th February to 19 th February 2016) Market Overview Bulkers Chinese New Year celebrations ended affecting the BDI with just a small increase. It would be
AIR PASSENGER MARKET ANALYSIS
 Monthly RPK (Billions) Monthly FTK (Billions) Index of business confidence % change over year AIR PASSENGER MARKET ANALYSIS NOVEMBER 2013 KEY POINTS Air travel markets increased at a solid rate in November,
MONTHLY MARKET OVERVIEW
 MONTHLY MARKET OVERVIEW 1st 31st July 217 SUMMARY OF CONTENT Value analysis Second hand S&P activity Newbuilding activity Demolition activity Charter rate analysis info@ BULKER VALUES THROUGH JULY 217
This Week s Overview of Shipping Investments SECONDHAND / DEMOLITION / NEW BUILDING MARKET ANALYSIS
 This Week s Overview of Shipping Investments SECONDHAND / DEMOLITION / NEW BUILDING MARKET ANALYSIS Week Ending: 8 th November 2013 (Week 45, Report No: 4513) (Given in good faith but without guarantee)
Dry Bulk Insight. Prices and rates fall as suppliers fight. contents Summary 01
 Dry Bulk Insight Monthly Analysis of the Dry Bulk Market issue 61 april 9 Radarwatch The prolonged ore negotiations pulled the market down as rates declined despite increase in chartering volumes Bangladeshi
Baltic Exchange Indices Calculation methods and upcoming regulation International Maritime Statistics Forum April 2013
 Baltic Exchange Indices Calculation methods and upcoming regulation International Maritime Statistics Forum April 2013 Robin King Head of Marketing History 1700 1744 Virginia and Baltick Coffee House 1800
WEEKLY SHIPPING MARKET REPORT WEEK 25
 WEEKLY SHIPPING MARKET REPORT WEEK 25 WEEK 25 (17 th Jun to 24 th Jun 2016) Market Overview During this week BDI closed at 609 and returned back to levels of 2 weeks before, having an increase of 22 points
Final Results 31 December 2013
 Final Results 31 December 2013 Clarkson PLC 10 March 2014 www.clarksons.com Agenda Headline results Divisional performance Business Model & Strategy The market Outlook 10 March 2014 Final Results www.clarksons.com
Dry Bulk Insight. Market firm but volatile. Our view. contents Summary 01
 Dry Bulk Insight Monthly Analysis of the Dry Bulk ket issue 49 april 8 Radarwatch Farmers strike in Argentina hits Panamax and Handy rates in the Atlantic Australian miners and Chinese steelmakers still
WEEKLY SHIPPING MARKET REPORT WEEK 6
 WEEKLY SHIPPING MARKET REPORT WEEK 6 WEEK 6 (6 th February to 12 th February 2016) Market Overview Bulkers For one more week Dry Bulk market follow the negative trend of the last months. Situation has
Long Term Trends in Shipbuilding HVB Press Conference. 20 th September 2006 Stephen Gordon, Clarkson Research
 Long Term Trends in Shipbuilding HVB Press Conference 20 th September 2006 Stephen Gordon, Clarkson Research Introduction Background to Shipbuilding Investment The Current Orderbook The Product Mix Regional
OPTIMA SHIPBROKERS LTD Sales & Purchase / Dry Cargo Chartering Tanker Chartering / Newbuildings
 OPTIMA SHIPBROKERS LTD Sales & Purchase / Dry Cargo Chartering Tanker Chartering / Newbuildings Monday 14th March, 211 Volume 348 Week 11 Sale & Purchase Activity Week 11 SECOND HAND SALES DRY TONNAGE
Demand, Supply & Capacity in the Shipbuilding Industry
 Demand, Supply & Capacity in the Shipbuilding Industry million dwt Ship completions by region 120 100 80 60 Other Europe Japan Korea China "Europe" includes Russia SOURCE: IHS-Fairplay 40 20 42.3 0 0.4
OPTIMA SHIPBROKERS LTD Sales & Purchase / Dry Cargo Chartering Tanker Chartering / Newbuildings
 OPTIMA SHIPBROKERS LTD Sales & Purchase / Dry Cargo Chartering Tanker Chartering / Newbuildings Monday 2th June, 211 Volume 362 Week 25 Sale & Purchase Activity Week 25 SECOND HAND SALES DRY TONNAGE Type
Dry Bulk Insight. Some term comfort. Our view. contents Summary 01
 Dry Bulk Insight Monthly Analysis of the Dry Bulk Market issue 59 Radarwatch Argentina is facing worst drought in a decade thus curtailing its grain trade Pessimism continues to loom in newbuild market
WEEKLY SHIPPING MARKET REPORT WEEK 12
 WEEKLY SHIPPING MARKET REPORT WEEK 12 WEEK 12 (18 th March to 24 th March 2016) Market Overview Bulkers In the middle of grain season and in the begging of the catholic easter holidays,another week comes
Index of business confidence. Monthly FTK (Billions) Apr 2014 vs. Apr 2013 YTD 2014 vs. YTD 2013 Apr 2014 vs. Mar 2014
 Apr 2014 vs. Apr 2013 YTD 2014 vs. YTD 2013 Apr 2014 vs. Mar 2014") AIR PASSENGER MARKET ANALYSIS APRIL 2014 KEY POINTS Growth in air travel picked-up in April, rising 7.5% compared to a year ago. This is an acceleration on March, when revenue passenger kilometers increased
AIR PASSENGER MARKET ANALYSIS APRIL 2014 KEY POINTS Growth in air travel picked-up in April, rising 7.5% compared to a year ago. This is an acceleration on March, when revenue passenger kilometers increased
OPTIMA SHIPBROKERS LTD Sales & Purchase / Dry Cargo Chartering Tanker Chartering / Newbuildings
 OPTIMA - WEEKLY January 11th, 2008 WEEKLY REPORT OPTIMA SHIPBROKERS LTD Sales & Purchase / Dry Cargo Chartering Tanker Chartering / Newbuildings BULK CARRIERS 'Golden Sentosa' 170,500tdw Blt 08/08 Daehan,
Industry Update. ACI-NA Winter Board of Directors Meeting February 3, 2016 Orlando, FL
 Industry Update ACI-NA Winter Board of Directors Meeting February 3, 2016 Orlando, FL U.S. & Canadian GDP 8% 6% 4% U.S.* Canada** Estimate by BEA as of 02/11/16 2% 0% -2% -4% -6% -8% -10% The U.S. economy
PREMIUM TRAFFIC MONITOR MARCH 2009
 PREMIUM TRAFFIC MONITOR MARCH 2009 KEY POINTS The fall in passenger numbers slowed in March, to a decline of 9.3% following February s 9.6% fall. However, this slowdown was entirely due to February s fall
Petrofin Research Greek fleet statistics
 Petrofin Research 2 nd part of Petrofin Research : Greek fleet statistics In this 2 nd part of Petrofin research, the Greek Fleet Statistics, we analyse the composition of the Greek fleet, in terms of
«Να κάνουμε την κρίση ευκαιρία" Ανάλυση των αγορών Bulkers & Tankers
 «Να κάνουμε την κρίση ευκαιρία" Ανάλυση των αγορών Bulkers & Tankers Aδελφότης των Υδραίων Αθηνών 3ο Ναυτιλιακό Συνέδριο Σεπτέμβριος 2011 Section 1: Dry Bulkers Presentation Contents Dry Bulker fleet overview:
MARKET REPORT WEEK 09
 MARKET REPORT WEEK 09 BASED ON SALES AND PURCHASES OF VESSELS WEEK ENDED FRIDAY 4 th MARCH 2011 Whilst the BDI improved slightly in all sectors last week we suspect it is far from a being a definite /
Index of business confidence. Monthly FTK (Billions) May 2014 vs. May 2013 YTD 2014 vs. YTD 2013 May 2014 vs. Apr 2014
 May 2014 vs. May 2013 YTD 2014 vs. YTD 2013 May 2014 vs. Apr 2014") AIR PASSENGER MARKET ANALYSIS MAY 2014 KEY POINTS Air travel markets rose by a strong 6.2% in May compared to a year ago. Although this is slightly down on April growth of 7.6%, April was positively biased
AIR PASSENGER MARKET ANALYSIS MAY 2014 KEY POINTS Air travel markets rose by a strong 6.2% in May compared to a year ago. Although this is slightly down on April growth of 7.6%, April was positively biased
Monday, July 25, Week 30 The Week at a Glance
 Baltic Dry Indices* Last Fridays Closing Weekly Difference Monday, July 25, 211 - Week 3 The Week at a Glance Butterfly effect..." Officials of the Euro-zone have come into agreement to assist Greece with
Index of business confidence. Monthly FTK (Billions) Aug 2013 vs. Aug 2012 YTD 2013 vs. YTD 2012 Aug 2013 vs. Jul 2013
 Aug 2013 vs. Aug 2012 YTD 2013 vs. YTD 2012 Aug 2013 vs. Jul 2013") AIR PASSENGER MARKET ANALYSIS AUGUST 2013 KEY POINTS Air travel markets expanded strongly in August. Global revenue passenger kilometers were up 6.8% compared to a year ago, an improvement on July growth
AIR PASSENGER MARKET ANALYSIS AUGUST 2013 KEY POINTS Air travel markets expanded strongly in August. Global revenue passenger kilometers were up 6.8% compared to a year ago, an improvement on July growth
Monday, September 6, Week 36 The Week at a Glance
 Monday, September 6, 21 - Week 36 The Week at a Glance "Lesson learned? Guess not." Baltic Dry Indices* Last Fridays Closing Weekly Difference Baltic Dry Index 2876 164 Baltic Cape index 3937 488 Baltic
AIR PASSENGER MARKET ANALYSIS
 AIR PASSENGER MARKET ANALYSIS OCTOBER 2014 KEY POINTS Air travel volumes were up 5.7% in October year-on-year, slightly stronger than the September rise of 5.2%, and a continuation of the positive growth
AIR PASSENGER MARKET ANALYSIS MARCH 2015 KEY POINTS
 AIR PASSENGER MARKET ANALYSIS MARCH 2015 KEY POINTS Global air travel rose by a strong 7.4% in March compared to a year ago, an improvement on the February result of 6.4%. The acceleration in the year-on-year
WEEKLY SHIPPING MARKET REPORT WEEK 28
 WEEKLY SHIPPING MARKET REPORT WEEK 28 WEEK 28 (8 th Jul to 15 th Jul 2016) Market Overview During this week BDI, improved day by day, having a weekly closing at 745 points with an increase of 42 points
AIR TRANSPORT MARKET ANALYSIS APRIL 2011
 AIR TRANSPORT MARKET ANALYSIS APRIL 2011 KEY POINTS From this month we provide an assessment of global scheduled air transport markets, adding domestic to international, and including both IATA and non-iata
AIR TRANSPORT MARKET ANALYSIS MAY 2011
 AIR TRANSPORT MARKET ANALYSIS MAY 2011 KEY POINTS May saw a renewed expansion in both air travel and freight, after a soft patch during the previous three months. Air travel volumes were 6.8% higher than
OFFSHORE MONTHLY MARKET OVERVIEW
 OFFSHORE MONTHLY MARKET OVERVIEW 1 st 3 th November 17 SUMMARY OF CONTENT Value analysis Total second hand S&P activity Newbuilding activity Demolition activity +44 () 3 6 vesselsvalue.com OFFSHORE VALUES
MARKET REPORT WEEK 12
 MARKET REPORT WEEK 12 BASED ON SALES AND PURCHASES OF VESSELS WEEK ENDED FRIDAY 25 th MARCH 2011 The Baltic Freight Indices only moved within small bands w-o-w with the Capes being the biggest mover, reversing
MONTHLY MARKET OVERVIEW
 MONTHLY MARKET OVERVIEW 1 st 31 st July 218 SUMMARY OF CONTENT Value analysis Total second hand S&P activity Newbuilding activity Demolition activity Charter rate analysis BULKER VALUES THROUGH JULY 218
MARKET REPORT WEEK 39
 MARKET REPORT WEEK 39 BASED ON SALES AND PURCHASES OF VESSELS WEEK ENDED FRIDAY 1 ST OCTOBER 2010. The freight market made no really definitive moves last week whereby the BDI ended practically unchanged.
AIR PASSENGER MARKET ANALYSIS
 Monthly RPK (Billions) Monthly FTK (Billions) Index of business confidence % change over year AIR PASSENGER MARKET ANALYSIS APRIL 2013 KEY POINTS Global revenue passenger kilometers were up 3.2% in April
Panamax & Post-Pmx Market Outlook
 Panamax & Post-Pmx Market Outlook (an analysis of the fleet profile, trade prospects, and rates) Aug 2018 bancosta blue studies volume DRY 2018/#10 research www.bancosta.com ; research@bancosta.com Aug
NILIMAR Ships Sale & Purchase MARKET REPORT WEEK 38 BASED ON SALES AND PURCHASES OF VESSELS WEEK ENDED FRIDAY 23 rd SEPTEMBER 2011.
 MARKET REPORT WEEK 38 BASED ON SALES AND PURCHASES OF VESSELS WEEK ENDED FRIDAY 23 rd SEPTEMBER 2011. Further good volumes of Capesize fixing lifted the BCI another 6% w-o-w now making the average rate
S&P Market Trends during December: Secondhand Newbuilding Demolition
 This Week s Overview of Shipping Investments SECONDHAND / DEMOLITION / NEW BUILDING MARKET ANALYSIS Week Ending: 13 th December 2013 (Week 50, Report No: 50/13) (Given in good faith but without guarantee)
PREMIUM TRAFFIC MONITOR JANUARY 2013 KEY POINTS
 Premium Pax, Million Economy Pax, Million PREMIUM TRAFFIC MONITOR JANUARY 213 KEY POINTS Growth in premium travel slowed in January. The number of passengers traveling in premium seats on international
Monday, August 30, Week 35 The Week at a Glance
 Monday, August 3, 21 - Week 35 The Week at a Glance Hunting Season? Vacations season is almost over and decision makers are getting back in to their usual schedules. Let s see whether September will be
MARKET REPORT WEEK 05
 MARKET REPORT WEEK 05 BASED ON SALES AND PURCHASES OF VESSELS WEEK ENDED FRIDAY 4 th FEBRUARY 2011 Last week was a predictably quieter one on the shipping markets due to the Chinese New Year Holidays ushering
AIR PASSENGER MARKET ANALYSIS JANUARY 2015 KEY POINTS
 AIR PASSENGER MARKET ANALYSIS JANUARY 2015 KEY POINTS Global air travel was up 4.6% in January compared to a year ago, a slower start to the year when compared to the strong 5.8% expansion in 2014 overall.
WEEKLY MARKET REPORT July 16th, 2010 / Week 28
 LY MARKET REPORT July 16th, 21 / Week 28 All indices have continued their downward trend for another week, as the capesize rates continued their downward spiral. Very poor demand for iron ore has put pressure
The World s Largest Buyer of Ships and Offshore Assets
 The World s Largest Buyer of Ships and Offshore Assets 9 th Annual Marine Money London Ship Finance Forum, 24 January 218 Evan F. Sproviero, Head of Projects, GMS 1 A. Recycling Prices and Residual Values
The Outlook for the Residential Construction Industry Hunter and the Central Coast
 The Outlook for the Residential Construction Industry Hunter and the Central Coast Graham Wolfe HIA Chief Executive Industry Policy and Media HIA Industry Outlook Breakfast Newcastle February 2013 Backdrop:
18th November 2013 GMS Ship Recycling Conference - Tokyo 1
 18th November 2013 GMS Ship Recycling Conference - Tokyo 1 Agenda 1. Industry Facts 2. Ship recycling Boom and Corrections 3. Ship Recycling: Source of Recovery? 4. Changing Role of Cash Buyer 5. Closing
NILIMAR Ships Sale & Purchase
 MARKET REPORT WEEK 48 BASED ON SALES AND PURCHASES OF VESSELS WEEK ENDED FRIDAY 30 th November 2012. The BDI basically stood still for another week and although that result is brought about because officially
MARKET REPORT WEEK 45
 MARKET REPORT WEEK 45 BASED ON SALES AND PURCHASES OF VESSELS WEEK ENDED FRIDAY 12 th NOVEMBER 2010 At face value we have just endured another fairly dreary week in the shipping markets with the dry freight
WHEN IS THE NEXT SHIPPING BOOM?
 WHEN IS THE NEXT SHIPPING BOOM? By Ravi K Mehrotra CBE Executive Chairman Foresight Group, London Samunder Club April & May 2012 Houston and Florida, USA 1 WHEN IS THE NEXT SHIPPING BOOM? I am not a fortune
WEEKLY MARKET REPORT December 16th, 2011 / Week 50
 LY MARKET REPORT December 16th, 211 / Week 5 The market saw a correction this week on weaker demand for the capesize sector. After a positive end on Monday both the BDI and BCI fell for the remainder of
Weekly Market Report
 Week 46 Tuesday 17th November 29 Weekly Market Report Sale & Purchase Newbuilding Secondhand Demolition Chartering World Economy News Japan announced Monday its best economic growth in more than two years
MARKET REPORT WEEK 13
 MARKET REPORT WEEK 13 BASED ON SALES AND PURCHASES OF VESSELS WEEK ENDED FRIDAY 1 st APRIL 2011 Last week ended up a disappointment on the freight side with only the BHSI making any gain albeit less than
MARKET REPORT WEEK 27 BASED ON SALES AND PURCHASES OF VESSELS WEEK ENDED FRIDAY 9 th JULY 2010.
 MARKET REPORT WEEK 27 BASED ON SALES AND PURCHASES OF VESSELS WEEK ENDED FRIDAY 9 th JULY 2010. The BDI collectively and individually fell for a 6th straight week which means that between cob Fri 28th
Aviation Performance in NSW
 Aviation Performance in NSW 2015-16 November 2016 This report by Tourism Futures International for Destination New South Wales reviews the operating environment and aviation performance of Sydney and NSW
WEEKLY SHIPPING MARKET REPORT WEEK 2
 Advanced Shipping & Trading S.A 1 st Floor, 168 Vouliagmenis Avenue 16674 Glyfada, Greece Contact Details: Tel: +30 210 3003000 snp@advanced-ship.gr chartering@advanced-ship.gr finance@advanced-ship.gr
Tourism Snapshot. A focus on the markets in which the CTC and its partners are active. February 2015 Volume 11, Issue 2.
 Tourism Snapshot Tourism Whistler/Mike Crane A focus on the markets in which the CTC and its partners are active www.canada.travel/corporate February Volume 11, Issue 2 Key highlights The strong beginning
MONTHLY MARKET OVERVIEW
 MONTHLY MARKET OVERVIEW August SUMMARY OF CONTENT Value analysis Total second hand S&P activity Newbuilding activity Demolition activity Charter rate analysis info@ BULKER VALUES THROUGH AUGUST BULKERS
Ship Scrapping - Market Pressures. IMSF Oslo Foteini Kanellopoulou, Senior Analyst 23 May 2012
 Ship Scrapping - Market Pressures IMSF Oslo Foteini Kanellopoulou, Senior Analyst 23 May 212 Disclaimer The material and the information contained herein (together, the "Information") are provided by H.
AIR PASSENGER MARKET ANALYSIS
 Monthly RPK (Billions) Monthly FTK (Billions) Index of business confidence % change over year AIR PASSENGER MARKET ANALYSIS JANUARY 2014 KEY POINTS Air travel markets commenced 2014 with a strong increase
Airlines across the world connected a record number of cities this year, with more than 20,000 city pair connections*
 1 Airlines across the world connected a record number of cities this year, with more than 20,000 city pair connections*. This is a 1,351 increase over 2016 and a doubling of service since 1996, when there
Braemar Seascope. Market Indicator. TC E ( U S $ / D a y ) TC E ( U S $ / D a y ) TC E ( U S $ / D a y ) TC E ( U S $ / D a y )
 TC E ( U S $ / D a y ) TC E ( U S $ / D a y ) TC E ( U S $ / D a y )") Weekly Chartering Report Thursday, 2 January 211 Braemar Seascope ket Indicator Wet 19-Jan-11 Avg Avg YTD 21 Avg TC E ( U S $ / D a y ) TC E ( U S $ / D a y ) TC E ( U S $ / D a y ) TC E ( U S $ / D a
Weekly Chartering Report Thursday, 2 January 211 Braemar Seascope ket Indicator Wet 19-Jan-11 Avg Avg YTD 21 Avg TC E ( U S $ / D a y ) TC E ( U S $ / D a y ) TC E ( U S $ / D a y ) TC E ( U S $ / D a
VLCC Maths Weekly Tanker Market Report
 Jan Feb Mar Apr May Jun Jul Aug Sep Oct Nov Dec Jan Feb Mar Apr May Jun Jul Aug Sep Oct Nov Dec Jan Feb Mar Apr May Jun Jul Aug Latest Week 38 21 st September 2018 VLCC Maths Weekly Tanker Market Report
Index of business confidence. Monthly FTK (Billions) June 2012 vs. June 2011 YTD 2012 vs. YTD 2011 RPK ASK PLF FTK AFTK FLF RPK ASK PLF FTK AFTK FLF
 June 2012 vs. June 2011 YTD 2012 vs. YTD 2011 RPK ASK PLF FTK AFTK FLF RPK ASK PLF FTK AFTK FLF") Monthly RPK (Billions) Monthly FTK (Billions) Index of business confidence % change over year AIR TRANSPORT MARKET ANALYSIS JUNE 2012 KEY POINTS Air travel markets expanded in June, but the trend in passenger
Monthly RPK (Billions) Monthly FTK (Billions) Index of business confidence % change over year AIR TRANSPORT MARKET ANALYSIS JUNE 2012 KEY POINTS Air travel markets expanded in June, but the trend in passenger
Braemar Seascope. Market Indicator. TC E ( U S $ / D a y ) TC E ( U S $ / D a y ) TC E ( U S $ / D a y ) TC E ( U S $ / D a y )
 TC E ( U S $ / D a y ) TC E ( U S $ / D a y ) TC E ( U S $ / D a y )") Weekly Chartering Report Thursday, 3 ch 211 Braemar Seascope ket Indicator Wet 2--11 Avg Avg YTD 21 Avg TC E ( U S $ / D a y ) TC E ( U S $ / D a y ) TC E ( U S $ / D a y ) TC E ( U S $ / D a y ) 26, NHC
Weekly Chartering Report Thursday, 3 ch 211 Braemar Seascope ket Indicator Wet 2--11 Avg Avg YTD 21 Avg TC E ( U S $ / D a y ) TC E ( U S $ / D a y ) TC E ( U S $ / D a y ) TC E ( U S $ / D a y ) 26, NHC
I The shipping market contents ISL
 Comment - Charts and Tables concerning The Shipping Market World Merchant Fleet Tanker Market Bulk Carrier Market Tab. 1 Additions/Reductions by Ship Types 2014-2016 and up to June 2017... III Tab. 2 Size
WEEKLY SHIPPING MARKET REPORT
 WEEKLY SHIPPING MARKET REPORT WEEK 10 (28 th February to 6 th March 2015) Legal Disclaimer The information contained herein has been obtained by various sources. Although every effort has been made to
PREMIUM TRAFFIC MONITOR JANUARY 2014 KEY POINTS
 Premium Pax, Million Economy Pax, Million PREMIUM TRAFFIC MONITOR JANUARY 14 KEY POINTS The number of passengers traveling in premium seats on international markets expanded by a solid 6.1% in January
WEEKLY MARKET REPORT October 12th, 2012 / Week 41
 LY MARKET REPORT October 12th, 212 / Week 41 A huge increase in the panamax market with the BPI gaining just over 45% for the week. Panamax charter rates increased significantly as fixing was strengthened
Danish Shipping. Facts and Figures. June 2018
 Danish Shipping Facts and Figures June 2018 2 Table of Contents 1. Danish Shipping Industry 4 The Danish Merchant Fleet 4 Danish Shipping Exports 6 Employment 8 CEO Survey 10 2. Global Merchant Fleet 12