SCC Trouble Shooting for Farm Advisors Impact on Ontario Dairy Farms
|
|
|
- Morgan Wells
- 5 years ago
- Views:
Transcription

1 SCC Trouble Shooting for Farm Advisors Impact on Ontario Dairy Farms David Kelton, DVM, PhD Department of Population Medicine University of Guelph
2 SCC 400 Just Two Months Away! The goal is to maintain high milk quality ALL YEAR Tools to get there: Know where we are current situation Understand the importance cost of elevated SCC Finding the producers at risk variability and seasonality and tools to help Tools available for advisors Elevated SCC versus Elevated Iodine good news
3 : From 800 to 500 K Ontario Weighted Average Bulk Tank SCCs January 1988 to January Where are we NOW? SCCs x 10* SCC Penalty Program (the easy fix)
4 7 Inhibitor violations (cases/100 farms/year) 6 5 But- MORE Inhibitor violations! < > Schukken,

5 Decrease in Penalty Level If the SCC Penalty Level dropped from 500 to 400 TODAY.what would happen?
6 Penalty Threshold from 500 to Distribution of the Monthly Average Bulk Tank SCC for the Years May 2010 until April Percent ~9% of all bulk tanks Monthly Average Bulk Tank SCC
7 Penalty Threshold from 500 to 400 Weighted Monthly Averages
8 100 Percent of Herds by # of Months over SCC Threshold May April 2012 Percent Penalty Threshold from 500 to 400 SCC Threshold 500 SCC Threshold SCC Level 8%of herds with >1 month above threshold & at risk 400 SCC Level 26%of herds with >1 month above threshold & at risk herds with EVERY BTSCC over # of Months
9 Normal SCC s for Clean Cows FAQ: Can SCC s for Cows or Herds Get Too Low? Average SCC of Uninfected Cows Cell coun nt Heifers Parity 2 Parity 3 and greater Days in milk Schukken, 2011
10 3500 Normal SCC s for Clean Cows FAQ: Can SCC s for Cows or Herds Get Too Low? Daily SCC Data cell/ml) /01/ /01/ /01/ /01/ /01/ /01/ /01/ /01/ /01/ /01/ /01/ /02/ /02/ /02/ /02/ /02/ /02/ /02/ /02/ /02/ /03/ /03/ /03/ /03/ /03/ /03/ /03/ /03/ /03/ /03/ /03/ /04/ /04/ /04/ /04/ /04/ /04/ /04/ /04/ /04/ /04/ /05/ /05/1900 SCC (*1000 Jan 1 Feb 1 Mar 1 Apr 1 May 1
11 Milk Loss Due to Elevated SCC


12 Milk Loss Due to Elevated SCC FAQ: What is the cost of elevated SCC? LINEAR SCORE Raubertas& Shook, JDS, 1982.


13 Milk Loss Due to Elevated SCC Shook- Lactation 1 Hand, Godkin, Kelton- Lactation 1 Shook- Lactation 3+ Hand, Godkin, Kelton- Lactation 3+
14 Milk Loss Due to Elevated SCC Key Differences: 1-Greater impact than 30 years ago 2-Greater impact on 1 st lactation 3-Greater impact with more high tests 4-Greater impact on higher producers
15 Is BTSCC Herd Size Dependent? FAQ: How do we find the problem herds? NO!!!!!!
16 Variability in Daily Bulk Tank SCC s Finding Producers At Risk? All Producers Got This Graph in December and June!
17 Variability in Daily Bulk Tank SCC s FAQ: How variable can BTSCC s be? Bulk Tank SCC BTSCC Average = Bulk Tank SCC June July August Septem ber 2010 October Novem ber
18 Variability in Daily Bulk Tank SCC s Bulk Tank SCC BTSCC Average = 100 BTSCC Average = Bulk Tank SCC June July August Septe mber 2010 Octobe r Novem ber
19 Variability in Daily Bulk Tank SCC s Bulk Tank SCC BTSCC Average = 100 BTSCC Average = 250 BTSCC Average = Bulk Tank SCC June July August Septe mber 2010 Octobe r Novem ber
20 Variability in Daily Bulk Tank SCC s 900 Bulk Tank SCC for Herd with Average of FAQ: Does herd size affect variability? ~200 cow herd 600 Bulk Tank SCC AP MR FE JA2012 DE2011 NO OC SE AU JL JN MA AP MR FE JA2011 DE2010 NO OC SE AU JL JN2010
21 Variability in Daily Bulk Tank SCC s Bulk Tank SCC for Herd with Average of 250 Fewer cows more variability bigger impact of one cow ~40 cow herd 600 SCC Bulk Tank AP MR FE JA2012 DE2011 NO OC SE AU JL JN MA AP MR FE JA2011 DE2010 NO OC SE AU JL JN2010
22 Risk of Penalty with Change in SCC Penalty Level FAQ: How many more penalties do we expect? Expected change in penalties assessed: Monthly BTSCC data from 1 st 11 months in 2009 & SCC Penalties in 2009 & 345 SCC Penalties in 2010 Compared odds of being penalized if the SCC penalty level was 400 as compared to 500 Results: Ontario dairy herds were 3.8 times as likely to incur a SCC Penalty at the 400 level. So.expect ~ 1,300 SCC penalties if nothing else changes
23 Penalty Threshold or Environment? FAQ: Is this just a summer problem..a seasonal issue? Average Bulk Tank SCC in Oxford and Perth Counties and Average Daily Temperature ( º C, London Airport) SCC Average Temperature Average Average SCC Average Daily Temperature ( º C) Year-Month
24 Low SCC in Hot Summer Months Distribution of Monthly Bulk Tank SCC March and August 2011 Mar % of herdsbelow 200 in March Percent Monthly Bulk Tank SCC
25 Low SCC in Hot Summer Months Distribution of Monthly Bulk Tank SCC March and August 2011 Aug-11 Mar-11 Percent % of herdsbelow 200 in March % of herds below 200 in August 2011 We have some herds which stay below 200,000 ALL YEAR! Monthly Bulk Tank SCC
26 Low SCC in Hot Summer Months FAQ: Does location matter? We have some herds which stay below 200,000 ALL YEAR!

27 Good News & Bad News! FAQ: Are producers responding? Penalties!!!

28 Monitoring of Cow SCC -DHI Does monitoring cow SCC impact SCC penalties? 2009 Data for 2,898 DHI herds and 1,186 non-dhi herds 48,250 monthly bulk tank average SCC values Bulk Tank SCC penalty levels of 400 and 500 FAQ: What tools do we have to help? Controlled for season, milk, fat and protein shipped Median BTSCC for DHI herds was 228,000 Median BTSCC for non-dhi herds was 250,000 Non-DHI herds had higher BTSCC s and were 1.4 times as likely to be penalized at the 400 SCC penalty threshold as DHI herds


29 DHI Resources Monthly Individual Cow SCC Mastitis3 PCR Test Melanie Quist Moyer CanWest DHI, Guelph, Ontario Dairy Comp 305 Computerized records system Used to trouble-shoot SCC problems


30 Monitoring of Cow SCC - DHI
31 PCR test..identifies DNA Identifies 3 contagious pathogens Staph. aureus Strep. agalactiae Mycoplasma bovis Uses DHI test day milk sample Convenient and easy ~ $23/sample ONLY THESE BUGS!!


32 Commercial Application! Original Laboratory Application!

33 Mastitis 3 PCR Assay Questions and Answers
34 Feb 2009 to May 1, 2011: The CanWest DHI Experience 11,246Mast 3 PCR tests in Ontario 2,897 Staph aureus Positive 25.7% 83 Strep ag Positive Only 17 Mycoplasma bovis Positive


35 Monitoring of Cow SCC Dairy Comp Top List DC305 Udder Health Commands David Kelton, YnteSchukken& Melanie Quist-Moyer
36 Why aren t they the same? DHI Herd Average SCC vs. DFO Bulk Tank SCC
37 SCC Test Differences (DFO-DHI) Same Test Day and DFO 1 Day Post DHI (Jan00-Mar00) Freq quency /-100 on any given day! Why the Difference? mean = cows std in dev tank = cows 5% on = -113 test 95% = milking out of 4 -etc. etc. etc SCC Differences (DFO-DHI)
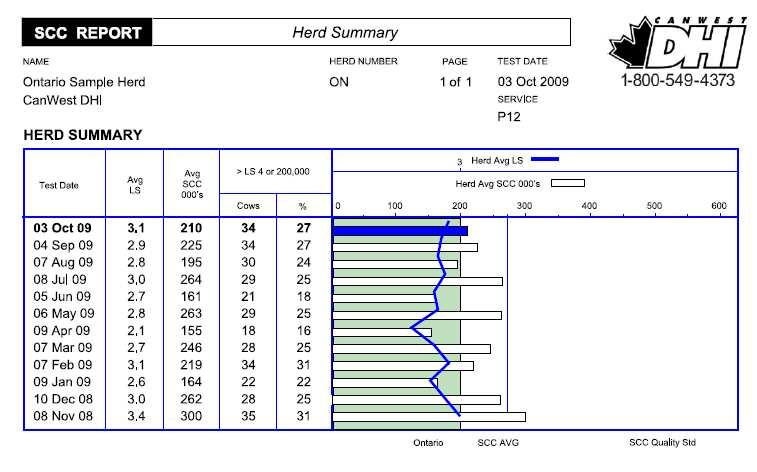
38 Benchmarks New Infections Herd Summary SCC Benchmarks for Ontario Herds Schukken Ontario BEST OK Not OK Q1 -W Q1 -S Q2 -W Q2 -S Q3 -W Q3 -S Q4 -W Q4 -S <5% 8% >8% 5% 7% 8% 10% 11% 13% 14% 16% Chronic <5% 10% >10% 7% 9% 12% 14% 15% 17% 21% 24% Infections High Fresh <10% 15% >15% 13% 18% 20% 23% 27% 30% 35% 38% Q = Quartile (Q1 are BEST 25% of herds based on Herd Average SCC in that month) W = Winter (March, 2012) S = Summer (August, 2011)
39 Beyond SCC Clinical? What bug(s)? Daily SCC Data 2011 Cow # Do we care if clinical or which bug? Do we care if clinical or which bug? SCC (*1000 cell/ml) /01/ /01/ /01/ /01/ /01/ /01/ /01/ /01/ /01/ /01/ /01/ /02/ /02/ /02/ /02/ /02/ /02/ /02/ /02/ /02/ /03/ /03/ /03/ /03/ /03/ /03/ /03/ /03/ /03/ /03/ /03/ /04/ /04/ /04/ /04/ /04/ /04/ /04/ /04/ /04/ /04/1900 Jan 1 Feb 1 Mar 1 Apr 1 May 1
40 CanWest- Health Data Collection Source (Jan December 2010) for 8 major diseases 41% 59% DHI Staff Producer Software Who enters Mastitis Events? Health Data Collection By Agency (Jan Dec 2010) 8 Major Diseases Observations Valacta CanWest 0 CO DA KET LAME MAST METR MF RP Health Event


41 Milk Loss Due to Elevated SCC See June Milk Producer. Spilt Milk by SSG
42 On-farm Risk Assessment
43 Iodine Levels in Milk FAQ: Is iodine a bad thing? Three year DFC project Health Canada upper limit is 500 PPM Year 1 sampling completed late Jan Results provided early Jan Objective is to have all tanks below 500 micrograms/litre Percentiles 10% 25% 50% 75% 90% 95% 99% Canada Ontario Most commonly implicated factors for elevated iodine: 1. Pre- and post-milking teat dip use 2. Ration components / supplements
44 Iodine Test Results Iodine Test Results - Initial Sampling - Ontario 2011 Total # of % of Samples Samples Normal Elevated High All Producers % % % Milking System Pipeline % % % Parlour % % % Buckets & Other % % % Robots % % % Niche Market DHA % % 4 7.7%
45 SCC versus Iodine Iodine and SCC SCC Iodine

 Feeding practices (feed components & amounts fed) Iodine containing")

46 Why Elevated Iodine? Herds Visited & Data Collected: Milkingpractices General herd characteristics (ie: herd size, barn type..) Feeding practices (feed components & amounts fed) Iodine containing products Volumeof iodine pre and post dips used at one milking Pre and post dip teat coverageon the teat Pre-dip residue on teats before milking machine applied Iodinemeasured in bulk tank milk and feed samples collected at visit
47 Why Elevated Iodine? K. MacDonald, G. Keefe, D. Kelton, 2012
48 Why Elevated Iodine? Iodine teat dips ONLY increased BTM iodine when they were: Pre-dip NOT properly removed Applied to more than just the teat skin (onto the Applied to more than just the teat skin (onto the base of the udder)
49 Things to think about as we Count Down. BT SCC has flat-lined since 1995.so time for action! Change from 500 to 400 SCC penalty level could result in up to a 4x increase in # of penalties if NOTHING is done! Talk to producers and find out who is at risk ask! Lots of great tools available..try the Risk Assessment! Be proactive..be part of the TEAM..be the solution! START NOW -NOT AN EASY FIX!!!
50 Acknowledgements and Questions
January 2018 Air Traffic Activity Summary
 January 2018 Air Traffic Activity Summary Jan-2018 Jan-2017 CY-2018 CY-2017 Passengers 528,947 505,421 4.7% 528,947 505,421 4.7% Passengers 537,332 515,787 4.2% 537,332 515,787 4.2% Passengers 1,066,279
PERFORMANCE MEASURE INFORMATION SHEET #16
 PERFORMANCE MEASURE INFORMATION SHEET #16 ARROW LAKES RESERVOIR: RECREATION Objective / Location Recreation/Arrow Lakes Reservoir Performance Measure Access Days Units Description MSIC 1) # Access Days
Information on epidemiological situation and control measures regarding Classical Swine Fever in wild boar in Hungary
 Information on epidemiological situation and control measures regarding Classical Swine Fever in wild boar in Hungary Animal Health and Animal Welfare Directorate Central Agricultural Office, Hungary 2-3
ATM Network Performance Report
 ATM Network Performance Report 2018. Page 1 of 16 Table of contents Summary... 3 Network Wide Performance... 4 Airborne delay... 4 Sydney... 6 Airborne delay... 6 Notable events... 6 Melbourne... 9 Airborne
U.S. DOMESTIC INDUSTRY OVERVIEW FOR MARCH
 Inter-Office Memo Reno-Tahoe Airport Authority Date: April 30, 2009 To: Statistics Recipients From: Krys T. Bart, A.A.E., President/CEO Subject: RENO-TAHOE INTERNATIONAL AIRPORT PASSENGER STATISTICS U.S.
Road Map. Casey J. Wichman Environmental Finance Center School of Government UNC-Chapel Hill. Motivation Contributions Data Econometric Model
 HETEROGENEITY IN HOUSEHOLD RESPONSE TO NON- PRICE WATER CONSERVATION POLICIES: EVIDENCE FROM PANEL MICRO DATA Casey J. Wichman Environmental Finance Center School of Government UNC-Chapel Hill Laura O.
DTTAS Quarterly Aviation Statistics Snapshot Quarter Report
 Contents DTTAS Quarterly Aviation Statistics Snapshot Quarter 3 2018 Report 1.1 Dublin Airport Key Statistics... 1 1.2 Cork Airport Key Statistics... 3 1.3 Shannon Airport Key Statistics... 5 1.4 Total
Outbreak of Escherichia coli O157. Connecticut, Quyen Phan, MPH Connecticut Department of Public Health
 Outbreak of Escherichia coli O157 Associated with Raw Milk, Connecticut, 2008 Quyen Phan, MPH Connecticut Department of Public Health Epidemiology and Emerging Infections Program 2009 OutbreakNet Annual
Considerations for the Long-Term Atmospheric Observing Network
 Considerations for the Long-Term Atmospheric Observing Network 1. Land Cover / Land Use & Change 2. Spatial & temporal scale of climate anomalies 3. Climatological wind patterns 4. Expected signals vs.
DTTAS Quarterly Aviation Statistics Snapshot Quarter Report
 Contents DTTAS Quarterly Aviation Statistics Snapshot Quarter 1 2018 Report 1.1 Dublin Airport Key Statistics... 1 1.2 Cork Airport Key Statistics... 3 1.3 Shannon Airport Key Statistics... 5 1.4 Total
Pathogens and Grazing Livestock
 Pathogens and Grazing Livestock Steve Ensley DVM, PhD 10/16/09 Water Borne Pathogens This presentation will have a specific emphasis on water borne pathogens. NUMBERS OF IOWA WATER SOURCES WITH Stream/River
DTTAS Quarterly Aviation Statistics Snapshot Quarter Report
 Contents DTTAS Quarterly Aviation Statistics Snapshot Quarter 4 2015 Report 1.1 Dublin Airport Key Statistics... 1 1.2 Cork Airport Key Statistics... 3 1.3 Shannon Airport Key Statistics... 5 1.4 Total
With the completion of this project, we would like to follow-up on the projections as well as highlight a few other items:
 TO: FROM: Mayor and Council Interim City Manager Rebecca Underhill, Director of Finance DATE: February 28, 2014 SUBJECT: Water Meter Project Analysis On March 28, 2012, Acting City Manager Mike Loftin
Manual vs. Automatic Operation and Operational Restrictions
 Customer Services, Operations, and Safety Committee Board Information Item IV-B March 11, 2010 Manual vs. Automatic Operation and Operational Restrictions Page 81 of 91 Washington Metropolitan Area Transit
August 2014 Passenger and Cargo Traffic Statistics Reno-Tahoe International Airport
 August 2014 Passenger and Cargo Traffic Statistics Reno-Tahoe International Airport October 8, 2014 U.S. DOMESTIC INDUSTRY OVERVIEW FOR AUGUST 2014 All RNO Carriers Domestic Systemwide year over year comparison
May 2011 Passenger and Cargo Traffic Statistics Reno-Tahoe International Airport
 May 2011 Passenger and Cargo Traffic Statistics Reno-Tahoe International Airport July 5, 2011 U.S. DOMESTIC INDUSTRY OVERVIEW FOR MAY 2011 All RNO Carriers Systemwide year over year comparison Average
Visit Loudoun 2016 Lodging Market Research
 2016 Lodging Market Research Prepared for: Loudoun County Lodging Market Research & Analysis Study Conducted: November December 2016 Final Report Submitted: December 2016 2016 Lodging Market Analysis Summary
Monthly Airport Passenger Activity Summary. December 2011
 T F Green Airport 01/17/12 Monthly Airport Passenger Activity Summary December 2011 Calendar Year Basis Year Year December December Percent to Date to Date Percent 2011 2010 Change 2011 2010 Change Enplaned
Weekly Performance Update
 Pr. Rupert Vancouver Grain Monitoring Program Weekly Performance Update February 19, 19 For Grain (18-19 CY) Summary 1. Stocks in Store (' tonnes) Country Elevators % of Working T his Week Last Week Var.
U.S. DOMESTIC INDUSTRY OVERVIEW FOR OCTOBER 2010 All RNO Carriers Systemwide year over year comparison
 Inter-Office Memo Reno-Tahoe Airport Authority Date: November 22, 2010 To: Chairman and Board of Trustees From: Krys T. Bart, A.A.E., President/CEO Subject: RENO-TAHOE INTERNATIONAL AIRPORT OCTOBER 2010
March 2014 Passenger and Cargo Traffic Statistics Reno-Tahoe International Airport
 March 2014 Passenger and Cargo Traffic Statistics Reno-Tahoe International Airport April 25, 2014 U.S. DOMESTIC INDUSTRY OVERVIEW FOR MARCH 2014 All RNO Carriers Domestic Systemwide year over year comparison
Lessons Learned from Army Interoperability Certification Testing
 Lessons Learned from Army Interoperability Certification Testing Robert Boerjan CTSF Capability Set Coordinator, CTSF (24) 4-1888 (24) 32-8321 x279 RDCS Technology, INC robert.boerjan@us.army.mil Analysis
Cost-effectiveness assessment of a Human Milk Bank
 Cost-effectiveness assessment of a Human Milk Bank Israel Macedo, MD Human Milk Bank - Pediatric Department Maternity Dr Alfredo da Costa, CHLC - Lisbon Rising health care costs 1st Int. Congress EMBA
The Residential Outlook for South Australia
 The Residential Outlook for South Australia Matthew King Economist HOUSING INDUSTRY ASSOCIATION February 2011 Overview Economic backdrop Other important matters Interest rates & bank lending Renovations
Ladera Ranch Condos - small
 Joe Richter 949 677-7722 JoeR@HanoverRealtyGroup.com California DRE 174415 Oregon REA 21893 CA CSLB 4157 & 861135 Condos and Townhomes 11 to 18 sf LISTINGS: 219 Period: Data Date: 4/2/219 Compares 219
Monthly Airport Passenger Activity Summary. December 2010
 T F Green Airport 01/13/11 Monthly Airport Passenger Activity Summary December 2010 Calendar Year Basis Year Year December December Percent to Date to Date Percent 2010 2009 Change 2010 2009 Change Enplaned
PRIMARY EDUCATION PACK PROBLEM SOLVING
 PRIMARY EDUCATION PACK www.titanclydebank.com Titan Problem Solving 1 The above picture represents a section of the Titan Crane. In constructing this section the materials listed below were used: 2 beams
Technical Report. Aircraft Overflight and Noise Analysis. Brisbane, California. December Prepared by:
 Aircraft Noise Abatement Office Technical Report Aircraft Overflight and Noise Analysis Brisbane, California Prepared by: P.O. Box 8097 San Francisco, California 94128 (650) 821-5100 Introduction In response
Sampling for Microbial Analysis
 Sampling for Microbial Analysis Linda J. Harris, Ph.D. Department of Food Science and Technology ljharris@ucdavis.edu Microbial Testing One of the most apparent but poorly understood parts of food microbiology
BUSINESS BAROMETER December 2018
 Credit: Chris Orange BUSINESS BAROMETER December Credit: Nigel Moore 1 Contents Summary of findings 3 Annual monthly performance: visitor attractions..4 Visit Herts Team update 5 National context.8 Visitor
Monthly Airport Passenger Activity Summary. December 2007
 T F Green Airport 06/23/08 Monthly Airport Passenger Activity Summary December 2007 Calendar Year Basis Year Year December December Percent to Date to Date Percent 2007 2006 Change 2007 2006 Change Enplaned
AUGUST 2008 MONTHLY PASSENGER AND CARGO STATISTICS
 Inter-Office Memo Reno-Tahoe Airport Authority Date: October 2, 2008 To: Statistics Recipients From: Tom Medland, Director Air Service Business Development Subject: RENO-TAHOE INTERNATIONAL AIRPORT PASSENGER
Monthly Airport Passenger Activity Summary. March2017
 T F Green Airport 04/17/17 Monthly Airport Passenger Activity Summary March2017 Calendar Year Basis Year Year March March Percent to Date to Date Percent 2017 2016 Change 2017 2016 Change Enplaned 152,513
Monthly Airport Passenger Activity Summary. February 2017
 T F Green Airport 03/24/17 Monthly Airport Passenger Activity Summary February 2017 Calendar Year Basis Year Year Febuary Febuary Percent to Date to Date Percent 2017 2016 Change 2017 2016 Change Enplaned
Calendar Year Basis Year Year August August Percent to Date to Date Percent Change Change
 T F Green Airport Monthly Airport Passenger Activity Summary August 2018 Calendar Year Basis Year Year August August Percent to Date to Date Percent 2018 2017 Change 2018 2017 Change Total Enplaned 202,148
I T N E T R E N R A N T A I T ON O AL A L A R A R R I R VA V L A S L S A N A D N D D E D PA
 INTERNATIONAL ARRIVALS AND DEPARTURES July 2015 Government of Tonga SD18M-36 Statistical Bulletin Month of Change from Change from July 2015 Number previous month previous year All Arrivals 8,252-28.0
Table of Contents PAGE
 April 2015 EL PASO INTERNATIONAL AIRPORT MONTHLY ACTIVITY REPORT April 2015 Table of Contents PAGE AIRPORT ACTIVITY OVERVIEW 1 NONSTOP DESTINATION ANALYSIS 2 MAP OF NONSTOP DESTINATIONS 3 FLIGHT SCHEDULE
Visit Wales Research Update
 Visit Wales Research Update 19 January 21 This update summarises tourism performance by drawing upon Visit Wales own research and information from other relevant sources. It is based upon information available
Monthly Airport Passenger Activity Summary. May 2017
 T F Green Airport Monthly Airport Passenger Activity Summary May 2017 Calendar Year Basis Year Year May May Percent to Date to Date Percent 2017 2016 Change 2017 2016 Change Enplaned 158,331 158,270 0.04%
January 2014 Passenger and Cargo Traffic Statistics Reno-Tahoe International Airport
 January 2014 Passenger and Cargo Traffic Statistics Reno-Tahoe International Airport March 12, 2014 U.S. DOMESTIC INDUSTRY OVERVIEW FOR DECEMBER 2013 All RNO Carriers Domestic Systemwide year over year
Weekly Performance Update
 Pr. Rupert Vancouver Grain Monitoring Program Weekly Performance Update January, 19 For Grain (1-19 CY) Summary 1. Stocks in Store (' tonnes) Country Elevators % of Working T his Week Last Week Var. fro
July 2012 Passenger and Cargo Traffic Statistics Reno-Tahoe International Airport
 July 2012 Passenger and Cargo Traffic Statistics Reno-Tahoe International Airport August 31, 2012 U.S. DOMESTIC INDUSTRY OVERVIEW FOR JULY 2012 All RNO Carriers Systemwide year over year comparison Average
Calendar Year Basis Year Year May May Percent to Date to Date Percent Change Change
 T F Green Airport Monthly Airport Passenger Activity Summary May 2018 Calendar Year Basis Year Year May May Percent to Date to Date Percent 2018 2017 Change 2018 2017 Change Total Enplaned 192,063 158,331
Table of Contents PAGE
 FEBRUARY 2018 EL PASO INTERNATIONAL AIRPORT MONTHLY ACTIVITY REPORT February 2018 Table of Contents PAGE AIRPORT ACTIVITY OVERVIEW 1 NONSTOP DESTINATION ANALYSIS 2 MAP OF NONSTOP DESTINATIONS 3 FLIGHT
Weekly Performance Update
 Pr. Rupert Vancouver Grain Monitoring Program Weekly Performance Update January, 19 For (1-19 CY) Summary 1. Stocks in Store (' tonnes) Country Elevators % of Working T his Week Last Week Var. fro m Last
December 2012 Passenger and Cargo Traffic Statistics Reno-Tahoe International Airport
 December 2012 Passenger and Cargo Traffic Statistics Reno-Tahoe International Airport January 29, 2013 U.S. DOMESTIC INDUSTRY OVERVIEW FOR DECEMBER 2012 All RNO Carriers Systemwide year over year comparison
AVIATION STATISTICS. Airline On Time Performance 2008 OTP 69
 AVIATION STATISTICS Airline Performance 2008 OTP 69 Commonwealth of Australia 2009 ISSN 1832 0759 This work is copyright and the data contained in this publication should not be reproduced or used in any
Queenstown Airport International Passenger Profile Update
 Queenstown Airport International Passenger Profile Update 12 months to 31 y 1 tember This report, based on data from Statistics NZ, shows the profile of passengers arriving or departing on TransTasman
TripAdvisor Workshop Christchurch 7 June 2016
 TripAdvisor Workshop Christchurch 7 June 2016 TripAdvisor: The World s Largest Travel Site 1 M I L L I O N Reviews & Opinions 3402005 MILLION 2000 Unique visitors a month M I L L I O N 350 r e vie w s
Reno-Tahoe Airport Authority U.S. DOMESTIC INDUSTRY OVERVIEW FOR FEBRUARY
 Inter-Office Memo Reno-Tahoe Airport Authority Date: March 30, 2009 To: Statistics Recipients From: Krys T. Bart, A.A.E., President/CEO Subject: RENO-TAHOE INTERNATIONAL AIRPORT PASSENGER STATISTICS U.S.
Board Box. October Item # Item Staff Page 1. Key Performance Indicators Sep 2018 M. Mungia Financial Report Aug 2018 H.
 Board Box October 2018 Item # Item Staff Page 1. Key Performance Indicators Sep 2018 M. Mungia 2-10 2. Financial Report Aug 2018 H. Rodriguez 11-15 ITEM 1 October 31, 2018 TO: FROM: RE: BOARD OF DIRECTORS
Grain Monitoring Program
 Pr. Rupert Vancouver Grain Monitoring Program Weekly Performance Update.November, 1 For 1 (1-19 CY) Summary 1. Stocks in Store (' tonnes) Country Elevators % of Working T his Week Last Week Var. fro m
Figure 1. Overview map of Burrard Inlet, showing location of False Creek inlet.
 Figure 1. Overview map of Burrard Inlet, showing location of False Creek inlet. 65 Figure 2. Location map of False Creek and shoreline and mid-channel monitoring sites. 66 Figure 3. Location of CSO's,
Sunshine Coast Residential Market
 Sunshine Coast Residential Market Warwick Temby HIA Executive Director, QLD HOUSING INDUSTRY ASSOCIATION April 2010 Overview Look at international, national and local events that are shaping the outlook
DOWNTOWN, CHARLOTTE AMALIE
 TOTAL VISITOR ARRIVALS TO THE USVI : DECEMBER YEAR TO DATE DECEMBER TOTAL VISITOR ARRIVALS 2,85, 2,8, 2,814,257 2,75, 2,7, 2,65, 2,6, 2,642,118 2,71,542 2,648,5 2,55, 212 213 214 215 Visitor arrivals ended
2017/ Q1 Performance Measures Report
 2017/2018 - Q1 Performance Measures Report Contents Ridership & Revenue... 1 Historical Revenue & Ridership... 1 Revenue Actual vs. Planned... 3 Mean Distance Between Failures... 5 Maintenance Cost Quarter
Informal Cross Border Food Trade in Southern Africa
 Informal Cross Border Food Trade in Southern Africa Issue 6 November 6 Monthly Highlights: Overall informal trade in maize, rice and beans lower this season than past two seasons. Zambia s informal exports
Consumer Price Index. January Contact Statistician: Phaladi Labobedi Fax: January 2018 CPI 1
 Consumer Price Index January 2018 Contact Statistician: Phaladi Labobedi Email: +267 3671300 Fax: 3952201 January 2018 CPI 1 Published by STATISTICS BOTSWANA Private Bag 0024, Gaborone Tel: 3671300 Fax:
Airport Capacity, Airport Delay, and Airline Service Supply: The Case of DFW
 Airport Capacity, Airport Delay, and Airline Service Supply: The Case of DFW Faculty and Staff: D. Gillen, M. Hansen, A. Kanafani, J. Tsao Visiting Scholar: G. Nero and Students: S. A. Huang and W. Wei
Airspace Complexity Measurement: An Air Traffic Control Simulation Analysis
 Airspace Complexity Measurement: An Air Traffic Control Simulation Analysis Parimal Kopardekar NASA Ames Research Center Albert Schwartz, Sherri Magyarits, and Jessica Rhodes FAA William J. Hughes Technical
Monthly Airport Passenger Activity Summary. Jun 2017
 T F Green Airport Monthly Airport Passenger Activity Summary Jun 2017 Calendar Year Basis Year Year Jun Jun Percent to Date to Date Percent 2017 2016 Change 2017 2016 Change Enplaned 161,324 156,458 3.11%
Monthly Airport Passenger Activity Summary
 T F Green Airport Monthly Airport Passenger Activity Summary January 2018 Calendar Year Basis Year Year Jan Jan Percent to Date to Date Percent 2018 2017 Change 2018 2017 Change Total Enplaned 148,452
Calendar Year Basis Year Year Apr Apr Percent to Date to Date Percent Change Change
 T F Green Airport Monthly Airport Passenger Activity Summary April 2018 Calendar Year Basis Year Year Apr Apr Percent to Date to Date Percent 2018 2017 Change 2018 2017 Change Total Enplaned 194,510 157,788
Performance Measures Year End Updated-
 Performance Measures Year End 2017 -Updated- Priorities and Objectives 1. Earn and Retain the Community s Trust 2. Provide Excellent Customer Service 3. Enable Organizational Success 4. Exemplify Financial
Consumer Price Index (CPI) March Consumer Price Index. March Contact Statistician: Phaladi Labobedi
 March Consumer Price Index. March Contact Statistician: Phaladi Labobedi") Consumer Price Index (CPI) March 2018 Consumer Price Index March 2018 Contact Statistician: Phaladi Labobedi Email: +267 3671300 March 2018 CPI 1 Published by STATISTICS BOTSWANA Private Bag 0024, Gaborone
Consumer Price Index (CPI) March 2018 Consumer Price Index March 2018 Contact Statistician: Phaladi Labobedi Email: +267 3671300 March 2018 CPI 1 Published by STATISTICS BOTSWANA Private Bag 0024, Gaborone
Table of Contents PAGE
 DECEMBER 2018 EL PASO INTERNATIONAL AIRPORT MONTHLY ACTIVITY REPORT December 2018 Table of Contents PAGE AIRPORT ACTIVITY OVERVIEW 1 NONSTOP DESTINATION ANALYSIS 2 MAP OF NONSTOP DESTINATIONS 3 FLIGHT
AVIATION STATISTICS. Airline On Time Performance. March 2009 OTP 72
 AVIATION STATISTICS Airline Performance March 2009 OTP 72 Commonwealth of Australia 2009 ISSN 1832 0759 This work is copyright and the data contained in this publication should not be reproduced or used
AVIATION STATISTICS. Airline On Time Performance. September 2009 OTP 79
 AVIATION STATISTICS Airline Performance September 2009 OTP 79 Commonwealth of Australia 2009 ISSN 1832 0759 This work is copyright and the data contained in this publication should not be reproduced or
February Contact Statistician: Phaladi Labobedi. Tel: Fax:
 February 2018 Copyright 2018 @ Contact Statistician: Phaladi Labobedi Tel: 367 1300 Fax: 395 2201 1. CONSUMER PRICE INDEX February Statistics 2018 Botswana. Private Bag 0024 Gaborone Botswana Tel: (+267)
ST. EUSTATIUS. Sea Arrivals II ( Summer ( Winter Yacht Arrivals I 12, % 32.5%
 ST. EUSTATIUS Visitor Arrival Summary Tourist Arrivals (excluding Antilleans) to St. Eustatius increased by 2.5 percent to reach a total of 12.0 thousand in 2009. Holland continues to be the most important
AVSP 7 Summer Section 1: Executive Summary
 AVSP 7 Summer 2016 Section 1: Executive Summary Introduction AVSP Overview The Alaska Visitor Statistics Program (AVSP) is a statewide visitor study periodically commissioned by the Alaska Department of
Table of Contents PAGE
 NOVEMBER 2018 EL PASO INTERNATIONAL AIRPORT MONTHLY ACTIVITY REPORT November 2018 Table of Contents PAGE AIRPORT ACTIVITY OVERVIEW 1 NONSTOP DESTINATION ANALYSIS 2 MAP OF NONSTOP DESTINATIONS 3 FLIGHT
Table of Contents PAGE
 OCTOBER 2018 EL PASO INTERNATIONAL AIRPORT MONTHLY ACTIVITY REPORT October 2018 Table of Contents PAGE AIRPORT ACTIVITY OVERVIEW 1 NONSTOP DESTINATION ANALYSIS 2 MAP OF NONSTOP DESTINATIONS 3 FLIGHT SCHEDULE
RIDERSHIP TRENDS. October 2017
 RIDERSHIP TRENDS October 2017 Prepared by the Division of Strategic Capital Planning December 2017 Table of Contents Executive Summary...1 Ridership...3 Estimated Passenger Trips by Line...3 Estimated
Hydrology Input for West Souris River IWMP
 Hydrology Input for West Souris River IWMP Prepared by: Mark Lee Manitoba Water Stewardship 1 1 1 Overall view of: drainage area watershed characteristics gauging stations meteorological stations Runoff
Inter-Office Memo Reno-Tahoe Airport Authority
 Inter-Office Memo Reno-Tahoe Airport Authority Date: November 30, 2009 To: Statistics Recipients From: Krys T. Bart, A.A.E., President/CEO Subject: RENO-TAHOE INTERNATIONAL AIRPORT PASSENGER STATISTICS
OPEN - HEALTH AFF - INFO 1-1 REV 3
 OPEN - HEALTH AFF - INFO 1-1 REV 3 1 2016 MU Health Strategic Planning Retreat OPEN - HEALTH AFF - INFO 1-2 REV 3 2 Mizzou Biojoint 15 states and 3 countries OPEN - HEALTH AFF - INFO 1-3 REV 3 3 FY10 to
Monthly Airport Passenger Activity Summary. Aug 2017
 T F Green Airport Monthly Airport Passenger Activity Summary Aug 2017 Calendar Year Basis Year Year Aug Aug Percent to Date to Date Percent 2017 2016 Change 2017 2016 Change Total Enplaned 190,676 169,667
International Visitation to the Northern Territory. Year ending June 2017
 International Visitation to the Northern Territory Year ending June 217 The following is a summary of information relevant to the Northern Territory tourism industry including visitation results from Tourism
Performance Metrics for Oceanic Air Traffic Management. Moving Metrics Conference Pacific Grove, California January 29, 2004 Oceanic Metrics Team
 Performance Metrics for Oceanic Air Traffic Management Moving Metrics Conference Pacific Grove, California January 29, 2004 Oceanic Metrics Team Agenda Metrics Team Michele Merkle, FAA AUA-600 Lynne Hamrick,
Consumer Price Index
 KINGDOM OF Consumer Price Index Website: E-mail : Statistics Department P.O. Box 149 Nuku alofa Kingdom of Tonga www.spc.int/prism/tonga/ dept@stats.gov.to Apr, 2018 Price: $ 2.50 Fig 3: Contribution
RENO-TAHOE INTERNATIONAL AIRPORT APRIL 2008 PASSENGER STATISTICS
 Inter-Office Memo Reno-Tahoe Airport Authority Date: June 5, 2008 To: Statistics Recipients From: Tom Medland, Director Air Service Business Development Subject: RENO-TAHOE INTERNATIONAL AIRPORT PASSENGER
CONSUMER PRICE INDEX December Statistics Botswana Private Bag 0024 Gaborone Botswana
 December Copyright 2018 @ Contact Statistician: Phaladi Labobedi Tel: 367 1300 Fax: 395 2201 1. CONSUMER PRICE INDEX December. Private Bag 0024 Gaborone Botswana Tel: (+267) 367 1300. Fax: (+267) 395 2201.
Driving Restrictions That Work? Quito s Pico y Placa Program
 Driving Restrictions That Work? Quito s Pico y Placa Program Paul E. Carrillo Arun S. Malik YiseonYoo November 2014 What Are Driving Restrictions (DR)? Periodic restrictions on vehicle usage: by time-of-day
Monthly Airport Passenger Activity Summary. Sep 2017
 T F Green Airport Monthly Airport Passenger Activity Summary Sep 2017 Calendar Year Basis Year Year Sep Sep Percent to Date to Date Percent 2017 2016 Change 2017 2016 Change Total Enplaned 161,165 151,982
RIDERSHIP TRENDS. January 2018
 RIDERSHIP TRENDS January 2018 Prepared by the Division of Strategic Capital Planning March 2018 Table of Contents Executive Summary...1 Ridership...3 Estimated Passenger Trips by Line...3 Estimated Passenger
Consumer Price Index
 KINGDOM OF Consumer Price Index Website: E-mail : Statistics Department P.O. Box 149 Nuku alofa Kingdom of Tonga www.spc.int/prism/tonga/ dept@stats.gov.to Jan, 2018 Price: $ 2.50 Fig 3: Contribution
The Seychelles National Meteorological Services. Mahé Seychelles
 Report for the fishermen Finding the best days to process sea-cucumber in the Seychelles during the months of March, April and May. The Seychelles National Meteorological Services Mahé Seychelles By: Hyacinth
October 2013 Passenger and Cargo Traffic Statistics Reno-Tahoe International Airport
 October 2013 Passenger and Cargo Traffic Statistics Reno-Tahoe International Airport December 4, 2013 U.S. DOMESTIC INDUSTRY OVERVIEW FOR OCTOBER 2013 All RNO Carriers Systemwide year over year comparison
Queenstown Airport International Passenger Profile Update
 Queenstown Airport International Passenger Profile Update 12 months to 31 January 2017 Published at 6 March 2017 This report, based on data from Statistics NZ, shows the profile of passengers on trans-tasman
SYSTEM BRIEF DAILY SUMMARY
 SYSTEM BRIEF SUMMARY * ANNUAL (PEAK HOURS 7:00 AM TO 10:00 PM MON-SAT) MaxTemp NEL (MWH) Hr Ending Hr Ending LOAD ENERGY (MWH) INCREMENTAL COST DAY DATE Civic TOTAL MAXIMUM @Max MINIMUM @Min FACTOR ON
2017/2018 Q3 Performance Measures Report. Revised March 22, 2018 Average Daily Boardings Comparison Chart, Page 11 Q3 Boardings figures revised
 2017/2018 Q3 Performance Measures Report Revised March 22, 2018 Average Daily Boardings Comparison Chart, Page 11 Q3 Boardings figures revised Contents Ridership & Revenue... 1 Historical Revenue & Ridership...
STATISTICAL BULLETIN ON INTERNATIONAL ARRIVALS, DEPARTURES AND MIGRATION 2011 SERIES NO. SDT: Government of Tonga
 SERIES NO. SDT: 38-13 Government of Tonga STATISTICAL BULLETIN ON INTERNATIONAL ARRIVALS, DEPARTURES AND MIGRATION 2011 Statistics Department, P.O. Box 149, Nuku alofa, Kingdom of Tonga Website: www.spc.int/prism/tonga/
Street Based Lifestyle Monitor
 Street Based Lifestyle Monitor Cardiff (October 2013-October 2015) 0 Executive Summary Those living a street based lifestyle are the public face of homelessness and yet accurate data around how many people
LOVE FIELD ENVIRONMENTAL ADVISORY COMMITTEE QUARTERLY REPORT. October December 2016
 LOVE FIELD ENVIRONMENTAL ADVISORY COMMITTEE QUARTERLY REPORT October December 2016 VOLUNTARY NOISE CONTROL PROGRAM COMPLIANCE DURING PREFERENTIAL HOURS 2100 0600 (JAN SEP 2016) 2 PERCENTAGE OF COMPLIANCE
PERFORMANCE REPORT JANUARY Keith A. Clinkscale Performance Manager
 PERFORMANCE REPORT JANUARY 2018 Keith A. Clinkscale Performance Manager INTRODUCTION/BACKGROUND Keith A. Clinkscale Performance Manager FIXED ROUTE DASHBOARD JANUARY 2018 Safety Max Target Goal Preventable
Residents ensure increase on overnight stays in hotels and similar establishments
 13 July 2018 Tourism Activity May 2018 Residents ensure increase on overnight stays in hotels and similar establishments Hotels and similar establishments registered 2.0 million guests and 5.4 million
2010 FAA Great Lakes Region Annual Conference State of Airport Financing November 3, Marsha Stone, CFO Indianapolis Airport Authority
 2010 FAA Great Lakes Region Annual Conference State of Airport Financing November 3, 2010 Marsha Stone, CFO Indianapolis Airport Authority Economy and Aviation Industry U.S. Aviation Traffic: Signs of
PERFORMANCE REPORT NOVEMBER 2017
 PERFORMANCE REPORT NOVEMBER 2017 Note: New FY2018 Goal/Target/Min or Max incorporated in the Fixed Route and Connection Dashboards. Keith A. Clinkscale Performance Manager INTRODUCTION/BACKGROUND In June
International Visitation to the Northern Territory. Year ending September 2017
 International Visitation to the Northern Territory Year ending September 2017 The following is a summary of information relevant to the Northern Territory (NT) tourism industry including visitation results