OPEN - HEALTH AFF - INFO 1-1 REV 3
|
|
|
- Bryan Dawson
- 5 years ago
- Views:
Transcription

1 OPEN - HEALTH AFF - INFO 1-1 REV 3 1

2 2016 MU Health Strategic Planning Retreat OPEN - HEALTH AFF - INFO 1-2 REV 3 2


3 Mizzou Biojoint 15 states and 3 countries OPEN - HEALTH AFF - INFO 1-3 REV 3 3


4 FY10 to FY15 Inpatient Discharge Trends Discharges for patients who reside in MISSOURI Discharges for patients who reside in MUHC S SA Discharges for MU Health Care 7.0 % % 20.9% OPEN - HEALTH AFF - INFO 1-4 REV 3 4


5 OPEN - HEALTH AFF - INFO 1-5 REV 3 5


6 OPEN - HEALTH AFF - INFO 1-6 REV 3 6
7 OPEN - HEALTH AFF - INFO 1-7 REV 3 7
8 OPEN - HEALTH AFF - INFO 1-8 REV 3 8

9 OPEN - HEALTH AFF - INFO 1-9 REV 3 9
10 Financial Performance June 2016 Preliminary Unaudited YTD Actual YTD Budget MU HEALTH CARE CONSOLIDATED Prior Year Actual FY16 Annual Budget Moody's A Rated Summary of Financial Statement ($000s) $839,951 $786,938 Net Revenues $789,220 $786,938 (766,483) (762,755) Operating Expenses* (730,897) (762,755) (29,293) (3,076) Non-operating Rev/Exp, Net (36,194) (3,076) $44,175 $21,107 Change in Net Assets $22,129 $21,107 *Includes University purchased clinical services annual budget of $42.6 million Days Cash on Hand Net Days Revenue in AR (excluding MRC) OPEN - HEALTH AFF - INFO 1-10 REV 3 10

11 Fiscal Year Revenues in Millions Revenue Growth % Operating Margin* 2016 $ % 8.75% 2015 $ % 8.03% 2014 $ % 5.23% 2013 $ % 6.21% 2012 $ % *Moody s Aa rated operating margin for 2016 was 5.0% and Median was 3.4% OPEN - HEALTH AFF - INFO 1-11 REV 3 11
12 Metric Actual Goal Plan Hospital-Patient Satisfaction Physician Clinic-Patient Satisfaction 62 nd Percentile 30 th Percentile 75 th+ PDSA Projects 75 th+ Changes to MD Compensation Plan/Training Mortality Better than target, average is 1.0 Readmissions 12.93% 11.94% PDSA Projects, prior year 13.03% OPEN - HEALTH AFF - INFO 1-12 REV 3 12

13 OPEN - HEALTH AFF - INFO 1-13 REV 3 13
14 CHART Total Hospital Discharges 4 Benchmarked against Participating Teaching Hospitals Twelve Most Recent Quarters University of Missouri Hospitals and Clinics 12,000 10,000 8,000 6,000 Your Hospital 4,000 75th Percentile 2,000 50th Percentile 25th Percentile Q Q Q Q Q Q Q Q Q Q Q Q1 Source: AAMC COTH Quarterly Survey of Hospital Operations & Financial Performance Total Hospital Discharges is native to the survey AAMC. All rights reserved. OPEN - HEALTH AFF - INFO 1-14 REV 3 14
15 CHART Wage and CMI Standardized Expense per Adjusted Discharge 12 Benchmarked against Participating Teaching Hospitals Twelve Most Recent Quarters University of Missouri Hospitals and Clinics $12,000 $10,000 $8,000 $6,000 Your Hospital $4,000 75th Percentile $2,000 50th Percentile 25th Percentile $ Q Q Q Q Q Q Q Q Q Q Q Q1 Source: AAMC COTH Quarterly Survey of Hospital Operations & Financial Performance Wage and CMI Standardized Expense per Adjusted Discharge = (((Total Operating Expenses-Total Other Operating Revenue)*(Gross Inpatient Revenue/Total Gross Revenue))/Total Discharge)/Area Wage Index from CMS PPS Impact File/Overall Hospital Case Mix Index OPEN - HEALTH AFF - INFO 1-15 REV 3 15
16 CHART CMI Adjusted Hospital Price per Discharge 18 Benchmarked against Participating Teaching Hospitals Twelve Most Recent Quarters University of Missouri Hospitals and Clinics $50,000 $45,000 $40,000 $35,000 $30,000 $25,000 $20,000 Your Hospital $15,000 75th Percentile $10,000 50th Percentile $5,000 25th Percentile $ Q Q Q Q Q Q Q Q Q Q Q Q1 Source: AAMC COTH Quarterly Survey of Hospital Operations & Financial Performance CMI Adjusted Hospital Price per Discharge = (Inpatient Gross Revenue / Total Discharges)/Overall Hospital Case Mix Index OPEN - HEALTH AFF - INFO 1-16 REV 3 16

17 OPEN - HEALTH AFF - INFO 1-17 REV 3 17
18 $10,000,000 University of Missouri Health Care & University Physicians Current and Proposed Financial Impact/Risks in Reimbursement (Govt Only) $- $(10,000,000) $2,023,214 $1,272,908 $419,144 $381,702 FY13 FY14 FY15 FY16 FY17 FY18 FY19 FY20 FY21 FY22 $(619,014) $(3,078,725) $(7,357,880) $(11,040,498) $(16,326,124) $(1,516,846) $(20,000,000) $(30,000,000) $(45,094,939) $(48,008,388) $(52,786,730) $(54,529,169) $(56,145,155) $(40,000,000) $(50,000,000) $(5,961,594) $(6,068,268) $(60,000,000) $(6,177,075) $(6,288,059) $(6,401,262) $(70,000,000) MUHC UP OPEN - HEALTH AFF - INFO 1-18 REV 3 18


19 30% Growth OPEN - HEALTH AFF - INFO 1-19 REV 3 19

20 $120,000,000 $100,000,000 $80,000,000 $60,000,000 $40,000,000 $20,000,000 Other System Campus SOM $ P *36% Growth in Payments in 5 years OPEN - HEALTH AFF - INFO 1-20 REV 3 20
21 Funds Flow Initiative March 24, OPEN - HEALTH AFF - INFO 1-21 REV 3
22 Participation 55 Participants Since FY 2010 Arizona Iowa Rush UMass Barnes Jewish JHMI RWJUH UMDNJ Bayview Kansas Stony Brook UNC Brigham Louisville SUNY UNM Case Maryland TJUH U of R Cedars Sinai Chicago Cincinnati Colorado Duke ECU Fairview Fletcher Allen Froedtert Memorial Hermann Michigan Missouri MUSC Northwestern OHSU OSU Penn RIH Truman Tufts UAB UAMS UCI UCLA UCSD UCSF UK Utah UTMB UVA VCU Washington Wisconsin WVU Yale 22 OPEN - HEALTH AFF - INFO 1-22 REV 3
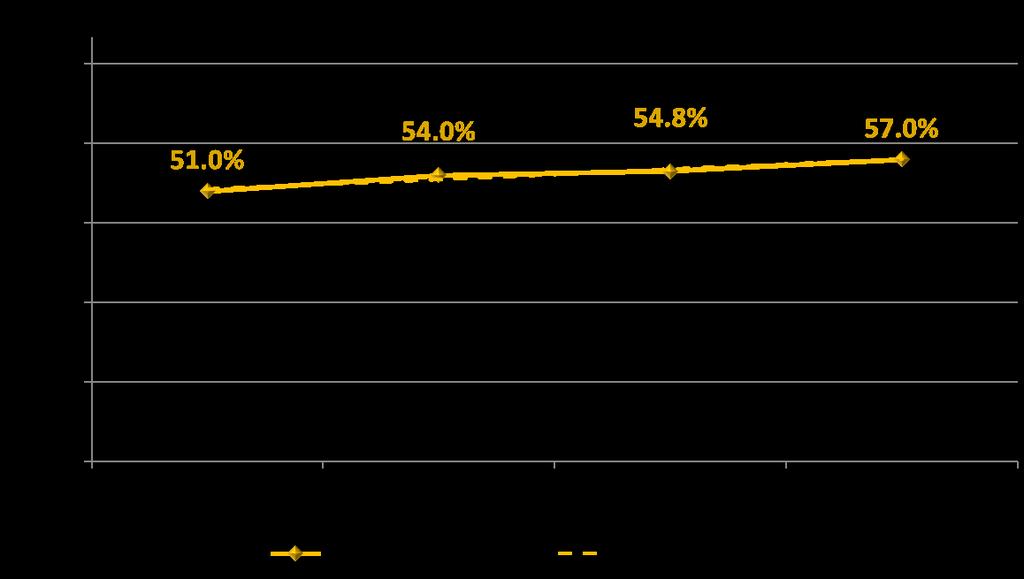
23 School of Medicine Support as a % of 2014 Net Patient Revenue 16% 14% 12% 10% 8% 6% 4% 2% Vizient Range: 2.2% to 14.2% Vizient Average: 8.9% MU Health Care MU Health Care 2015: 13.2% MU Health Care 2016: 12.9% Average = 8.9% 0% Participants 23 OPEN - HEALTH AFF - INFO 1-23 REV 3

24 OPEN - HEALTH AFF - INFO 1-24 REV 3 24


25 Boone Hospital Center RFP submitted June 30, 2016 Could potentially move to a second round of proposals BJC Lease ends in 2020 with notice to be given in 2018 Destination Medical Community with local control OPEN - HEALTH AFF - INFO 1-25 REV 3 25
26 Changing reimbursement and care models Reimbursement changes Bundled payments Value based care: lower utilization and higher quality in narrow networks High deductible plans New Care Models Care mngt of high risk populations: the 15% that make up 80% of the cost Care moves to lower cost settings: Home visits/hosp at home/e-visits Financially at risk populations/$53m charity care Post acute Care Partnership Patient Portals: on-line scheduling and visits OPEN - HEALTH AFF - INFO 1-26 REV 3
27 Changes in our Staff Engagement Strategy to decrease burnout OPEN - HEALTH AFF - INFO 1-27 REV 3 27

28 Doubling Down on Culture OPEN - HEALTH AFF - INFO 1-28 REV 3 28

 Warm Welcome 2) Anticipate")


29 The Culture of Yes Together we: Care, Deliver, Innovate and Serve VALUES BEHAVIORS The difference between Pros and Amateurs 10/5 Rule Say Do Ratio 1:1 1) Warm Welcome 2) Anticipate Needs 3) Fond Farewell Big Impact and Small Wake Everything you need, but nothing more Innovation finds a way No Public Venting Is there anything I can do for you? I have the time. OPEN - HEALTH AFF - INFO 1-29 REV 3 29

30 In a rapidly changing industry, frequent communication to employees is key Monthly rounding Communication stations Daily updates Staff meetings Qrt leadership mtgs Social media OPEN - HEALTH AFF - INFO 1-30 REV 3
31 Year Employee Engagement Percentile Score 2016* 60 th nd th th th One of the largest increases Press Ganey had seen in one year. Began the Culture of Yes *In 2016 we moved to the Gallup engagement survey. We achieved 60 th percentile for a first time user of the survey and 35 th overall. Prior to this we were on the Press Ganey survey which has a more favorable compare group. Goal is upper quartile at 75 th OPEN - HEALTH AFF - INFO 1-31 REV 3 31
32 70 Percent of Performance Evaluations either make performance worse or show no improvement* *A. Kluger and A. Denisi meta analysis of 607 studies OPEN - HEALTH AFF - INFO 1-32 REV 3 32
33 Performance Evaluations Impact on Deliver Rating, Pay Adjustment, Bonus Jan Feb Engagement Mar Apr May Jun Jul Aug Sep Oct Nov Dec % 85% 2 OPEN - HEALTH AFF - INFO 1-33 REV 3 Illustrative 33
34 BWHAT WOULD HAPPEN IF A focus on weaknesses prevents failure. A focus on strengths leads to excellence. Average reader Above-average reader 2,900 Words Per Minute OPEN - HEALTH AFF - INFO 1-34 REV 3 Copyright 2012 Gallup, Inc. All rights reserved First Second Time Time 350 First Second Time Time 34 1
35 FOCUSING ON STRENGTHS IMPACT ENGAGEMENT INCREASES WHEN MANAGERS FOCUS ON EMPLOYEES STRENGTHS OPEN - HEALTH AFF - INFO 1-35 REV 3 63
36 Quarterly GROW Conversations G: Goals R: Results O: On-track/Off-track W: Way forward OPEN - HEALTH AFF - INFO 1-36 REV 3 36
37 Questions? OPEN - HEALTH AFF - INFO 1-37 REV 3 37
January 2018 Air Traffic Activity Summary
 January 2018 Air Traffic Activity Summary Jan-2018 Jan-2017 CY-2018 CY-2017 Passengers 528,947 505,421 4.7% 528,947 505,421 4.7% Passengers 537,332 515,787 4.2% 537,332 515,787 4.2% Passengers 1,066,279
METRO OPERATIONS COMMITTEE
 Los Angeles County Metropolitan Transportation Authority Item 1 CHIEF OPERATIONS OFFICER S S REPORT METRO OPERATIONS COMMITTEE Lonnie Mitchell Chief Operations Officer May 19, 20 1 Employee Recognition
With the completion of this project, we would like to follow-up on the projections as well as highlight a few other items:
 TO: FROM: Mayor and Council Interim City Manager Rebecca Underhill, Director of Finance DATE: February 28, 2014 SUBJECT: Water Meter Project Analysis On March 28, 2012, Acting City Manager Mike Loftin
SAS Group Q Teleconference
 SAS Group Q4 2012 Teleconference December 12, 2012 1 Break-even result in 2012 despite 1.6 bn SEK higher fuel cost 23 MSEK EBT (before non-recurring items) despite 1.6 bn SEK higher fuel cost Positive
Management Presentation. November 2011
 Management Presentation November 2011 Forward looking statements This presentation as well as oral statements made by officers or directors of Allegiant Travel Company, its advisors and affiliates (collectively
DTTAS Quarterly Aviation Statistics Snapshot Quarter Report
 Contents DTTAS Quarterly Aviation Statistics Snapshot Quarter 4 2015 Report 1.1 Dublin Airport Key Statistics... 1 1.2 Cork Airport Key Statistics... 3 1.3 Shannon Airport Key Statistics... 5 1.4 Total
DTTAS Quarterly Aviation Statistics Snapshot Quarter Report
 Contents DTTAS Quarterly Aviation Statistics Snapshot Quarter 1 2018 Report 1.1 Dublin Airport Key Statistics... 1 1.2 Cork Airport Key Statistics... 3 1.3 Shannon Airport Key Statistics... 5 1.4 Total
PERFORMANCE REPORT NOVEMBER 2017
 PERFORMANCE REPORT NOVEMBER 2017 Note: New FY2018 Goal/Target/Min or Max incorporated in the Fixed Route and Connection Dashboards. Keith A. Clinkscale Performance Manager INTRODUCTION/BACKGROUND In June
RIDERSHIP TRENDS. October 2017
 RIDERSHIP TRENDS October 2017 Prepared by the Division of Strategic Capital Planning December 2017 Table of Contents Executive Summary...1 Ridership...3 Estimated Passenger Trips by Line...3 Estimated
Management Presentation. September 2011
 Management Presentation September 2011 Forward looking statements This presentation as well as oral statements made by officers or directors of Allegiant Travel Company, its advisors and affiliates (collectively
PUBLIC NOTICE The Greater Boise Auditorium District will hold a Regular Board Meeting on Thursday, December 20, 2018 at 2 p.m. Boise Centre West Room
 PUBLIC NOTICE The Greater Boise Auditorium District will hold a Regular Board Meeting on Thursday, December 20, 2018 at 2 p.m. Boise Centre West Room 200 GREATER BOISE AUDITORIUM DISTRICT REGULAR BOARD
SIA GROUP FINANCIAL RESULTS
 FINANCIAL RESULTS For Ended 30 June 2018 197200078R Operating Result Q1 Q1 Better/ FY18/19 FY17/18 R1 (Worse) ($M) ($M) (%) Total Revenue 3,844 3,864 (0.5) Q1 Better/ FY17/18 R2 (Worse) ($M) (%) 3,689
Management Presentation. March 2016
 Management Presentation March 2016 Forward looking statements This presentation as well as oral statements made by officers or directors of Allegiant Travel Company, its advisors and affiliates (collectively
2017 Marketing and Communications Conference. November 6, 2017
 2017 Marketing and Communications Conference November 6, 2017 1 2 Introduction Carrie Kenrick State of the Industry Industry Consolidation Financial Trends Ancillary Product / Customer Segmentation Fleet
DTTAS Quarterly Aviation Statistics Snapshot Quarter Report
 Contents DTTAS Quarterly Aviation Statistics Snapshot Quarter 3 2018 Report 1.1 Dublin Airport Key Statistics... 1 1.2 Cork Airport Key Statistics... 3 1.3 Shannon Airport Key Statistics... 5 1.4 Total
Presentation on Results for the 2nd Quarter FY Idemitsu Kosan Co.,Ltd. November 14, 2018
 Presentation on Results for the 2nd Quarter FY 2018 Idemitsu Kosan Co.,Ltd. November 14, 2018 Table of Contents 1. FY 2018 2nd Quarter Financials (1) Overview (2) Segment Information 2. Reference Materials
PERFORMANCE REPORT DECEMBER Performance Management Office
 PERFORMANCE REPORT DECEMBER 2018 Performance Management Office INTRODUCTION/BACKGROUND Performance Management Office FIXED ROUTE DASHBOARD FY 2019 Safety Max Target Goal Preventable Collisions per 100k
FIXED ROUTE DASHBOARD JULY 2018
 FIXED ROUTE DASHBOARD JULY 2018 Safety Max Target Goal Preventable Collisions per 100k Miles Non-Preventable Collisions per 100k Miles Total Incidents per 10,000 Boardings 1.6 1.3 0.8 2.63 2.1 2.0 1.60
Full Year 2009 Results
 Full Year 2009 Results 1 Antonio Vázquez Chairman & Chief Executive Officer 2 Highlights 2009 Strong decrease in revenues: weak demand and yield deterioration. High competition and drop of business traffic.
Presentation on Results for the 2nd Quarter FY Idemitsu Kosan Co.,Ltd. November 1, 2016
 Presentation on Results for the 2nd Quarter FY 2016 Idemitsu Kosan Co.,Ltd. November 1, 2016 Table of Contents 1. 2nd Quarter FY 2016 Financials (1) Overview (2) Segment Information 2. Reference Materials
Management Presentation. November 2018
 Management Presentation November 2018 Forward looking statements This presentation as well as oral statements made by officers or directors of Allegiant Travel Company, its advisors and affiliates (collectively
VCTC Transit Ridership and Performance Measures Quarterly Report
 VCTC Transit Ridership and Performance Measures Quarterly Report Overview Quarter 2 Fiscal Year 2018-2019 This report provides performance measures for VCTC Intercity Bus Service covering the FY 2018-19
Sound Transit Operations December 2014 Service Performance Report. Ridership
 Ridership Total Boardings by Mode Mode Dec-13 Dec-14 % YTD-13 YTD-14 % ST Express 1,266,130 1,396,787 10.3% 16,605,299 17,661,976 6.4% Sounder 248,710 285,016 14.6% 3,035,735 3,361,317 10.7% Tacoma Link
GoToBermuda.com. Q4 Arrivals and Statistics at December 31 st 2015
 Q4 Arrivals and Statistics at December 31 st 1 Q4 Total Vacation Visitor Arrivals Q4 Arrivals Air - Vacation 23,770 23,125-2.7% -645 141,509 139,820-1.2% -1,689 Cruise 39,118 48,344 23.6% 9,226 355,880
Management Presentation. August 2012
 Management Presentation August 2012 Forward looking statements This presentation as well as oral statements made by officers or directors of Allegiant Travel Company, its advisors and affiliates (collectively
RIDERSHIP TRENDS. August 2018
 RIDERSHIP TRENDS August Prepared by the Division of Strategic Capital Planning October Table of Contents Executive Summary...1 Ridership...3 Estimated Passenger Trips by Line...3 Estimated Passenger Trips
RIDERSHIP TRENDS. January 2018
 RIDERSHIP TRENDS January 2018 Prepared by the Division of Strategic Capital Planning March 2018 Table of Contents Executive Summary...1 Ridership...3 Estimated Passenger Trips by Line...3 Estimated Passenger
Presentation on Results for the 3rd Quarter FY Idemitsu Kosan Co.,Ltd. February 14, 2018
 Presentation on Results for the 3rd Quarter FY 2017 Idemitsu Kosan Co.,Ltd. February 14, 2018 Table of Contents 1. FY 2017 3rd Quarter Results (1) Overview (2) Segment Information 2. Forecast for FY2017
Sound Transit Operations January 2014 Service Performance Report. Ridership
 Ridership Total Boardings by Mode Mode Jan-13 Jan-14 % YTD-13 YTD-14 % ST Express 1,343,290 1,426,928 6.2% 1,343,290 1,426,928 6.2% Sounder 245,135 256,775 4.7% 245,135 256,775 4.7% Tacoma Link 86,229
Performance monitoring report 2017/18
 Performance monitoring report /18 Gatwick Airport Limited 1. Introduction Date of issue: 20 July 2018 This report provides an update on performance at Gatwick in the financial year /18, ending 31 March
Performance monitoring report for 2014/15
 Performance monitoring report for 20/15 Date of issue: August 2015 Gatwick Airport Limited Summary Gatwick Airport is performing well for passengers and airlines, and in many aspects is ahead of the performance
SkyWest, Inc. Announces First Quarter 2018 Profit
 NEWS RELEASE CONTACT: Investor Relations Corporate Communications 435.634.3200 435.634.3553 Investor.relations@skywest.com corporate.communications@skywest.com SkyWest, Inc. Announces First Quarter 2018
Presentation on Results for the 3rd Quarter FY Idemitsu Kosan Co.,Ltd. February 14, 2019
 Presentation on Results for the 3rd Quarter FY 2018 Idemitsu Kosan Co.,Ltd. February 14, 2019 Table of Contents 1. FY 2018 3rd Quarter Results (1) Overview (2) Segment Information 2. Forecast for FY 2018
JANUARY 2017 BOARD INFORMATION PACKAGE
 JANUARY 2017 BOARD INFORMATION PACKAGE MEMORANDUM TO: Members of the Airport Authority FROM: Lew Bleiweis, Executive Director DATE: January 13, 2017 Financial Report (document) Informational Reports: A.
AUGUST 2008 MONTHLY PASSENGER AND CARGO STATISTICS
 Inter-Office Memo Reno-Tahoe Airport Authority Date: October 2, 2008 To: Statistics Recipients From: Tom Medland, Director Air Service Business Development Subject: RENO-TAHOE INTERNATIONAL AIRPORT PASSENGER
MONTHLY OPERATIONS REPORT SEPTEMBER 2015
 MONTHLY OPERATIONS REPORT SEPTEMBER 215 Table of Contents SEPTEMBER 215 Section Page September Highlights... 3 Strategic Goals Progress Update... 4 Ridership... 6 Revenue... 9 Expenses... 1 System Summary...
JANUARY 2018 BOARD INFORMATION PACKAGE
 JANUARY 2018 BOARD INFORMATION PACKAGE MEMORANDUM TO: Members of the Airport Authority FROM: Lew Bleiweis, Executive Director DATE: January 19, 2018 Financial Report (document) Informational Reports: A.
Analysts and Investors conference call. Q results. 15 May 2013
 Analysts and Investors conference call Q1 2013 results 15 May 2013 Management summary Key messages of Q1 2013 +6% +9% +3.3%p. Q1 2013 operational KPIs are in line with 109.7 116.2 6.5 7.1 82.3 85.6 expectations,
Tourism Snapshot A focus on the markets in which the CTC and its partners are active
 Tourism Snapshot A focus on the markets in which the CTC and its partners are active www.canada.travel/corporate January 214 Volume 1, Issue 1 Key highlights Total arrivals from CTC s international markets
STAYING TRUE. Scotia Capital Transportation & Aerospace Conference. November 15, 2011
 STAYING TRUE Scotia Capital Transportation & Aerospace Conference November 15, 2011 FORWARD-LOOKING STATEMENT Certain information in this presentation and statements made during this presentation, including
Sound Transit Operations March 2018 Service Performance Report. Ridership
 March 218 Service Performance Report Ridership Total Boardings by Mode Mar-17 Mar-18 % YTD-17 YTD-18 % ST Express 1,622,116 1,47,79-4.6% 4,499,798 4,428,14-1.6% Sounder 393,33 39,6.% 1,74,96 1,163,76 8.3%
Management Presentation. November 2013
 Management Presentation November 2013 Forward looking statements This presentation as well as oral statements made by officers or directors of Allegiant Travel Company, its advisors and affiliates (collectively
SAS Group Presentation Carnegie, May 22, 2012 Sture Stölen, Head of IR
 SAS Group Presentation Carnegie, May 22, 2012 Sture Stölen, Head of IR 1 This is the SAS Group 128 destinations 27,2 million passengers 28 new routes to be launched 2012 1,085 daily flights Revenues 2011,
Presentation on Results for the 1st Quarter FY Idemitsu Kosan Co.,Ltd. August 14, 2017
 Presentation on Results for the 1st Quarter FY 2017 Idemitsu Kosan Co.,Ltd. August 14, 2017 Table of Contents 1. FY 2017 1st Quarter Financials (1) Overview (2) Segment Information 2. Reference Materials
DOWNTOWN, CHARLOTTE AMALIE
 TOTAL VISITOR ARRIVALS TO THE USVI : DECEMBER YEAR TO DATE DECEMBER TOTAL VISITOR ARRIVALS 2,85, 2,8, 2,814,257 2,75, 2,7, 2,65, 2,6, 2,642,118 2,71,542 2,648,5 2,55, 212 213 214 215 Visitor arrivals ended
Passenger Traffic Achieves Strong Growth of 4.8% for the Month of August
 Passenger Traffic Achieves Strong Growth of 4.8% for the Month of August Montréal, 7 October Passenger traffic experienced a slight surge in growth to almost +5% for August compared to previous months
2017/ Q1 Performance Measures Report
 2017/2018 - Q1 Performance Measures Report Contents Ridership & Revenue... 1 Historical Revenue & Ridership... 1 Revenue Actual vs. Planned... 3 Mean Distance Between Failures... 5 Maintenance Cost Quarter
Management Presentation. May 2013
 Management Presentation May 2013 Forward looking statements This presentation as well as oral statements made by officers or directors of Allegiant Travel Company, its advisors and affiliates (collectively
JET AIRWAYS (I) LTD. Presentation on Financial Results Q2 FY10
 LTD. Presentation on Financial Results Q2 FY10") JET AIRWAYS (I) LTD Presentation on Financial Results Q2 FY10 October 27, 2009 1 1 1 Agenda Domestic operating environment Jet Airways performance highlights JetLite performance highlights Outlook 2 2
JET AIRWAYS (I) LTD Presentation on Financial Results Q2 FY10 October 27, 2009 1 1 1 Agenda Domestic operating environment Jet Airways performance highlights JetLite performance highlights Outlook 2 2
Sound Transit Operations January 2017 Service Performance Report. Ridership. Total Boardings by Mode
 January 217 Service Performance Report Ridership ST Express Sounder Tacoma Link Link Paratransit Jan-16 Jan-17 % 1,433,7 1,3,33 4.9% 331,27 7,121 98,411 3,633 Total Boardings by Mode 363,6 74,823 1,76,914
Presentation on Results for the 3rd Quarter FY Idemitsu Kosan Co.,Ltd. February 2, 2016
 Presentation on Results for the 3rd Quarter FY 2015 Idemitsu Kosan Co.,Ltd. February 2, 2016 Table of Contents 1. 3 rd Quarter FY 2015 Financials (1) Overview (2) Segment Information 2. Forecast for FY
Board Box. October Item # Item Staff Page 1. Key Performance Indicators Sep 2018 M. Mungia Financial Report Aug 2018 H.
 Board Box October 2018 Item # Item Staff Page 1. Key Performance Indicators Sep 2018 M. Mungia 2-10 2. Financial Report Aug 2018 H. Rodriguez 11-15 ITEM 1 October 31, 2018 TO: FROM: RE: BOARD OF DIRECTORS
Sound Transit Operations January 2018 Service Performance Report. Ridership
 January 218 Service Performance Report Ridership Total Boardings by Mode Jan-17 Jan-18 % YTD-17 YTD-18 % ST Express 1,3,33 1,7,91.3% 1,3,33 1,7,91.3% Sounder 367,33 416,8 13.3% 367,33 416,8 13.3% Tacoma
Sound Transit Operations August 2015 Service Performance Report. Ridership
 Ridership Total Boardings by Mode Mode Aug-14 Aug-15 % YTD-14 YTD-15 % ST Express 1,534,241 1,553,492 1.3% 11,742,839 12,354,957 5.2% Sounder 275,403 326,015 18.4% 2,139,086 2,463,422 15.2% Tacoma Link
Sound Transit Operations June 2016 Service Performance Report. Ridership
 Ridership Total Boardings by Mode Mode Jun-15 Jun-16 % YTD-15 YTD-16 % ST Express 1,622,222 1,617,420-0.3% 9,159,934 9,228,211 0.7% Sounder 323,747 361,919 11.8% 1,843,914 2,099,824 13.9% Tacoma Link 75,396
Sound Transit Operations February 2018 Service Performance Report. Ridership
 February 218 Service Performance Report Ridership Total Boardings by Mode Feb-17 Feb-18 % YTD-17 YTD-18 % ST Express 1,373,96 1,372,88 -.1% 2,877,294 2,88,719.1% Sounder 314,96 32,187 11.9% 681,923 768,69
JET AIRWAYS (I) LTD. Presentation on Financial Results Q July 24, 2009
 LTD. Presentation on Financial Results Q July 24, 2009") JET AIRWAYS (I) LTD Presentation on Financial Results Q1 2010 July 24, 2009 1 1 1 Agenda Domestic operating environment Jet Airways performance highlights JetLite performance highlights Outlook 2 2 2 Domestic
JET AIRWAYS (I) LTD Presentation on Financial Results Q1 2010 July 24, 2009 1 1 1 Agenda Domestic operating environment Jet Airways performance highlights JetLite performance highlights Outlook 2 2 2 Domestic
SAS Group Q2 2012/13. Q2 Restructuring programme moving KPIs in the right direction
 SAS Group Q2 2012/13 1 Q2 Restructuring programme moving KPIs in the right direction Operating revenues +1.6%* Yield improvement of +2.7%* Forceful implementation of 4XNG plan: Unit cost down by 10.7%
September 2010 Brian Pearce To represent, lead and serve the airline industry
 Cycle turns up but risks and structural challenges remain September 2010 Brian Pearce www.iata.org/economics To represent, lead and serve the airline industry Confidence was still high in July survey Airline
Driving Ridership Strategic Partnerships
 Driving Ridership Strategic Partnerships Feb 29, 2012 Presented by Priya Bhasin-Singh, Strategic Marketing Associate priya.bhasin-singh@edmonton.ca 2012 APTA Marketing & Communications Conference About
Bank of America Merrill Lynch 2018 Emerging Markets Corporate Credit Conference. Miami, May 2018
 Bank of America Merrill Lynch 2018 Emerging Markets Corporate Credit Conference Miami, May 2018 This presentation may include forward-looking comments regarding the Company s business outlook and anticipated
Asheville Metro Economic Report 2014 Second Quarter
 Asheville Metro Economic Report Johnson Price Sprinkle PA HIGHLIGHTS: ASHEVILLE METRO The Asheville metro area gained 2,400 more jobs than one year earlier, averaging a growth rate of 1.4 percent, continuing
Air China Limited Annual Results. March Under IFRS
 Air China Limited 21 Annual Results Under IFRS March 211 Agenda Part 1 Highlights Part 2 Business Overview Part 3 Financial Overview Part 4 Outlook 2 Part 1 Highlights Steady Economic Growth; Asia Pacific
Ramsay Health Care Limited Results Briefing Half Year ended 31 December 2018
 Ramsay Health Care Limited Results Briefing Half Year ended 31 December 2018 Craig McNally, Group Managing Director & Bruce Soden, Group Finance Director 28 February 2019 ramsayhealth.com Agenda Group
DASHBOARD DEC YOUR MONTHLY UPDATE FOR IOWA ONE CALL
 Executive Summary Per the Board s request, we have added this Executive Summary to the Monthly Dashboard. We ll be including it from now on. It will provide you with a running total of the number of tickets
Fourth Quarter and Full Year 2011 Results Presentation. February 1, 2012
 Fourth Quarter and Full Year 2011 Results Presentation February 1, 2012 This presentation may include forward-looking comments regarding the Company s business outlook and anticipated financial and operating
2017/2018 Q3 Performance Measures Report. Revised March 22, 2018 Average Daily Boardings Comparison Chart, Page 11 Q3 Boardings figures revised
 2017/2018 Q3 Performance Measures Report Revised March 22, 2018 Average Daily Boardings Comparison Chart, Page 11 Q3 Boardings figures revised Contents Ridership & Revenue... 1 Historical Revenue & Ridership...
Jumpstart 2017 Lukas Johnson SVP, Commercial. June 2017
 Jumpstart 2017 Lukas Johnson SVP, Commercial June 2017 Forward looking statements This presentation as well as oral statements made by officers or directors of Allegiant Travel Company, its advisors and
MONITORING INFORMAL CROSS- BORDER TRADE IN STAPLE FOODS IN SOUTHERN AFRICA
 MONITORING INFORMAL CROSS- BORDER TRADE IN STAPLE FOODS IN SOUTHERN AFRICA A collaborative activity between WFP and FEWS NET Presented at the FAO/University of Pretoria Workshop on Government and Private
PERFORMANCE REPORT JANUARY Keith A. Clinkscale Performance Manager
 PERFORMANCE REPORT JANUARY 2018 Keith A. Clinkscale Performance Manager INTRODUCTION/BACKGROUND Keith A. Clinkscale Performance Manager FIXED ROUTE DASHBOARD JANUARY 2018 Safety Max Target Goal Preventable
APRIL 2016 BOARD INFORMATION PACKAGE
 APRIL 2016 BOARD INFORMATION PACKAGE MEMORANDUM TO: Members of the Airport Authority FROM: Lew Bleiweis, Executive Director DATE: April 8, 2016 Financial Report (document) Informational Reports: A. February,
PERFORMANCE REPORT DECEMBER 2017
 PERFORMANCE REPORT DECEMBER 2017 Note: New FY2018 Goal/Target/Min or Max incorporated in the Fixed Route and Connection Dashboards. Keith A. Clinkscale Performance Manager INTRODUCTION/BACKGROUND Keith
2007/08 Full Year Results Investor Briefing
 2007/08 Full Year Results Investor Briefing Highlights of Result Profit before tax up 46% to $1,408 million Up 36% on the reported result Margin improvement $3 billion of Sustainable Future Benefits achieved
PRESS RELEASE Financial Results. Rising passenger traffic at 12.5m Exceeding 1bn in consolidated revenue
 PRESS RELEASE 2016 Financial Results Rising passenger traffic at 12.5m Exceeding 1bn in consolidated revenue Kifissia, 23 March 2017 AEGEAN reports full year 2016 results with consolidated revenue at 1,020m,
SEPTEMBER 2015 BOARD INFORMATION PACKAGE
 SEPTEMBER 2015 BOARD INFORMATION PACKAGE MEMORANDUM TO: Members of the Airport Authority FROM: Lew Bleiweis, Executive Director DATE: September 11, 2015 Financial Report (document) Informational Reports:
Third Quarter 2014 Results. 29 October 2014
 Third Quarter 2014 Results 29 October 2014 Highlights of the Third Quarter Operating environment Air France-KLM Economic environment remains weak Further currency volatility affecting revenues and results
Results 2Q17. August 9, 2017
 Results 2Q17 August 9, 2017 2Q17 Highlights Indicators 2Q17 Var. x 2Q16 ASK (BN) 10.4-3.0% Traffic (000) 7,261-1.3% RPK (BN) 8.1 +0.5% Load Factor 77.9% +2.7 p.p. Yield (R$ cents) 23.2 +4.8% Pax Revenue
RENO-TAHOE INTERNATIONAL AIRPORT APRIL 2008 PASSENGER STATISTICS
 Inter-Office Memo Reno-Tahoe Airport Authority Date: June 5, 2008 To: Statistics Recipients From: Tom Medland, Director Air Service Business Development Subject: RENO-TAHOE INTERNATIONAL AIRPORT PASSENGER
Performance Measures Year End Updated-
 Performance Measures Year End 2017 -Updated- Priorities and Objectives 1. Earn and Retain the Community s Trust 2. Provide Excellent Customer Service 3. Enable Organizational Success 4. Exemplify Financial
Santander 22 nd Annual Latin American Conference. Cancun, January 2018
 Santander 22 nd Annual Latin American Conference Cancun, January 2018 This presentation may include forward-looking comments regarding the Company s business outlook and anticipated financial and operating
AFTA Travel Trends. July 2017
 AFTA Travel Trends July 2017 AFTA Travel Trends Report 2017 Inbound and Outbound overview Introduction This snapshot provides an overview of the balance of trade between Inbound and Outbound Travel for
TOURISM PERFORMANCE 2017
 4 th QUARTER TOURISM PERFORMANCE 2017 TOTAL STAYOVER ARRIVALS 105,658 TOTAL CRUISE ARRIVALS 224,212 TOTAL VISITOR NIGHTS AVERAGE HOTEL OCCUPANCY 935,402 71.7% ECONOMIC IMPACT $142.6 million HOW WAS OUR
MONTHLY OPERATIONS REPORT DECEMBER 2015
 MONTHLY OPERATIONS REPORT DECEMBER 215 Table of Contents DECEMBER 215 Section Page December Highlights... 3 Strategic Goals Progress Update... 4 Ridership... 6 Revenue... 9 Expenses... 1 System Summary...
InterContinental Brand Simon Scoot -Vice President InterContinental Brand Management. June 2010
 InterContinental Brand Simon Scoot -Vice President InterContinental Brand Management June 2010 1 Video Brand History 2 InterContinental: leading global network Americas: System = 55 hotels Pipeline = 6
Table of Contents PAGE
 April 2015 EL PASO INTERNATIONAL AIRPORT MONTHLY ACTIVITY REPORT April 2015 Table of Contents PAGE AIRPORT ACTIVITY OVERVIEW 1 NONSTOP DESTINATION ANALYSIS 2 MAP OF NONSTOP DESTINATIONS 3 FLIGHT SCHEDULE
JET AIRWAYS (I) LTD. Presentation on Financial Results Q3 2012
 LTD. Presentation on Financial Results Q3 2012") JET AIRWAYS (I) LTD Presentation on Financial Results Q3 2012 20.01.2012 1 1 1 Domestic operating environment 2 2 2 Domestic industry. 8.00 7.00 6.00 5.00 4.00 3.00 Q3 12 vs Q3 11 Industry capacity 17%
JET AIRWAYS (I) LTD Presentation on Financial Results Q3 2012 20.01.2012 1 1 1 Domestic operating environment 2 2 2 Domestic industry. 8.00 7.00 6.00 5.00 4.00 3.00 Q3 12 vs Q3 11 Industry capacity 17%
Investor update presentation. November 2016
 Investor update presentation November 2016 Content Update on Q3 2016 financial performance 3-8 Recap on ATG Evolution 9-10 Update on hospitality strategic business unit 11-14 Update on online travel and
CONTACT: Investor Relations Corporate Communications
 NEWS RELEASE CONTACT: Investor Relations Corporate Communications 435.634.3200 435.634.3553 Investor.relations@skywest.com corporate.communications@skywest.com SkyWest, Inc. Announces Second Quarter 2017
CWC LA - Cash Balance (January 2012)
") CWC LA - Cash Balance 2012-13 (January 2012) 1,200,000 Cash Balance 1,000,000 800,000 ($1,000s) 600,000 400,000 200,000 - CWC LA - Actuals/Projected CWC LA - ed (Nov) 1 1 CWC Hollywood - Financial Dashboard
CWC LA - Cash Balance 2012-13 (January 2012) 1,200,000 Cash Balance 1,000,000 800,000 ($1,000s) 600,000 400,000 200,000 - CWC LA - Actuals/Projected CWC LA - ed (Nov) 1 1 CWC Hollywood - Financial Dashboard
Passenger Traffic Expands by 4% for the Month of June
 Passenger Traffic Expands by 4% for the Month of June Montréal, 6 August Passenger traffic continued along its growth path for the month of June. In the first half of, the number of passengers passing
Sound Transit Operations March 2017 Service Performance Report. Ridership. Total Boardings by Mode
 March 217 Service Performance Report Ridership ST Express Sounder Tacoma Link Link Paratransit Mar-16 Mar-17 % 1,83,4 1,621,49 2.4% 37,496 82,631 1,264,47 3,821 Total Boardings by Mode 389,98 87,39 1,89,43,297
SAN LUIS OBISPO COUNTY REGIONAL AIRPORT ANNUAL AIRLINE PASSENGER SUMMARY SUMMARY BY YEAR AND MONTH 4/11/2018
 ANNUAL AIRLINE PASSENGER SUMMARY SUMMARY BY YEAR AND MONTH 4/11/ JAN FEB MAR IL E Y T 35,023 36,435 38,282 38,390 37,848 35,589 38,325 37,433 32,324 31,169 32,771 33,627 30,978 24,586 23,382 2017 24,586
BUSINESS BAROMETER December 2018
 Credit: Chris Orange BUSINESS BAROMETER December Credit: Nigel Moore 1 Contents Summary of findings 3 Annual monthly performance: visitor attractions..4 Visit Herts Team update 5 National context.8 Visitor
AGENDA. Alaska Marine Highway System Background Data. Fiscal Year 2015 Look Forward. Dayboat Alaska Class Ferry Reservations & Manifest System
 AGENDA Alaska Marine Highway System Background Data Fiscal Year 2015 Look Forward Dayboat Alaska Class Ferry Reservations & Manifest System 2 MISSION STATEMENT DOT&PF: Keep Alaska moving through service
The Economic Impact of Travel in Kansas. Tourism Satellite Account Calendar Year 2013
 The Economic Impact of Travel in Kansas Tourism Satellite Account Calendar Year 2013 Who we are Tourism Economics Union of industry expertise and economic disciplines Real world insights based on quantitative
October 2013 Passenger and Cargo Traffic Statistics Reno-Tahoe International Airport
 October 2013 Passenger and Cargo Traffic Statistics Reno-Tahoe International Airport December 4, 2013 U.S. DOMESTIC INDUSTRY OVERVIEW FOR OCTOBER 2013 All RNO Carriers Systemwide year over year comparison
Quarter 3 Interim management Statement
 Quarter 3 Interim management Statement 3 months to 30 th June 2012 25 th July 2012 1 1 Strong Q3 performance - in a difficult market Revenue growth in line with expectations Constant currency RPS growth
STELLAR MARTINEAU PLACE LP
 INVESTOR UPDATE - JUNE 2016 Contents Executive Summary Page 3 Market Performance Page 5 Operational Performance Page 6 Hotel Profitability Page 8 Hotel Budget: 2016/17 Page 10 02 Executive Summary ASSET
Corporate presentation CIBC Whistler Institutional Investor Conference January 21, 2010
 Corporate presentation CIBC Whistler Institutional Investor Conference January 21, 2010 Forwardlooking statement Certain information in this presentation and statements made during this presentation, including
AIR CANADA REPORTS 2010 THIRD QUARTER RESULTS; Operating Income improved $259 million or 381 per cent from previous year s quarter
 AIR CANADA REPORTS 2010 THIRD QUARTER RESULTS; Operating Income improved $259 million or 381 per cent from previous year s quarter MONTRÉAL, November 4, 2010 Air Canada today reported operating income