Land area 1.73 million km 2 Queensland population (as at December 2016) Brisbane population* (preliminary estimate as at 30 June 2016)
|
|
|
- Chad Harrell
- 6 years ago
- Views:
Transcription
1 Queensland - 11
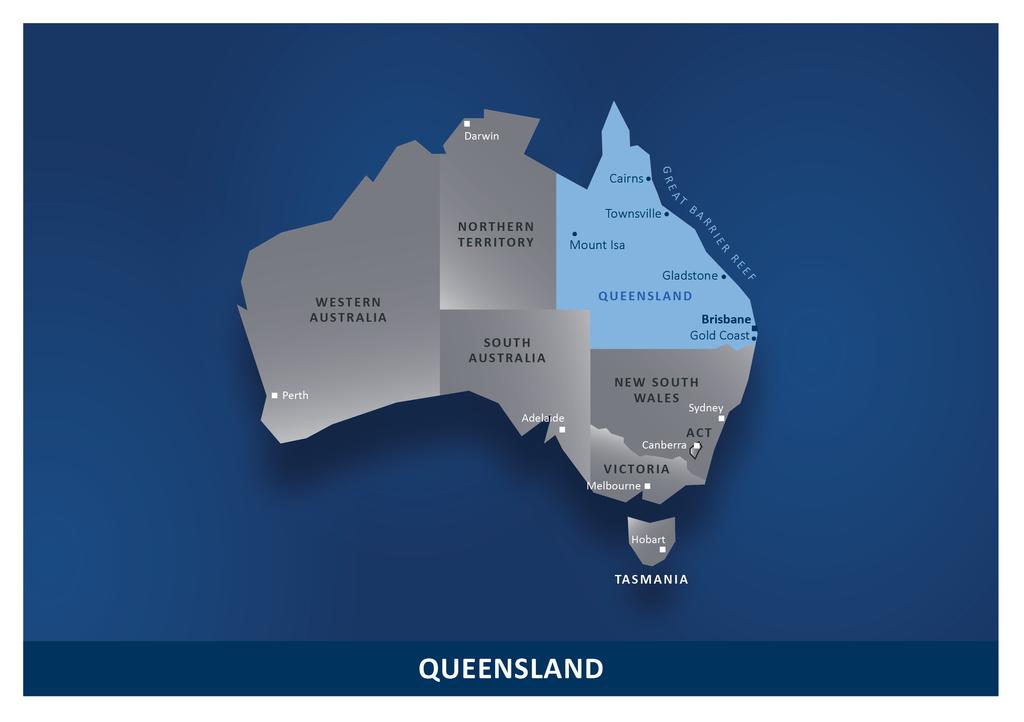
2 Queensland OVERVIEW Queensland is nearly five times the size of Japan, seven times the size of Great Britain, and two and a half times the size of Texas. Queensland is Australia s second largest state by land area, covering more than 22 per cent of the continent. The economy is the third largest in Australia, after New South Wales and Victoria. Queensland s natural wonder, the Great Barrier Reef, extends over some 2,000km, covering more than a quarter of the state s 7,400km of coastline. With a population of 4.79 million, more than 20 per cent of Australians live in Queensland. Around three million Queenslanders live in the state s south-east corner. Queensland Quick facts * Greater capital city statistical area ABS ** Total number of people employed. Data source: Tourism Research Australia, ABS, RBA, Queensland State Accounts. Land area 1.73 million km 2 Queensland population (as at December 2016) 4.79 million Brisbane population* (preliminary estimate as at 30 June 2016) 2.35 million Language English Currency Australian dollar (AUD) Gross State Product (year ending 30 June 2016) AUD316 billion (USD230 billion) Gross State Product, annual growth rate (long-run trend) 4.3% Flight time: Brisbane to Sydney 1.5 hours Workforce** (May 2017) 2.38 million Inflation rate (year ending 31 March 2017) 1.8% Overseas tourism visitor nights (year ending March 2017) 34.7 million Queensland Treasury Corporation QUEENSLAND - 12
3 Queensland s rate of economic growth has consistently outperformed the average of other advanced economies since the early 90s, a trend that is forecast to continue. Queensland s economic standing GROWTH Queensland s economic growth compared to advanced economies 1 1 Advanced economy data are in calendar year terms, while Queensland data is financial year terms. Advanced economy data is constant prices. QLD data is Chain volume measure (CVM), reference year. Data sources: IMF, Queensland State Accounts, Queensland Treasury Note: is an estimate as at June onwards are forecasts / projections. Queensland Treasury Corporation QUEENSLAND - 13

4 Queensland s economic growth compared to other states 1 Queensland is forecast to be one of the strongest growing states in Australia over the next few years. 1 Growth is in real terms Data sources: Various state budgets and mid-year reviews Queensland Treasury Corporation QUEENSLAND - 14
, 2014-15 reference year. * Public sector and utilities includes: public administration and safety; and electricity, gas, water, waste services.")
5 DIVERSE ECONOMY Australian states economic output by sector 1 Similar to Australia, Queensland has a diverse economy with no single sector making up more than 12 per cent of output , Gross Value Added, chain volume measure (CVM), reference year. * Public sector and utilities includes: public administration and safety; and electricity, gas, water, waste services. **Natural resources includes the extraction of naturally occurring mineral solids, such as coal and ores; liquid minerals, such as crude petroleum; and gases, such as natural gas. ***Other includes: dwellings; professional, scientific and technical services, accommodation and food services; other services; administrative and support services; arts and recreation. Data source: ABS Queensland Treasury Corporation QUEENSLAND - 15
6 Contributions to growth in Queensland s Gross State Product 1 Following an unprecedented resources investment boom, the Queensland economy continues its transition to more broad-based growth. With LNG exports plateauing, an anticipated recovery in business investment and a solid contribution from public sector capital spending should support stronger domestic activity over the period ahead. 1 Chain volume measure (CVM), reference year. Data source: Queensland State Accounts, Queensland Treasury. Note: is an estimate onwards are forecasts / projections. Queensland Treasury Corporation QUEENSLAND - 16

7 Economic drivers EXPORTS A spike in coal prices is set to drive an increase in coal exports in and LNG exports have increased significantly over the past few years as production has ramped up, however, are expected to plateau from as production reaches capacity. Queensland s total exports 1 1 Nominal terms ($ billions) Data sources: ABS unpublished trade data, Queensland Treasury Note: is an estimate onwards are forecasts / projections. Queensland Treasury Corporation QUEENSLAND - 17
8 Queensland s goods exports by country 1 Asia remains Queensland s most important export market, accounting for more than threequarters of Queensland s exports in Share of total goods exports, per cent. Data sources: ABS unpublished trade data, Queensland Treasury Queensland Treasury Corporation QUEENSLAND - 18

9 Queensland s international tourist nights by country of origin Strong growth in overseas visitor nights over the past two years has been driven by increases in the number of visitors from a range of countries including China and India. This trend has been supported by rising levels of disposable income and a falling Australian dollar and should continue into the future as the Asian middle class continues to grow. Data sources: Tourism Research Australia Queensland Treasury Corporation QUEENSLAND - 19

10 EDUCATION Queensland s services exports (education): overseas student commencements Strong increases in overseas vocational education and English language course student commencements have driven education exports in Queensland in recent years. As at 30 June 2016 *Vocational education is tertiary education and training that provides accredited training in job ready and technical skills. Data source: Austrade. Queensland Treasury Corporation QUEENSLAND - 20
11 LABOUR MARKET Queensland s labour market With a moderation in key labour intensive sectors in coming years, employment growth is likely to remain modest, as is the case nationally. After a period of stabilisation, Queensland s unemployment rate is expected to fall to 6 per cent by June quarter 2019, consistent with stronger state final demand and employment growth by this time. Data sources: ABS, Queensland Treasury Notes: Employment growth over the year to June quarter and the unemployment rate is for the June quarter in each year. Queensland Treasury Corporation QUEENSLAND - 21

12 DEMOGRAPHICS Queensland s population growth compared to Australia s 1 After slowing to 1.3 per cent in as the resources investment boom subsided, Queensland s population growth is forecast to average around 1½ per cent per annum over the forward estimates, broadly in line with that forecast nationally. Greater housing affordability in Brisbane is likely to lead to further strengthening in net interstate migration over the forward estimates. 1 Australia s population growth forecasts/projections, which are as at 31 December for a given year, are not directly comparable to Queensland s forecasts/projections which are in yearaverage terms. Data sources: ABS, Queensland Treasury, Australian Treasury Note: is an estimate onwards are forecasts / projections. Queensland Treasury Corporation QUEENSLAND - 22

13 Total grants* of around AUD27 billion (including those from the Australian Government) are expected to account for approximately 50 per cent of Queensland s total government revenue in Queensland s fiscal position REVENUES Queensland budgeted revenues : AUD56 billion Queensland budgeted taxation revenues : AUD13 billion 1 May not add to 100 per cent due to rounding. *Grants from the Australian Government are almost evenly split between general and specific purpose payments. General purpose payments include GST revenue grants and associated payments, are untied and used for both recurrent and capital purposes. Specific purpose payments are used to meet Australian Government and shared policy objectives. ** This comprises the taxes and levies listed in the budgeted taxation revenues chart. Data source: Queensland Government Budget Queensland Treasury Corporation QUEENSLAND - 23

14 Contribution of key items to revenue growth The key revenue sources of GST, royalties and taxes are expected to grow at rates more consistent with long-run average rates over the coming years, as opposed to the rapid pace of growth observed for most of the 2000s. Note: Financial year from 1 July to 30 June Data source: Queensland Treasury Queensland Treasury Corporation QUEENSLAND - 24
15 AUSTRALIAN GOVERNMENT FISCAL SUPPORT Horizontal fiscal equalisation involves the payments of grants (from the revenue raised from the Goods and Services Tax (GST)) to Australian states and territories with the aim of giving all states the capacity to provide services and associated infrastructure to the same standard. In grants from the Australian Government will account for 49.5 per cent of Queensland s revenue. Australia is one of only nine countries with a AAA credit rating from all three major ratings agencies; Standard & Poor s, Moody s Investors Service and Fitch Ratings. The Australian Government provides explicit financial support to all Australian states and territories in the form of: the payment of grants under the principle of the Horizontal Fiscal Equalisation scheme the Australian Government s Natural Disaster Relief and Recovery Arrangements, which provides partial reimbursement for eligible costs incurred as a result of natural disasters, and the offer of a time-limited, voluntary guarantee over Australian state and territory borrowings from July 2009 to December See Appendices for more information on tax sharing arrangements and ratings. Queensland Treasury Corporation QUEENSLAND - 25

16 EXPENSES Health and education make up more than half of the State s budgeted expenses. Queensland budgeted expenses AUD56 billion 1 May not add to 100 per cent, due to rounding. Data source: Queensland Government Budget Queensland Treasury Corporation QUEENSLAND - 26
17 Annual growth in general government sector expenses Queensland has and will continue to implement strong expense management. Data sources: Actuals data from Queensland Treasury. Forecasts and projections from the Queensland Government Budget. Queensland Treasury Corporation QUEENSLAND - 27
18 BUDGET BALANCE General government sector net operating and fiscal balances Net operating surpluses are expected in each year of the forward estimates. Data sources: Actuals data from Queensland Treasury. Forecasts and projections from the Queensland Government Budget. Queensland Treasury Corporation QUEENSLAND - 28

19 GOVERNMENT CAPITAL EXPENDITURE Queensland s disaggregated state infrastructure spending Spending on improving Queensland s transport and communication and fuel and energy infrastructure comprises the bulk of the Government s budgeted capital works program in *Mainly includes general government sector equipment investment expenditures on economic services and those not classified elsewhere. Data sources: Actuals data from Queensland Treasury. Forecasts and projections from the Queensland Government Budget. Queensland Treasury Corporation QUEENSLAND - 29
20 Credit ratings RATINGS AGENCIES RATIONALE Moody s Investor Service rating outlook for Queensland was revised from negative to stable on 20 April Data source: Standard & Poor s: Research Update: Ratings on The State of Queensland, 10 November Data source: Moody s Investors Service: Credit Opinion: Queensland (State of) Australia, 20 April Note: Information on Queensland s domestic and international peers credit ratings can be found in the Appendices. STANDARD & POOR S AA+/Stable/A-1+ Summary rating rationale Queensland has exceptional liquidity, a very strong economy, strong financial management and budgetary performance, and low contingent liabilities. The State s strong financial management has improved its budgetary performance and achieved operating surpluses by controlling expenditure growth. The stable outlook reflects our expectation that the State's financial management will remain strong and its budgetary performance will continue to improve compared to recent years. MOODY S INVESTORS SERVICE Aa1/Stable/P-1 The rating reflects Queensland s financial performance which has shown improvements in recent years. The rating also reflects an easing in the state s debt burden from previously elevated levels. Moreover, the state s debt burden is projected to decline further. Queensland is unique among Australian states in that it has substantial financial holdings that are more than sufficient to fully fund its superannuation obligations. Credit is also supported by the state s growing and diverse economy. Queensland Treasury Corporation QUEENSLAND - 30
21 General government debt to revenue ratio One of the Government s fiscal principles is to target an ongoing reduction in Queensland s debt burden, as measured by the general government debt to revenue ratio. This ratio is expected to be materially lower than was expected from the Budget. This reflects the Government s Debt Action Plan announced in the Budget, followed up in the MYFER* and Budget. Other key fiscal ratios can be found in the Appendices. Data source: Various Queensland Government Budgets *Mid Year Fiscal and Economic Review Queensland Treasury Corporation QUEENSLAND - 31
22 One of the Government s fiscal principles is to target net operating surpluses that ensure any new General Government sector capital investment is primarily funded through recurrent revenues rather than borrowing. General Government Sector net operating cash flow as a proportion of capital expenditure Across the period to , the proportion of the capital program that is projected to be funded via net cash inflows from operating activities is 52 per cent. Data source: Queensland Government Budget. Queensland Treasury Corporation QUEENSLAND - 32
23 Summary of key points The State of Queensland: has a diverse economy with services making up a significant proportion of total output has an economy which is expected to grow in line with the national average over the next few years has a stable revenue stream in the form of grants it receives from the Australian Government has General Government debt levels that have fallen over the past few years has an ongoing General Government capital works program, which will be funded primarily through recurrent revenue as opposed to borrowing, and is rated AA+/Stable/A-1+ and Aa1/Stable/P1 by Standard & Poor s and Moody s Investors Service respectively. See Appendices for more information on tax sharing arrangements and ratings. Queensland Treasury Corporation QUEENSLAND - 33
Land area 1.73 million km 2 Queensland population (as at 31 December 2017) Brisbane population* (preliminary estimate as at 30 June 2017)
 Brisbane population* (preliminary estimate as at 30 June 2017)") Queensland - 11 Queensland OVERVIEW Queensland is nearly five times the size of Japan, seven times the size of Great Britain, and two and a half times the size of Texas. Queensland is Australia s second
Queensland - 11 Queensland OVERVIEW Queensland is nearly five times the size of Japan, seven times the size of Great Britain, and two and a half times the size of Texas. Queensland is Australia s second
Land area 1.73 million km 2 Queensland population (December 2015) Brisbane population* (June 2015)
 Brisbane population* (June 2015)") Queensland - 18 Queensland OVERVIEW Queensland is nearly five times the size of Japan, seven times the size of Great Britain, and two and a half times the size of Texas. Queensland is Australia s second
Queensland - 18 Queensland OVERVIEW Queensland is nearly five times the size of Japan, seven times the size of Great Britain, and two and a half times the size of Texas. Queensland is Australia s second
Queensland State Economy and State Budget
 Queensland State Economy and State Budget 2018-19 Government measures for business and industry The Queensland Treasurer, Jackie Trad delivered the Palaszczuk Government s fourth Budget on 12th June 2018.
Queensland Economic Update
 Queensland Economic Update Chamber of Commerce & Industry March 2018 cciq.com.au Queensland Economic Update: Summary National Accounts GDP expanded 2.3% during calendar year 2017. QLD state final demand
2013/14 Pre-Budget Submission Accommodation Association of Australia
 2013/14 Pre-Budget Submission Accommodation Association of Australia Accommodation Association of Australia Principal Contact Mr Richard Munro Chief Executive Officer Phone: +61 2 8666 9015 EXECUTIVE SUMMARY
Australian Cities Accounts Estimates. December 2011
 Australian Cities Accounts 2010-11 Estimates December 2011 This report has been prepared by: SGS Economics and Planning Pty Ltd ACN 007 437 729 Level 5 171 Latrobe Street MELBOURNE VIC 3000 P: + 61 3 8616
Queensland Economic Update
 Queensland Economic Update Chamber of Commerce & Industry January 218 cciq.com.au Queensland Economic Update: Summary Economy State Final Demand (SFD) expanded by.2% in the September 217 quarter Household
STATE UPDATE: QUEENSLAND
 STATE UPDATE: QUEENSLAND JULY CONTENTS Key points In Focus: Strong economic growth but incomes to remain weak Labour market Demographics 7 Consumer and household sector Business sector 9 Residential property
What will a broad-based economic recovery mean for the Brisbane office leasing market?
 2 21 22 23 24 25 26 27 28 29 21 211 212 213 214 215 216 What will a broad-based economic recovery mean for the Brisbane office leasing market? December 216 Summary Introduction Vacancy in the Brisbane
Airlines across the world connected a record number of cities this year, with more than 20,000 city pair connections*
 1 Airlines across the world connected a record number of cities this year, with more than 20,000 city pair connections*. This is a 1,351 increase over 2016 and a doubling of service since 1996, when there
Queensland Economic Update. Are there more pots of gold ahead?
 Queensland Economic Update Are there more pots of gold ahead? Katie Dean Economist ANZ Bank 4 November 24 Australian economic growth has been strong and Queensland has been a star performer Economic growth
Quarterly Aviation Industry Performance
 Quarterly Aviation Industry Performance ALAFCO Aviation Lease and Finance Company K.S.C.P. Quarterly Aviation Industry Performance 3Q17 (Updated November 17) Prepared by: Strategic Planning department
Annual Gross Domestic Product (Production Measure)
") June 2017 Executive Summary Page 2 Latest Quarter Economic Trends page 3 Economic Outlook page 4 Labour Force page 5 Retail Activity page 6 Building Activity page 7 Tourism Trends page 8 Local Authorities
June 2017 Executive Summary Page 2 Latest Quarter Economic Trends page 3 Economic Outlook page 4 Labour Force page 5 Retail Activity page 6 Building Activity page 7 Tourism Trends page 8 Local Authorities
TOWNSVILLE NORTH QUEENSLAND QUARTERLY ECONOMIC SNAPSHOT
 TOWNSVILLE NORTH QUEENSLAND QUARTERLY ECONOMIC SNAPSHOT SEPTEMBER 2017 TOWNSVILLE NORTH QUEENSLAND QUARTERLY ECONOMIC SNAPSHOT SEPTEMBER 2017 The Townsville North Queensland Economic Snapshot provides
TRENDS AND PROSPECTS FOR THE CAIRNS / TROPICAL NORTH QUEENSLAND ECONOMY PRESENTATION TO PROFESSIONAL ACCOUNTANTS CAIRNS
 TRENDS AND PROSPECTS FOR THE CAIRNS / TROPICAL NORTH QUEENSLAND ECONOMY PRESENTATION TO PROFESSIONAL ACCOUNTANTS CAIRNS WS (Bill) Cummings Ref: J3015 26th August 2016 AUSTRALIAN DOLLAR (SEPT) Year USD
State of the States October 2017 State & territory economic performance report. Executive Summary
 State of the States October 2017 State & territory economic performance report. Executive Summary NSW ON TOP; VICTORIA CLOSES IN How are Australia s states and territories performing? Each quarter CommSec
MINING IN TASMANIA: DINOSAUR OR DELIVERER?
 MINING IN TASMANIA: DINOSAUR OR DELIVERER? PRESENTATION TO A FORUM HOSTED BY THE ACADEMY OF TECHNOLOGICAL SCIENCES AND ENGINEERING (ATSE) FOR NATIONAL SCIENCE WEEK RACV APARTMENT HOTEL, HOBART 3 RD AUGUST
The Residential Outlook for South Australia
 The Residential Outlook for South Australia Matthew King Economist HOUSING INDUSTRY ASSOCIATION February 2011 Overview Economic backdrop Other important matters Interest rates & bank lending Renovations
2014/15 Pre-Budget Submission Accommodation Association of Australia
 2014/15 Pre-Budget Submission Accommodation Association of Australia Accommodation Association of Australia Principal Contact Mr Richard Munro Chief Executive Officer Phone: +61 2 8666 9015 EXECUTIVE SUMMARY
Economic Contribution of Tourism to NSW
 Economic Contribution of Tourism to NSW 2015-16 Tourism is a significant part of the NSW economy. In 2015-16, tourism contributed $38.1 billion (Tourism Consumption) to the NSW economy and employed 261,100
New South Wales: State Economy and State Budget,
 New South Wales: State Economy and State Budget, 2018-19 Government measures for business and industry The 2018-19 NSW Budget was handed down by the NSW Treasurer, Dominic Perrottet on Tuesday 19 June
South Australian Centre for Economic Studies June 2016 Economic Briefing Report 28 June, 2016
 Steve Whetton, Executive Director, SA Centre for Economic Studies South Australian Centre for Economic Studies June 216 Economic Briefing Report 28 June, 216 Per cent Global GDP Growth 1 8 Developing Countries
Investor Briefings First-Half FY2016 Financial Results
 Cedar Woods Properties Limited Investor Briefings First-Half FY2016 Financial Results 26 February 2016 Cedar Woods Presentation 2 Snapshot of Achievements in FY2016 Extensive portfolio of residential estates
QANTAS HALF YEAR 2015 FINANCIAL RESULTS 1
 QANTAS HALF YEAR 2015 FINANCIAL RESULTS 1 Key points: Underlying Profit Before Tax: $367 million Statutory Profit After Tax: $206 million Transformation benefits: $374 million Comparable unit cost reduction:
MEDIA RELEASE Friday, 15 June 2012
 SOUTH AUSTRALIAN C E N T R E F O R E C O N O M I C S T U D I E S ADELAIDE & FLINDERS UNIVERSITIES MEDIA RELEASE Friday, 15 June 2012 EMBARGOED until 12.01am, Monday, 18 th June 2012 South Australia is
Economic Contribution of Tourism to NSW
 Economic Contribution of Tourism to NSW 2013-14 Tourism is a significant part of the NSW economy. In 2013-14, tourism contributed $34.9 billion (Tourism Consumption) to the NSW economy and employed 272,000
QLD Economic Outlook. Thursday, 21 December Key Points: State Report QLD. Summary
 Thursday, 21 December 217 QLD Economic Outlook Summary Queensland s economy has been subdued over the past couple of years, as declining commodity prices and a sharp slowdown in mining investment weighed
New South Wales: state economy and State Budget,
 New South Wales: state economy and State Budget, 2016-17 Government measures for business and industry The 2016-17 NSW Budget was handed down by the NSW Treasurer, Gladys Berejiklian on Tuesday 21 June
Economic Performance of Australia s Cities and Regions Embargoed until Tuesday 5 December 2017
 Economic Performance of Australia s Cities and Regions Embargoed until Tuesday 5 December 2017 Media Release Tuesday 5 December 2017: New research released today by SGS Economics & Planning (SGS) reveals
Australian Casino Association ECONOMIC REPORT. Prepared for. Australian Casino Association. June Finance and Economics
 Australian Casino Association ECONOMIC REPORT Prepared for Australian Casino Association June 2004 Finance and Economics Contents Executive Summary--------------------------------------------------------------------------------------------
The Outlook for the Residential Construction Industry Hunter and the Central Coast
 The Outlook for the Residential Construction Industry Hunter and the Central Coast Graham Wolfe HIA Chief Executive Industry Policy and Media HIA Industry Outlook Breakfast Newcastle February 2013 Backdrop:
2012 Americas School of Mines
 www.pwc.com 2012 Americas School of Mines Australia Wayne Huf 2 Section One Some Background on Australia 3 Top 10 Deadliest Animals in Australia 1. Box Jellyfish 2. Inland Taipan Snake 3. Saltwater Crocodile
This document provides a summary of the Deloitte Access Economics Tourism and hotel market outlook. To access the complete edition or to discuss how
 2014 Tourism and hotel market outlook Executive summary edition, July 2014 This document provides a summary of the Deloitte Access Economics Tourism and hotel market outlook. To access the complete edition
Queensland Economic Update
 Queensland Economic Update June 2017 www.cciq.com.au Chamber of Commerce & Industry Queensland The latest national accounts data indicates growth in the Queensland economy remains patchy and the post mining
South Australian Budget June 2014
 South Australian Budget 2014 15 June 2014 On 19 June 2014 South Australian Treasurer the Hon Tom Koutsantonis MP delivered the 2014 15 Budget. The main theme of the Budget is investment in public transport
Media Release. Qantas Group Full Year 2017 Financial Result 1. Sydney, 25 August 2017
 Media Release Qantas Group Full Year 2017 Financial Result 1 Sydney, 25 August 2017 Underlying Profit Before Tax: $1,401 million (second highest in Qantas history) Statutory Profit Before Tax: $1,181 million
MENA HOTEL MARKET REVIEW MUSCAT OMAN 2018
 MENA HOTEL MARKET REVIEW MUSCAT OMAN 2018 www.trimideast.com 1 OMR (billion) MENA HOTEL MARKET REVIEW MUSCAT OMAN 2018 OMAN ECONOMIC OVERVIEW Oman s economy continues to be heavily reliant on hydrocarbons,
Why Invest in Australia?
 Great Barrier Reef Northern Territory Queensland Western Australia South Australia Gold Coast New South Wales Victoria Australian Capital Territory Tasmania Australia is the biggest island in the world;
International Tourism Snapshot
 Australia on a high International visitors to Australia Australia welcomed 7.8m international visitors in the year ending June International visitor expenditure in Australia 2017, more than any previous
QANTAS DELIVERS STRONG FIRST HALF RESULT DESPITE HIGHER FUEL BILL
 ASX and Media Release Sydney, 21 February 2019 QANTAS DELIVERS STRONG FIRST HALF RESULT DESPITE HIGHER FUEL BILL Underlying Profit Before Tax: $780 million (down $179 million) Statutory Profit Before Tax:
DESTINATION GIPPSLAND RESEARCH PROGRAM. Health of Tourism Preliminary Results
 DESTINATION GIPPSLAND RESEARCH PROGRAM Health of Tourism Preliminary Results Mike Ruzzene Director, Urban Enterprise CITY OF GREATER GEELONG OVERVIEW OF THE RESEARCH HEALTH OF TOURISM STUDY BUSINESS SURVEY
South Australian Tourism Industry Council SA Tourism Barometer March Quarter 2015
 South Australian Tourism Industry Council SA Tourism Barometer March Quarter 2015 Headline: Events Season Provides a Lift In the March quarter 2015 survey the business activity index increased by 6% -
Presentation on Results for the 3rd Quarter FY Idemitsu Kosan Co.,Ltd. February 14, 2019
 Presentation on Results for the 3rd Quarter FY 2018 Idemitsu Kosan Co.,Ltd. February 14, 2019 Table of Contents 1. FY 2018 3rd Quarter Results (1) Overview (2) Segment Information 2. Forecast for FY 2018
Gladstone Market Overview
 Gladstone Market Overview Gladstone is currently goging through a rapid phase of economic growth. There is $30 billion worth of engineering construction underway, with the resultant construction-related
NBAA 2014 Business Aviation Market Update. October 2014
 NBAA 2014 Business Aviation Market Update October 2014 1 Jefferies Global Industrials Conference - August 14, 2014 Forward Looking Statements This report contains forward-looking statements within the
New Tourism Strategic Plan Northern Territory
 New Tourism Strategic Plan Northern Territory Submission of Accommodation Association of Australia, 2012 EXECUTIVE SUMMARY Without it being overly detrimental to existing tourism accommodation businesses,
Australia and New Zealand
 Strategy Management Consultancy Australia and New Zealand Regional Analysis knowledge center September update 2018 Contents Australia Australia Market Review 3 Macro indicators 4 Australia key statistics
For personal use only
 ASX and Media Release QANTAS DELIVERS RECORD FIRST HALF PROFIT, INVESTS IN AIRCRAFT AND TRAINING Sydney, 22 February 2018 Underlying Profit Before Tax: $976 million (up 15%) Record results for Qantas Domestic,
NBAA 2015 MARKET UPDATE
 NBAA 2015 MARKET UPDATE November 2015 Forward-Looking Statements 2 This report contains forward-looking statements within the meaning of Section 21E of the Securities Exchange Act of 1934. All statements,
Consideration of application to change cash, Leap and pre-paid fares including monthlies and annual fares from Dublin Bus for 2017
 Consideration of application to change cash, Leap and pre-paid fares including monthlies and annual fares from Dublin Bus for 2017 Determination No. 1-2016 November 2016 1 Table of contents 1 Introduction...
Heathrow (SP) Limited
 Limited") Draft v2.0 10 Feb Heathrow (SP) Limited Results for year ended 31 December 2013 24 February 2014 Strong operational and financial performance in 2013 Passenger satisfaction at record high and over 72 million
Draft v2.0 10 Feb Heathrow (SP) Limited Results for year ended 31 December 2013 24 February 2014 Strong operational and financial performance in 2013 Passenger satisfaction at record high and over 72 million
AIR CANADA REPORTS THIRD QUARTER RESULTS
 AIR CANADA REPORTS THIRD QUARTER RESULTS THIRD QUARTER OVERVIEW Operating income of $112 million compared to operating income of $351 million in the third quarter of 2007. Fuel expense increased 49 per
QLD ECONOMIC OUTLOOK 9 January 2012
 QLD ECONOMIC OUTLOOK 9 January Summary: Queensland is the third largest economy in Australia and comprises a 19.1 share of Australia s GDP. While the mining industry gains much attention, the construction
Australia & New Zealand
 Strategy Management Consultancy Australia & New Zealand Regional Analysis k n o w l e d g e c e n t e r 2017 linesight.com/knowledge Contents Australia Australia Market Review 3 Macro indicators 4 Australia
Aviation Performance in NSW
 Aviation Performance in NSW 2015-16 November 2016 This report by Tourism Futures International for Destination New South Wales reviews the operating environment and aviation performance of Sydney and NSW
Quarterly Aviation Industry Performance
 Quarterly Aviation Industry Performance ALAFCO Aviation Lease and Finance Company K.S.C.P. Quarterly Aviation Industry Performance (March - June 17) Prepared by: Strategic Planning department 1 Quarterly
Heathrow (SP) Limited
 Limited") 28 April 2014 Heathrow (SP) Limited Results for three months ended 31 March 2014 Strong operational and financial performance at the outset of the new regulatory period Highest ever passenger satisfaction
28 April 2014 Heathrow (SP) Limited Results for three months ended 31 March 2014 Strong operational and financial performance at the outset of the new regulatory period Highest ever passenger satisfaction
2017 Major Projects Pipeline Report Adrian Hart, Senior Manager Infrastructure & Mining
 2017 Major Projects Pipeline Report Adrian Hart, Senior Manager Infrastructure & Mining Major Projects Pipeline Report - 2017 Presentation Outline Overview and key findings of the 2017 Pipeline Report
market-view Australian housing markets report Residential construction on the rise - higher and higher?
 Australian housing markets report Residential construction on the rise - higher and higher? Dr Andrew Wilson Chief Economist Domain Group October 2016 Copyright 2016 Dr Andrew Wilson all rights reserved
International Tourism Snapshot
 2007 2008 2009 2010 2011 2012 2013 2014 International Tourism Snapshot International to Australia Avg Stay 2 1 Holiday 3,291,000 8.7% 22.1 (-5.6%) NZ 449,000 6.1% 9 (-6.3%) Asia 3 1,482,000 9. 19.2 (-1.)
Yukon Tourism Indicators Year-End Report Yukon Tourism Indicators Year-End Report 2015
 Yukon Tourism Indicators Overview The Yukon Tourism Indicators is published by the Department of Tourism and Culture as a companion to the monthly Yukon Tourism Visitation Report. This document is intended
Presentation on Results for the 3rd Quarter FY Idemitsu Kosan Co.,Ltd. February 14, 2018
 Presentation on Results for the 3rd Quarter FY 2017 Idemitsu Kosan Co.,Ltd. February 14, 2018 Table of Contents 1. FY 2017 3rd Quarter Results (1) Overview (2) Segment Information 2. Forecast for FY2017
Consideration of application to change cash, Leap and pre-paid fares including monthlies and annual fares from Dublin Bus for 2016
 Consideration of application to change cash, Leap and pre-paid fares including monthlies and annual fares from Dublin Bus for 2016 Determination No. 2-2015 October 2015 1 Table of contents 1 Introduction...
Uncertainty in the demand for Australian tourism
 Uncertainty in the demand for Australian tourism ABSTR This paper conducts a visual examination of the data for both international tourist arrivals and for domestic tourism demand. The outcome of the examination
Virgin Australia Holdings Limited (ASX: VAH) H1 FY18 Results 1
 H1 FY18 Results 1") Virgin Australia Holdings Limited (ASX: VAH) H1 FY18 Results 1 Summary of H1 FY18 Group Outcomes 2 Group Underlying Profit Before Tax of $102.5 million up 142.3% Group Statutory Profit After Tax of $4.4
Virgin Australia Holdings Limited (ASX: VAH) H1 FY18 Results 1 Summary of H1 FY18 Group Outcomes 2 Group Underlying Profit Before Tax of $102.5 million up 142.3% Group Statutory Profit After Tax of $4.4
RESEARCH NOTE. Qantas Group Ltd Neutral
 1 RESEARCH NOTE Qantas Group Ltd Neutral Price: A$5.80 Price Target: A$6.17 ASX: QAN 18 September 2017 Myer Holdings (MYR) reported disappointing FY17 results and guided to a weak start to the FY18 year,
SHORT BREAKS TO NSW INTRODUCTION
 SHORT BREAKS TO NSW March 2016 INTRODUCTION This document provides demographic profile of domestic and international short break 1 visitors to NSW, and their travel behaviour. It makes comparisons in terms
State Tourism Satellite Accounts
 State Tourism Satellite Accounts 2012 13 Acknowledgments The State Tourism Satellite Accounts series has been produced as part of a modelling program established and funded in partnership with the Australian
Index of business confidence. Monthly FTK (Billions) Apr 2014 vs. Apr 2013 YTD 2014 vs. YTD 2013 Apr 2014 vs. Mar 2014
 Apr 2014 vs. Apr 2013 YTD 2014 vs. YTD 2013 Apr 2014 vs. Mar 2014") AIR PASSENGER MARKET ANALYSIS APRIL 2014 KEY POINTS Growth in air travel picked-up in April, rising 7.5% compared to a year ago. This is an acceleration on March, when revenue passenger kilometers increased
AIR PASSENGER MARKET ANALYSIS APRIL 2014 KEY POINTS Growth in air travel picked-up in April, rising 7.5% compared to a year ago. This is an acceleration on March, when revenue passenger kilometers increased
Aviation Performance in NSW
 Aviation Performance in NSW 2017-18 This report by Tourism Futures International for Destination New South Wales reviews the operating environment and aviation performance of Sydney and NSW over 2017 and
Third Quarter Results
 1 Third Quarter 2010-11 Results Highlights of the Third Quarter Passenger business affected by significant disruptions Dynamic cargo activity Strong improvement in results Decline in ex-fuel unit costs
Economic Report. Tasmania December Savills Research. Tasmania - Key Economic Indicators. Highlights
 Savills Research Economic Report Tasmania December 2018 Highlights Tasmania s economic growth for the current annual period has been notably above trend, with the strongest growth rate, on GSP numbers,
State Budget Breakfast
 Welcome to Master Builders SA s State Budget Breakfast July 8, 2016 Ian Markos Chief Executive Officer, Master Builders SA Associate Professor Michael O Neil Executive Director, South Australian Centre
PEAK DOWNTURN UPSWING TROUGH RECOVERY
 MARKET OUTLOOK PROPERTY CYCLE UPSWING PEAK TROUGH DOWNTURN RECOVERY TEN CYCLES SINCE 1880 AVERAGE 8 YEARS 5 YEARS UPSWING @ 11% pa 3 YEARS DOWNTURN @ - 5% pa PAST CYCLES AVG 8.5% PA PROPERTY CYCLE? 1.
Presentation on Results for the 1st Quarter FY Idemitsu Kosan Co.,Ltd. August 14, 2017
 Presentation on Results for the 1st Quarter FY 2017 Idemitsu Kosan Co.,Ltd. August 14, 2017 Table of Contents 1. FY 2017 1st Quarter Financials (1) Overview (2) Segment Information 2. Reference Materials
MAINFREIGHT LIMITED FULL YEAR RESULT TO MARCH 2015
 MAINFREIGHT LIMITED FULL YEAR RESULT TO MARCH 2015 Result Summary NET SURPLUS Net surplus after tax and before abnormal items up 7.7% to $83.48 million REVENUE EBITDA Revenue up 6.8% to $2.05 billion Excluding
AIR PASSENGER MARKET ANALYSIS
 Monthly RPK (Billions) Monthly FTK (Billions) Index of business confidence % change over year AIR PASSENGER MARKET ANALYSIS NOVEMBER 2013 KEY POINTS Air travel markets increased at a solid rate in November,
Victoria s International Tourism Performance
 Victoria s International Tourism Performance Results from International Visitor Survey (IVS) for the year ending December 2018 Data Source: Tourism Research Australia, released March 2019 To note: This
Queensland Budget. August 2017
 Queensland 2017-18 Budget August 2017 Hall Chadwick - Queensland In Focus On 13 June 2017, Queensland Treasurer, the Hon Curtis Pitt MP, delivered the 2017-18 State Budget, which focuses on attracting
Latin America: Outlook and Challenges Alejandro Werner Director Western Hemisphere Department
 International Monetary Fund Washington, DC. May, 3 Latin America: Outlook and Challenges Alejandro Werner Director Western Hemisphere Department Developments and Outlook Policy Challenges and Priorities
The Manager Company Announcements Australian Stock Exchange Limited Sydney NSW Dear Sir. Demerger of BHP Steel
 The Manager Company Announcements Australian Stock Exchange Limited Sydney NSW 2000 Dear Sir Demerger of BHP Steel At the time of the announcement of the creation of the DLC between BHP Limited and Billiton
GRANT THORNTON BANKERS BOOT CAMP
 GRANT THORNTON BANKERS BOOT CAMP Where are we in the cycle? Yield compression slowing, rents growing Yields bottoming but the bottom could last till 2020 The end of yield compression brings income return
Cebu Pacific Air (CEB) Briefing Routes Asia 2012 Chengdu, China
 Briefing Routes Asia 2012 Chengdu, China") Cebu Pacific Air (CEB) Briefing Routes Asia 2012 Chengdu, China April 2012 Outline Who is Cebu Pacific? Business Proposition Support Package Required Who is Cebu Pacific? CEB: The Philippines Largest Carrier
Cebu Pacific Air (CEB) Briefing Routes Asia 2012 Chengdu, China April 2012 Outline Who is Cebu Pacific? Business Proposition Support Package Required Who is Cebu Pacific? CEB: The Philippines Largest Carrier
Presentation on Results for the 2nd Quarter FY Idemitsu Kosan Co.,Ltd. November 14, 2018
 Presentation on Results for the 2nd Quarter FY 2018 Idemitsu Kosan Co.,Ltd. November 14, 2018 Table of Contents 1. FY 2018 2nd Quarter Financials (1) Overview (2) Segment Information 2. Reference Materials
COFFS HARBOUR MARKETSNAPSHOT
 MARKETSNAPSHOT NEW SOUTH WALES The Mid North Coast region is ranked fourth in Australia for business confidence with its regional economy growing at a healthy 4.1% p.a. and produces an annual Gross Regional
Index of business confidence. Monthly FTK (Billions) May 2014 vs. May 2013 YTD 2014 vs. YTD 2013 May 2014 vs. Apr 2014
 May 2014 vs. May 2013 YTD 2014 vs. YTD 2013 May 2014 vs. Apr 2014") AIR PASSENGER MARKET ANALYSIS MAY 2014 KEY POINTS Air travel markets rose by a strong 6.2% in May compared to a year ago. Although this is slightly down on April growth of 7.6%, April was positively biased
AIR PASSENGER MARKET ANALYSIS MAY 2014 KEY POINTS Air travel markets rose by a strong 6.2% in May compared to a year ago. Although this is slightly down on April growth of 7.6%, April was positively biased
Benchmarking Travel & Tourism in Russia
 Benchmarking Travel & Tourism in Russia How does Travel & Tourism compare to other sectors? Sponsored by: Summary of Findings, November 2013 Outline Introduction... 3 Russia summary..... 8 Data sources
Benchmarking Travel & Tourism in Australia
 Benchmarking Travel & Tourism in Australia How does Travel & Tourism compare to other sectors? Sponsored by: Summary of Findings, November 2013 Outline Introduction... 3 Australia summary..... 8 Data sources
TRANSPORT AFFORDABILITY INDEX
 TRANSPORT AFFORDABILITY INDEX Report - March 2018 AAA 1 AAA 2 Table of contents Foreword 4 Section One Overview 6 Section Two Summary of Results 8 Section Three Detailed Results 14 Section Four State by
Alberto Calderon Group Executive and Chief Executive Aluminium, Nickel and Corporate Development
 Port Hedland, Iron Ore, Australia Alberto Calderon Group Executive and Chief Executive Aluminium, Nickel and Corporate Development Economic and Social Outlook Conference 1 November 2012 Disclaimer Forward
TOURISM: SUPERCHARGING AUSTRALIA S FUTURE
 TOURISM: SUPERCHARGING AUSTRALIA S FUTURE In partnership with ABOUT TTF The Tourism & Transport Forum (TTF) is the peak industry group for the Australian tourism, transport, aviation and investment sectors.
International economic context and regional impact
 Contents I. GDP growth trends in Latin America and the Caribbean in 2012 II. Regional performance in 2012: Inflation, employment and wages External sector Policies: Fiscal and Monetary III. Conclusions
BUILDING INDUSTRY OUTLOOK 2018
 BUILDING INDUSTRY OUTLOOK 2018 Welcome to the 2018 edition of Master Builders Building industry outlook, a snapshot of the state of Queensland s building and construction industry. Contents Foreword...3
Presentation on Results for the 3rd Quarter FY Idemitsu Kosan Co.,Ltd. February 2, 2016
 Presentation on Results for the 3rd Quarter FY 2015 Idemitsu Kosan Co.,Ltd. February 2, 2016 Table of Contents 1. 3 rd Quarter FY 2015 Financials (1) Overview (2) Segment Information 2. Forecast for FY
5th NAMIBIA TOURISM SATELLITE ACCOUNT. Edition
 5th NAMIBIA TOURISM SATELLITE ACCOUNT Edition PREFACE I am pleased to present to you the 5 th edition of the Tourism Satellite Account (TSA). TSA is an accounting framework and economic statistical tool
Gold Coast: Modelled Future PIA Queensland Awards for Planning Excellence 2014 Nomination under Cutting Edge Research category
 Gold Coast: Modelled Future PIA Queensland Awards for Planning Excellence 2014 Nomination under Cutting Edge Research category Jointly nominated by SGS Economics and Planning and City of Gold Coast August
AEROFLOT ANNOUNCES FY 2017 IFRS FINANCIAL RESULTS
 AEROFLOT ANNOUNCES FY 2017 IFRS FINANCIAL RESULTS Moscow, 1 March 2018 Aeroflot Group ( the Group, Moscow Exchange ticker: AFLT) today publishes its audited financial statements in accordance with International
1Q FY2014/15. Financial Results Presentation. 13 August 2014 S Y D N E Y M E L B O U R N E B R I S B A N E C A I R N S
 1Q FY2014/15 Financial Results Presentation 13 August 2014 S Y D N E Y M E L B O U R N E B R I S B A N E C A I R N S B E I J I N G T O K Y O O S A K A S I N G A P O R E Disclaimer This presentation on
Hello everyone, I am Shinichiro Ito, President and CEO of All Nippon Airways.
 ANA2011 1 Hello everyone, I am Shinichiro Ito, President and CEO of All Nippon Airways. Thank you for taking the time to join us today for our two-year corporate plan briefing for fiscal 2011 and 2012.
Australian Cities Accounts
 Australian Cities Accounts 2013-14 November 2014 Australian Cties Accounts This report has been prepared by SGS Economics and Planning. SGS Economics and Planning are not liable to any person or entity