MPSEZ Operational Achievements
|
|
|
- Ariel York
- 5 years ago
- Views:
Transcription

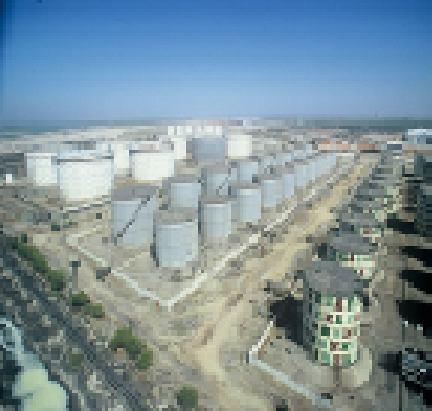


1 Presentation To Board of Directors Mundra Port and Special Economic Zone Ltd. 59th Board Meeting 07 th February, 2011
2 MPSEZ - Recent Highlights 2
3 MPSEZ Operational Achievements Sr. No Particulars Unit Achievements Previous Best Qty Month Qty Month 1 Highest TEUs Handled ('000) Nos Dec' Aug'10 2 Highest Number of Rakes Handled Nos. 792 Dec' Oct'10 3 Highest Cargo Handled MMT 4.55 Dec' Oct'10 Handling more than 1,00,000 TEUs consecutively for last 6 months. 3
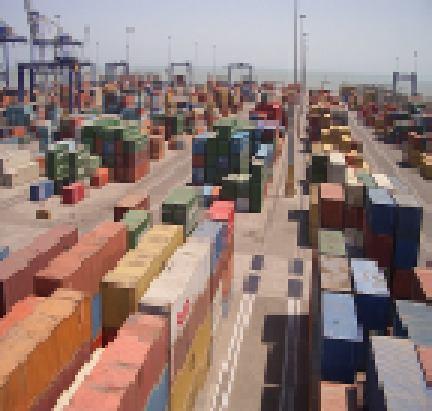
4 Cargo at Indian Ports: April- 10 to December-10 Ports Total Cargo (mmt) Rs. Lacs Total Container Cargo (000' TEUs) April-Dec April-Dec April-Dec April-Dec YoY FY11 FY10 FY11 FY10 Kolkata % % Haldia % % Paradip % % Visakhapatnam % % Ennore % - - Chennai % % Tuticorin % % Cochin % % New Mangalore % % Mormugao % % Mumbai % % J.N.P.T % % Kandla % % Major Ports % % Mundra Port % % All Ports % % YoY Mundra Port s Market Share up at 8.28% from 6.75% Source: Indian Port Association 4
5 Cargo at Indian Ports: April 10 to December 10: Mundra # 7th 61.4 In mmt Total Cargo Container Cargo In 000 TEUs
6 Operations Highlights - Q V/s Q (YoY) Particulars PoP Oct 10 - Dec 10 Oct 09 - Dec 09 % Vessels Called at Port % GRT (mmt) % Cargo Handled (mmt) % Dry Cargo (mmt) % (% of total cargo) 46% 41% Liquid Cargo (Incl HPCL) (mmt) % (% of total cargo) 15% 18% Bulk (mmt) % (% of total cargo) 61% 58% Crude (mmt) % (% of total cargo) 8% 14% Containers (mmt) % (% of total cargo) 32% 28% Railway Rakes (nos) 2,195 1,156 90% Cargo Moved by Rails (mmt) % (% of Dry & Container) 47% 37% 6

7 Cargo Handled Q V/s Q MT 2.61 MT 2.35 MT Oct 10 to Dec 10: MMT Oct 09 to Dec 09: MMT 7
8 Operations Highlights - FY V/s FY V/s FY (YoY) Particulars PoP Apr 10 - Dec 10 Apr 09 - Dec 09 % Vessels Called at Port 1,894 1,774 7% GRT (mmt) % Cargo Handled (mmt) % Dry Cargo (mmt) % (% of total cargo) 43% 36% Liquid Cargo (Incl HPCL) (mmt) % (% of total cargo) 15% 17% Bulk (mmt) % (% of total cargo) 58% 54% Crude (mmt) % (% of total cargo) 13% 19% Containers (mmt) % (% of total cargo) 29% 27% Railway Rakes (nos) 5,807 3,628 60% Cargo Moved by Rails (mmt) % (% of Dry & Container) 45% 43% 8

9 Cargo Handled 9M V/s 9M (YoY) Apr 10 to Dec 10: MMT Apr 09 to Dec 09: MMT 9
10 MPSEZL Financial Performance (Rs. Lacs) Sr. No. Particulars Quarter Ended Quarter Ended Period Ended Period Ended Year Ended (unaudited) (unaudited) (unaudited) (unaudited) (audited) 1 a. Net Sales / Income from Operations 42,079 30, ,909 92, ,913 b. Other Operating Income 2,997 2,794 6,085 4,627 11,339 Total Income 45,077 33, ,993 97, ,252 2 Expenditure a. Operating Expenses 10,951 7,034 29,528 19,294 28,714 b. Employees Cost 1,483 1,415 4,891 3,809 5,408 c. Depreciation / Amortisation 5,312 4,331 14,922 11,801 16,814 d. Administrative and Other Expenses 1,662 2,271 6,268 5,429 10,961 Total Expenditure 19,408 15,051 55,609 40,333 61,897 3 Profit from Operations before Other Income, Finance Cost and Tax(1-2) 25,669 18,733 72,384 56,865 77,355 4 Other Income ,112 2,641 3,108 5 Profit before Finance Cost and Tax(3+4) 25,757 18,919 73,497 59,506 80,463 6 Finance Cost (net) 1, ,711 4,155 4,417 7 Profit after Finance Cost but before tax (5-6) 24,430 18,355 68,786 55,351 76,045 8 Tax Expense 1,583 2,029 3,643 4,471 5,948 9 Net Profit after Tax for the period (7-8) 22,847 16,326 65,143 50,880 70,098 10

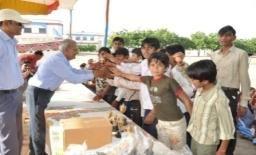

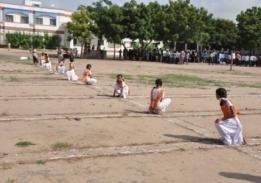
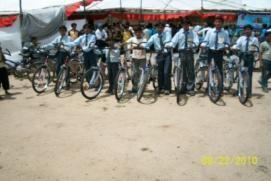
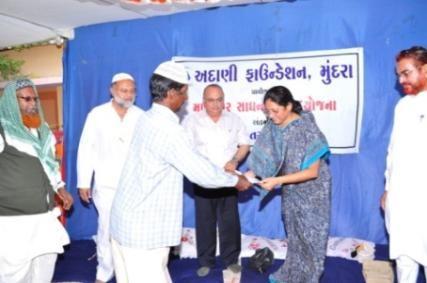
11 Corporate Social Responsibilities 11
12 Corporate Social Responsibilities Adani Foundation under Education program initiatives: 4 balwadis functioning at labour colonies benefitting 180 children. Distribution of 549 cycles to school children. Arranged exposure tour for 55 teachers of 17 schools to observe the benefits model schools of Pragya project Maths and science exhibition 103 schools participated with 65 working models made by 131 students. Sports competition Sponsored Khel Mahakumbh event held at Bhadreshwar and Mundra. Distribution of magazines at 103 schools and 6 support schools related to health of Mundra taluka and 15 schools of Mandvi Taluka. Adani Foundation under Community Health initiatives: Rural clinics 3 clinics at Shiracha, Navinal and Tunda Vandh benefiting 5849 patients. Mobile dispensary running in 33 villages and fishermen vasahats benefiting patients. Mamta divas celebrated at 2 villages to create awareness on health, hygiene & child care and nutrition benefiting 67 mothers. General health camps: 7 camps benefiting 1140 patients. Gynec camps: 4 Gynec camps benefiting 217 women in 4 villages. Blood Donation Camp: organized on World AIDS days units of blood collected HIV / AIDS awareness camp/shows: 5 shows organized 750 participants Kidney Stone Project 8 camps at 8 villages out of 1205 total patients 238 examined for Kidney stone 12
13 Corporate Social Responsibilities Adani Foundation under Sustainable Livelihood Development initiatives: Awareness meetings with cattle owners: 4 meetings benefitting 56 cattle owners. Cattle camps:10 camps benefitting cattle and 485 cattle owners Drip irrigation: 68 beneficiaries have received a total benefit of Rs.30,37,494 against the 25% subsidy under drip irrigation system. LMV Driver s training; 20 participants already undertook the training. 2nd batch of 21 trainees going on Adani Foundation under Rural Infrastructure Development initiatives: Drainage project with individual village STP construction continue at 16 villages benefiting more than villagers The following infrastructure facilities were created at the villages: ITI Infrastructure Facilities, Mundra Community Hall Mangra and Luni Computer Hall Bhadreshwar Cow Shed wall Bhadreshwar and Pavadiyara School Boundary Wall Kukadsar School Repair work Shiracha and Navinal Fish Landing Shed - Luni Bandar Painting work of school Tunda Vandh 13
14 Thank You 14
INDIA CALLING 2009 RAHUL ASTHANA MUMBAI PORT TRUST, CHAIRMAN, BRUSSELS, 1st OCTOBER 2009 PORT LOGISTICS AND INFRASTRUCTURE DEVELOPMENT IN INDIA
 INDIA CALLING 2009 PORT LOGISTICS AND INFRASTRUCTURE DEVELOPMENT IN INDIA By RAHUL ASTHANA CHAIRMAN, MUMBAI PORT TRUST, BRUSSELS, 1st OCTOBER 2009 India Giant Strides Sustained high GDP growth 9% in 2007-08.
Ports in India 2014 Dredging in India 2014
 Two New Reports Ports in India 2014 Dredging in India 2014 Sector Analyses and Market Opportunities These reports are published by, a sister division of Indian Infrastructure magazine. publishes reports
All Time High Quarter I Results, FY Net Sales up 35.7 %, EBITDA up 65.6 %, Net profit up 55.8%
 All Time High Quarter I Results, FY 2014-15 Net Sales up 35.7 %, EBITDA up 65.6 %, Net profit up 55.8% Mumbai, July 30, 2014: Pharma Major, Lupin Ltd. reported its performance for the first quarter ending
Financial Results Q1 FY September 2017
 Financial Results Q1 FY18 12 September 2017 2 Key Highlights Q1FY18 Net profit after tax of INR 58cr Ninth successive profitable quarter for the Group Gross debt reduced by INR 398cr and net debt almost
PORTS. November 2010
 PORTS November 2010 PORTS November 2010 Contents Advantage India Market overview Industry infrastructure Investments Policy and regulatory framework Opportunities Industry associations 2 ADVANTAGE INDIA
Golden Ocean Group Limited Q results March 1, 2007
 Golden Ocean Group Limited Q4 2006 results March 1, 2007 PROFIT & LOSS 2005 2006 (in thousands of $) 2006 2005 Oct-Dec Oct-Dec Jan - Dec Jan - Dec Operating Revenues 37 292 91 253 Time charter revenues
Financial Results Q3 FY February 2016
 Financial Results Q3 FY17 03 February 2016 2 Agenda Key performance highlights Jet Airways performance highlights 3 Key highlights Net profit after tax of INR 156.3 crores - Seventh successive profitable
JET AIRWAYS (I) LTD. Presentation on Financial Results Q July 24, 2009
 LTD. Presentation on Financial Results Q July 24, 2009") JET AIRWAYS (I) LTD Presentation on Financial Results Q1 2010 July 24, 2009 1 1 1 Agenda Domestic operating environment Jet Airways performance highlights JetLite performance highlights Outlook 2 2 2 Domestic
JET AIRWAYS (I) LTD Presentation on Financial Results Q1 2010 July 24, 2009 1 1 1 Agenda Domestic operating environment Jet Airways performance highlights JetLite performance highlights Outlook 2 2 2 Domestic
JET AIRWAYS (I) LTD. Presentation on Financial Results Q3 2012
 LTD. Presentation on Financial Results Q3 2012") JET AIRWAYS (I) LTD Presentation on Financial Results Q3 2012 20.01.2012 1 1 1 Domestic operating environment 2 2 2 Domestic industry. 8.00 7.00 6.00 5.00 4.00 3.00 Q3 12 vs Q3 11 Industry capacity 17%
JET AIRWAYS (I) LTD Presentation on Financial Results Q3 2012 20.01.2012 1 1 1 Domestic operating environment 2 2 2 Domestic industry. 8.00 7.00 6.00 5.00 4.00 3.00 Q3 12 vs Q3 11 Industry capacity 17%
Indiabulls Real Estate Limited (CIN : L45101DL2006PLC148314)
") Indiabulls Real Estate Limited (CIN : L45101DL2006PLC148314) Earnings Update Audited Financial Results FY 2013-14 April 23, 2014 Safe Harbor Statement This document contains certain forward looking statements
Indiabulls Real Estate Limited (CIN : L45101DL2006PLC148314) Earnings Update Audited Financial Results FY 2013-14 April 23, 2014 Safe Harbor Statement This document contains certain forward looking statements
Financial Results Q3FY February
 Financial Results Q3FY18 14 February Key Highlights Q3FY18 Net profit after tax of INR 186cr Eleven successive profitable quarters for the Group Operating revenue increased by 10.2% and PLF% by 4.4pts
JET AIRWAYS (I) LTD. Presentation on Financial Results Q2 FY10
 LTD. Presentation on Financial Results Q2 FY10") JET AIRWAYS (I) LTD Presentation on Financial Results Q2 FY10 October 27, 2009 1 1 1 Agenda Domestic operating environment Jet Airways performance highlights JetLite performance highlights Outlook 2 2
JET AIRWAYS (I) LTD Presentation on Financial Results Q2 FY10 October 27, 2009 1 1 1 Agenda Domestic operating environment Jet Airways performance highlights JetLite performance highlights Outlook 2 2
Financial Results Q2 FY December 2017
 Financial Results Q2 FY18 07 December 2017 2 Key Highlights Q2FY18 Net profit after tax of INR 71cr Ten successive profitable quarters for the Group Net debt reduced during the quarter by INR 194cr Continued
Financial Results Q2 FY December 2017
 Financial Results Q2 FY18 07 December 2017 2 Key Highlights Q2FY18 Net profit after tax of INR 71cr Ten successive profitable quarters for the Group Net debt reduced during the quarter by INR 194cr Continued
Multimodal Logistics Professionals
 Multimodal Logistics Professionals 1 CONCOR - THE COMPANY INCORPORATED - MARCH 1988 OPERATIONAL - NOVEMBER 1989 AUTHORISED CAPITAL - Rs.400 CRORE SHARE CAPITAL - Rs.64.99 CRORE (RECEIVED DURING 1988-89
Feb 6 th, 2007 Japan Airlines Corporation
 Feb 6 th, 2007 Japan Airlines Corporation 0 Table of Contents JAL Group Q3 AccountSettlement For FY2006. Q3 Account Settlement For FY2006 Outline of the Consolidated Financial StatemeP3 Revision of Revenue
Summary of Results for the First Three Quarters FY2015/3
 Summary of Results for the First Three Quarters FY2015/3 February 10, 2015 Tokyu Corporation (9005) http://www.tokyu.co.jp/ Contents Ⅰ.Executive Summary 2 Ⅱ.Conditions in Each Business 5 Ⅲ.Details of Financial
January 2018 Air Traffic Activity Summary
 January 2018 Air Traffic Activity Summary Jan-2018 Jan-2017 CY-2018 CY-2017 Passengers 528,947 505,421 4.7% 528,947 505,421 4.7% Passengers 537,332 515,787 4.2% 537,332 515,787 4.2% Passengers 1,066,279
Financial Results Q3 FY16
 Financial Results Q3 FY16 6 February 2016 Agenda Key performance highlights Jet Airways performance highlights JetLite performance highlights 2 Key highlights Highest ever quarterly and period profit Jet
JET AIRWAYS (I) LTD. Presentation on Financial Results Q4 FY08
 LTD. Presentation on Financial Results Q4 FY08") JET AIRWAYS (I) LTD Presentation on Financial Results Q4 FY08 June 24, 2008 1 1 1 Agenda Domestic operating environment Jet Airways performance highlights JetLite performance highlights Consolidated Jet
JET AIRWAYS (I) LTD Presentation on Financial Results Q4 FY08 June 24, 2008 1 1 1 Agenda Domestic operating environment Jet Airways performance highlights JetLite performance highlights Consolidated Jet
PPP Days 2010 PPPs Lessons from the Last 18 Months
 PPP Days 2010 PPPs Lessons from the Last 18 Months Rajiv B Lall March 22, 2010 1 Private Sector Participation (PSP) in India Works & Services Contracts Management Contracts Operation Concessions Build
Summary of Results for the First Quarter of FY2015/3
 Summary of for the First Quarter of FY2015/3 August 8, 2014 Tokyu Corporation (9005) http://www.tokyu.co.jp/ Contents Ⅰ.Executive Summary 2 Ⅱ.Conditions in Each Business 4 Ⅲ.Details of Financial for the
Financial Results Q2 FY November 2016
 Financial Results Q2 FY17 11 November 2016 2 Agenda Key performance highlights Jet Airways performance highlights 3 Key highlights Net profit after tax of INR 84.9 crores - Sixth successive profitable
Now Available. Urban Rail Transport. in India Urban Bus Transport. in India India Infrastructure Research.
 Now Available Two New Research Reports on Urban Rail Transport in India 2011 & Urban Bus Transport in India 2011 India Infrastructure Research www.indiainfrastructure.com Table of Contents URBAN RAIL TRANSPORT
Certain statements in this release concerning Jet Airways future growth prospects are forward-looking statements, which involve a number of risks,
 Certain statements in this release concerning Jet Airways future growth prospects are forward-looking statements, which involve a number of risks, and uncertainties that could cause actual results to differ
Sagarmala Development Company (SDC)
") Sagarmala Development Company (SDC) Sagarmala Programme moving from planning to implementation stage Projects under Sagarmala will be implemented by Central Ministries, State Governments, Ports / Agencies
Sagarmala Development Company (SDC) Sagarmala Programme moving from planning to implementation stage Projects under Sagarmala will be implemented by Central Ministries, State Governments, Ports / Agencies
Jet Airways (India) Ltd. Presentation on Financial Results Q3 FY th January 2008
 Ltd. Presentation on Financial Results Q3 FY th January 2008") Jet Airways (India) Ltd. Presentation on Financial Results Q3 FY08 28 th January 2008 1 1 1 Agenda Performance highlights Q3 FY08 Apr - Dec FY08 Outlook JetLite performance highlights 2 2 2 Performance
Jet Airways (India) Ltd. Presentation on Financial Results Q3 FY08 28 th January 2008 1 1 1 Agenda Performance highlights Q3 FY08 Apr - Dec FY08 Outlook JetLite performance highlights 2 2 2 Performance
Financial Results 3 rd Quarter MAR/2016 (FY2015)
") Financial Results MAR/2016 (FY2015) January 29 th, 2016 CONTENTS P.1 P.2 P.3 P.4~ Overview of FY MAR/16 Results Operating Revenue Operating Profit 1,030 1,020 1,010 +1.0Bn 1,022.3 1,023.4 (+0.1%) 180 160
Financial Results MAR/2016 (FY2015) January 29 th, 2016 CONTENTS P.1 P.2 P.3 P.4~ Overview of FY MAR/16 Results Operating Revenue Operating Profit 1,030 1,020 1,010 +1.0Bn 1,022.3 1,023.4 (+0.1%) 180 160
Outline. (1) JICA and India. (2) Infrastructure Development. (3) Cross-Border Connectivity
 JICA and India. (2) Infrastructure Development. (3) Cross-Border Connectivity") 1 Outline (1) JICA and India (2) Infrastructure Development (3) Cross-Border Connectivity 2 Outline (1) JICA and India (2) Infrastructure Development (3) Cross-Border Connectivity 3 About JICA JICA is
1 Outline (1) JICA and India (2) Infrastructure Development (3) Cross-Border Connectivity 2 Outline (1) JICA and India (2) Infrastructure Development (3) Cross-Border Connectivity 3 About JICA JICA is
D_HO_V ER1 GL_ P03 GL_6030
 < EVDRE ID="BPC- CYB 001-00001"/>< EVDRE ID="BPC- CYF 004-00001"/>< EVDRE ID="BPC- CYF 001-00001"/>< C C_500377 6013-40.00000 00 6018-10.00000
Railways in India 2012
 NOW AVAILABLE Report on Railways in India 2012 RAILWAYS IN INDIA 2012 Table of Contents SECTION I: MACRO ANALYSIS 1. Executive Summary.................................... 2. Sector Overview.......................................
 1 2 23 24 15 16 7 8 9 Ancillary Revenue target per pax RM55 10 Online 365 11 212 13 14 14 Quarter Ended: 31 March RM'000 Revenue 2,068,227 Operating expenses: - Staff costs (286,663) - Depreciation
Cathay Pacific Airways Interim Results for the six months ended 30 June 2012
 Cathay Pacific Airways Interim Results for the six months ended 30 June 2012 8 August 2012 1 Interim Result 1H2012 1H2011 Change Group attributable (loss) / profit HK$ million (935) 2,808-133.3% Group
SAS Group Q Teleconference
 SAS Group Q4 2012 Teleconference December 12, 2012 1 Break-even result in 2012 despite 1.6 bn SEK higher fuel cost 23 MSEK EBT (before non-recurring items) despite 1.6 bn SEK higher fuel cost Positive
FENIX OUTDOOR INTERNATIONAL AG Interim condensed consolidated financial statement for the period ended 30 September 2017
 FENIX OUTDOOR INTERNATIONAL AG Interim condensed consolidated financial statement for the period ended 30 September 2017 Third quarter 2017-07-01 2017-09-30 Period 2017-01-01 2017-09-30 Events after period
_VER1 CC_ PC_5000 FA_21500 C </CELL ><CELL> HO_ADJ 2015.P02 GL_6290 _VER1 GL_6010 PC_5000 FA_21500 C
 < EVDRE ID="Head count Roll Forward 001-00001"/>< EVDRE ID="BPC- CYB 004-00001"/>< EVDRE ID="BPC- CYB 001-00001"/>< EVDRE ID="BPC- CYF 004-00001"/>< EVDRE
TNPA 2 nd Strategic Customer Forum Update on Infrastructure Projects. 13 August
 TNPA 2 nd Strategic Customer Forum Update on Infrastructure Projects 13 August 2014 1 THE TNPA WORLD OF PORT INFRASTRUCTURE Complete Pixman Images 2010 Dredging International - Pallieter Overview of Presentation
Reference List for Cathodic Protection of LPG Mounded Bullets using AnodeFlex
 Reference List for Cathodic Protection of using AnodeFlex Cathodic Protection Projects Executed / Under Execution for 210 Nos Amounting to Total Value of Rs. 25.0 Crores (Bullet Dimensions ranging from:
JET AIRWAYS (I) LTD. Financial Results Q1 FY09
 LTD. Financial Results Q1 FY09") JET AIRWAYS (I) LTD Presentation on Financial Results Q1 FY09 July 29, 2008 1 1 1 Agenda Domestic operating environment Jet Airways performance highlights JetLite performance highlights Outlook 2 2 2 Domestic
JET AIRWAYS (I) LTD Presentation on Financial Results Q1 FY09 July 29, 2008 1 1 1 Agenda Domestic operating environment Jet Airways performance highlights JetLite performance highlights Outlook 2 2 2 Domestic
Half-yearly Report 2013
 Half-yearly Report 2013 Financial result unchanged PORT OF ROTTERDAM THROUGHPUT DECREASED SLIGHTLY Throughput in the port of Rotterdam in the first half of the year decreased by 0.9% compared to the first
SIA GROUP FINANCIAL RESULTS
 FINANCIAL RESULTS For Ended 30 June 2018 197200078R Operating Result Q1 Q1 Better/ FY18/19 FY17/18 R1 (Worse) ($M) ($M) (%) Total Revenue 3,844 3,864 (0.5) Q1 Better/ FY17/18 R2 (Worse) ($M) (%) 3,689
List of RCS Airports and routes Started under UDAN-1 & 2 20 Aug 2018
 Sr. No Airport Commencement date Un served 1. ADAMPUR 01-May-18 2. BHATINDA 27-Apr-17 3. BIKANER (NAL) 26-Sep-17 4. JAISALMER 29-Oct-17 5. JALGAON 23-Dec-17 6. KANDLA 10-Jul-17 7. KOLHAPUR 08-Apr-18 8.
OPERATING AND FINANCIAL HIGHLIGHTS
 Copa Holdings Reports Financial Results for the Fourth Quarter of 2018 Excluding special items, adjusted net profit came in at $44.0 million, or Adjusted EPS of $1.04 Panama City, Panama --- February 13,
Jet Airways (India) Ltd. Presentation on Annual Results FY06. May 2006
 Ltd. Presentation on Annual Results FY06. May 2006") Jet Airways (India) Ltd. Presentation on Annual Results FY06 May 2006 1 Agenda 1. Performance Highlights 2. Sahara Acquisition Update 3. Outlook 2 Performance Highlights 3 Domestic landscape capacity growth
Jet Airways (India) Ltd. Presentation on Annual Results FY06 May 2006 1 Agenda 1. Performance Highlights 2. Sahara Acquisition Update 3. Outlook 2 Performance Highlights 3 Domestic landscape capacity growth
Analysts Briefing. 18 March Cathay Pacific Airways Limited
 Analysts Briefing 18 March 2015 Cathay Pacific Airways Limited Annual Results 2014 2013 Change Group attributable profit HK$m 3,150 2,620 +20.2% Group turnover HK$m 105,991 100,484 +5.5% Profit margin
SECTION B GUJARAT NRE COKE LIMITED
 SECTION B GUJARAT NRE COKE LIMITED 11 A SNAPSHOT Largest independent producer of Metallurgical Coke in India Listed on BSE & NSE, with a market capitalisation of around USD 0.85 billion (No. of shareholders
Monitorable Targets & Milestones for INFRASTRUCTURE SECTOR : Planning Commission, Government of India
 Page 1 of 1 S.No. Name of the Scheme Actual 2009-10 Expenditure in 2010-11 (Cumulative) (Rs. In Crores) Grand Total 2010-11 1st Qtr 2nd Qtr 3rd Qtr 4th Qtr 1 CSI Airport Mumbai Target 570.00 982.00 1645.00
Summary o f Results for the First Half of FY2018
 Summary o f Results for the First Half of FY2018 November 9, 2018 (9005) https://www.tokyu.co.jp/ Contents Ⅰ.Executive Summary 2 Ⅱ.Conditions in Each Business 6 Ⅲ.Details of Financial Results for the 13
CWC LA - Cash Balance (January 2012)
") CWC LA - Cash Balance 2012-13 (January 2012) 1,200,000 Cash Balance 1,000,000 800,000 ($1,000s) 600,000 400,000 200,000 - CWC LA - Actuals/Projected CWC LA - ed (Nov) 1 1 CWC Hollywood - Financial Dashboard
CWC LA - Cash Balance 2012-13 (January 2012) 1,200,000 Cash Balance 1,000,000 800,000 ($1,000s) 600,000 400,000 200,000 - CWC LA - Actuals/Projected CWC LA - ed (Nov) 1 1 CWC Hollywood - Financial Dashboard
March 2014 Passenger and Cargo Traffic Statistics Reno-Tahoe International Airport
 March 2014 Passenger and Cargo Traffic Statistics Reno-Tahoe International Airport April 25, 2014 U.S. DOMESTIC INDUSTRY OVERVIEW FOR MARCH 2014 All RNO Carriers Domestic Systemwide year over year comparison
Religare Health Trust 1 st Annual General Meeting. 25 th July 2013
 Religare Health Trust 1 st Annual General Meeting 25 th July 2013 Disclaimer This presentation may contain forward-looking statements that involve risks and uncertainties. Actual future performance, outcomes
Key Highlights Q4FY18
 Key Highlights Q4FY18 Net loss after tax of INR 1,040cr Q4FY18 results adversely impacted on account of: Year-on-Year impact of increase in fuel prices of INR 366 crores; Mark-to-market adjustment due
JAPAN AIRLINES Co., Ltd. Financial Results 3 rd Quarter Mar/2018(FY2017) January 31, 2018
 January 31, 2018") JAPAN AIRLINES Co., Ltd. Financial Results 3 rd Quarter Mar/2018(FY2017) January 31, 2018 Today s Topics P.1 P.2 P.3 P.12 JAL Corporate Website the CONTRAIL Project Overview of Financial Results for 3
JAPAN AIRLINES Co., Ltd. Financial Results 3 rd Quarter Mar/2018(FY2017) January 31, 2018 Today s Topics P.1 P.2 P.3 P.12 JAL Corporate Website the CONTRAIL Project Overview of Financial Results for 3
--- Disclosure A uirements) A~ulatlons October 24, 2018 IGAUSECT / /1 0
 A~ulatlons October 24, 2018 IGAUSECT / /1 0") October 24, 2018 IGAUSECT /1 0-1 8/1 0 To National Stock Exchange of India limited Exchange Plaza, C - 1, Block G Sandra Kurla Complex Sandra - (E) Mumbai - 400 051 Symbol: INDIGO To Department of Corporate
October 24, 2018 IGAUSECT /1 0-1 8/1 0 To National Stock Exchange of India limited Exchange Plaza, C - 1, Block G Sandra Kurla Complex Sandra - (E) Mumbai - 400 051 Symbol: INDIGO To Department of Corporate
The Residential Outlook for South Australia
 The Residential Outlook for South Australia Matthew King Economist HOUSING INDUSTRY ASSOCIATION February 2011 Overview Economic backdrop Other important matters Interest rates & bank lending Renovations
SAS Group Presentation Carnegie, May 22, 2012 Sture Stölen, Head of IR
 SAS Group Presentation Carnegie, May 22, 2012 Sture Stölen, Head of IR 1 This is the SAS Group 128 destinations 27,2 million passengers 28 new routes to be launched 2012 1,085 daily flights Revenues 2011,
With the completion of this project, we would like to follow-up on the projections as well as highlight a few other items:
 TO: FROM: Mayor and Council Interim City Manager Rebecca Underhill, Director of Finance DATE: February 28, 2014 SUBJECT: Water Meter Project Analysis On March 28, 2012, Acting City Manager Mike Loftin
GMR Infrastructure Limited (GIL) FY17 Performance Highlights
 FY17 Performance Highlights") GMR Infrastructure Limited (GIL) FY17 Performance Highlights Gross Debt comes down significantly to INR 19,856 Cr from INR 37,480 Cr Net Debt to EBITDA for FY 17 improves to 4.3 from 10.2 in FY 16 Stellar
GMR Infrastructure Limited (GIL) FY17 Performance Highlights Gross Debt comes down significantly to INR 19,856 Cr from INR 37,480 Cr Net Debt to EBITDA for FY 17 improves to 4.3 from 10.2 in FY 16 Stellar
Q4 & FULL YEAR FY15 RESULTS UPDATE MAY 2015
 Q4 & FULL YEAR FY15 RESULTS UPDATE MAY 2015 DISCUSSION SUMMARY Q4 & FY15 RESULTS HIGHLIGHTS OUR PORTFOLIO UPDATE AMUSEMENT PARK, BANGALORE RESORT, BANGALORE AMUSEMENT PARK, KOCHI AMUSEMENT PARK, HYDERABAD
Brigade Group. Investor Presentation Q2 FY
 Brigade Group Investor Presentation Q2 FY 2014 15 Q2 FY 15 Key Highlights Standalone Q2 FY 2014 15 Revenue of Rs. 3.29 Bn (82% Y o Y increase) and PAT of Rs. 0.22 Bn (13% Y o Y increase) Standalone YTD
Investor Relations Update January 25, 2018
 General Overview Investor Relations Update Accounting Changes On January 1, 2018, the company adopted two new Accounting Standard Updates: (ASUs): ASU 2014-9: Revenue from Contracts with Customers (the
GRI Report 2017 Key Figures / Finance 4
 GRI Report 2017 Key Figures / Finance 4 Key Figures In fiscal year 2017, Fraport began implementing its strategy developed based on the mission statement implemented in 2015/2016. The mission statement
OPERATING AND FINANCIAL HIGHLIGHTS. Subsequent Events
 Copa Holdings Reports Net Income of $103.8 million and EPS of $2.45 for the Third Quarter of 2017 Excluding special items, adjusted net income came in at $100.8 million, or EPS of $2.38 per share Panama
SUB:CSWIP3.1/3.2.2/PAINTING INSPECTION COURSES &EXAM DETAILS
 1 SUB:CSWIP3.1/3.2.2/PAINTING INSPECTION COURSES &EXAM DETAILS This refers to your enquiry by mail details of requirements of CSWIP 3.1/3.2.2, B.GAS Course and Examination details are given below, please
Nicco Parks & Resorts Ltd BSE Scrip Code:
 Nicco Parks & Resorts Ltd BSE Scrip Code: 526721 Other Leisure Facilities September 14, 2012 Equity Statistics Current Market Price Rs. 15.9 52 Week High / Low Rs. 24.4/15.2 Market Capitalisation Rs. crores
Green Award Tariffs
 1 CRUDE OIL TANKERS, PRODUCT TANKERS, LNG CARRIERS 1.1 Certification tariff Application Annual 2,000-10,000 2,930 1,860 10,001-20,000 4,245 2,685 20,001-50,000 5,020 3,130 50,001-150,000 5,695 3,575 150,001-250,000
AIRPORTS IN INDIA 2017 Operators, Projects, Segments and Market Opportunities
 Now Available AIRPORTS IN INDIA 2017 Operators, Projects, Segments and Market Opportunities Report (PDF) Data-set (Excel) India Infrastructure Research Airports in India 2017 Table of Contents SECTION
The Next International Cruise Tourism Hub
 The Next International Cruise Tourism Hub Contents Market Scenario and Projections Demand & Supply Factors Current Scenario in India Vision & Formulation of Task Force Standard Operating Procedures Ministry
Cathay Pacific Airways
 Cathay Pacific Airways Annual Results for the year ended 31 st December 2011 14 March 2012 1 Annual Result 2011 2010 Change Group attributable profit HK$5,501m HK$14,048m -60.8% Group Turnover HK$98,406m
Transportation and Infrastructure Sector India
 Transportation and Infrastructure Sector India February 2014 Produced by: - 1 - Table of Contents I. Transportation and Infrastructure Sector Overview 1. Transportation Highlights 2. Performance and Share
TRUST A MARKET LEADER FOR THE CASHEW NUTS SEASON
 TRUST A MARKET LEADER FOR THE CASHEW NUTS SEASON 480 OFFICES 150 COUNTRIES 60K STAFF 460 VESSELS 315 PORTS OF CALL 200 ROUTES 16 MILLION TEU CARRIED ANNUALLY A GLOBAL NETWORK A LOCAL APPROACH WEST AFRICA,
Fourth Quarter and Full Year 2009
 Investor and analyst meeting: Fourth Quarter and Full Year 29 25 th February 21 2 The views expressed here contain some information derived from publicly available sources that have not been independently
INVESTOR PRESENTATION DECEMBER 2013
 INVESTOR PRESENTATION DECEMBER 2013 Particulars Q3-14 Q2-14 Q3-13 YTD Q3 14 YTD Q3 13 Rs. Mn Rs. Mn Rs. Mn Rs. Mn Rs. Mn Q3 14 on Q2 14 YTD Q3 Q3 14 14 on on Q3 13 YTD Q3 13 Turnover 1,835 1,808 1,591
SLUM UPGRADATION. Sangay Wangdi Tshewang Giacho Krishna Kafley
 SLUM UPGRADATION Sangay Wangdi Tshewang Giacho Krishna Kafley INTRODUCTION Only about 27.78 % of the total Indian population resides in urban areas. But according to the most recent Census, growth of the
Port of Newcastle 2016 TRADE REPORT. Port of Newcastle
 Port of Newcastle 2016 TRADE REPORT Port of Newcastle SHIP VISITS COAL 2016-1,764 2015-1,704 CRUISE 2016-9 2015-8 NON COAL 2016-485 2015-455 2,258 vessel visits in 2016 2,167 ship visits in 2015 COAL TRADE
JAPAN AIRLINES Co., Ltd. Financial Results 1 st Quarter Mar/2018(FY2017)
") JAPAN AIRLINES Co., Ltd. Financial Results Mar/2018(FY2017) July 31, 2017 Today s Topics P.1 P.2 P.3 P.4 P.6 P.15 Overview of Financial Results for (FY2017) 1 st quarter resulted in an increase in both
JAPAN AIRLINES Co., Ltd. Financial Results Mar/2018(FY2017) July 31, 2017 Today s Topics P.1 P.2 P.3 P.4 P.6 P.15 Overview of Financial Results for (FY2017) 1 st quarter resulted in an increase in both
The contribution of Tourism to the Greek economy in 2017
 The contribution of Tourism to the Greek economy in 2017 1 st edition (provisional data) May 2018 Dr. Aris Ikkos, ISHC Research Director Serafim Koutsos Analyst INSETE Republishing is permitted provided
4-Jan-19 6-Jan-19 Royal Rajasthan Rally 2019 Stage Rally Open 4W Jaipur
 2019 Tentative Calendar of Events Updated : 24th Dec 2019 Please contact the organizers directly for further details of their event like Supplementary Regulations, Entry form, etc, etc. Start Date End
Copa Holdings Reports Net Income of $49.9 million and EPS of $1.18 for the Second Quarter of 2018
 Copa Holdings Reports Net Income of $49.9 million and EPS of $1.18 for the Second Quarter of 2018 Panama City, Panama --- Aug 8, 2018. Copa Holdings, S.A. (NYSE: CPA), today announced financial results
Air Berlin PLC AGM 18 June 2014 London
 Air Berlin PLC AGM 18 June 2014 London Executive summary (1) Key Highlights 2013 2013: a challenging year for airberlin Operational loss of 231.9 million euros Group revenue down in line with capacity
VR Group s result for 2018 was excellent rail traffic volumes increased
 Press release 1 (5) VR Group s result for 2018 was excellent rail traffic volumes increased Financial details for 2018 presented in this press release are unaudited FAS figures. The figures in brackets
Safe, Timely & Comfortable Move for Better Future ~Japan-India Cooperation on Railway Sector ~
 Safe, Timely & Comfortable Move for Better Future ~Japan-India Cooperation on Railway Sector ~ IRC (Int l Rail Conference) 2017 @Pragati Maidan, Oct. 11 th, 2017 Takema SAKAMOTO Chief Representative Japan
Singapore Airlines Group Analyst/Media Briefing HALF YEAR FY RESULTS. 13 November 2013 THE PARENT AIRLINE 1H FY2013/14 RESULTS
 Singapore Airlines Group Analyst/Media Briefing HALF YEAR FY2013-14 14 RESULTS 13 November 2013 THE PARENT AIRLINE 1H FY2013/14 RESULTS THE PARENT AIRLINE COMPANY RESULTS 2Q & 1H FY13/14 2Q/13 $million
AirportInfo. Economic Indicators & Traffic
 AirportInfo Economic Indicators & Traffic March 2012 U.S. & Canadian GDP Economic Focus 6% 4% US Canada 2% 0% -2% -4% -6% -8% -10% GDP growth improved slightly for both the U.S. and Canada in the third
Financial Results 1 st Quarter Mar/2016 (FY2015) 30 July, 2015
 30 July, 2015") Financial Results Mar/2016 (FY2015) 30 July, 2015 Today s Topics P.2 P.3 P.15 1 Overview of FY Mar/2016 Financial Results Operating Revenue Operating Profit 320 307.0 +4.9Bn (+1.6%) 312.0 50 +17.6Bn (+94.6%)
Financial Results Mar/2016 (FY2015) 30 July, 2015 Today s Topics P.2 P.3 P.15 1 Overview of FY Mar/2016 Financial Results Operating Revenue Operating Profit 320 307.0 +4.9Bn (+1.6%) 312.0 50 +17.6Bn (+94.6%)
Delhi Airport Metro Express A Case of Public Private Partnership Project
 1 Delhi Airport Metro Express A Case of Public Private Partnership Project Surya Raj Acharya, PhD Visiting Professor Institute of Engineering, Tribhuvan University, Kathmandu 20 Feb 2017 Contents 2 1.
New Mexico State Publications Program
 New Mexico State Publications Program SHIPLIST#: 2008-01 Number of Items: 136 El palacio. MUSEUM OF NEW MEXICO. OCLCNO: 1641774 CALLNO: NM F 701.91:111-3,4 Fall, Winter 2006. Vol. 111, no. 3,4 Museums
COSCO CORPORATION. (SINGAPORE) LTD FY2003 Full Year Results. Presentation
 LTD FY2003 Full Year Results. Presentation") COSCO CORPORATION (SINGAPORE) LTD FY2003 Full Year Results Presentation 11 February 2004 1 Outline of Presentation 1. Background & Corporate Restructuring Exercise 2. Operations Review 3. Financial Review
COSCO CORPORATION (SINGAPORE) LTD FY2003 Full Year Results Presentation 11 February 2004 1 Outline of Presentation 1. Background & Corporate Restructuring Exercise 2. Operations Review 3. Financial Review
DLF Ltd. Q1 Analyst Presentation
 DLF Ltd. Q1 Analyst Presentation 1 Results at a Glance Q1 Sl.No. Consolidated Financials 1Q FY08 Rs. In Crores A) 1 Sales and Other Receipts 3074 2 Other Income 47 Percentage of Total Revenue Margins(%)
SIA ANALYST/MEDIA BRIEFING Q2 and 1H FY17/18 Results 8 November 2017
 SIA ANALYST/MEDIA BRIEFING Q2 and 1H FY17/18 Results 8 November 2017 THE PARENT AIRLINE Q2 AND 1H FY17/18 RESULTS THE PARENT AIRLINE COMPANY OPERATING PERFORMANCE Q2 % 1H % FY17/18 Change FY17/18 Change
Passenger and Cargo Statistics Report
 Passenger and Cargo Statistics Report RenoTahoe International Airport April 2018 U.S. DOMESTIC INDUSTRY OVERVIEW FOR APRIL 2018 Systemwide RNO Carriers Domestic Flights year over year comparison Average
Passenger and Cargo Statistics Report
 Passenger and Cargo Statistics Report RenoTahoe International Airport July 2018 U.S. DOMESTIC INDUSTRY OVERVIEW FOR JULY 2018 Systemwide RNO Carriers Domestic Flights year over year comparison Average
BHP Billiton Iron Ore Western Australia. Iron Ore. Port & Rail Operations. Mick Evans Vice President Port & Rail
 BHP Billiton Iron Ore Western Australia Port & Rail Operations Mick Evans Vice President Port & Rail Iron Ore Continuous Improvement in Safety Performance Continued development of One Business approach
Presentation on Results for the 2nd Quarter FY Idemitsu Kosan Co.,Ltd. November 1, 2016
 Presentation on Results for the 2nd Quarter FY 2016 Idemitsu Kosan Co.,Ltd. November 1, 2016 Table of Contents 1. 2nd Quarter FY 2016 Financials (1) Overview (2) Segment Information 2. Reference Materials
Passenger and Cargo Statistics Report
 Passenger and Cargo Statistics Report RenoTahoe International Airport June 2018 U.S. DOMESTIC INDUSTRY OVERVIEW FOR JUNE 2018 Systemwide RNO Carriers Domestic Flights year over year comparison Average
Air Berlin PLC AGM 06 June 2013 London
 Air Berlin PLC AGM 06 June 2013 London airberlin a strong European carrier Market position as of 31 December 2012 No. 2 in core market: Germany / Austria / Switzerland No. 7 in Europe with 33.3 m guests
Passenger and Cargo Statistics Report
 Passenger and Cargo Statistics Report RenoTahoe International Airport May 2018 U.S. DOMESTIC INDUSTRY OVERVIEW FOR MAY 2018 Systemwide RNO Carriers Domestic Flights year over year comparison Average Load
Fourth Quarter and Full Year 2011 Results Presentation. February 1, 2012
 Fourth Quarter and Full Year 2011 Results Presentation February 1, 2012 This presentation may include forward-looking comments regarding the Company s business outlook and anticipated financial and operating
Cathay Pacific Airways 2010 Annual Results 9 March 2011
 Cathay Pacific Airways 2010 Annual Results 9 March 2011 1 Annual Result 2010 2009 Change Group Profit/(Loss) HK$14,048m HK$4,694m +199.3% Group Turnover HK$89,524m HK$66,978m +33.7% Profit Margin 15.7%
Management Presentation. November 2011
 Management Presentation November 2011 Forward looking statements This presentation as well as oral statements made by officers or directors of Allegiant Travel Company, its advisors and affiliates (collectively