2013/14 PUBLIC TRANSPORT PASSENGER SATISFACTION SURVEY
|
|
|
- Gloria Floyd
- 5 years ago
- Views:
Transcription


1 (TN/10/19) 2013/14 PUBLIC TRANSPORT PASSENGER SATISFACTION SURVEY Research Report Prepared for Greater Wellington Presented Regional B Council Final Version 19 th September th February 2010 Gravitas Research and Strategy Limited Level 12, Wellesley Centre, Wellesley St, Auckland PO Box 3802, Shortland St, Auckland tel , fax info@gravitas.co.nz
2 Contents Executive Summary 1 1. Introduction Research Approach and Design Methodology Sampling Frame, Size and Selection Questionnaire Design Questionnaire and Interview Pilot Process Administrating the Interviews Analysis and Reporting Report Structure Passenger Perceptions of Current Trip Overall Satisfaction with Trip All Modes Comparative Perceptions of Trip Current Trip Drivers of Satisfaction Passenger Perceptions of Stop/Station/Wharf Overall Satisfaction with Stop/Station/Wharf All Modes Comparative Perceptions of Stop/Station/Wharf Bus Stop/Train Station/Ferry Wharf Drivers of Satisfaction Suggestions for Improvement to Stop/Station/Wharf Passenger Perceptions of Wellington Region s Public Transport System Overall Satisfaction with Wellington Region s Public Transport System All Modes Comparative Perceptions of Wellington Region s Public Transport System Wellington Region s Public Transport System Drivers of Satisfaction Moving Forward Likelihood of Recommending Public Transport to Others Suggestions for Improvement to Public Transport Services 75 Appendix One: Responses to National Questions 1 Appendix Two: Sample Profile 6 Appendix Three: Questionnaires 7 Appendix Four: Suggestions for Improvements (Full Lists) 9 Appendix Five: Satisfaction with All Aspects of Public Transport System By Mode 13
3 Executive Summary 1. Introduction and Method The New Zealand Transport Agency (NZTA) requires that surveys of user perceptions of public transport are carried out as part of monitoring requirements. Greater Wellington Regional Council commissioned Gravitas Research and Strategy to conduct its 2013/14 public transport customer satisfaction survey. In line with NZTA guidelines, Gravitas conducted an on-board survey with bus, train and ferry passengers, using a selfcompletion methodology. Note: The methodology and questionnaire used for the 2013/14 customer satisfaction survey is substantially different to that used in previous years. Because of these differences, the results presented in this report are not comparable with those collected previously (see Section Two of the main report for more detail). Consequently no time series comparisons are provided. In accordance with NZTA guidelines, a random sampling technique was used to select the trips to be surveyed. In designing the surveying roster, it was necessary to schedule transit trips to allow surveying teams to connect between the randomly selected trips. Because teams needed to travel on these transit trips anyway, it was decided (in collaboration with Greater Wellington Regional Council) that passengers on transit trips would also be surveyed. In total n=358 public transport trips were surveyed on, generating n=4,298 completed questionnaires. Summary Table 1 shows the number of trips and the number of completed questionnaires received by mode. Summary Table 1: Sample Sizes by Mode Number of Trips Number of Completed Questionnaires Bus Train Ferry Bus Train Ferry Randomly-selected trips Transit trips surveyed on Total Maximum margin of error (at 95% confidence interval) ± 2.7% ± 1.9% ± 7.9% Note: The summary report submitted to NZTA to meet national annual monitoring requirements includes the results from the randomly-selected trips only. No data from the transit trips was included. Consequently, the results presented in this report differ from those submitted to NZTA. Greater Wellington Regional Council 2013/14 Public Transport Passenger Satisfaction Survey Page 1
4 The questionnaire content was based on the list of common questions designed by NZTA. Comprehensive pilot-testing of the questionnaire and survey process was undertaken prior to live fieldwork commencing. Surveying was conducted between the 5 th and 25 th of May Questionnaires were distributed to every passenger aged 15 years or older on randomly-selected services and every second passenger aged 15 years or older on transit trips. The response rate was 58% 1 for all services combined. 2. Passengers Overall Perceptions of Wellington s Public Transport Services 1. Overall Satisfaction with Current Trip Almost all Wellington public transport users are satisfied to some extent with their current trip overall, 92% giving a positive rating (that is, between 6 and 10), including 16% who are extremely satisfied (giving a rating of 10 out of 10). Just 3% of respondents express dissatisfaction with their current trip overall. Whilst levels of satisfaction are high for all three modes, ferry passengers are significantly more likely to rate the trip overall positively (97%) than those travelling by bus (92%) or train (92%). Summary Table 2: Satisfaction with Current Trip Overall By Mode (%) Rating Total Bus Train Ferry (N=4,117) (n=1,293) (n=2,676) (n=148) Dissatisfied (0-4) Neutral (5) Satisfied (6-10) ( BT) Base: All bus respondents who answered this question, excluding Not applicable responses Letter notation denotes mode(s) that this result is significantly higher than; B=Bus, T=Train, F=Ferry. Results by operator show that East by West Ferries performs most positively for the trip overall, (97% satisfied), this result significantly higher than for Go Wellington (93%), Tranz Metro (91%) and Valley Flyer (89%). Valley Flyer (6%) customers are over-represented among those dissatisfied with the current trip overall. 2. Overall Satisfaction with Stop/Station/Wharf Almost all public transport users are satisfied to some extent with the stop, station or wharf where they boarded their trip, 91% giving a positive rating (between 6 and 10), including 16% of respondents giving a rating of 10 out of 10. Only 4% of respondents are dissatisfied with the stop, station or wharf. Ratings are similar by mode, 93% of ferry passengers, 91% of train passengers and 90% of those travelling by bus satisfied to some extent with the stop/station/wharf where they commenced their trip. 1 76% among ferry passengers, 56% for train passengers and 51% among bus passengers. Greater Wellington Regional Council 2013/14 Public Transport Passenger Satisfaction Survey Page 2
5 Summary Table 3: Overall Satisfaction with Stop/Station/Wharf By Mode (%) Rating Total Bus Train Ferry (N=4,190) (n=1,306) (n=2,736) (n=148) Dissatisfied (0-4) Neutral (5) Satisfied (6-10) Base: All respondents who answered this question, excluding Not applicable responses. Letter notation denotes mode(s) that this result is significantly higher than; B=Bus, T=Train, F=Ferry. 3. Overall Satisfaction with Wellington Region s Public Transport System Wellington s public transport users are also generally satisfied with the region s public transport system, 83% giving a positive rating, including 8% who are extremely satisfied. In contrast, 8% of public transport users are dissatisfied with the region s public transport system. Whilst levels of satisfaction are similar by mode, those using the train (9%) are significantly more likely to express some level of dissatisfaction than bus passengers (7%). Summary Table 4: Overall Satisfaction with Wellington Region s Public Transport System By Mode (%) Rating Total Bus Train Ferry (N=4,189) (n=1,302) (n=2,739) (n=148) Dissatisfied (0-4) ( B) 9 Neutral (5) Satisfied (6-10) Base: All respondents who answered this question, excluding Not applicable responses. Letter notation denotes mode(s) that this result is significantly higher than; B=Bus, T=Train, F=Ferry. 4. Likelihood of Recommending Public Transport in Wellington to Others Satisfaction with Wellington s public transport services is further evidenced by the fact that 85% of respondents would recommend using public transport to a friend or colleague. This including 19% who are extremely likely to recommend. Only 8% of respondents would not endorse Wellington s public transport services to others. Whilst the extent of recommendation is high for all three modes, ferry (90%) and train (86%) passengers are significantly more likely to be advocates of public transport than those using buses (83%). Greater Wellington Regional Council 2013/14 Public Transport Passenger Satisfaction Survey Page 3
6 Summary Table 5: Likelihood of Recommending Public Transport to Others By Mode (%) Rating Total Bus Train Ferry (N=3,762) (n=1,206) (n=2,417) (n=139) Unlikely (0-4) Neutral (5) Likely (6-10) ( B) 90 ( B) Base: All bus respondents who answered this question, excluding Not applicable responses Letter notation denotes mode(s) that this result is significantly higher than; B=Bus, T=Train, F=Ferry. Among Wellington operators, likelihood of recommending is highest among those travelling on East by West Ferries (90%) and lowest among Newlands (81%) and Valley Flyer (81%) passengers. Ten per cent of passengers on Valley Flyer services state that they would be unlikely to recommend using public transport in Wellington to others. 3. Satisfaction with All Aspects of Public Transport Service Of the 20 aspects of Wellington s public transport system considered, passengers are most satisfied with their personal security during the trip, almost all (95%) rating this aspect positively, including 99% of ferry passengers. Ratings are also very positive for accessibility to the vehicles, including 94% satisfied with the ease of getting on and off the vehicle, 94% giving a positive rating for the ease of getting onto the vehicle from the stop/station/wharf, and 91% giving a positive rating for the stop/station/wharf being easy to get to (via walking etc.). In contrast, passengers are least satisfied with the provision of information about service delays or disruptions, only 62% satisfied, including just 55% of bus passengers. Passengers also have relatively poor perceptions of the value for money of the fare (70%) and the adequate provision of shelter from the weather at the stop/station/wharf (71%, including just 38% of ferry passengers). Greater Wellington Regional Council 2013/14 Public Transport Passenger Satisfaction Survey Page 4
7 Summary Table 6: Satisfaction with Aspects of Public Transport Service (%) Share Giving Positive Ratings (6-10) Aspect of Service Total Sample (N=4,298) Bus (N=1,346) Train (N=2,799) Ferry (N=153) Personal security during this trip ( B) 99 ( B) The ease of getting on the vehicle ( B) 92 The ease of getting off the vehicle ( B) 94 The ease of getting on the vehicle from the ( BF) 90 stop/station/wharf The stop/station/wharf being easy to get to ( T) Comfort of the inside temperature ( BT) The helpfulness of the driver/staff ( B) 95 ( BT) The attitude of the driver/staff ( B) 98 ( BT) Your personal safety at the stop/station/wharf ( B) Having enough seats available ( T) ( BT) The information available at the ( B) 80 stop/station/wharf Ease of getting information about public transport routes and timetables The travel time The cleanliness of the stop/station/wharf ( BT) How often the service runs The service being on time ( BT) How convenient it is to pay for public transport ( T) The stop/station/wharf providing shelter from ( F) 75 ( BF) 38 the weather The value for money of the fare ( T) ( BT) Information about service delays or disruptions ( B) 67 ( B) Aspects of current trip Aspects of stop/station/wharf Aspects of public transport system overall Greater Wellington Regional Council 2013/14 Public Transport Passenger Satisfaction Survey Page 5
8 4. Current Performance On What Is Most Important To Passengers Summary Figure 1 maps the current performance on each aspect of Wellington s public transport system by the aspect s relative influence on overall satisfaction. The trend line 2 slopes down and to the right. This result indicates a mismatch between performance and influence, with the public transport service performing less well on at least one of the most influential drivers of satisfaction. Key areas of concern are the provision of information about service delays and disruptions, the value for money of the fare, the provision of shelter from the weather at the stop/station/wharf, and the convenience of paying for public transport. These aspects have been identified as core drivers of overall satisfaction (positioned in the top half of the grid), but are currently the most poorly performing aspects of Wellington s public transport system. These areas should be prioritised for improvement over the next 12 months as enhancements to these aspects can be expected to have a notable positive impact on overall satisfaction. 2 The trend line assists in depicting the overall relationship between relative influence and performance across the service attributes/drivers. In an ideal situation, the trend line should slope up to the right. This illustrates that the public transport system is performing best on those aspects of service that are most important to passengers/that have the greatest influence on overall satisfaction. A trend line that slopes down to the right indicates a mismatch between performance and importance/influence that is, at least one service attribute identified as core/important to passengers is currently under-performing (suggesting the need for more resource in this area for example, planning, training, quality control etc.) and/or at least one service attribute with a high performance rating is identified as having little or no importance to passengers/has only minimal influence on overall satisfaction. Greater Wellington Regional Council 2013/14 Public Transport Passenger Satisfaction Survey Page 6
9 Summary Figure 1: Performance on All Aspects of Service versus Influence on Overall Satisfaction Aspects of current trip Aspects of stop/station/wharf Aspects of public transport system overall Greater Wellington Regional Council 2013/14 Public Transport Passenger Satisfaction Survey Page 7
10 5. Moving Forward 1. Suggestions for Improvement to Public Transport Services Improved reliability of services (that is, ensuring services run on time/to the timetable and actually turn up) and a desire for cheaper fares are the most frequently mentioned suggestions for improvements to Wellington s public transport system, each being mentioned unprompted by 10% of passengers. Eight per cent of passengers call for more frequent services. Summary Table 7: Suggestions for Improvement to Public Transport Services (%) Suggestion for Improvement Total Sample (N=4,298) Improved reliability of services run on time/to timetable 10 Cheaper fares 10 More frequent services 8 More buses on route/more carriages/more seats available/reduce overcrowding 6 Integrated ticketing/automate ticketing system 6 Cheaper fares for students 4 Changes to be made to particular routes 3 Friendlier drivers/staff 3 Faster/more direct/fewer stops/more Express services 3 More info about service delays, disruptions and changes (e.g. buses replacing trains) 3 More/more frequent weekend/late night/holiday services 3 Base: All respondents. Table lists those improvements mentioned by 3% or more of respondents. Full list is provided in Appendix Four. 2. Suggestions for Improvement to Stop/Station/Wharf In line with the high level of dissatisfaction expressed, the most frequently mentioned suggestion for improvement to the stop/station/wharf is the provision of more and/or improved shelter from the weather (19%, including 21% of bus passengers and 36% of those using the ferry). Other frequently mentioned suggestions relating to the physical infrastructure include cleaner stops/stations/wharves (8%) and the need for more seating (5%). Improving the provision of information available at the stop/station/wharf is also frequently cited, 5% calling for more information to be made available, 4% wanting the installation of Real Time Information boards, and 3% suggesting the need for better information about service delays, disruptions and changes (such as buses replacing trains). Greater Wellington Regional Council 2013/14 Public Transport Passenger Satisfaction Survey Page 8
11 Summary Table 8: Suggestions for Improvement to Stop/Station/Wharf (%) Suggestion for Improvement Total Sample (N=4298) More/improved shelter from weather (wind, rain, sun) 19 Cleaner stops and stations, including having more rubbish bins available 8 More info available/information easier to read (e.g. timetables, pricing, routes etc.) 5 More seats available 5 More Real Time Information boards 4 More info/better warning of service delays/disruptions/replacement buses 3 More/improved parking available 3 Better lighting 3 Better access to stop/station (improved footpaths, over-bridges, pedestrian crossing etc.) 3 Base: All respondents. Table lists those improvements mentioned by 3% or more of respondents. Full list is provided in Appendix Four. Greater Wellington Regional Council 2013/14 Public Transport Passenger Satisfaction Survey Page 9
12 1. Introduction An effective transport network is the lifeblood of the Wellington region. Making sure that people and freight can move quickly and safely around and in and out of the region is one of our Greater Wellington Regional Council s main responsibilities 3. As part of its transportation function, Greater Wellington plans for, and funds Metlink, the region's public transport network. The network includes a comprehensive range of bus services throughout the region; five passenger rail lines from Wellington and the harbour ferry. Greater Wellington is also responsible for public transport infrastructure such as railway stations, bus and ferry shelters, signage and park and ride facilities 4. The New Zealand Transport Agency (NZTA) requires that surveys of user perceptions of public transport are carried out by approved organisations receiving central government funding, as part of monitoring requirements. To improve consistency of the data collected in different regions, identical wording and a consistent format for questions across regions is mandatory 5. Greater Wellington Regional Council commissioned Gravitas Research and Strategy to conduct its 2013/14 public transport customer satisfaction survey in line with NZTA guidelines. This report provides the results of this survey Greater Wellington Regional Council 2013/14 Public Transport Passenger Satisfaction Survey Page 10
13 2. Research Approach and Design 2.1 Methodology In order to collect the information efficiently and meet the research objectives, Gravitas conducted an onboard survey with bus, train and ferry passengers, using a self-completion methodology. The key advantage of this method is that users of Wellington s public transport could be consulted while they were actually using the service. 2.2 Sampling Frame, Size and Selection Selecting Trips/Services In accordance with NZTA guidelines, a random sampling technique was used to select the trips to be surveyed on. Greater Wellington Regional Council provided a database of all current services. The following process was used to select the trips to be surveyed on: 1. The database of all trips was first sorted by trip start time, with all trips starting before 6:30 am or after 6:30 pm being excluded 6. (In total n=970 bus services, n=120 train services and n=5 ferry services were removed from the database. Wellington to Auckland train services were also removed). 2. Trips were then sorted by mode, and allocated to one of four time slots, based on the trip start time: Weekday AM Peak (6:30 am to 9:29 am) Weekday interpeak (9:30 am to 3:29 pm) Weekday PM Peak (3:30 pm to 6:29 pm) Weekend. 3. A randomisation was then performed on each time slot of trips. Trips were randomised three times using MS Excel s randomisation function. The top n trips were then selected for surveying, the n number based on patronage data provided by Greater Wellington Regional Council. Table 2.1a provides an example of how the number of bus trips within each time period was decided. Table 2.1b shows the patronage by time period and number of trips selected for train and ferry. 6 These trips were excluded due to concerns around interviewer safety and cost inefficiencies associated with travelling to meet early morning inbound trips and travelling back from late evening outbound trips. Greater Wellington Regional Council 2013/14 Public Transport Passenger Satisfaction Survey Page 11
14 Table 2.1a: Greater Wellington Regional Council Bus Patronage Data Daily Patronage Weekly Patronage Relevant to Research Share of All Patronage Number of Trips AM Peak (6.30am to 9.30am) 16,000 80,000 23% 23 Interpeak (9.30am to 3.30 pm 22, ,000 31% 31 PM Peak (3.30 to 6.30 pm) 14,000 70,000 20% 20 Weekend 46,000 92,000 26% 26 Total 352, % 100 Table 2.1b: Greater Wellington Regional Council Train and Ferry Patronage Data Share of All Patronage Number of Trips Train AM Peak (6.30am to 9.30am) 41% 33 Interpeak (9.30am to 3.30 pm 14% 11 PM Peak (3.30 to 6.30 pm) 37% 30 Weekend 8% 6 Total 100% 80 Ferry Peak 45% 6 Off-peak 55% 6 Total 100% 12 A roster was then designed to ensure cost-efficient coverage of these randomly selected trips. In designing the roster it was necessary to schedule transit trips to allow surveying teams to connect between the randomly selected trips. Because surveying teams needed to travel on these transit trips anyway, it was decided (in collaboration with Greater Wellington Regional Council) that passengers on the majority 7 of these transit trips would also be surveyed. In total n=358 public transport trips were surveyed on. These trips generated n=4,298 completed questionnaires. (The maximum margin of error on a sample size of n=4,298 is ± 1.5% at the 95% confidence interval.) Table 2.2 shows the number of trips completed by mode and also the final sample sizes for each. NOTE: THE REPORT SUBMITTED TO THE NEW ZEALAND TRANSPORT AGENCY TO MEET NATIONAL ANNUAL MONITORING REQUIREMENTS INCLUDES THE RESULTS FROM THE RANDOMLY-SELECTED TRIPS ONLY. NO DATA FROM THE TRANSIT TRIPS HAVE BEEN INCLUDED. 7 N=73 of the transit trips were not surveyed on due to short trip length (insufficient time for passengers to complete the questionnaire in full) or the trip commenced outside the hours of 6:30 am and 6:30 pm. Greater Wellington Regional Council 2013/14 Public Transport Passenger Satisfaction Survey Page 12
15 Consequently, the results presented in this report differ from those submitted to NZTA. A copy of the NZTA report is provided in Appendix One to this report. Table 2.2: Sample Sizes by Mode Number of Trips Number of Completed Questionnaires Bus Train Ferry Bus Train Ferry Randomly-selected trips Transit trips surveyed on Total Maximum margin of error (at 95% confidence interval) ± 2.7% ± 1.9% ± 7.9% Table 2.3 provides a profile of the sample by operator, time and direction. Table 2.3: Sample Sizes by Operator Number of Trips Number of Completed Questionnaires Maximum Margin of Error (at 95% confidence interval) Operator Tranz Metro ± 1.9% GO Wellington ± 3.3% Valley Flyer ± 5.8% Mana Coach Services ± 8.7% East By West Ferry ± 7.9% Newlands Coach Services 7 60 ± 12.7% Madge Coachlines 2 5 ± 43.8% Tranzit Coachlines Wairarapa 1 14 ± 26.2% Kapiti Coach Tours Runciman Motors Ltd Time Period AM Peak ± 2.4% Interpeak ± 3.1% PM Peak ± 2.9% Weekend ± 4.1% Direction of Trip Inbound ± 2.1% Outbound ± 2.2% Total ± 1.5% Information on the profile of the survey respondents (gender, age etc.) is provided in Appendix Two. Greater Wellington Regional Council 2013/14 Public Transport Passenger Satisfaction Survey Page 13
16 2.3 Questionnaire Design To ensure that customer satisfaction survey results are comparable across operators, modes and regions, and to allow national statistics to be developed for the purpose of accountability reporting to government, the New Zealand Transport Agency has developed a list of common questions. These formed that core of the customer satisfaction survey. Additional questions were added to identify what, if anything, might encourage peak time travellers to shift their trips off-peak (the results to these questions have been provided in a separate document). Three colour-coded versions of the questionnaire were designed, one for each mode. questionnaire was signed off by the Greater Wellington Regional Council team prior to pilot testing. The pre-pilot 2.4 Questionnaire and Interview Pilot Process In order to ensure that the questionnaire met the objectives of the research, was understandable, relevant and safe for respondents, and could be administered efficiently, a comprehensive pilot of the survey process was undertaken by the Gravitas surveying team prior to live fieldwork commencing. The pilot was conducted on Wednesday the 21 st of April. An experienced surveying team, accompanied by Gravitas s Field Manager as observer, conducted surveys on one bus, one ferry and one train trip as per the standard interviewing process outlined below. The Field Manager made a note of possible enhancements to the interviewing process throughout the shift, and the surveying team were debriefed to identify further suggestions to enhance the efficiency of survey administration and also to increase the survey response rate. In addition, each questionnaire received back was reviewed in full by the project team in order to identity design enhancements to maximise the response rate and completeness of the data provided. An overview of the pilot was provided to the Greater Wellington Regional Council s project team and suggestions for enhancements to the questionnaire and the interview process were signed off. 2.5 Administrating the Interviews Live surveying took place between the 5 th and 25 th of May Note that there were no public, school or tertiary holidays over this period. A survey team, comprising two surveyors (clearly identified with name badges) travelled on each rostered service and positioned themselves by the entrance and exit doors of the vehicle. Surveyors distributed the questionnaire to all passengers aged 15 years or older boarding the randomly-selected trips, and every second passenger aged 15 years or older boarding transit trips. Greater Wellington Regional Council 2013/14 Public Transport Passenger Satisfaction Survey Page 14
17 Between stops, surveyors collected completed surveys and offered assistance to those with queries. As far as possible, surveyors checked and queried completed forms as they were returned. A team of supervisors joined 10% of all services surveyed to observe and check procedures. Table 2.4 shows the response rate (that is, the proportion of passengers invited to take part who ultimately completed and returned the survey form) by mode and overall. Table 2.4: Response Rates by Mode Response Rate Ferry 76% Train 56% Bus 51% All Modes 58% All completed questionnaires were checked by supervisory staff before being data-entered into SPSS Surveycraft, Gravitas data analysis package. This allowed data tables to be run, and for results to be crosstabulated by key variables. 2.6 Analysis and Reporting Back coding All open-ended responses, as well as those entered into other categories, were back coded. This involved creating a code frame (a list of themes) and assigning each open-ended response to the relevant code/theme so that all results had a numeric code. Data Cleaning The data cleaning process was conducted once all questionnaires had been data entered, and involved manual checking of the dataset by the Gravitas Data Manager to ensure each record was complete. Checking of data for each question to ensure responses given were valid (that is, were contained within the options provided) also took place. Significance Testing All data presented in this report has been cross-tabulated by trip characteristics and key passenger demographic variables: Transport mode Service operator Time of trip peak/off-peak and AM peak/interpeak/pm peak/weekend Direction of trip (inbound versus outbound) Greater Wellington Regional Council 2013/14 Public Transport Passenger Satisfaction Survey Page 15
18 Payment method used Gender of passenger Age of passenger Statistically significant differences in results by trip and demographic characteristics have been highlighted in the tables. 2.7 Report Structure The report is structured similarly to the questionnaire. Section Three: Passenger Perceptions of the Current Trip This section provides results for passengers perceptions of the on-board trip experience. Results are provided overall, and by mode and operator. The relative influence of the various aspects of the on-board experience on overall satisfaction is also outlined. Section Four: Passenger Perceptions of the Stop/Station/Wharf This section details results for passengers perceptions of the stop, station or wharf where they boarded the surveyed service. Results are provided overall, and by mode. Note that, as the stop/station/wharf infrastructure is owned by Greater Wellington Regional Council, it was not deemed appropriate to provide results by operator. This section concludes with passenger-initiated suggestions for enhancement to the current stops/stations/wharves. Section Five: Passenger Perceptions of Wellington Region s Public Transport System In contrast to the previous sections where results are trip-specific, this section outlines passengers general perceptions of the region s public transport system travel times, convenience of payment, and the ease of accessing different types of information. Again, results are provided overall and by mode. Note that, as these questions related to the region s public transport system generally, it was not deemed appropriate to provide results by operator. Section Six: Moving Forward This section provides insight into passengers likelihood of recommending using the region s public transport system to others, and outlines passenger-initiated suggestions for improvement to the transport system going forward. Greater Wellington Regional Council 2013/14 Public Transport Passenger Satisfaction Survey Page 16
19 For each aspect of the current trip and public transport system respondents were asked to rate, the following information is presented: The share selecting each point on the 11-point rating scale both overall and by mode The share giving negative (points 0-4 on the rating scale), neutral (5) or positive (6-10) ratings overall and by mode. These results are also presented by operator for aspects of the service offer related to the actual trip. Differences in these ratings between modes and between operators have been significance-tested, with statistically significant differences highlighted in the report. The share of respondents who are statistically significantly more likely to give a negative or positive rating based on passenger (gender, age, type of payment used) and trip (inbound/outbound, on peak/off peak) characteristics. A Note on Time Series Comparisons The methodology and questionnaire used for the 2014 customer satisfaction survey is substantially different to that used in previous years: In 2012 and 2013, the survey was conducted predominantly using Computer Assisted Telephone Interviewing (CATI), with an online survey top-up of respondents with no landline access at home. This year, the survey was conducted via self-completion questionnaire on-board the region s bus, train and ferry services. In 2013, the survey had a sample size of n=750 of whom 78% (n=585) had used public transport in the Wellington region at least once in the last three months. This year the sample size was n=4,298, all of whom had used the Wellington region s public transport system. The differences in sample sizes yield notably different margins of error. (For example, n=397 respondents rated train services in 2013, yielding a maximum margin of error of ± 4.9%. In 2014, n=2,799 respondents rated train services, yielding a maximum margin of error of ± 1.9%.) Prior to 2014, quotas were set to ensure that the survey sample was representative of the demographic profile of the Wellington region population (which is likely to be different from the demographic profile of public transport users). In 2014, no demographic quotas were set. As all passengers on randomly-selected trips/every second passenger on transit trips were selected, the sample population is considered to be demographically representative of the total passenger base of the trips surveyed (excluding passengers aged younger than 15 years). In previous years, all respondents who had used public transport in the Wellington region in the last three months were asked to rate their general perceptions of different aspects of the public transport system - no time period over which to draw perceptions was specified. In contrast, in 2014, respondents were asked to rate only the specific service that they were on at the time of the survey. Greater Wellington Regional Council 2013/14 Public Transport Passenger Satisfaction Survey Page 17
20 In previous years, respondents were asked to rate specific aspects of bus, train and ferry services after first answering a series of questions about the ease of using public transport in the region generally and being asked to identify what makes it difficult to use the region s public transport system. In 2014, respondents were asked to rate the specific aspects of their trip first before being asked about the public transport system generally and their suggestions for enhancement. Prior to 2014, public transport users were asked to rate each aspect of the public transport system on a scale from 1 (Poor) to 5 (Excellent). In line with NZTA best practice guidelines, in 2014 respondents were required to express their satisfaction with each aspect, using an 11-point scale, from 0 (Extremely dissatisfied) to 10 (Extremely satisfied). Prior to 2014, respondents who had used multiple modes of public transport in the previous three months were asked to rate each mode on a series of aspects. It is likely that, consciously or subconsciously, respondents will have rated the second (and third) modes relative to the first. In the 2013 questionnaire it does not indicate that the order in which the modes were asked was rotated, suggesting that respondents will have rated train and/ferry services relative to bus services. For the 2014 survey, respondents were asked to rate one mode only. A number of new statements were added to the 2014 survey and some aspects of the public transport system asked in previous years were not asked about this year. For these reasons, the results presented in this report are not comparable with those collected previously. Consequently no time series comparisons have been provided in this report. Greater Wellington Regional Council 2013/14 Public Transport Passenger Satisfaction Survey Page 18
21 3. Passenger Perceptions of Current Trip Highlights Almost all Wellington public transport users are satisfied to some extent with their trip overall, 92% giving a positive rating (that is, giving a rating between 6 and 10), including 16% who are extremely satisfied. Just 3% of respondents expressed any dissatisfaction with their current trip overall. Whilst levels of satisfaction with the trip are high for all three modes, ferry passengers are significantly more likely to rate the trip overall positively (97%) than those travelling by bus or train (92% for both modes). Results by operator show that East by West Ferries performs most positively for the trip overall, (97% satisfied), this result significantly higher than for Go Wellington (93%), Tranz Metro (91%) and Valley Flyer (89%). Of the ten aspects of the trip considered, public transport users are most positive about the personal safety on the trip (95% satisfied to some extent), and the ease of getting on (94%) and off (94%) the vehicle. In contrast, ratings were notably less positive for the trip representing value for money of the fare, only 70% of passengers rating this aspect positively. Train passengers are particularly dissatisfied with the value for money of the fare, 68% giving a positive rating, and 20% expressing dissatisfaction. This result is of particular concern as value for money of the fare is the strongest driver of overall satisfaction with the trip. Improvements to this aspect of the trip (by reducing fare costs and/or adding value through improved service delivery, new facilities etc.) can be expected to have the greatest positive impact on overall satisfaction with the trip going forward. 3.1 Overall Satisfaction with Trip All Modes Almost all Wellington public transport users are satisfied to some extent with their trip overall, 92% giving a positive rating (that is, giving a rating between 6 and 10), including 16% who are extremely satisfied (giving a rating of 10 out of 10). Just 3% of respondents expressed any dissatisfaction with their current trip overall. Whilst levels of satisfaction are high for all three modes, ferry passengers are significantly more likely to rate the trip overall positively (97%) than those travelling by bus (92%) or train (92%). Results by operator show that East by West Ferries performs most positively for the trip overall, (97% satisfied), this result significantly higher than for Go Wellington (93%), Tranz Metro (91%) and Valley Flyer (89%). Valley Flyer (6%) customers are over-represented among those dissatisfaction with the trip overall. Greater Wellington Regional Council 2013/14 Public Transport Passenger Satisfaction Survey Page 19
22 Figure 3.1: Satisfaction with Current Trip Overall By Mode and Operator (%) Rating Total Bus Train Ferry (N=4,117) (n=1,293) (n=2,676) (n=148) Dissatisfied (0-4) Neutral (5) Satisfied (6-10) ( BT) Mean rating (out of 10) Rating East By West Go Wellington Mana Newlands Tranz Metro Valley Flyer (n=148) (n=820) (n=121) (n=60) (n=2,676) (n=274) ( EG) ( GTV) Mean rating (out of 10) Base: All bus respondents who answered this question, excluding Not applicable responses. Letter notation denotes mode(s)/operator(s) that this result is significantly higher than; B=Bus, T=Train, F=Ferry. E=East By West, G=Go Wellington, M=Mana Coachlines, N=Newlands Coachlines, T=Tranz Metro, V=Valley Flyer. Note: Sample size for Madge Coachlines (n=4) and Tranzit Coachlines (n=14) too small to provide statistically reliable results. Greater Wellington Regional Council 2013/14 Public Transport Passenger Satisfaction Survey Page 20
23 Rating of 6-10 significantly more likely Travelling on a SuperGold card (97%)/aged 65 years or older (96%) Travelling outbound (93%) Rating of 0-4 signficantly more likely (None) 3.2 Comparative Perceptions of Trip Of the ten aspects of the trip considered, public transport users are most positive about their personal security during the trip, 95% rating this aspect positively (that is, giving a rating between 6 and 10). Ferry (99%) and train (96%) passengers were particularly positive about this aspect of the current trip (significantly higher than for bus passengers 94%). Ratings are also very positive for the ease of getting on (94%) and off (94%) the vehicle. In contrast, ratings were notably less positive for the trip representing value for money of the fare, only 70% of passengers rating this aspect positively. Train passengers are particularly dissatisfied with the value for money of the fare, only 68% giving a positive rating, and 20% expressing dissatisfaction. The results for each aspect of the stop/station/wharf are provided in more detail in the following sections. Table 3.1: Comparative Perceptions of Trip (%) Share Giving Positive Ratings (6-10) Aspect of Service Total Sample (N=4,298) Bus (N=1,346) Train (N=2,799) Ferry (N=153) Personal security during this trip ( B) 99 ( B) The ease of getting on the vehicle ( B) 92 The ease of getting off the vehicle ( B) 94 Comfort of the inside temperature ( BT) The helpfulness of the driver/staff ( B) 95 ( BT) The attitude of the driver/staff ( B) 98 ( BT) Having enough seats available ( T) ( BT) How often the service runs The service being on time ( BT) The value for money of the fare ( T) ( BT) Base: All respondents, excluding those giving a not applicable response. Letter notation denotes mode(s)/operator(s) that this result is significantly higher than; B=Bus, T=Train, F=Ferry. Greater Wellington Regional Council 2013/14 Public Transport Passenger Satisfaction Survey Page 21
24 Your Personal Security During The Trip Passengers feel safe when using Wellington s public transport system, almost all respondents (95%) reporting they are satisfied to some extent with their personal security during the trip (giving a rating between 6 and 10), including 37% who are extremely satisfied. Whilst levels of satisfaction are high across all three modes, ferry (99%) and train (96%) passengers are significantly more likely to be satisfied with their personal security during the trip than those travelling by bus (94%). Results by operator show that East by West Ferries performs most positively for personal security during the trip (99% satisfied), this result significantly higher than for all bus operators, particularly Valley Flyer (91%) and Mana Coachlines (89%). Figure 3.2: Personal Safety During the Trip By Mode and Operator (%) Rating Total Bus Train Ferry (N=4,235) (n=1,322) (n=2,760) (n=153) Dissatisfied (0-4) Neutral (5) Satisfied (6-10) ( B) 99 ( B) Mean rating (out of 10) Greater Wellington Regional Council 2013/14 Public Transport Passenger Satisfaction Survey Page 22
25 Rating East By West Go Wellington Mana Newlands Tranz Metro Valley Flyer (n=153) (n=840) (n=124) (n=59) (n=2,760) (n=280) ( EGT) ( E) 6 ( EGT) 3 ( E) 3 ( E) 5 ( ET) ( GMNV) 95 ( MV) ( MV) 91 Mean rating (out of 10) Base: All bus respondents who answered this question, excluding Not applicable responses. Letter notation denotes mode(s)/operator(s) that this result is significantly higher than; B=Bus, T=Train, F=Ferry. E=East By West, G=Go Wellington, M=Mana Coachlines, N=Newlands Coachlines, T=Tranz Metro, V=Valley Flyer. Note: Sample size for Madge Coachlines (n=5) and Tranzit Coachlines (n=14) too small to provide statistically reliable results. Rating of 6-10 significantly more likely (None) Rating of 0-4 signficantly more likely Travelling on a stored value card (3%) Greater Wellington Regional Council 2013/14 Public Transport Passenger Satisfaction Survey Page 23
26 The Ease of Getting on the Vehicle (Ramps, Handrails, Steps etc.) Almost all respondents are satisfied to some extent with the ease of getting on the vehicle, 94% giving a positive rating (between 6 and 10), including 33% who are extremely satisfied (giving a rating of 10 out of 10). Only 2% are dissatisfied. Train passengers (95%) are significantly more likely to be satisfied with the ease of getting on the vehicle than those using the bus (92%). Results by operator show that ratings for ease of getting on the vehicle are most positive for Tranz Metro (95% satisfied) and Go Wellington (94%) services. Ratings are significantly less positive for the ease of getting on Mana Coachlines (88%) and Valley Flyer (88%) buses. Six per cent of Valley Flyer passengers report being dissatisfied with the ease of getting on these vehicles. Table 3.3: Ease of Getting on the Vehicle By Mode and Operator (%) Rating Total Bus Train Ferry (N=4,258) (n=1,327) (n=2,778) (n=153) Dissatisfied (0-4) 2 4 ( T) 2 2 Neutral (5) Satisfied (6-10) ( B) 92 Mean rating (out of 10) Greater Wellington Regional Council 2013/14 Public Transport Passenger Satisfaction Survey Page 24
27 Rating East By West Go Wellington Mana Newlands Tranz Metro Valley Flyer (n=153) (n=844) (n=125) (n=60) (n=2,778) (n=280) ( GT) ( GT) ( MV) ( MV) 88 Mean rating (out of 10) Base: All bus respondents who answered this question, excluding Not applicable responses. Letter notation denotes mode(s)/operator(s) that this result is significantly higher than; B=Bus, T=Train, F=Ferry. E=East By West, G=Go Wellington, M=Mana Coachlines, N=Newlands Coachlines, T=Tranz Metro, V=Valley Flyer. Note: Sample size for Madge Coachlines (n=5) and Tranzit Coachlines (n=14) too small to provide statistically reliable results. Rating of 6-10 significantly more likely Travelling on a monthly pass (96%) Rating of 0-4 signficantly more likely Travelling on weekend services (4%) Greater Wellington Regional Council 2013/14 Public Transport Passenger Satisfaction Survey Page 25
28 The Ease of Getting Off the Vehicle (Ramps, Handrails, Steps etc.) Almost all respondents are satisfied to some extent with the ease of getting off the vehicle, 94% giving a positive rating (between 6 and 10), including 33% who are extremely satisfied (giving a rating of 10 out of 10). Only 2% are dissatisfied. As with getting on the vehicle, train passengers (95%) are significantly more likely to be satisfied with the ease of getting off the vehicle than those using the bus (91%). Results by operator show that ratings for ease of getting off the vehicle are most positive for Tranz Metro (95% satisfied), Tranz Metro passengers significantly more likely to be satisfied than those travelling on services provided by Go Wellington (93%), Mana Coachlines (91%) or Valley Flyer (89%). Table 3.4: Ease of Getting off the Vehicle By Mode and Operator (%) Rating Total Bus Train Ferry (N=4,210) (n=1,314) (n=2,748) (n=148) Dissatisfied (0-4) 2 4 ( T) 2 1 Neutral (5) 4 5 ( T) 3 5 Satisfied (6-10) ( B) 94 Mean rating (out of 10) Greater Wellington Regional Council 2013/14 Public Transport Passenger Satisfaction Survey Page 26
29 Rating East By West Go Wellington Mana Newlands Tranz Metro Valley Flyer (n=148) (n=833) (n=126) (n=59) (n=2,748) (n=277) ( T) ( ET) ( T) ( T) ( GMV) 89 Mean rating (out of 10) Base: All bus respondents who answered this question, excluding Not applicable responses. Letter notation denotes mode(s)/operator(s) that this result is significantly higher than; B=Bus, T=Train, F=Ferry. E=East By West, G=Go Wellington, M=Mana Coachlines, N=Newlands Coachlines, T=Tranz Metro, V=Valley Flyer. Note: Sample size for Madge Coachlines (n=5) and Tranzit Coachlines (n=14) too small to provide statistically reliable results. Rating of 6-10 significantly more likely Travelling on a monthly pass (96%) Rating of 0-4 signficantly more likely (None) Greater Wellington Regional Council 2013/14 Public Transport Passenger Satisfaction Survey Page 27
30 The Comfort of the Inside Temperature Passenger perceptions of the comfort of the inside temperature of the vehicle are generally positive, 90% satisfied to some extent (giving a rating of between 6 and 10), including over a quarter (28%) who are extremely satisfied (giving a rating of 10 out of 10). Of the three modes, ferry passengers are most likely to be satisfied with the comfort of the insider temperature, 95% satisfied to some extent including 28% who are extremely satisfied. This compares with 90% of bus and train users. Results by operator show that East by West Ferries performs most positively for the comfort of the insider temperature (95% satisfied), this result significantly higher than for Tranz Metro (90%), Go Wellington (90%) and Mana Coachlines (87%). Figure 3.5: Comfort of the Inside Temperature By Mode and Operator Rating Total Bus Train Ferry (N=4,270) (n=1,338) (n=2,779) (n=153) Dissatisfied (0-4) Neutral (5) Satisfied (6-10) ( BT) Mean rating (out of 10) Greater Wellington Regional Council 2013/14 Public Transport Passenger Satisfaction Survey Page 28
31 Rating East By West Go Wellington Mana Newlands Tranz Metro Valley Flyer (n=153) (n=853) (n=125) (n=60) (n=2,779) (n=281) ( GMT) Mean rating (out of 10) Base: All bus respondents who answered this question, excluding Not applicable responses. Letter notation denotes mode(s)/operator(s) that this result is significantly higher than; B=Bus, T=Train, F=Ferry. E=East By West, G=Go Wellington, M=Mana Coachlines, N=Newlands Coachlines, T=Tranz Metro, V=Valley Flyer. Note: Sample size for Madge Coachlines (n=5) and Tranzit Coachlines (n=14) too small to provide statistically reliable results. Rating of 6-10 significantly more likely Travelling on a SuperGold card (96%) or paying cash (94%) Aged 65 years + (95%) Travelling on off peak trips (93%), particularly interpeak (94%) Rating of 0-4 signficantly more likely Aged years (7%) Travelling on peak trips (6%) Greater Wellington Regional Council 2013/14 Public Transport Passenger Satisfaction Survey Page 29
32 The Helpfulness of the Driver/Staff Wellington region bus drivers/train and ferry staff are generally perceived positively by passengers, 89% satisfied to some extent (giving a rating of between 6 and 10), including just over a quarter (28%) who are extremely satisfied (giving a rating of 10 out of 10). Only 5% of respondents express dissatisfaction with the helpfulness of the driver/staff. Of the three modes, ferry passengers are most likely to be satisfied with the helpfulness of the staff they dealt with (96%, including 40% who were extremely satisfied a very positive result). Staff on ferry (96%) and train (90%) services are rated significantly more positively for their helpfulness than bus drivers (85%). Results by operator show that ratings for the helpfulness of staff are most positive for East by West Ferries (96%). In contrast, levels of satisfaction with the helpfulness of the driver are significantly lower among those travelling on Valley Flyer (85%) and Go Wellington (84%) services in particular. Table 3.6: Helpfulness of the Driver/Staff By Mode and Operator (%) Rating Total Bus Train Ferry (N=4,015) (n=1,244) (n=2,619) (n=152) Dissatisfied (0-4) 5 6 ( TF) 4 1 Neutral (5) 6 9 ( TF) 6 3 Satisfied (6-10) ( B) 96 ( BT) Mean rating (out of 10) Greater Wellington Regional Council 2013/14 Public Transport Passenger Satisfaction Survey Page 30
33 Rating East By West Go Wellington Mana Newlands Tranz Metro Valley Flyer (n=152) (n=771) (n=123) (n=60) (n=2,619) (n=271) ( ET) ( ET) ( ET) 9 ( E) ( GMTV) ( GV) 85 Mean rating (out of 10) Base: All bus respondents who answered this question, excluding Not applicable responses. Letter notation denotes mode(s)/operator(s) that this result is significantly higher than; B=Bus, T=Train, F=Ferry. E=East By West, G=Go Wellington, M=Mana Coachlines, N=Newlands Coachlines, T=Tranz Metro, V=Valley Flyer. Note: Sample size for Madge Coachlines (n=5) and Tranzit Coachlines (n=14) too small to provide statistically reliable results. Rating of 6-10 significantly more likely Aged 65 years + (95%) Travelling on a SuperGold card (94%) Rating of 0-4 signficantly more likely Aged years (11%) Greater Wellington Regional Council 2013/14 Public Transport Passenger Satisfaction Survey Page 31
34 The Attitude of the Driver/Staff Wellington public transport users are also generally satisfied with the attitude of the driver/staff they dealt with, 89% satisfied to some extent (giving a rating of between 6 and 10), including just over a quarter (27%) who were extremely satisfied. Only 5% of respondents express dissatisfaction with the driver/staff s attitude. Of the three modes, ferry staff are rated most positively for their attitude (98% at least satisfied, including 41% who were extremely satisfied). Staff on ferry (98%) and train (89%) services are rated significantly more positively for their attitude than bus drivers (86%). Results by operator show that ratings for the attitude of staff are most positive for East by West Ferries (98%). In contrast, levels of satisfaction with staff attitude are significantly lower among those travelling on Go Wellington (85%) and Valley Flyer (84%) services in particular. Nine per cent of Valley Flyer passengers were dissatisfied to some extent with the attitude of their driver. Table 3.7: Attitude of the Driver/Staff By Mode and Operator (%) Rating Total Bus Train Ferry (N=4,088) (n=1,274) (n=2,661) (n=153) Dissatisfied (0-4) 5 7 ( TF) 5 ( F) 1 Neutral (5) 6 7 ( TF) 6 ( F) 1 Satisfied (6-10) ( B) 98 ( BT) Mean rating (out of 10) Greater Wellington Regional Council 2013/14 Public Transport Passenger Satisfaction Survey Page 32
35 Rating East By West Go Wellington Mana Newlands Tranz Metro Valley Flyer (n=153) (n=793) (n=127) (n=60) (n=2,661) (n=275) ( ET) ( E) 9 ( EMT) ( E) 8 ( E) 5 6 ( E) 7 ( E) ( GMTV) ( GV) 84 Mean rating (out of 10) Base: All bus respondents who answered this question, excluding Not applicable responses. Letter notation denotes mode(s)/operator(s) that this result is significantly higher than; B=Bus, T=Train, F=Ferry. E=East By West, G=Go Wellington, M=Mana Coachlines, N=Newlands Coachlines, T=Tranz Metro, V=Valley Flyer. Note: Sample size for Madge Coachlines (n=5) and Tranzit Coachlines (n=14) too small to provide statistically reliable results. Rating of 6-10 significantly more likely Aged 65 years or older (95%) Travelling on a SuperGold card (94%) Rating of 0-4 signficantly more likely Aged years (15%) Greater Wellington Regional Council 2013/14 Public Transport Passenger Satisfaction Survey Page 33
36 Having Enough Seats Available Wellington public transport users are generally satisfied with the availability of seats on the services used, 84% satisfied to some extent (giving a rating of between 6 and 10), including just less than a third (30%) who are extremely satisfied. In contrast, 10% of respondents express dissatisfaction with having enough seats available. Of the three modes, ferry passengers are significantly more likely to be satisfied with the sufficiency of seats (95% satisfied, including 32% who are extremely satisfied). In contrast, levels of satisfaction are significantly lower among bus (87%) and train (82%) passengers. Twelve per cent of train passengers report being dissatisfied with the availability of seats. Results by operator show that East by West Ferries performs most positively for having enough seats available (95% satisfied) while Tranz Metro performs significantly less well when compared with all other operators (82%). Satisfaction levels are similar across each of the bus operators. Figure 3.8: Having Enough Seats Available By Mode and Operator (%) Rating Total Bus Train Ferry (N=4,260) (n=1,330) (n=2,778) (n=152) Dissatisfied (0-4) ( BF) 4 Neutral (5) 6 6 ( F) 6 ( F) 1 Satisfied (6-10) ( T) ( BT) Mean rating (out of 10) Greater Wellington Regional Council 2013/14 Public Transport Passenger Satisfaction Survey Page 34
37 Rating East By West Go Wellington Mana Newlands Tranz Metro Valley Flyer (n=152) (n=847) (n=124) (n=60) (n=2,778) (n=280) ( EGMV) ( E) 5 ( E) 3 6 ( E) 7 ( E) ( GTV) 87 ( T) 89 ( T) Mean rating (out of 10) Base: All bus respondents who answered this question, excluding Not applicable responses. Letter notation denotes mode(s)/operator(s) that this result is significantly higher than; B=Bus, T=Train, F=Ferry. E=East By West, G=Go Wellington, M=Mana Coachlines, N=Newlands Coachlines, T=Tranz Metro, V=Valley Flyer. Note: Sample size for Madge Coachlines (n=5) and Tranzit Coachlines (n=14) too small to provide statistically reliable results. Rating of 6-10 significantly more likely Travelling on a SuperGold card (96%) or paying cash (91%) Aged 65 years + (94%) Travelling off-peak (91%), particularly in the weekend (92%) Rating of 0-4 signficantly more likely Travelling on a monthly pass (15%) or a Ten Trip Card (14%) Travelling during the peak (14%) Travelling inbound (12%) Greater Wellington Regional Council 2013/14 Public Transport Passenger Satisfaction Survey Page 35
38 How Often the Service Runs Four in five passengers (80%) give a positive rating for how often the service run, including 16% who rate the frequency of trip as 10 out of 10, indicating they are extremely satisfied. In contrast, 11% give a negative rating. While the share of positive ratings is similar by mode, bus passengers are significantly more likely to rate the frequency of bus service negatively (13%) than train users (10%). With the exception of Mana Coachlines (68%), the share of positive ratings for frequency of service is similar across all operators. Figure 3.9: How Often the Service Runs By Mode and Operator (%) Rating Total Bus Train Ferry (N=3,919) (n=1,193) (n=2,584) (n=142) Dissatisfied (0-4) ( T) Neutral (5) Satisfied (6-10) Mean rating (out of 10) Greater Wellington Regional Council 2013/14 Public Transport Passenger Satisfaction Survey Page 36
39 Rating East By West Go Wellington Mana Newlands Tranz Metro Valley Flyer (n=142) (n=768) (n=109) (n=50) (n=2,584) (n=247) ( EGTV) ( M) 80 ( M) ( M) 80 ( M) Mean rating (out of 10) Base: All bus respondents who answered this question, excluding Not applicable responses. Letter notation denotes mode(s)/operator(s) that this result is significantly higher than; B=Bus, T=Train, F=Ferry. E=East By West, G=Go Wellington, M=Mana Coachlines, N=Newlands Coachlines, T=Tranz Metro, V=Valley Flyer. Note: Sample size for Madge Coachlines (n=5) and Tranzit Coachlines (n=14) too small to provide statistically reliable results. Rating of 6-10 significantly more likely Using a SuperGold card (90%) Aged 65 years + (89%) Travelling off-peak (83%) Rating of 0-4 signficantly more likely Using a stored-value card (14%) or Ten Trip ticket (13%) Travelling during peak time (13%) Greater Wellington Regional Council 2013/14 Public Transport Passenger Satisfaction Survey Page 37
40 The Service Being On Time (Keeping to the Timetable) Around three-quarters of Wellington s public transport users are satisfied to some extent with their service keeping to the timetable, 77% giving a positive rating for reliability, including 17% giving a rating of 10 out of 10 (indicating extreme satisfaction). In contrast, 14% of passengers are dissatisfied with the service being on time. Ferry passengers are significantly more likely to be satisfied with the reliability of the service (91%) than those travelling by bus (77%) or train (77%). Results by operator show that East by West Ferries passengers are most positive about the service running to time (91%). Perceptions of reliability are similar across all bus operators, with the exception of Valley Flyer passengers, only 70% satisfied with these services being on time, and one in five passengers (21%) expressing some level of dissatisfaction. Figure 3.10: The Service Being On Time By Mode and Operator (%) Rating Total Bus Train Ferry (N=4,231) (n=1,311) (n=2,767) (n=153) Dissatisfied (0-4) ( F) 15 ( F) 4 Neutral (5) Satisfied (6-10) ( BT) Mean rating (out of 10) Greater Wellington Regional Council 2013/14 Public Transport Passenger Satisfaction Survey Page 38
41 Rating East By West Go Wellington Mana Newlands Tranz Metro Valley Flyer (n=153) (n=833) (n=124) (n=55) (n=2,767) (n=280) ( E) 16 ( E) 13 ( E) 15 ( E) 21 ( EGT) ( V) ( V) 70 ( GMNTV) Mean rating (out of 10) Base: All bus respondents who answered this question, excluding Not applicable responses. Letter notation denotes mode(s)/operator(s) that this result is significantly higher than; B=Bus, T=Train, F=Ferry. E=East By West, G=Go Wellington, M=Mana Coachlines, N=Newlands Coachlines, T=Tranz Metro, V=Valley Flyer. Note: Sample size for Madge Coachlines (n=5) and Tranzit Coachlines (n=14) too small to provide statistically reliable results. Rating of 6-10 significantly more likely Travelling on a SuperGold card (89%) or paying cash (81%) Aged 65 years + (88%) Travelling on off-peak services (81%) Travelling outbound (79%) Rating of 0-4 signficantly more likely Aged years (20%) Travellling on peak services (16%), particualrly the AM peak (17%) Travelling inbound (16%) Greater Wellington Regional Council 2013/14 Public Transport Passenger Satisfaction Survey Page 39
42 Value for Money of the Fare Perceptions of the value for money of the fare are mixed. Seventy per cent of respondents are satisfied to some extent, including 16% who are extremely satisfied (giving a rating of 10 out of 10), while one in five passengers (18%) are dissatisfied with the value for money. Ferry passengers are significantly more likely to rate the value for money of the fares positively (81%) than those travelling by bus (72%) or train (68%). Twenty per cent of train passengers are dissatisfied with the value for money of the fare. Results by operator show that East by West Ferries performs most positively for the value for money of the fare (81% satisfied), this result significantly higher than for Go Wellington (70%) and Tranz Metro (68%). Go Wellington (17%) and Tranz Metro (20%) customers are over-represented among those dissatisfied with the value for money of the fare. Figure 3.11: Value for Money of the Fare By Mode and Operator (%) Rating Total Bus Train Ferry (N=4,182) (n=1,306) (n=2,2726) (n=150) Dissatisfied (0-4) ( F) 20 ( BF) 9 Neutral (5) Satisfied (6-10) ( T) ( BT) Mean rating (out of 10) Greater Wellington Regional Council 2013/14 Public Transport Passenger Satisfaction Survey Page 40
43 Rating East By West Go Wellington Mana Newlands Tranz Metro Valley Flyer (n=150) (n=828) (n=125) (n=57) (n=2,726) (n=278) ( EMN) ( EMN) ( GT) ( GT) 81 ( T) ( T) Mean rating (out of 10) Base: All bus respondents who answered this question, excluding Not applicable responses. Letter notation denotes mode(s)/operator(s) that this result is significantly higher than; B=Bus, T=Train, F=Ferry. E=East By West, G=Go Wellington, M=Mana Coachlines, N=Newlands Coachlines, T=Tranz Metro, V=Valley Flyer. Note: Sample size for Madge Coachlines (n=4) and Tranzit Coachlines (n=14) too small to provide statistically reliable results. Rating of 6-10 significantly more likely Travelling on a SuperGold card (93%) Aged 45 years or older (80%) Rating of 0-4 signficantly more likely Aged years (27%) Travelling on a Ten Trip card (22%) Greater Wellington Regional Council 2013/14 Public Transport Passenger Satisfaction Survey Page 41
44 3.3 Current Trip Drivers of Satisfaction 8 Of the ten aspects of the trip surveyed on, the value for money of the fare has the greatest positive impact on overall satisfaction with the trip. Whilst the relative importance of each aspect of the trip are similar by mode, the value for money of the fare is a stronger driver of satisfaction among ferry (0.69) and bus (0.67) passengers than those using the train (0.60). In addition, bus (0.65) and ferry (0.65) passengers place greater importance on personal security during the trip than those using the train (0.56). The quality of the interaction with staff is notably more important for bus passengers than those travelling by train or ferry, bus users placing high importance on both the helpfulness of the driver (0.66, compared with 0.56 among both train and ferry passengers), and the attitude of the driver (0.64, compared with 0.57 among ferry passengers and 0.54 among those using the train). Level of Influence on Overall Satisfaction Table 3.2a: Drivers of Satisfaction with Current Trip Core Driver Value for money of the fare (0.63) Important Driver Driver of Lesser Importance Personal security during the trip (0.59) Helpfulness of staff (0.59) Attitude of staff (0.57) Being on time (0.56) Comfort of inside temperature (0.56) Ease of getting off vehicle (0.55) Ease of getting on vehicle (0.55) How often the service runs (0.54) Having enough seats available (0.54) 8 Through the use of statistical analyses (correlation analysis), the relative influence of each service attribute ( driver ) on overall satisfaction has been derived. Service attributes with a correlation score of 0.60 or more show a strong relationship with overall satisfaction and therefore have been defined as core drivers of overall satisfaction. These service attributes should be considered priorities for action/additional resourcing as improvements in the performance of these attributes can be expected to have the most positive impact on overall satisfaction. Service attributes with a correlation score of 0.50 to 0.59 are considered important drivers of satisfaction, while attributes with a correlation score of less than 0.50 have only a weak relationship with overall satisfaction and therefore are considered drivers of lesser importance. Greater Wellington Regional Council 2013/14 Public Transport Passenger Satisfaction Survey Page 42
45 Table 3.2b: Drivers of Satisfaction with Current Trip By Mode Driver Bus (N=1,346) Train (N=2,799) Ferry (N=153) The value for money of the fare The helpfulness of staff Personal security during this trip The attitude of the driver Comfort of the inside temperature The ease of getting on the bus The ease of getting off the bus The bus being on time Having enough seats available How often the service runs Current Trip - Performance versus Influence (Gap Analysis) Figure 3.12 maps the relative influence of each aspect of the current trip against current performance. The trend line 9 slopes down and to the right. This result indicates a mismatch between performance and influence, with the current trip performing less well on at least one of the most important drivers of satisfaction. The key area of concern is the value for money of the fare. This aspect of the trip is identified as the core driver of trip satisfaction (positioned closest to the top of the grid), but is currently the most poorly performing aspect of the trip. Improvements in this area either by reducing the cost of fares (such as the proposed 25% reduction in off-peak fares) and/or adding value through additional facilities and improving service delivery - over the next 12 months can be expected to have a positive impact on trip overall satisfaction. The positioning of the remaining aspects of the trip is more positive. In particular, the helpfulness of the driver/staff and perceptions of personal security during the trip, both of which have a strong influence on overall satisfaction, are currently performing well (89% and 95% satisfied respectively). 9 The trend line assists in depicting the overall relationship between relative influence and performance across the service attributes/drivers. In an ideal situation, the trend line should slope up to the right. This illustrates that the public transport system is performing best on those aspects of service that are most important to passengers/that have the greatest influence on overall satisfaction. A trend line that slopes down to the right indicates a mismatch between performance and importance/influence that is, at least one service attribute identified as core/important to passengers is currently under-performing (suggesting the need for more resource in this area for example, planning, training, quality control etc.) and/or at least one service attribute with a high performance rating is identified as having little or no importance to passengers/has only minimal influence on overall satisfaction. Greater Wellington Regional Council 2013/14 Public Transport Passenger Satisfaction Survey Page 43

46 Figure 3.12: Performance versus Influence Current Trip Greater Wellington Regional Council 2013/14 Public Transport Passenger Satisfaction Survey Page 44
47 4. Passenger Perceptions of Stop/Station/Wharf Highlights Almost all passengers are satisfied to some extent with the stop, station or wharf where they started their trip, 91% giving a positive rating (between 6 and 10), including 16% of respondents indicating that they are extremely satisfied (giving a rating of 10 out of 10). Only 4% of respondents are dissatisfied with the stop, station or wharf overall. Of the six aspects of the stop/station/wharf evaluated, respondents are most positive about the ease of getting onto the vehicle from the stop, 94% rating this aspect positively. Ratings are also very positive for the stop/station/wharf being easy to get to (91%). Passengers key area of concern with respect to stops/stations/wharves is the adequacy of shelter from the weather, only 71% rating this aspect positively, and one in five (18%) expressing dissatisfaction. Ferry passengers in particular are dissatisfied with the provision of shelter at wharves, only 38% giving a positive rating, and 39% expressing dissatisfaction. Public transport users strength of feeling about the provision of shelter is further illustrated by the fact that the provision of more shelter from the weather is the most frequently cited suggestion to enhance the current stop/station/wharf offer, 19% of all respondents mentioning this unprompted. Greater Wellington Regional Council 2013/14 Public Transport Passenger Satisfaction Survey Page 45
48 4.1 Overall Satisfaction with Stop/Station/Wharf All Modes Almost all public transport users are satisfied to some extent with the stop, station or wharf where they started their trip, 91% giving a positive rating (between 6 and 10), including 16% of respondents giving a rating of 10 out of 10. Only 4% of respondents are dissatisfied with the stop, station or wharf. Ratings are similar across transport mode, 93% of ferry passengers, 91% of train passengers and 90% of those travelling by bus satisfied to some extent with the stop/station/wharf where they commenced their trip. Figure 4.1: Overall Satisfaction with Stop/Station/Wharf By Mode (%) Rating Total Bus Train Ferry (N=4,190) (n=1,306) (n=2,736) (n=148) Dissatisfied (0-4) Neutral (5) Satisfied (6-10) Mean rating (out of 10) Base: All respondents who answered this question, excluding Not applicable responses. Letter notation denotes mode(s) that this result is significantly higher than; B=Bus, T=Train, F=Ferry. Greater Wellington Regional Council 2013/14 Public Transport Passenger Satisfaction Survey Page 46
49 Rating of 6-10 significantly more likely Aged years (94%) Travelling interpeak (93%) Travelling outbound (93%) Rating of 0-4 signficantly more likely Travelling on Valley Flyer services (7%) Aged years (7%) Travelling inbound (5%) 4.2 Comparative Perceptions of Stop/Station/Wharf Of the six aspects of the stop/station/wharf evaluated, public transport users are most positive about the ease of getting onto the vehicle from the stop, 94% rating this aspect positively (that is, giving a rating between 6 and 10). Train passengers are particularly positive about this aspect of station provision, 95% satisfied to some extent, this result significantly higher than for bus stop (93%) and ferry wharf (90%) users. Ratings are also very positive for the stop/station/wharf being easy to get to, 91% giving a rating of between 6 and 10. In contrast, ratings were notably less positive for the stop/station/wharf providing adequate shelter from the weather, only 71% of passengers rating this aspect positively. Ferry passengers are particularly dissatisfied with the provision of shelter at wharves, only 38% giving a positive rating, and 39% expressing dissatisfaction. The results for each aspect of the stop/station/wharf are provided in more detail in the following sections. Table 4.1: Comparative Perceptions of Stop/Station/Wharf (%) Share Giving Positive Ratings (6-10) Aspect of Service Total Sample (N=4,298) Bus (n=1,346) Train (n=2,799) Ferry (n=153) The ease of getting on the vehicle from the ( BF) 90 stop/station/wharf The stop/station/wharf being easy to get to ( T) Your personal safety at the stop/station/wharf ( B) The information available at the stop/station/wharf ( B) 80 The cleanliness of the stop/station/wharf ( BT) The stop/station/wharf providing shelter from the weather ( F) 75 ( BF) 38 Base: All respondents, excluding those giving a not applicable response. Sample sizes vary slightly by aspect of service. Letter notation denotes mode(s) that this result is significantly higher than; B=Bus, T=Train, F=Ferry. Greater Wellington Regional Council 2013/14 Public Transport Passenger Satisfaction Survey Page 47
50 The Ease of Getting On The Vehicle From The Stop/Station/Wharf Almost all public transport users (94%) are satisfied to some extent with the ease of getting on the vehicle from the stop, station or wharf, including 39% who are extremely satisfied (giving a rating of 10 out of 10). Train passengers are significantly more likely to rate the ease of boarding positively (95%) than those travelling by bus (93%) or ferry (90%). Figure 4.2: Ease Of Getting On The Vehicle From The Stop/Station/Wharf By Mode (%) Rating Total Bus Train Ferry (N=4,277) (n=1,339) (n=2,785) (n=153) Dissatisfied (0-4) Neutral (5) ( BT) Satisfied (6-10) ( BF) 90 Mean rating (out of 10) Base: All respondents who answered this question, excluding Not applicable responses. Letter notation denotes mode(s) that this result is significantly higher than; B=Bus, T=Train, F=Ferry. Rating of 6-10 significantly more likely (None) Rating of 0-4 signficantly more likely Travelling in the weekend (56%) Greater Wellington Regional Council 2013/14 Public Transport Passenger Satisfaction Survey Page 48
51 The Stop/Station/Wharf Being Easy To Get To (By Car, Walking etc) Almost all Wellington public transport users consider the stop/station/wharf where they board their service to be easy to get to, 91% giving a positive rating (6-10), including 37% who are extremely satisfied (rating the ease of access as 10 out of 10). Bus passengers were significantly more likely to rate the ease of access to the stop positively (93%) than those travelling by train (90%). Figure 4.3: Stop/Station/Wharf Being Easy To Get To By Mode (%) Rating Total Bus Train Ferry (N=4,259) (n=1,329) (n=2,778) (n=152) Dissatisfied (0-4) ( BF) 1 Neutral (5) ( B) 5 Satisfied (6-10) ( T) Mean rating (out of 10) Base: All respondents who answered this question, excluding Not applicable responses. Letter notation denotes mode(s) that this result is significantly higher than; B=Bus, T=Train, F=Ferry. Greater Wellington Regional Council 2013/14 Public Transport Passenger Satisfaction Survey Page 49
52 Rating of 6-10 significantly more likely Travelling on Go Wellington services (96%) Travelling on a stored value card (95%) Aged years (94%) Travelling interpeak (93%) Travelling on an outbound service (93%) Rating of 0-4 signficantly more likely Travelling during the AM peak (6%) Travelling on Tranz Metro services (5%) Travelling on an inbound service (5%) Greater Wellington Regional Council 2013/14 Public Transport Passenger Satisfaction Survey Page 50
53 Your Personal Safety At The Stop/Station/Wharf Public transport users generally feel safe at stops/stations/wharves while waiting for their service, 86% giving a positive rating for personal safety, including 24% who are extremely satisfied (rating the personal safety as 10 out of 10). Ferry passengers are significantly more likely to report feeling safe at the wharf (92%) than those using the train (87%) or bus (85%). Figure 4.4: Personal Safety At The Stop/Station/Wharf By Mode (%) Rating Total Bus Train Ferry (N=4,232) (n=1,318) (n=2,762) (n=152) Dissatisfied (0-4) Neutral (5) Satisfied (6-10) ( BT) Mean rating (out of 10) Base: All respondents who answered this question, excluding Not applicable responses. Letter notation denotes mode(s) that this result is significantly higher than; B=Bus, T=Train, F=Ferry. Rating of 6-10 significantly more likely Males (88%) Travelling outbound (88%) Rating of 0-4 signficantly more likely Travelling in the weekend (10%) Travelling inbound (8%) Greater Wellington Regional Council 2013/14 Public Transport Passenger Satisfaction Survey Page 51
54 The Information Available At The Stop/Station/Wharf Public transport users are generally satisfied with the provision of information available at the stop/station/wharf, 83% giving a positive rating (6-10) including 22% of respondents who are extremely satisfied (rating the provision of information as 10 out of 10). Train passengers are significantly more likely to give a positive rating for the provision of information (85%) than those travelling by bus (80%). Figure 4.5: Information Available At The Stop/Station/Wharf By Mode (%) Rating Total Bus Train Ferry (N=4,174) (n=1,296) (n=2,732) (n=146) Dissatisfied (0-4) 9 11 ( T) 8 10 Neutral (5) 8 9 ( T) 7 10 Satisfied (6-10) ( B) 80 Mean rating (out of 10) Base: All respondents who answered this question, excluding Not applicable responses. Letter notation denotes mode(s) that this result is significantly higher than; B=Bus, T=Train, F=Ferry. Rating of 6-10 significantly more likely Aged years (87%) Travelling outbound (87%) Rating of 0-4 signficantly more likely Aged years (14%) Travelling in the weekend (12%) Travelling inbound (11%) Greater Wellington Regional Council 2013/14 Public Transport Passenger Satisfaction Survey Page 52
.")
55 The Cleanliness Of The Stop/Station/Wharf Stops/stations/wharves are generally considered clean, 82% rating this aspect of the stop positively (6-10) including 17% who are extremely satisfied (giving a rating of 10 out of 10). Ferry passengers are significantly more likely to be satisfied with the cleanliness of the wharf where they boarded (96%) than those using train stations (82%) or bus stops (80%). Figure 4.6: Cleanliness Of Stop/Station/Wharf By Mode (%) Rating Total Bus Train Ferry (N=4,233) (n=1,313) (n=2,768) (n=152) Dissatisfied (0-4) 9 10 ( F) 9 ( F) 1 Neutral (5) 9 10 ( F) 9 ( F) 3 Satisfied (6-10) ( BT) Mean rating (out of 10) Base: All respondents who answered this question, excluding Not applicable responses. Letter notation denotes mode(s) that this result is significantly higher than; B=Bus, T=Train, F=Ferry. Rating of 6-10 significantly more likely Travelling interpeak (85%) Rating of 0-4 signficantly more likely Aged years (20%) Travelling inbound (11%) Greater Wellington Regional Council 2013/14 Public Transport Passenger Satisfaction Survey Page 53
56 The Stop/Station/Wharf Providing Shelter From The Weather Ratings for the stop/station/wharf providing shelter from the weather are less positive than other aspects, just 71% rating the provision of shelter positively, including 19% giving a rating of 10 out of 10. In contrast, one in five respondents (19%) express some level of dissatisfaction with the provision of shelter from the weather. Ratings are particularly poor for the provision of shelter at ferry wharves, just 38% of ferry passengers satisfied to some extent (compared with 68% of bus passengers and 75% of those travelling by train), and 39% rating the provision of shelter at ferry wharves negatively. Figure 4.7: Stop/Station/Wharf Providing Shelter From The Weather By Mode (%) Rating Total Bus Train Ferry (N=4,249) (n=1,311) (n=2,787) (n=151) Dissatisfied (0-4) ( T) ( BT) Neutral (5) ( BT) Satisfied (6-10) ( F) 75 (BF) 38 Mean rating (out of 10) Base: All respondents who answered this question, excluding Not applicable responses. Letter notation denotes mode(s) that this result is significantly higher than; B=Bus, T=Train, F=Ferry. Greater Wellington Regional Council 2013/14 Public Transport Passenger Satisfaction Survey Page 54
57 Rating of 6-10 significantly more likely Travelling on a Day Pass (81%) Aged years (77%) Travelling off-peak (76%), particularly interpeak (77%) Travelling outbound (76%) Rating of 0-4 signficantly more likely Travelling on Newlands (38%), Mana (29%) or Valley Flyer (25%) services Travelling on a stored value card (23%) Aged years (22%) Travelling inbound (22%) Travelling during peak times (20%), particularly the AM peak (21%) Greater Wellington Regional Council 2013/14 Public Transport Passenger Satisfaction Survey Page 55
58 4.3 Bus Stop/Train Station/Ferry Wharf Drivers of Satisfaction 10 As Table 4.2 shows, of the six aspects of the stop/station/ferry wharf respondents were questioned on, sense of personal safety and the cleanliness of the stop/station/wharf have the greatest positive impacts on overall satisfaction with the stop/station/wharf. Service enhancements in these areas over the next 12 months can be expected to have the greatest positive impact on overall satisfaction. Whilst the relative importance of each aspect of the stop/station/wharf are similar by mode, the wharf providing shelter from the weather is a stronger driver of satisfaction among ferry users (0.64) than those using the train (0.58). In contrast, train passengers place greater importance on the ease of getting on the train from the station (0.69) than those using the ferry (0.57). Level of Influence on Overall Satisfaction Table 4.2a: Drivers of Satisfaction with Stop/Station/Ferry Wharf Core Driver Important Driver Personal safety (0.65) Cleanliness of the stop/station/wharf (0.65) Information available (0.61) Providing shelter from the weather (0.61) Ease of getting onto the vehicle from the stop/station/wharf (0.60 Driver of Lesser Importance Ease of getting to the stop/station/wharf (0.49) Table 4.2b: Drivers of Satisfaction with Current Trip By Mode Driver Bus (N=1,302) Train (N=2,739) Ferry (N=148) The cleanliness of the stop/station/wharf Your personal safety at the stop/station/wharf The stop/station/wharf providing shelter from the weather The information available at the stop/station/wharf The ease of getting on the vehicle from the stop/station/wharf The stop/station/wharf being easy to get to Through the use of statistical analyses (correlation analysis), the relative influence of each service attribute ( driver ) on overall satisfaction has been derived. Service attributes with a correlation score of 0.60 or more show a strong relationship with overall satisfaction and therefore have been defined as core drivers of overall satisfaction. These service attributes should be considered priorities for action/additional resourcing as improvements in the performance of these attributes can be expected to have the most positive impact on overall satisfaction. Service attributes with a correlation score of 0.50 to 0.59 are considered important drivers of satisfaction, while attributes with a correlation score of less than 0.50 have only a weak relationship with overall satisfaction and therefore are considered drivers of lesser importance. Greater Wellington Regional Council 2013/14 Public Transport Passenger Satisfaction Survey Page 56

59 Bus Stop/Station/Wharf - Performance versus Influence (Gap Analysis) Figure 4.8 maps the relative influence of each aspect of the current trip against current performance. The trend line 11 slopes down and to the right. This result indicates a mismatch between performance and influence, with the current trip performing less well on at least one of the most important drivers of satisfaction. The key area of concern is the provision of shelter from the weather. This aspect of the trip is identified as one of the core drivers of trip satisfaction (positioned closest to the top of the grid), but is currently the most poorly performing aspect of the trip. Improvements in this area, particularly the provision of adequate shelter at ferry wharves, over the next 12 months can be expected to have a positive impact on trip overall satisfaction. Figure 4.8: Performance versus Influence Bus Stop/Station/Wharf 11 The trend line assists in depicting the overall relationship between relative influence and performance across the service attributes/drivers. In an ideal situation, the trend line should slope up to the right. This illustrates that the public transport system is performing best on those aspects of service that are most important to passengers/that have the greatest influence on overall satisfaction. A trend line that slopes down to the right indicates a mismatch between performance and importance/influence that is, at least one service attribute identified as core/important to passengers is currently under-performing (suggesting the need for more resource in this area for example, planning, training, quality control etc.) and/or at least one service attribute with a high performance rating is identified as having little or no importance to passengers/has only minimal influence on overall satisfaction. Greater Wellington Regional Council 2013/14 Public Transport Passenger Satisfaction Survey Page 57
60 4.4 Suggestions for Improvement to Stop/Station/Wharf In line with the current high level of dissatisfaction expressed by passengers, the most frequently mentioned suggestion for improvements to the stop/station/wharf where the passenger boarded is the provision of more and/or improved shelter from the weather (19%). Other frequently mentioned suggestions relating to the physical infrastructure included cleaner stops (including the provision of more rubbish bins) (8%) and the need for more seats (5%). Improving the provision of information available at the stop/station/wharf was also frequently cited, 5% calling for more information to be made available, 4% wanting the installation of Real Time Information boards, and 3% suggesting the need for better information about service delays, disruption and changes (such as buses replacing trains). Eight per cent of respondents specifically stated that no improvements to the stop/station/wharf were needed. Note: The table below lists those suggestions made by 2% or more of respondents. A full list of suggestions for improvement are provided in Appendix Four. Table 4.3: Suggestions for Improvement to Stop/Station/Wharf (%) Suggestion for Improvement Total Sample (N=4298) Significantly More Likely To Be Mentioned By Those More/improved shelter from weather (wind, rain, sun) 19 Newlands Coach (37%), East By West Ferry (36%) or Mana Coach (31%) passengers Stored Value Card holders (23%) Making inbound trips (23%) Peak travellers (21%), particularly those travelling in the morning peak (22%) Cleaner stops and stations, including having more rubbish bins available 8 Aged years (12%) Monthly pass holders (10%) Tranz Metro passengers (9%) More information available/information 5 easier to read (e.g. timetables, pricing, routes etc.) More seats available 5 Aged years (8%) Females (6%) More Real Time Information boards 4 Newlands Coach (15%) or Go Wellington (9%) passengers Stored Value Card holders (10%) More information/better warning of service delays/disruptions/replacement buses 3 Greater Wellington Regional Council 2013/14 Public Transport Passenger Satisfaction Survey Page 58
61 Suggestion for Improvement Total Sample (N=4298) Significantly More Likely To Be Mentioned By Those More/improved parking available 3 Aged years (5%) Making inbound trips (5%) Peak travellers (4%), particularly those travelling in the morning peak (7%) Ten Trip or Monthly pass holders (5%) Tranz Metro passengers (4%) Better lighting 3 Morning peak travellers (4%) Making inbound trips (4%) Ten Trip and Monthly Pass holders (4%) Females (4%) Better access to the stop/station (improved footpaths, over-bridges, pedestrian crossing etc.) 3 Ten Trip card holders (4%) Peak travellers (3%), particularly those travelling in the morning peak (4%) Maintenance work fix leaks in roof, holes in footpath, remove graffiti, replace broken 2 Morning peak travellers (3%) Making inbound trips (3%) glass etc. Improved access to toilet facilities 2 Tranz Metro passengers (3%) Females (3%) Provide a waiting area/waiting lounge (with 2 Tranz Metro passengers (3%) water, music, coffee, ATM, newspapers, vending machines etc.) Improved pedestrian safety non-slip 2 East by West Ferry passengers (5%) surfaces etc. Improve security/install security cameras 2 Making inbound trips (2%) Build new building/shelter/finish renovations 2 No improvements needed 8 Aged years (12%) Interpeak (10%) and weekend (10%) travellers Blank 41 SuperGold Card holders (50%) Aged 65 years + (44%) Base: All respondents. Multiple responses to this question permitted, consequently table may total more than 100%. Table lists those improvements mentioned by 2% or more of respondents. Greater Wellington Regional Council 2013/14 Public Transport Passenger Satisfaction Survey Page 59
62 Table 4.4 provides suggestions for improvement to the stop/station/wharf by mode of transport, and highlights significant differences in frequency of mention by mode. The need for more/improved shelter from the weather is significantly more likely to be mentioned by ferry (36%) and bus (21%) passengers than those travelling by train (17%). Cleanliness of the stop/station and the need for more seats are significantly more likely to be cited by train and bus passengers than those travelling by ferry, while the need for more Real Time Information boards is significantly more likely to be cited by bus passengers (8%) than those using the train (2%) or ferry (1%). Table 4.4: Key Suggestions for Improvement to Stop/Station/Wharf by Mode (%) Suggestions Total Sample (N=4298) Bus (n=1346) Train (n=2977) Ferry (n=153) More/improved shelter from weather (wind, rain, sun) ( T) ( BT) Cleaner stops and stations, including having more rubbish 8 6 ( F) 9 ( BF) 0 bins available More information available/information easier to read (e.g. timetables, pricing, routes etc.) More seats available 5 6 ( F) 5 ( F) 1 More Real Time Information boards 4 8 ( TF) 2 1 More information/better warning of service delays/disruptions/replacement buses More/improved parking available 3 <1 4 ( B) 3 ( B) Better lighting ( B) 1 Better access to the stop/station (improved footpaths, ( B) 3 ( B) over-bridges, pedestrian crossing etc.) Maintenance work fix leaks in roof, holes in footpath, remove graffiti, replace broken glass etc. Improved access to toilet facilities 2 <1 3 ( B) 1 Provide a waiting area/waiting lounge (with water, music, 2 <1 3 ( B) 3 ( B) coffee, ATM, newspapers, vending machines etc.) Improved pedestrian safety non-slip surfaces etc ( B) 5 ( BT) Improve security/install security cameras 2 <1 2 ( B) 0 Build new building/shelter/finish renovations No improvements needed Blank ( T) Base: All respondents who answered this question. Letter notation denotes mode(s) that this result is significantly higher than; B=Bus, T=Train, F=Ferry. Greater Wellington Regional Council 2013/14 Public Transport Passenger Satisfaction Survey Page 60
63 5. Passenger Perceptions of Wellington Region s Public Transport System Highlights Passenger perceptions of Wellington s public transport system are generally positive, 83% expressing some degree of satisfaction (that is, giving a rating of between 6 and 10), including 8% who are extremely satisfied. In contrast, 8% of public transport users are dissatisfied. Overall satisfaction ratings are similar across modes - 83% for bus and train passengers, 82% among ferry users. All four aspects of the public transport system considered are core drivers of overall satisfaction, with travel time having the strongest influence. Of the four aspects of the public transport system considered, respondents are most positive about the ease of getting information about public transport routes and timetables, and the travel times (given the distance to be travelled), 83% satisfied with these aspects to some extent. In contrast, a key weakness of the region s public transport system appears to be the provision of information about service delays or disruptions. Less than two-thirds of public transport users (62%) are satisfied with this aspect of the public transport system, and almost a quarter (23%) express some level of dissatisfaction, including 2% who are extremely dissatisfied. Levels of dissatisfaction with information about service delays and disruptions are particularly high among bus passengers (27% dissatisfied, compared with 22% of train passengers, and 17% of those travelling by ferry). Greater Wellington Regional Council 2013/14 Public Transport Passenger Satisfaction Survey Page 61
64 5.1 Overall Satisfaction with Wellington Region s Public Transport System All Modes Wellington s public transport users are generally satisfied with the region s public transport system, 83% expressing some degree of satisfaction (that is, giving a rating of between 6 and 10), including 8% who are extremely satisfied. In contrast, 8% of public transport users are dissatisfied with the region s public transport system. Whilst levels of satisfaction are similar by mode, respondents using the train (9%) are significantly more likely to express some level of dissatisfaction than bus passengers (7%). Figure 5.1: Overall Satisfaction with Wellington Region s Public Transport System By Mode of Transport (%) Rating Total Bus Train Ferry (N=4,189) (n=1,302) (n=2,739) (n=148) Dissatisfied (0-4) ( B) 9 Neutral (5) Satisfied (6-10) Mean rating (out of 10) Base: All respondents who answered this question, excluding Not applicable responses. Letter notation denotes mode(s) that this result is significantly higher than; B=Bus, T=Train, F=Ferry. Greater Wellington Regional Council 2013/14 Public Transport Passenger Satisfaction Survey Page 62
65 Rating of 6-10 significantly more likely Travelling on a SuperGold Card (94%) Aged 65 years + (92%) Rating of 0-4 signficantly more likely Travelling on a Ten Trip ticket (11%) 5.2 Comparative Perceptions of Wellington Region s Public Transport System Of the four aspects of the public transport system evaluated, public transport users are most positive about the ease of getting information about public transport routes and timetables and the travel time (given the distance to be travelled), 83% rating both aspects positively (that is, giving a rating between 6 and 10). Both these aspects of the public transport system were rated similarly across modes. In contrast, ratings are notably less positive for the availability of information about service delays or disruptions, only 62% of passengers rating this aspect positively. Bus passengers are particularly dissatisfied with the provision of information about delays and disruptions, only 55% giving a positive rating, and 27% expressing dissatisfaction. The results for each aspect of the public transport system are provided in more detail in the following sections. Table 5.1: Comparative Perceptions of Wellington Region s Public Transport System (%) Share Giving Positive Ratings (6-10) Aspect of Service Total Sample (N=4,298) Bus (n=1,346) Train (n=2,799) Ferry (n=153) Ease of getting information about public transport routes and timetables The travel time How convenient it is to pay for public transport ( T) Information about service delays or disruptions ( B) 67 ( B) Base: All respondents, excluding those giving a not applicable response. Note: Letter notation denotes mode(s) that this result is significantly higher than; B=Bus, T=Train, F=Ferry. Greater Wellington Regional Council 2013/14 Public Transport Passenger Satisfaction Survey Page 63
66 Ease of Getting Information about Public Transport Routes and Timetables Public transport passengers perceptions of the ease of access to information about routes and timetables are generally positive, 83% expressing some degree of satisfaction (giving a rating of between 6 and 10), including 16% who are extremely satisfied (giving a rating of 10 out of 10). Only 8% of passengers express some degree of dissatisfaction with the ease of sourcing public transport information. Perceptions of ease of access to information are similar across modes. Figure 5.2: Ease of Getting Information about Public Transport Routes and Timetables By Mode %) Rating Total Bus Train Ferry (N=4,180) (n=1,301) (n=2,733) (n=146) Dissatisfied (0-4) Neutral (5) Satisfied (6-10) Mean rating (out of 10) Base: All respondents who answered this question, excluding Not applicable responses. Letter notation denotes mode(s) that this result is significantly higher than; B=Bus, T=Train, F=Ferry. Rating of 6-10 significantly more likely (None) Rating of 0-4 signficantly more likely Aged years (11%) Greater Wellington Regional Council 2013/14 Public Transport Passenger Satisfaction Survey Page 64
67 The Travel Time (Considering The Distance You Travel) Public transport users are generally satisfied with the travel time (given the distance they have to travel), 83% satisfied to some extent, including 13% who are extremely satisfied. Only 9% of public transport users express dissatisfaction. Perceptions are similar across each of the transport modes. Figure 5.3: The Travel Time By Mode (%) Rating Total Bus Train Ferry (N=4,186) (n=1,301) (n=2,739) (n=146) Dissatisfied (0-4) Neutral (5) 8 10 ( T) 8 11 Satisfied (6-10) Mean rating (out of 10) Base: All respondents who answered this question, excluding Not applicable responses. Letter notation denotes mode(s) that this result is significantly higher than; B=Bus, T=Train, F=Ferry. Rating of 6-10 significantly more likely Travelling on a SuperGold Card (94%) Aged 65 years + (93%) Travelling on off-peak trips (85%), particularly interpeak trips (86%) Rating of 0-4 signficantly more likely Aged years (12%) Travelling inbound (10%) Greater Wellington Regional Council 2013/14 Public Transport Passenger Satisfaction Survey Page 65
68 How Convenient It Is To Pay For Public Transport Wellington s public transport users are generally satisfied with the convenience of paying for public transport, three-quarters (76%) satisfied to some extent, including 14% who are extremely satisfied. In contrast, 13% express some level of dissatisfaction. Respondents travelling by train are significantly more likely to be dissatisfied with the convenience of paying for public transport (15%) than bus passengers (10%). Figure 5.4: How Convenient It Is To Pay For Public Transport By Mode (%) Rating Total Bus Train Ferry (N=4,150) (n=1,289) (n=2,714) (n=147) Dissatisfied (0-4) ( B) 10 Neutral (5) Satisfied (6-10) ( T) Mean rating (out of 10) Base: All respondents who answered this question, excluding Not applicable responses. Note: Letter notation denotes mode(s) that this result is significantly higher than; B=Bus, T=Train, F=Ferry. Rating of 6-10 significantly more likely Travelling on a SuperGold Card (91%) Aged 45 years or older (85%) Travelling in Go Wellington services (80%) Rating of 0-4 signficantly more likely Aged 18 to 34 years (17%) Travelling on a Ten Trip card (17%) Greater Wellington Regional Council 2013/14 Public Transport Passenger Satisfaction Survey Page 66
69 Information About Service Delays or Disruptions A key weakness of the Wellington region s public transport system appears to be the provision of information about service delays or disruptions. Less than two-thirds of public transport users (62%) are satisfied with this aspect of the public transport system, while almost a quarter (23%) express some level of dissatisfaction, including 2% who are extremely dissatisfied. Levels of dissatisfaction are significantly higher among bus passengers (27% dissatisfied) than those travelling by train (22%) or ferry (17%). Results suggest that this is a key area for improvement going forward. Table 5.5: Information About Service Delays Or Disruptions By Mode (%) Rating Total Bus Train Ferry (N=4,083) (n=1,255) (n=2,687) (n=141) Dissatisfied (0-4) ( TF) Neutral (5) ( T) Satisfied (6-10) ( B) 67 ( B) Mean rating (out of 10) Base: All respondents who answered this question, excluding Not applicable responses. Letter notation denotes mode(s) that this result is significantly higher than; B=Bus, T=Train, F=Ferry. Greater Wellington Regional Council 2013/14 Public Transport Passenger Satisfaction Survey Page 67
70 Rating of 6-10 significantly more likely (None) Rating of 0-4 signficantly more likely Travelling on a Go Wellington service (29%) Travelling on a stored value card (29%) Greater Wellington Regional Council 2013/14 Public Transport Passenger Satisfaction Survey Page 68
71 5.3 Wellington Region s Public Transport System Drivers of Satisfaction 12 All four aspects of Wellington s public transport system are core drivers of overall satisfaction, all having a strong correlation with overall satisfaction. The travel time (given the distance to travel) is most strongly correlated with overall satisfaction with the public transport system, indicating that improvements in this area can be expected to have the greatest positive impact on overall satisfaction going forward. Travel time is the key driver of satisfaction for all three modes. The ease of getting information about public transport routes and timetables is a stronger driver for bus passengers (0.67) than it is for those using the train (0.63) or ferry (0.59). Table 5.2: Drivers of Satisfaction with Wellington Region s Public Transport System Level of Influence on Overall Satisfaction Core Driver Important Driver Travel time (0.73) Convenience of paying for public transport (0.70) Ease of getting information about public transport routes/timetables (0.64) Information about service delays/disruptions (0.64) Driver of Lesser Importance Driver Bus (n=1,302) Train (n=2,739) Ferry (n=148) The travel time How convenient it is to pay for public transport Ease of getting information about public transport routes and timetables Information about service delays or disruptions Through the use of statistical analyses (correlation analysis), the relative influence of each service attribute ( driver ) on overall satisfaction has been derived. Service attributes with a correlation score of 0.60 or more show a strong relationship with overall satisfaction and therefore have been defined as core drivers of overall satisfaction. These service attributes should be considered priorities for action/additional resourcing as improvements in the performance of these attributes can be expected to have the most positive impact on overall satisfaction. Service attributes with a correlation score of 0.50 to 0.59 are considered important drivers of satisfaction, while attributes with a correlation score of less than 0.50 have only a weak relationship with overall satisfaction and therefore are considered drivers of lesser importance. Greater Wellington Regional Council 2013/14 Public Transport Passenger Satisfaction Survey Page 69
72 Wellington Region s Public Transport System - Performance versus Influence (Gap Analysis) Figure 5.6 maps the relative influence of each aspect of the public transport system against current performance. The trend line 13 slopes up and to the right. This is a positive result, indicating that, in general, the public transport system is performing most positively on those aspects that have the strongest influence on overall satisfaction. The key area of concern is the information about service delays or disruptions. This aspect of the trip is identified as the core driver of trip satisfaction (0.64), but is currently the most poorly performing aspect of the public transport system (and indeed is the most poorly rated aspect in the survey). Improvements in this area over the next 12 months, particularly in relation to delays/disruptions to the bus service, can be expected to have a positive impact on overall satisfaction with the public transport system. 13 The trend line assists in depicting the overall relationship between relative influence and performance across the service attributes/drivers. In an ideal situation, the trend line should slope up to the right. This illustrates that the public transport system is performing best on those aspects of service that are most important to passengers/that have the greatest influence on overall satisfaction. A trend line that slopes down to the right indicates a mismatch between performance and importance/influence that is, at least one service attribute identified as core/important to passengers is currently under-performing (suggesting the need for more resource in this area for example, planning, training, quality control etc.) and/or at least one service attribute with a high performance rating is identified as having little or no importance to passengers/has only minimal influence on overall satisfaction. Greater Wellington Regional Council 2013/14 Public Transport Passenger Satisfaction Survey Page 70

73 Figure 5.6: Performance Versus Influence Wellington Region s Public Transport System Greater Wellington Regional Council 2013/14 Public Transport Passenger Satisfaction Survey Page 71
74 6. Moving Forward Highlights Eighty-five per cent of Wellington s public transport users would recommend using public transport to a friend or colleague, including 19% extremely likely to recommend. Only 8% of respondents would not endorse Wellington s public transport services to others. Whilst the extent of recommendation is high for all three modes, ferry (90%) and train (86%) passengers are significantly more likely to recommend public transport than those using buses (83%). Moving forward, key areas to be addressed in the delivery of public transport services in the Wellington region are the value for money for the fare (either by reducing the cost of the fare for example, offering discounts on off-peak fares and/or adding value to the existing service through enhanced service delivery and the provision of more facilities), improving the reliability of services (that is, ensuring services run on time/to the timetable and actually turn up), and also increasing the frequency of services (more off-peak services to reduce waiting time/enhance convenience, and more services in the peak to reduce vehicle overcrowding). 6.1 Likelihood of Recommending Public Transport to Others Satisfaction with public transport services in the Wellington region is further evidenced by the fact that 85% of respondents would recommend using public transport to a friend or colleague. This including 19% who are extremely likely to recommend. Only 8% of respondents would not endorse Wellington s public transport services to others. Whilst the extent of recommendation is high for all three modes, ferry (90%) and train (86%) passengers are significantly more likely to recommend public transport than those using buses (83%). Among Wellington operators, likelihood of recommending is highest among those travelling on East by West Ferries (90%) and lowest among Newlands (81%) and Valley Flyer (81%) passengers. Ten per cent of passengers on Valley Flyer services state that they would be unlikely to recommend using public transport in Wellington to others. Greater Wellington Regional Council 2013/14 Public Transport Passenger Satisfaction Survey Page 72
75 Figure 6.1: Likelihood of Recommending Public Transport to Others By Mode and Operator (%) Rating Total Bus Train Ferry (N=3,762) (n=1,206) (n=2,417) (n=139) ( B) 90 ( B) Mean rating (out of 10) Rating East By West Go Wellington Mana Newlands Tranz Metro Valley Flyer (n=139) (n=771) (n=110) (n=52) (n=2,417) (n=257) ( V) ( V) 81 Mean rating (out of 10) Base: All bus respondents who answered this question, excluding Not applicable responses Letter notation denotes mode(s)/operator(s) that this result is significantly higher than. Note: Sample size for Madge Coachlines (n=4) and Tranzit Coachlines (n=14) too small to provide statistically reliable results Greater Wellington Regional Council 2013/14 Public Transport Passenger Satisfaction Survey Page 73
76 Rating of 6-10 significantly more likely Travelling on a SuperGold card (93%) Aged 65 years + (93%) Rating of 0-4 signficantly more likely Aged years (11%) Greater Wellington Regional Council 2013/14 Public Transport Passenger Satisfaction Survey Page 74
77 6.2 Suggestions for Improvement to Public Transport Services Overall Results Improved reliability of services (that is, services run on time, run to the timetable and actually turn up) and a desire for cheaper fares are the most frequently mentioned suggestions for improvements to Wellington s public transport system, each being mentioned unprompted by 10% of respondents. Eight per cent of all respondents including 9% of all peak time travellers - call for more frequent services, whilst 6% suggest that service capacity be increased (for example, by having more buses on the route, more carriages on the train or more seats available in the vehicle) to reduce over-crowding, particularly on afternoon peak services. A further 6% of respondents suggest the introduction of integrated ticketing, including allowing Snapper cards to be used across all services and unifying the ticketing system across all modes. Four per cent of respondents specifically state that no improvements to Wellington s public transport services are needed, whilst 28% (particularly older and off-peak passengers) did not offer any suggestions for service enhancement. Table 6.1: Suggestions for Improvement to Public Transport Services (%) Suggestion for Improvement Total Sample (N=4,298) Significantly More Likely To Be Mentioned By Those Improved reliability of services run on time/to 10 Females (12%) timetable Cheaper fares 10 Aged 18 to 34 years (14%) More frequent services 8 Peak time travellers (9%) More buses on the route/more carriages/more seats available/reduce overcrowding 6 Monthly Pass (9%) or Ten Trip Card holders (8%) Peak time travellers (7%), particularly those travelling in the afternoon peak (9%) Tranz Metro passengers (7%) Females (7%) Integrated ticketing/automate ticketing system 6 Aged years (9%) Ten Trip Card (9%) and Monthly Pass (8%) holders Peak time travellers (7%) Tranz Metro passengers (7%) Cheaper fares for students 4 Aged 18 to 24 years (14%) Greater Wellington Regional Council 2013/14 Public Transport Passenger Satisfaction Survey Page 75
78 Suggestion for Improvement Total Sample (N=4,298) Significantly More Likely To Be Mentioned By Those Changes to be made to particular routes 3 Aged years (7%) Peak time travellers (4%), particularly those travelling in the afternoon peak (5%) Friendlier drivers 3 Go Wellington passengers (6%) Stored Value Card holders (6%) Off-peak travellers (4%) Faster/more direct/fewer stops/more Express services 3 East by West Ferry passengers (8%) Peak time travellers (4%) More information about service delays, disruptions 3 Females (4%) and changes (e.g. buses replacing trains) More/more frequent weekend/late night/holiday 3 services More Real Time Information boards 2 Weekend travellers (4%) Stored Value Card holders (4%) Go Wellington passengers (4%) Better connections/co-ordination between services 2 Aged years (4%) or 65 years + (4%) Improvements to stops/stations/wharves (shelters, 2 Valley Flyer passengers (6%) seating, toilets, rubbish bins etc.) Improved information at stops (clearer, more 2 timetables available, bilingual etc.) More stops/destinations, wider coverage of service 2 Cleaner vehicles, more comfortable, better conditions 2 No improvements needed 4 SuperGold Card holders (8%) or those using cash (6%) Aged 65 years or older (8%) Off-peak travellers (6%), particularly those travelling in the weekend (7%) Making outbound trips (5%) Blank 28 SuperGold Card holders (39%) Aged 65 years + (37%) Off-peak travellers (32%), particularly interpeak travellers (34%) Base: All respondents. Multiple responses to this question permitted, consequently table may total more than 100%. Table lists those improvements mentioned by 2% or more of respondents. Greater Wellington Regional Council 2013/14 Public Transport Passenger Satisfaction Survey Page 76
79 Suggestions for Improvement by Mode Frequency of mention of the reliability of services, the desire for cheaper fares and the need for more frequent services is consistent across all modes. However, train passengers are significantly more likely to cite the need for service capacity to be increased (for example, more carriages added) (7%) than those travelling by bus (4%) or ferry (3%). Along with ferry passengers (8%), respondents using the train (7%) are also more likely to call for the introduction of an integrated ticketing system than bus users (4%). Ferry passengers are over-represented among those suggesting the need for changes to be made to the route (7%), the need for a faster service (8%), more off-peak services (weekend, late night, holidays etc.) (5%) and better integration with other services (5%), whilst those travelling by bus are over-represented among those calling for friendlier staff (5%). Table 6.2: Key Suggestions for Improvement to Public Transport Services By Mode (%) Suggestions Total Sample (N=4,298) Bus (n=1346) Train (n=2799) Ferry (n=153) Improved reliability of services run on time/to timetable Cheaper fares More frequent services More buses on the route/more carriages/more seats ( BF) 3 available/reduce overcrowding Integrated ticketing/automate ticketing system ( B) 8 ( B) Cheaper fares for students ( B) 2 Changes to be made to particular routes ( T) Friendlier drivers/staff 3 5 ( T) 3 3 Faster/more direct/fewer stops/more Express services ( BT) More information about service delays, disruptions and changes (e.g. buses replacing trains) More/more frequent weekend/late night/holiday services ( T) More Real Time Information boards 2 4 ( T) 1 3 ( T) Better connections/co-ordination between services ( B) Improvements to stops/stations/wharves (shelters, seating, toilets, rubbish bins etc.) Improved information at stops (clearer, more timetables ( T) available, bilingual etc.) More stops/destinations, wider coverage of service Cleaner vehicles, more comfortable, better conditions ( B) 3 (B) No improvements needed Blank ( T) Base: All respondents. Greater Wellington Regional Council 2013/14 Public Transport Passenger Satisfaction Survey Page 77
80 APPENDICES Appendix One: Responses to National Questions Appendix Two: Sample Profile Appendix Three: Questionnaires Appendix Four: Suggestions for Improvement (Full Lists) Appendix Five: Satisfaction with All Aspects of Public Transport System By Mode
81 Appendix One: Wellington Region Public Transport Customer Satisfaction Responses to National Questions As part of monitoring requirements, public transport customer satisfaction surveys are required to be carried out by regional organisations receiving central government funding. To improve consistency between data collected in different regions, in 2013, the New Zealand Transport Agency (NZTA) introduced a new methodology and reporting requirements for public transport customer satisfaction research. NZTA provided a set of mandatory questions to be asked and also designated the nature of the rating scale to be used. In addition, a set of basic sampling guidelines were provided, both to ensure sampling processes were reasonably consistent (both between regions and over time) and also to encourage good quality sampling methods. A full description of the method used to collect the data is provided in the main body of the report. However, in summary: Data was collected using an on-board survey method, with respondents completing questionnaires whilst on-board the service: Data was collected from n=192 trips selected using random sampling (see Section Two for full description of process) Data was collected over a three-week period (5 th to 25 th May 2014) Every passenger aged 15 years or older boarding each randomly-selected service was invited to complete a questionnaire The response rate was 58% overall. Greater Wellington Regional Council 2013/14 Public Transport Passenger Satisfaction Survey: APPENDIX Page 1
82 Sample sizes and their associated margins of error are provided in Appendix Table 1 below: Appendix Table 1: Sample Sizes and Associated Margins of Error Mode Number of Trips Sample Size Maximum Margin of Error (at the 95% confidence interval) Maximum Margin of Error Allowing for Clustering (as per NZTA requirements) 14 Bus ± 3.4% ± 4.9% Train 80 1,915 ± 2.2% ± 2.7% Ferry ± 9.4% The NZTA Public Transport Customer Satisfaction report for each mode is provided below. 14 When providing margin of error estimates for such user surveys, some allowance for the extent to which users are similar/clustered by being on the same service/trip must be made. With bus surveys, halve the actual sample size before using it in such margin of error estimates. With train surveys, multiply the actual sample size by 2/3 before using it in such margin of error estimates. (PK-8, New Zealand Transport Agency s Procurement Manual Effective from 1 November Greater Wellington Regional Council 2013/14 Public Transport Passenger Satisfaction Survey: APPENDIX Page 2
83
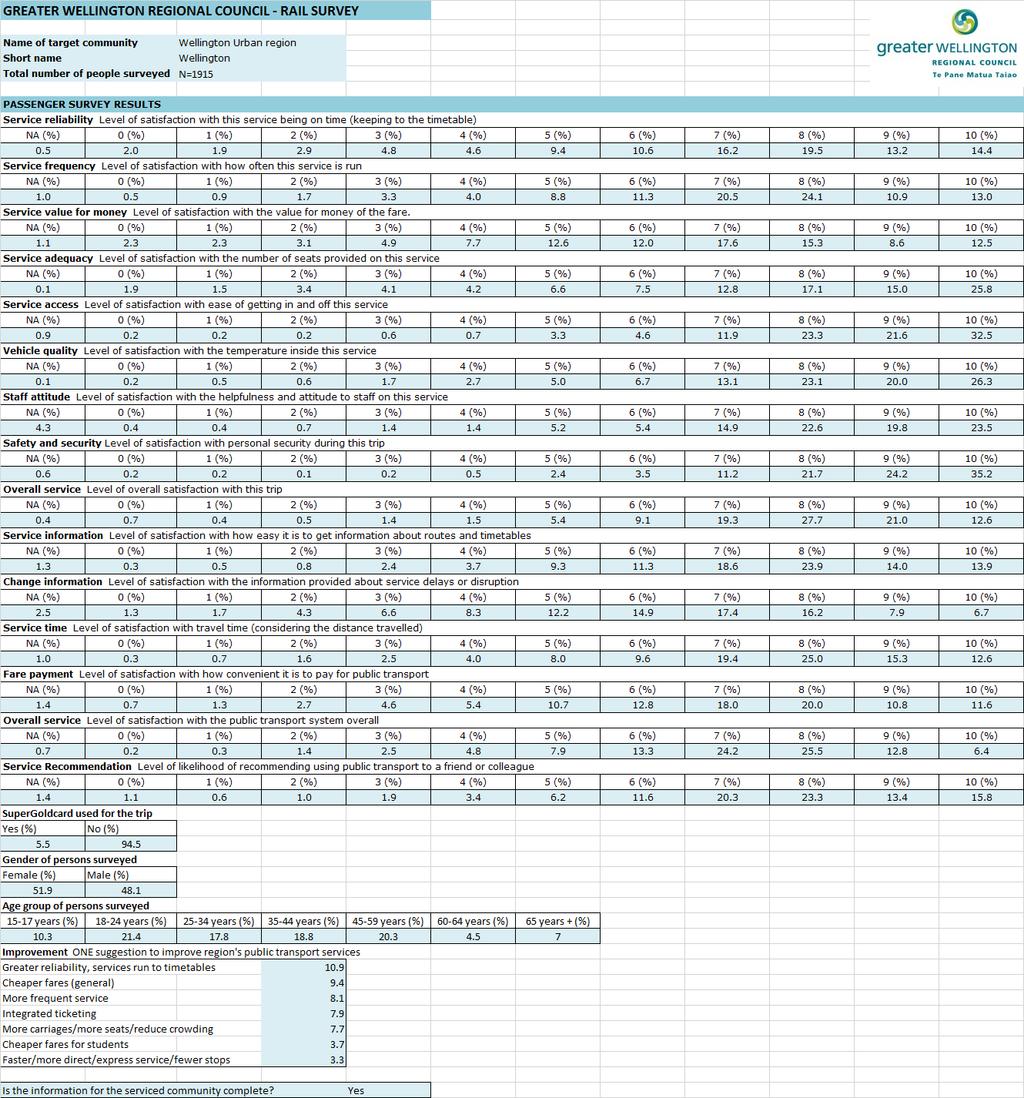
84
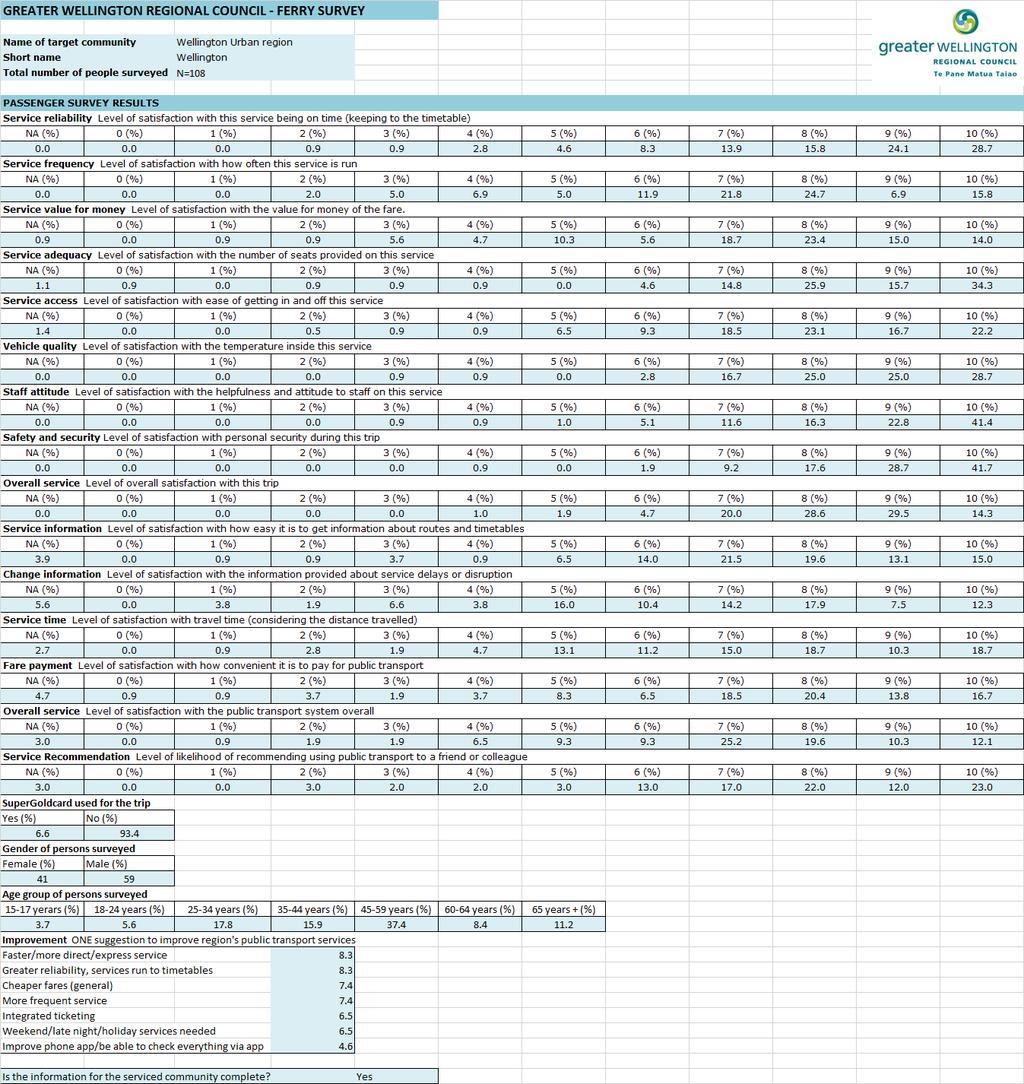
85
86 Appendix Two: Sample Profile Appendix Table 2.1: Sample Profile Gender and Age Total Sample (N=4,173) Bus (n=1,292) Train (n=2,731) Ferry (n=150) Gender Female ( F) 53 ( F) 39 Male ( B) 61 ( BT) Age years ( BF) years ( F) 25 ( F) years ( TF) years years ( BT) years ( BT) 65 years Base: All respondents who answered this question. Letter notation denotes mode(s) that this result is significantly higher than. Appendix Table 2.2: Sample Profile Type of Ticket Used (%) Total Sample (N=4,150) Bus (n=1,284) Train (n=2,716) Ferry (n=150) Monthly Pass ( BF) 7 Ten Trip Ticket ( B) 62 ( BT) Stored Value Card Cash SuperGold Card Day Pass Other <1 1 <1 2 Base: All respondents who answered this question. Letter notation denotes mode(s) that this result is significantly higher than. Greater Wellington Regional Council 2013/14 Public Transport Passenger Satisfaction Survey: APPENDIX Page 6

87 Appendix Three: Questionnaires Greater Wellington Regional Council 2013/14 Public Transport Passenger Satisfaction Survey: APPENDIX Page 7

88 Greater Wellington Regional Council 2013/14 Public Transport Passenger Satisfaction Survey: APPENDIX Page 8
2015 Metro User Christchurch
 2015 Metro User Christchurch Research Report June 2015 www.researchfirst.co.nz Contents 2015 Metro User Christchurch 1 Research Context and Design 03 1.1 Introduction 03 1.2 Research Objectives 03 1.3
Customer Satisfaction Tracking Annual Report British Columbia Ferry Services Inc.
 Customer Satisfaction Tracking Annual Report British Columbia Ferry Services Inc. Presented to: British Columbia Ferry Services Inc. Victoria, British Columbia 0 0 West Second Avenue Vancouver BC VH Y
National Rail Passenger Survey Autumn 2015 Main Report
 National Rail Passenger Survey Autumn 2015 Main Report Transport Focus is the independent transport user watchdog Our mission is to get the best deal for passengers and road users. With a strong emphasis
ARRIVAL CHARACTERISTICS OF PASSENGERS INTENDING TO USE PUBLIC TRANSPORT
 ARRIVAL CHARACTERISTICS OF PASSENGERS INTENDING TO USE PUBLIC TRANSPORT Tiffany Lester, Darren Walton Opus International Consultants, Central Laboratories, Lower Hutt, New Zealand ABSTRACT A public transport
Tourism Industry Council Tasmania Community Survey 2018 Research Report. May 2018
 Tourism Industry Council Tasmania Community Survey 2018 Research Report May 2018 This report has been prepared by Enterprise Marketing and Research Services 60 Main Road, Moonah TAS 7009 All enquiries
Network Rail 2014 Customer Survey Report
 GfK 2014 GfK Business Network Rail Customer Report 2014 Network Rail 2014 Customer Survey Report Route Report: Anglia Prepared by: January 2015 14-Jan-15 / 1 GfK 2014 GfK Business Network Rail Customer
2013 Travel Survey. for the States of Guernsey Commerce & Employment Department RESEARCH REPORT ON Q1 2013
 213 Travel Survey for the States of Guernsey Commerce & Employment Department RESEARCH REPORT ON Q1 213 May 21st 213 Table of Contents Page No. Summary of Results 1 Survey Results 2 Breakdown of departing
Tram Passenger Survey
 Key findings Autumn 2015 Foreword Jeff Halliwell Now in its third year, our Tram Passenger Survey has covered passengers views of their journey in six network areas in Britain. For the second time this
Customer Satisfaction Tracking Annual Report British Columbia Ferry Services Inc.
 Customer Satisfaction Tracking Annual Report 2006 British Columbia Ferry Services Inc. Presented to: British Columbia Ferry Services Inc. Victoria, British Columbia 02 1505 West Second Avenue Vancouver
National Rail Passenger Survey Autumn 2013 Main Report
 National Rail Passenger Survey Autumn 2013 Main Report What is Passenger Focus? Passenger Focus is the independent consumer watchdog for Britain s rail passengers and England s bus, coach and tram passengers
Community Rail Partnership Action Plan The Bishop Line Survey of Rail Users and Non-Users August 2011 Report of Findings
 Community Rail Partnership Action Plan The Bishop Line Survey of Rail Users and Non-Users August 2011 Report of Findings Analysis and report NWA Social Research 1 Contents Page No. A. Summary of Main Findings...
Customer Satisfaction Tracking Annual Report British Columbia Ferry Services Inc.
 Customer Satisfaction Tracking Annual Report 2003 British Columbia Ferry Services Inc. Presented to: British Columbia Ferry Services Inc. Victoria, British Columbia 402 1505 West Second Avenue Vancouver
Customer Satisfaction Tracking Annual Report British Columbia Ferry Services Inc.
 Customer Satisfaction Tracking Annual Report 0 British Columbia Ferry Services Inc. Presented to: British Columbia Ferry Services Inc. Victoria, British Columbia 0 05 West Second Avenue Vancouver BC V6H
National Station Improvement Programme. Uckfield Station Final report
 National Station Improvement Programme Uckfield Station Final report January 2010 National Station Improvement Plan Uckfield Station Summary Report Passenger Focus April 2009 Prepared by:... Approved by:...
Timetable Change Research. Re-contact survey key findings
 Timetable Change Research Re-contact survey key findings Key project objectives Measure the impact of the timetable changes on customers, what actions have they taken as a result Gauge how have the timetable
National Passenger Survey Spring putting rail passengers first
 National Passenger Survey putting rail passengers first What is Passenger Focus? Passenger Focus is the independent national rail consumer watchdog. Our mission is to get the best deal for Britain s rail
National Station Improvement Programme. Halifax Station - Final report
 National Station Improvement Programme Halifax Station - Final report January 2010 National Station Improvement Plan Halifax Station Summary Report Passenger Focus April 2009 Prepared by:... Approved by:...
Tram Passenger Survey (TPS) All networks
 All networks") Tram Passenger Survey (TPS) All networks Rosie Giles Tel: Email: Rosie.Giles@transportfocus.org.uk results March Insight Team, Transport Focus, Fleetbank House, - Salisbury Square, London, ECY JX Contents
Tram Passenger Survey (TPS) All networks Rosie Giles Tel: Email: Rosie.Giles@transportfocus.org.uk results March Insight Team, Transport Focus, Fleetbank House, - Salisbury Square, London, ECY JX Contents
Customer Satisfaction Tracking Annual Report British Columbia Ferry Services Inc.
 Customer Satisfaction Tracking Annual Report 2007 British Columbia Ferry Services Inc. Presented to: British Columbia Ferry Services Inc. Victoria, British Columbia 02 10 West Second Avenue Vancouver BC
National Passenger Survey Spring putting rail passengers first
 National Passenger Survey Spring 2006 putting rail passengers first What is Passenger Focus? Passenger Focus is the independent national rail consumer watchdog. Our mission is to get the best deal for
Customer Satisfaction Tracking Annual Report British Columbia Ferry Services Inc.
 Customer Satisfaction Tracking Annual Report 2008 British Columbia Ferry Services Inc. Presented to: British Columbia Ferry Services Inc. Victoria, British Columbia 02 10 West Second Avenue Vancouver BC
ISE INDUSTRY FORUM CSISG 2018 Q2 RESULTS Announcement INSTITUTE OF SERVICE EXCELLENCE SINGAPORE MANAGEMENT UNIVERSITY
 ISE INDUSTRY FORUM CSISG 2018 Q2 RESULTS Announcement INSTITUTE OF SERVICE EXCELLENCE SINGAPORE MANAGEMENT UNIVERSITY CSISG 2018 Q2 RESULTS LAND TRANSPORT & AIR TRANSPORT INSTITUTE OF SERVICE EXCELLENCE
National Rail Passenger Survey Main Report Spring 2018
 National Rail Passenger Survey Main Report Spring 2018 Transport Focus is the independent transport user watchdog Our mission is to get the best deal for passengers and road users. With a strong emphasis
2013 Business & Legislative Session Visitor Satisfaction Survey Results
 2013 Business & Legislative Session Visitor Satisfaction Survey Results Completed by Juneau Economic Development Council in partnership with The Alaska Committee August 2013 JEDC research efforts are supported
Prepared for: TOMM Committee Kangaroo Island CB Contact: Ben Nitschke, Account Manager Phone: (08)
") Prepared for: TOMM Committee Kangaroo Island CB Contact: Ben Nitschke, Account Manager Phone: (08) 8373 3822 Email: ben.nitschke@colmarbrunton.com Issue Date: 24 August, 2017 Project number: TOMM0003 www.colmarbrunton.com
Prepared for: TOMM Committee Kangaroo Island CB Contact: Ben Nitschke, Account Manager Phone: (08) 8373 3822 Email: ben.nitschke@colmarbrunton.com Issue Date: 24 August, 2017 Project number: TOMM0003 www.colmarbrunton.com
JATA Market Research Study Passenger Survey Results
 JATA Market Research Study Passenger Survey Results Prepared for the Jackson Area Transportation Authority (JATA) April, 2015 3131 South Dixie Hwy. Suite 545 Dayton, OH 45439 937.299.5007 www.rlsandassoc.com
Prepared for: TOMM Committee Kangaroo Island CB Contact: Naomi Downer, Account Director Phone: (08)
") Prepared for: TOMM Committee Kangaroo Island CB Contact: Naomi Downer, Account Director Phone: (08) 8373 3822 Email: naomi.downer@colmarbrunton.com Issue Date: 14 November, 2016 Project number: TOMM0002
Prepared for: TOMM Committee Kangaroo Island CB Contact: Naomi Downer, Account Director Phone: (08) 8373 3822 Email: naomi.downer@colmarbrunton.com Issue Date: 14 November, 2016 Project number: TOMM0002
National Passenger Survey Autumn putting rail passengers first
 National Passenger Survey Autumn putting rail passengers first What is Passenger Focus? Passenger Focus is the independent national rail consumer watchdog. Our mission is to get the best deal for Britain
MOURNE & SLIEVE CROOB AONB. VISITORS SURVEY Summary Report
 MOURNE & SLIEVE CROOB AONB VISITORS SURVEY Summary Report November 2004 This project was funded by 1 EXECUTIVE SUMMARY INTRODUCTION In 2004 Mourne Heritage Trust secured funding for the implementation
Methodology and coverage of the survey. Background
 Methodology and coverage of the survey Background The International Passenger Survey (IPS) is a large multi-purpose survey that collects information from passengers as they enter or leave the United Kingdom.
YARTS ON-BOARD SURVEY MEMORANDUM
 YARTS ON-BOARD SURVEY MEMORANDUM Prepared for the Yosemite Area Regional Transportation System Prepared by LSC Transportation Consultants, Inc. This page left intentionally blank. YARTS On-Board Survey
National Passenger Survey TOC Report for Chiltern Railways Autumn 2011
 National Passenger Survey TOC Report for Contacts: David Greeno Passenger Focus 1 Drummond Gate London, SW1V QY Tel: 13 837 Email: david.greeno@passengerfocus.org.uk David Chilvers BDRC Continental Kingsbourne
National Passenger Survey Autumn putting rail passengers first
 National Passenger Survey Autumn 2005 putting rail passengers first What is Passenger Focus? Passenger Focus is the independent national rail consumer watchdog. Our mission is to get the best deal for
Heritage Line Community Rail Partnership Darlington to Bishop Auckland Railway Line Survey of Users and Non-Users January to March 2010
 Heritage Line Community Rail Partnership Darlington to Bishop Auckland Railway Line Survey of Users and Non-Users January to March 2010 Analysis and report NWA Social Research 1 Contents Page No. A. Summary
2015 Travel Survey. for the States of Guernsey Commerce & Employment Department RESEARCH REPORT ON Q1 2015
 215 Travel Survey for the States of Guernsey Commerce & Employment Department RESEARCH REPORT ON Q1 215 April 28 th 215 Table of Contents Page No. Summary of Results 1 Survey Results 2 Breakdown of departing
JUNEAU BUSINESS VISITOR SATISFACTION SURVEY RESULTS
 2018 JUNEAU BUSINESS VISITOR SATISFACTION SURVEY RESULTS Completed by the Juneau Economic Development Council in partnership with the Alaska Committee. JEDC research efforts are supported by core funding
Juneau Household Waterfront Opinion Survey
 Juneau Household Waterfront Opinion Survey Prepared for: City and Borough of Juneau Prepared by: April 13, 2004 TABLE OF CONTENTS Executive Summary...1 Introduction and Methodology...6 Survey Results...7
Cooper-Hewitt, National Design Museum Visitors Summer 2008 Summary of Findings
 Introduction Cooper-Hewitt, National Design Museum Visitors Summer 2008 Summary of Findings Office of Policy & Analysis Smithsonian Institution July 2008 In June 2008, the Office of Policy and Analysis
Borders Railway: What is the impact two years on?
 STAR 2018 Borders Railway: What is the impact two years on? Rachel Thomas, Peter Brett Associates, Scott Leitham, Peter Brett Associates, and Rebecca Rossi, Transport Scotland 1 INTRODUCTION The Borders
REGIONAL RESIDENTS SURVEY on REGIONAL AMENITIES
 REGIONAL RESIDENTS SURVEY on REGIONAL AMENITIES Report prepared for: Wellington Region Mayoral Forum Report prepared by: Ian Binnie, Colmar Brunton Social Research Agency Date: 9 March 2011 Level 9, Sybase
CEREDIGION VISITOR SURVEY 2011 TOTAL SAMPLE. November 2011
 CEREDIGION VISITOR SURVEY 2011 TOTAL SAMPLE November 2011 TERMS OF CONTRACT Unless otherwise agreed, the findings of this study remain the copyright of Beaufort Research Ltd and may not be quoted, published
Rail passengers priorities for improvement November 2017
 Rail passengers priorities for improvement November 2017 Rail passengers priorities for improvement November 2017 Foreword We asked more than 12,800 passengers across the country to rank 31 possible improvements
CUSTOMER SATISFACTION INDEX OF SINGAPORE 2017 Q2 RESULTS OVERVIEW AIR TRANSPORT AND LAND TRANSPORT
 CUSTOMER SATISFACTION INDEX OF SINGAPORE 2017 Q2 RESULTS OVERVIEW AIR TRANSPORT AND LAND TRANSPORT 2017 Q2 SCORES AIR TRANSPORT AND LAND TRANSPORT 74.4 Air Transport 77.1 Airport* 77.1 Changi Airport 74.2
Coffs Coast Visitor Profile and Satisfaction Report: Summary and Discussion of Results
 Coffs Coast Visitor Profile and Satisfaction Report: Summary and Discussion of Results Introduction The Coffs Coast Visitor Profile and Satisfaction (VPS) project was completed as part of the Destination
Mystery shop of rail ticket retailing research summary
 Mystery shop of rail ticket retailing research summary March 2007 Mystery shop of rail ticket retailing research summary Introduction The latest results of the Passenger Focus National Passenger Survey
NEWCASTLE VISITOR PROFILE AND SATISFACTION REPORT. Summary of results OCTOBER Image: Newcastle Marina, courtesy of Newcastle Tourism
 NEWCASTLE VISITOR PROFILE AND SATISFACTION REPORT Summary of results OCTOBER 2013 Image: Newcastle Marina, courtesy of Newcastle Tourism 3 NEWCASTLE VISITOR PROFILE AND SATISFACTION REPORT: SUMMARY OF
Events Tasmania Research Program Hobart Baroque Festival
 Events Tasmania Research Program Hobart Baroque Festival Research Report 2014 Prepared by This report has been prepared by Enterprise Marketing and Research Services Pty. Ltd. 60 Main Road, Moonah, 7009
The Role of Online in Travel Purchases. Hungary
 The Role of Online in Travel Purchases Hungary Methodology Vertical Deep Dive Travel Hungary Target group: Internet user in Hungary, 18 years and older Sample: n=1,000 Internet users Methodology: Online
2015 British Columbia Parks. Visitor Survey. Juan De Fuca Park. China Beach
 2015 British Columbia Parks Visitor Survey Juan De Fuca Park China Beach 1 Contents Introduction 3 Methodology 3 Limitations 3 How this report is organized 3 Part 1 - Visitor Satisfaction 4 Part 2 - Visitor
Measure 67: Intermodality for people First page:
 Measure 67: Intermodality for people First page: Policy package: 5: Intermodal package Measure 69: Intermodality for people: the principle of subsidiarity notwithstanding, priority should be given in the
Competing in a Disrupted and Changing Environment
 Competing in a Disrupted and Changing Environment ISES INDUSTRY FORUM CSISG 2016 Q2 RESULTS ANNOUNCEMENT INSTITUTE OF SERVICE EXCELLENCE SINGAPORE MANAGEMENT UNIVERSITY CSISG 2016 Q2 RESULTS land transport,
New Zealand s 2011 Rugby World Cup: A Tourism Perspective
 New Zealand s 2011 Rugby World Cup: A Tourism Perspective Executive Summary... 3 Figure 1: Regional spread of international RWC visitors... 4 Figure 2: Seasonally adjusted monthly visitor numbers to New
CONGESTION MONITORING THE NEW ZEALAND EXPERIENCE. By Mike Curran, Manager Strategic Policy, Transit New Zealand
 CONGESTION MONITORING THE NEW ZEALAND EXPERIENCE 26 th Australasian Transport Research Forum Wellington New Zealand 1-3 October 2003 By, Manager Strategic Policy, Transit New Zealand Abstract New Zealand
National Rail Passenger Survey: User Guidance Report. Autumn 2013 (wave 29)
") National Rail Passenger Survey: User Guidance Report Autumn 2013 (wave 29) Rebecca Joyner Research Director Tel: 020 7490 9148 rebecca.joyner@bdrc continental.com Contents Page No. 1. Background... 1 2.
National Rail Passenger Survey: User Guidance Report Autumn 2013 (wave 29) Rebecca Joyner Research Director Tel: 020 7490 9148 rebecca.joyner@bdrc continental.com Contents Page No. 1. Background... 1 2.
MODAIR. Measure and development of intermodality at AIRport
 MODAIR Measure and development of intermodality at AIRport M3SYSTEM ANA ENAC GISMEDIA Eurocontrol CARE INO II programme Airports are, by nature, interchange nodes, with connections at least to the road
Appendix 8: Coding of Interchanges for PTSS
 FILE NOTE DATE 23 October 2012 AUTHOR SUBJECT Geoffrey Cornelis Appendix 8: Coding of Interchanges for PTSS 1. Introduction This notes details a proposed approach to improve the representation in WTSM
National Passenger Survey TOC Report for East Midlands Trains Spring 2011
 National Passenger Survey TOC Report for 11 Contacts: David Greeno Passenger Focus 1 Drummond Gate London, SW1V QY Tel: 13 83 Email: david.greeno@passengerfocus.org.uk David Chilvers BDRC Continental Kingsbourne
Summary Report. Economic Impact Assessment for Beef Australia 2015
 Summary Report Economic Impact Assessment for Beef Australia 2015 September 2015 The Department of State Development The Department of State Development exists to drive the economic development of Queensland.
Policy committee Item: 11 Ref: PC086. National Rail Performance Report - Quarter (Oct-Dec 2015)
") Policy committee 23.02.16 Item: 11 Ref: PC086 National Rail Performance Report - Quarter 3 2015-16 (Oct-Dec 2015) February 2016 London TravelWatch is the official body set up by Parliament to provide a
Policy committee 23.02.16 Item: 11 Ref: PC086 National Rail Performance Report - Quarter 3 2015-16 (Oct-Dec 2015) February 2016 London TravelWatch is the official body set up by Parliament to provide a
Wellington $312 $49 $456 OVERVIEW WELLINGTON REGIONAL SUMMARY
 National Land Transport Programme 2015 18 Wellington WELLINGTON REGIONAL SUMMARY OVERVIEW The Wellington region is made up of a number of cities, urban areas and supporting rural hinterland. The city is
St. Johns River Ferry Patron Survey May 16, 2012
 St. Johns River Ferry Patron Survey May 16, 2012 Committee Report Introduction Study Survey Survey Surveyor Summary Table of Contents Executive Summary... ES-1 Section 1 ONE... 1-1 Section 2 TWO Methodology...
EUROPEANS EXPERIENCE WITH USING SHIPS AND PERCEPTIONS OF MARITIME SAFETY
 Special Eurobarometer 422b EUROPEANS EXPERIENCE WITH USING SHIPS AND PERCEPTIONS OF MARITIME SAFETY SUMMARY Fieldwork: October 2014 Publication: March 2015 This survey has been requested by the European
Bus Passenger Survey spring 2015 results Centro - West Midlands PTE area
 Bus Passenger Survey spring 2015 results Centro - West Midlands PTE area Contact: Murray Leader, Insight Team, Transport Focus Fleetbank House, 2-6 Salisbury Square, London, EC4Y 8JX Tel: 0300 123 0843
National Rail Passenger Survey: User Guidance Report. Spring 2014 (wave 30)
") National Rail Passenger Survey: User Guidance Report Spring 2014 (wave 30) Rebecca Joyner Director Tel: 020 7490 9148 rebecca.joyner@bdrc continental.com Contents Page No. 1. Background... 1 2. Summary
National Rail Passenger Survey: User Guidance Report Spring 2014 (wave 30) Rebecca Joyner Director Tel: 020 7490 9148 rebecca.joyner@bdrc continental.com Contents Page No. 1. Background... 1 2. Summary
CORNWALL VISITOR SURVEY 06/07. Final report. Produced by South West Tourism Research Department For and on behalf of Visit Cornwall.
 CORNWALL VISITOR SURVEY 06/07 Final report Produced by South West Tourism Research Department For and on behalf of Visit Cornwall September 2007 Contents Slide Executive summary 3 Chapter 1: Introduction
National Rail Passenger Survey: User Guidance Report
 National Rail Passenger Survey: User Guidance Report Spring 2015 (Wave 32) Rebecca Joyner Director Tel: 020 7490 9148 rebecca.joyner@bdrc continental.com Contents Page No. 1. Background... 1 2. Summary
Bus Reliability and Punctuality Performance
 Bus Reliability and Punctuality Performance Recommendation(s) That the Board: Board Meeting 26 August 2014 i. Notes the changes to the reporting of bus reliability and punctuality. As at July 2014 the
PREFERENCES FOR NIGERIAN DOMESTIC PASSENGER AIRLINE INDUSTRY: A CONJOINT ANALYSIS
 PREFERENCES FOR NIGERIAN DOMESTIC PASSENGER AIRLINE INDUSTRY: A CONJOINT ANALYSIS Ayantoyinbo, Benedict Boye Faculty of Management Sciences, Department of Transport Management Ladoke Akintola University
1.4 Previous research on New Zealand subantarctic tourism
 Figure 5 The subantarctic islands are nature reserves protecting habitats of great conservation value, such as that of the Southern Royal albatross, seen here at the Auckland Islands. Tourist visits must
International Passenger Survey (IPS) Methodology. May 2017
 Methodology. May 2017") International Passenger Survey (IPS) Methodology May 2017 1 Contents Introduction IPS and VisitBritain Key concepts and definitions Sampling approach Collection of IPS data Producing national estimates
International Passenger Survey (IPS) Methodology May 2017 1 Contents Introduction IPS and VisitBritain Key concepts and definitions Sampling approach Collection of IPS data Producing national estimates
SAMTRANS TITLE VI STANDARDS AND POLICIES
 SAMTRANS TITLE VI STANDARDS AND POLICIES Adopted March 13, 2013 Federal Title VI requirements of the Civil Rights Act of 1964 were recently updated by the Federal Transit Administration (FTA) and now require
Glasgow Queen Street Station Redevelopment research
 Glasgow Queen Street Station Redevelopment research May 2015 Contact: Sultana Idris, Insight Team, Transport Focus Fleetbank House, 2-6 Salisbury Square, London, EC4Y 8JX Tel: 0300 123 0860 Email: Sultana.Idris@transportfocus.org.uk
Transport Focus Train punctuality the passenger perspective. 2 March 2017 Anthony Smith, Chief Executive
 Transport Focus Train punctuality the passenger perspective 2 March 2017 Anthony Smith, Chief Executive Transport Focus Independent transport user watchdog Rail passengers in Great Britain Bus, coach &
Survey of Britain s Transport Journalists A Key Influencer Tracking Study Conducted by Ipsos MORI Results
 Survey of Britain s Transport Journalists A Key Influencer Tracking Study Conducted by Ipsos MORI 2014 Results Methodology This report presents the findings of the 2014 study of Transport Journalists,
Civil Aviation Authority:
 Civil Aviation Authority: UK Aviation Consumer Survey August 2018 CONTENTS Background and method Headline measures Flying behaviour Recent experience Travel disruption Disability Key driver analysis Public
CUSTOMER SATISFACTION INDEX OF SINGAPORE 2018 Q2 RESULTS OVERVIEW AIR TRANSPORT AND LAND TRANSPORT
 CUSTOMER SATISFACTION INDEX OF SINGAPORE 2018 Q2 RESULTS OVERVIEW AIR TRANSPORT AND LAND TRANSPORT 2018 Q2 SCORES AIR TRANSPORT AND LAND TRANSPORT 75.4 Air Transport 78.0 Airport* 78.0 Changi Airport 74.5
Civil Aviation Authority Stakeholder Satisfaction 2003
 Prepared for: Attention: Author(s): Civil Aviation Authority Peter Lechner Jeremy Todd Contact: (09) 919 9221 Issue Date: April 2003 Civil Aviation Authority Stakeholder Satisfaction 2003 undertakes all
Appraisal of Factors Influencing Public Transport Patronage in New Zealand
 Appraisal of Factors Influencing Public Transport Patronage in New Zealand Dr Judith Wang Research Fellow in Transport Economics The Energy Centre The University of Auckland Business School, New Zealand
Cedar Rapids Area Convention and Visitors Bureau Visitor Study
 Cedar Rapids Area Convention and Visitors Bureau Visitor Study 2003-2004 University of Northern Iowa Sustainable Tourism & The Environment Program www.uni.edu/step Project Directors: Sam Lankford, Ph.D.
Byron Shire Visitor Profile and Satisfaction Report: Summary and Discussion of Results
 Byron Shire Visitor Profile and Satisfaction Report: Summary and Discussion of Results Introduction The Byron Shire Visitor Profile and Satisfaction (VPS) project was completed as part of the Destination
Auckland Regional Public Transport Plan
 Auckland Regional Public Plan 2010 www.arta.co.nz Published in June 2010 by: The Auckland Regional Authority Private Bag 92 236 Auckland, New Zealand This document is available on the ARTA website: www.arta.co.nz
5 Rail demand in Western Sydney
 5 Rail demand in Western Sydney About this chapter To better understand where new or enhanced rail services are needed, this chapter presents an overview of the existing and future demand on the rail network
Rail Delivery Group. Consultation on the future of the East Midlands rail franchise
 Rail Delivery Group Response to: Department for Transport Consultation on the future of the East Midlands rail franchise Date: 11 October 2017 Rail Delivery Group Limited Registered Office, 2nd Floor,
Survey into foreign visitors to Tallinn Target market: Cruise voyagers. TNS Emor March 2012
 Survey into foreign visitors to Tallinn 2008 2011 Target market: Cruise voyagers TNS Emor March 2012 Table of contents 1 Introduction 3 2 Planning a trip to Tallinn 9 3 Visiting Tallinn and impressions
1999 Reservations Northwest Users Survey Methodology and Results November 1999
 1999 Reservations Northwest Users Survey Methodology and Results November 1999 Oregon Survey Research Laboratory University of Oregon Eugene OR 97403-5245 541-346-0822 Fax: 541-346-5026 Internet: OSRL@OREGON.UOREGON.EDU
NSB GJØVIKBANEN AS. Service Quality Performance Report 2016
 NSB GJØVIKBANEN AS Service Quality Performance Report 2016 Passenger Rights Regulation 1371/2007 1. NSB Gjøvikbanen AS NSB Gjøvikbanen AS is a subsidiary in the NSB Group. The company is 100 % owned by
National Rail Passenger Survey: User Guidance Report
 National Rail Passenger Survey: User Guidance Report Autumn 2015 (Wave 33) Rebecca Joyner Director Tel: 020 7490 9148 rebecca.joyner@bdrc-continental.com Contents Page No. 1. Background... 1 2. Summary
Bus Passenger Survey
 March 2012 Contents 1 Foreword 3 2 Key findings 4 3 Results by area Merseyside PTE (Merseytravel) South Yorkshire PTE Transport for Greater Manchester (TfGM) West Yorkshire PTE (Metro) Tyne & Wear PTE
Performance monitoring report for 2014/15
 Performance monitoring report for 20/15 Date of issue: August 2015 Gatwick Airport Limited Summary Gatwick Airport is performing well for passengers and airlines, and in many aspects is ahead of the performance
APPENDIX B COMMUTER BUS FAREBOX POLICY PEER REVIEW
 APPENDIX B COMMUTER BUS FAREBOX POLICY PEER REVIEW APPENDIX B COMMUTER BUS FAREBOX POLICY PEER REVIEW The following pages are excerpts from a DRAFT-version Fare Analysis report conducted by Nelson\Nygaard
Transport Indicators Report June 2018
 Transport Indicators Report June 2018 Board Meeting 21 August 2018 Recommendation That the Board: i. Receives this report. Executive summary 1. The attached Monthly and Quarterly Indicator Reports provide
REAUTHORISATION OF THE ALLIANCE BETWEEN AIR NEW ZEALAND AND CATHAY PACIFIC
 Chair Cabinet Economic Growth and Infrastructure Committee Office of the Minister of Transport REAUTHORISATION OF THE ALLIANCE BETWEEN AIR NEW ZEALAND AND CATHAY PACIFIC Proposal 1. I propose that the
PUBLIC TRANSIT IN KENOSHA, RACINE, AND MILWAUKEE COUNTIES
 PUBLIC TRANSIT IN KENOSHA, RACINE, AND MILWAUKEE COUNTIES #118404v1 Regional Transit Authority June 19, 2006 1 Presentation Overview Existing Public Transit Transit System Peer Comparison Recent Transit
The Pennine Class 185 experience
 The Pennine Class 185 experience What do passengers think? May 2007 Passenger Focus is the independent national rail consumer watchdog. It is an executive non-departmental public body sponsored by the
Rail delays and compensation
 Rail delays and compensation what passengers want November 2016 Rail delays and compensation what passengers want Introduction Passengers want their trains to be on time having a punctual service they
2017/2018 Q3 Performance Measures Report. Revised March 22, 2018 Average Daily Boardings Comparison Chart, Page 11 Q3 Boardings figures revised
 2017/2018 Q3 Performance Measures Report Revised March 22, 2018 Average Daily Boardings Comparison Chart, Page 11 Q3 Boardings figures revised Contents Ridership & Revenue... 1 Historical Revenue & Ridership...
American Airlines Next Top Model
 Page 1 of 12 American Airlines Next Top Model Introduction Airlines employ several distinct strategies for the boarding and deboarding of airplanes in an attempt to minimize the time each plane spends
6 Road infrastructure
 6 Road infrastructure 51 ƨƨsummary New Zealand does not score highly for its road infrastructure when compared to other developed nations. This may partly be due to geography and population size, which
Gold Coast. Rapid Transit. Chapter twelve Social impact. Chapter content
 Gold Coast Rapid Transit Chapter twelve Social impact Chapter content Social impact assessment process...235 Existing community profile...237 Consultation...238 Social impacts and mitigation strategies...239
Study on Hotel Management Graduates Perceptions and Preferences of Jobs in Hotel Industry in Chennai City
 Study on Hotel Management Graduates Perceptions and Preferences of Jobs in Hotel Industry in Chennai City T.S. Natarajan, Research scholar, Department of Management studies, SCSVMV University, India. E-mail: