The 2016 International Visitors Exit Survey Report
|
|
|
- Cody Dalton
- 5 years ago
- Views:
Transcription


1 The 2016 International Visitors Exit Survey Report a
2 TANZANIA TOURISM SECTOR SURVEY THE 2016 INTERNATIONAL VISITORS EXIT SURVEY REPORT October 2017 i
3 TABLE OF CONTENTS LIST OF TABLES... iv LIST OF CHARTS... v ACRONYMS... vii FOREWORD... viii ACKNOWLEDGEMENT... ix EXECUTIVE SUMMARY... x Chapter 1: Recent developments in the tourism industry Global prespective Tourism developments in the United Republic of Tanzania International tourist arrival Meetings and conferences Domestic and international flights Promotion and marketing Tanzania Tourist Board introduces Official Tanzania Tourism s app The construction of terminal III at Julius Nyerere International Airport... 8 Chapter 2: Analysis of the survey results Introduction Source markets Age group Gender Purpose of visit Travel arrangement First-time and repeat visit Source of information Travel party Departure points Nights spent and average length of stay Mode of payment Tourism activities Tourism expenditure in the United Republic of Tanzania Average expenditure ii
4 2.15 Tourism earnings Visitors impression Areas that need improvement Chapter 3: Conclusion and Recommendations Conclusion Recommendations Appendices Appendix I: Survey Methodology I. Introduction II. Objective of the survey III. Scope of the survey IV. Sample size V. Fieldwork VI. Survey coverage VII. Enumerators manual VIII. Training of enumerators IX. The Questionnaire X. Data processing XI. Tourist expenditure estimation Appendix II: Questionnaire Appendix III: International Tourist Arrivals References iii
5 LIST OF TABLES Table 1.1: International Tourist arrivals by regions, Table 1.2: Market shares of international tourist arrivals... 2 Table 1.3: International tourist arrivals: actual growth and projection... 3 Table 2.1: Distribution of top 15 source markets by age group, URT Table 2.2: Age group and purpose of visit, URT Table 2.3: Age group and purpose of visit, Zanzibar, Table 2.4: Distribution of top 15 source markets by purpose of visit, URT 16 Table 2.5: Distribution of top 15 source markets by purpose of visit, Tanzania Mainland Table 2.6: Distribution of top 15 source markets by purpose of visit, Zanzibar Table 2.7: Proportion of visitors by source markets by travel arrangement, URT Table 2.8: Proportion of visitors by sources markets by travel arrangement, Zanzibar Table 2.9: Distribution of visitors by tour arrangement by purpose of visit, URT Table 2.10: Distribution of visitors by tour arrangement by purpose of visit, Zanzibar Table 2.11: Distribution of visitors under the non-package by purpose of visit, URT Table 2.12: Distribution of visitors under the package by purpose of visit, URT Table 2.13: Distribution of visitors under the non-package by purpose of visit, Zanzibar Table 2.14: Distribution of visitors under the package by purpose of visit, Zanzibar Table 2.15: First-time and repeat visitors by purpose of visit, URT Table 2.16: The Number of visitors by departure points, URT Table 2.17: Proportion of visitors by departure points and purpose of visit, URT Table 2.18: Distribution of visitors by the nights spent and purpose of visit, URT Table 2.19: Length of stay by purpose of visit and top 15 source markets, URT iv
6 Table 2.20: Length of stay by purpose of visit and top 15 source markets, Tanzania Mainland Table 2.21: Average length of stay by purpose of visit and top 15 source markets, Zanzibar Table 2.22: Top 15 Source markets and tourism activities, URT Table 2.23: Tourism activities by top 15 source markets, URT Table 2.24: Tourism activities by top 15 source markets, Tanzania Mainland Table 2.25: Top 15 source markets and tourism activities, Zanzibar Table 2.26: Tourism activities by top 15 source markets, Zanzibar Table 2.27: Average expenditure by purpose of visit for top 15 source markets Table 2.28: Tourism earnings in URT, Table 2.29: Tourism earnings in Zanzibar, LIST OF CHARTS Chart 1.1 International tourist arrivals to the world, Chart 1.2 International tourist arrivals to Tanzania, top 15 source markets, Chart 2.1: Top 15 source markets for the URT... 9 Chart 2.2: Top 15 source markets for Tanzania Mainland Chart 2.3: Top 15 source markets for Zanzibar Chart 2.4: Distribution of visitors by age group, URT Chart 2.5: Distribution of visitors by age group, Zanzibar Chart 2.6: Tour arrangement by age group, URT Chart 2.7: Visitors by gender and purpose of visit, URT Chart 2.8: Visitors by gender and purpose of visit, Zanzibar Chart 2.9: Purpose of visit URT, Chart 2.10: Purpose of visit Tanzania Mainland, Chart 2.11: Purpose of visit Zanzibar, Chart 2.12: Trends in tour arrangements, Chart 2.13: Visitors from Neighbouring countries by travel arrangement. 21 Chart 2.14: Visitors by travel arrangement excluding those from neighbouring countries, URT Chart 2.15: First-time and repeat visitors by tour arrangements v
7 Chart 2:16: First-time and repeat visitors by top 15 source markets, URT 28 Chart 2.17: First-time and repeat visitors by tourism activities, URT Chart 2.18: First-time and repeat visitors by Top 15 source markets, Zanzibar Chart 2.19: First-time and repeat visitors by purpose of visit, Zanzibar Chart 2.20: First-time and repeat visitors by tourism activity, Zanzibar Chart 2.21: Sources of information, URT Chart 2.22: Travel party, URT Chart 2.23: Travel party, Zanzibar Chart 2.24: Distribution of visitors by nights spent, URT, Chart 2.25: Distribution of visitors by the nights spent, Tanzania Mainland, Chart 2.26: Distribution of visitors by the nights spent, Zanzibar Chart 2.27: Modes of payment, Chart 2.28: Mode of payment by tour Arrangement Chart 2.29: Credit cards payment by tour arrangement for top 15 source markets Chart 2.30: Cash payment by tour arrangement for top 15 source markets 44 Chart 2.31: Tourism activities in URT, Chart 2.32: Tourism activity and travel arrangement, URT Chart 2.33: Tourism activities in Tanzania Mainland, Chart 2.34: Tourism activities in Zanzibar Chart 2.35: Tourism activity by travel arrangement, Zanzibar Chart 2.36: Tourism expenditure in the United Republic of Tanzania Chart 2.37: Average expenditure by purpose of visit and tour arrangement, URT Chart 2.38: Average expenditure by purpose of visit,tanzania Mainland and Zanzibar Chart 2.39: Visitors impression, URT Chart 2.40: Areas that need improvement vi
8 ACRONYMS AAKIA BOT HAT HOR JNIA KAS KIA LGAs MANY MNRT MWTC MTU NAM NBS TAA TANAPA TCT TIC TTB TUN UNWTO URT VFR ZATI ZCT Abeid Amani Karume International Airport Bank of Tanzania Hotel Association of Tanzania Horohoro Julius Nyerere International Airport Kasumulo Kilimanjaro International Airport Local Government Authorities Manyovu Ministry of Natural Resources and Tourism Ministry of Works, Transport and Communication Mtukula Namanga National Bureau of Statistics Tanzania Airport Authority Tanzania National Parks Authority Tourism Confederation of Tanzania Tanzania Investment Centre Tanzania Tourist Board Tunduma United Nations World Tourism Organization United Republic of Tanzania Visiting Friends and Relatives Zanzibar Association of Tourism Investors Zanzibar Commission for Tourism vii
9 FOREWORD The global tourist arrivals grew by 3.9 percent in 2016 slightly lower than 4.4 percent recorded in Slower growth was more pronounced in Western Europe particularly France, German and Belgium largely associated with terrorist attacks. Slow growth was also registered in Americas particularly in Caribbean and Latin America owing to the outbreak of Zika virus epidemic. The regions that registered the highest growth were Asia and the Pacific with a growth of 8.4 percent followed by Africa with a growth of 8.2 percent. In the case of Tanzania, we are glad to introduce the results of the 2016 Tanzania Tourism Sector Survey (TTSS), Report which is a collaborative initiative between the Ministry of Natural Resources and Tourism (MNRT), Bank of Tanzania (BOT), National Bureau of Statistics (NBS), Immigration Department and the Zanzibar Commission for Tourism (ZCT). The results show that the number of international tourist arrivals increased by 12.9 percent to 1,284,279 from 1,137,182 visitors recorded in Consequently, the county s tourism earning by 12.1 percent to USD 2,131.6 million in 2016 increased from USD 1,902.0 million recorded in In the case of Zanzibar, arrivals increased by 40.7 percent to 284,519 resulting to a surge in tourist earnings to USD million in 2016 compared with USD million in Similar to the previous years, leisure and holidays continued to be the main purpose of visit to Tanzania and the major tourism activities were wildlife and beach. However, wildlife activities were more pronounced in the Mainland while beach activities were more pronounced in Zanzibar. The report provides insightful information to various stakeholders for a diverse of uses including policy making and marketing strategies. Hon. Prof. Jumanne Maghembe (MP) Minister Ministry of Natural Resources and Tourism Prof. Benno Ndulu Governor Bank of Tanzania viii
10 ACKNOWLEDGEMENT This work has received valuable contributions from various individuals and institutions. The Steering Committee of the Tanzania Tourism Sector Survey (TTSS) Project would like to express sincere appreciation for the cherished support that has led to the successful completion of the 2016 International Visitors Exit Survey. Sincere appreciation goes to the Chief Executive Officers of the participating institutions namely; the Ministry of Natural Resources and Tourism, Bank of Tanzania, National Bureau of Statistics, Immigration Services Department, Zanzibar Commission for Tourism and the Tourism Confederation of Tanzania, for their diligent guidance and support. We are grateful to the Immigration Services Department staff, particularly the officers in-charge at the Julius Nyerere International Airport, Abeid Amani Karume International Airport, Kilimanjaro International Airport, Horohoro, Namanga, Tunduma, Mtukula and Manyovu boarder points. Our profound gratitude goes also to the researchers and data entry officers for their commitment and hard work. The overall supervision of this work was under the conscientious leadership of Mr. Z. A. Kimwaga (Director of Tourism MNRT) and J. J. Nyella (Director, Economic Research and Policy-BOT). Mr. P. Mwiru, Assistant Director of Tourism (MNRT) and Mr. F. Mlele, Manager, International Economics and Trade Department (BOT), led the Technical Team. Other members of the team were Dr. C. Masenya (BOT), Mrs. V. W. Kejo (BOT), Mr. P. Mboya (BOT), Mr. J. Msimbano (MNRT), Mr. V. Tesha (NBS), Ms. E. Lema (NBS), Mrs. J. Rugemalila (NBS), Mr. C. Mndeme (Immigration Department) and Mr. M. Jaffer (ZCT). We also treasure the hard work of the IT team, which, was composed of Mr. R. Barongo and R. William from BOT. ix
11 EXECUTIVE SUMMARY Background The International visitors exit survey is an annual activity, which started in The main objectives of the survey is to update information on tourist earnings for improving compilation of Balance of Payments and National Accounts. The survey is also intended to gather information for tourism promotion and macroeconomic policy formulation. The survey targets visitors exiting the country via air and land border points. This report presents the findings of the 14 th round of the surveys, based on face-to-face interviews conducted at eight departure points for a period of two weeks during August/September Global developments in the tourism industry The UNWTO World Tourism Barometer, January 2017 showed that the international tourist arrivals grew by 3.9 percent to 1,235 million during The growth was slightly lower than 4.6 percent recorded in 2015 largely associated with a series of events including terrorist attacks in Western Europe particularly France, German, and Belgium; Zika virus epidemic in the Americas particularly in the Caribbean and Latin America; and unfavorable currency fluctuations. Arrivals to the Middle East declined in 2016 mainly on account of security concerns. The regions that registered the highest growth were Asia and the Pacific with a growth of 8.4 percent followed by Africa with a growth of 8.2 percent. Europe continued to account for the largest share of international tourist arrivals, followed by Asia and the Pacific, the Americas, the Middle East and Africa. However, UNWTO projects that global international tourist arrivals will grow by between 3.0 and 4.0 percent in Asia and the Pacific; and African regions are expected to register a growth of between 5.0 and 6.0 percent. Recent tourism developments in the United Republic of Tanzania Domestically, the recent developments to boost the tourist sector include: a) The Annual Diaspora Homecoming Conference held in Zanzibar during August The conference which attracted about 450 participants aimed at encouraging Tanzanian diaspora to engage in tourism business; x
12 b) Strengthening of Air Tanzania by acquiring two Bombardier Q400 planes to expand both domestic and regional markets. Further, the Turkish Airlines launched three times weekly flights between Istanbul and Zanzibar. This is also expected to increase the number of visitors to the country; c) Signing of Memorandum of Understanding (MoU) between Tanzania Tourist Board (TTB) and Air Tanzania (ATCL) to promote and market destination Tanzania to passengers aboard; and d) Introduction of aggressive global e-marketing campaign for destination Tanzania by developing an official Tanzania Tourism App, which gives an overview of what Tanzania can offer as unique tourist destination, things to do, accommodation, and how to plan your trip. Main findings of the survey Major source markets remained more or less the same The findings revealed that 16,639 tourists from 122 source markets to Tanzania were covered during the 2016 survey. Most visitors came from the United Kingdom, Kenya and the United States of America. There was a notable increase in the number of visitors from Kenya as its share increased to 11.7 percent from 9.7 percent recorded in This makes Kenya the second largest source market for Tanzania in Uganda and Burundi were the new entrants in the list of the top 15 source markets for Tanzania largely associated with proximity as well as increasing business interactions. Looking at Tanzania Mainland and Zanzibar separately, the list of the top 15 source markets remained more or less the same. Tourism earnings increased Tanzania s tourism earnings increased by 12.1 percent to USD 2,131.6 million in 2016, from USD 1,902.0 million recorded in The surge was mainly driven by the number of arrivals, which increased, to 1,284,279, being 12.9 percent higher than the number recorded in Out of the total USD 2,131.6 million, USD 1,790.8 million was earned from tourists who came for leisure and holidays. Similarly, Zanzibar earnings increased by 30.4 percent to USD million in 2016 compared with USD million earned in 2015 owing to increase in the number of arrivals. Most of the Zanzibar earnings (USD million) were received from visitors who came for leisure and holidays. xi
13 The overall average expenditure per person per night during 2016 was USD 178 compared to USD 199 recorded in The decrease in the average expenditure per person per night is partly explained by the increase in the number of arrivals from neighboring countries whose expenditures are lower. The average expenditure per person per night the under package tour arrangement was USD 290 per person per night while under the non-package tour it was USD 131. Business visitors under the package tour arrangement spent the most with an average of USD 386. Visitors who came to visit friends and relatives spent the least (USD 199). Visitors from China had highest average expenditure of USD 541 per person per night. Visitors from Burundi and Zambia had minimal average expenditures of less than USD 100 per person per night. Leisure and holidays continued to be the major purpose of visit About 59.9 percent of tourists who visited the United Republic of Tanzania came for leisure and holidays, 18.3 percent for visiting friends and relatives and 11.0 percent for business purpose. Majority of holidaymakers for both Tanzania Mainland and Zanzibar came from the United Kingdom, Germany, the United States of America and Italy. The share of visitors who came for meetings and conference was the lowest, about 6 percent. The number of tourists coming for business purposes increased and were mainly from the neighboring countries, thanks to the improvements in environment for cross border trade and investment. Majority of the visitors stayed between 8 and 14 nights The overall average length of stay of visitors in the Tanzania was 9 nights slightly lower than 10 nights recorded during the past five years. About 31 percent of the visitors spend between 8 to 14 nights, followed by those who stayed between 4 to 7 nights accounting for 27 percent. Visitors who stayed the longest were mainly from Germany, Spain, Canada, Italy and the United Kingdom. Visitors from the neighboring countries such as Kenya, Uganda, Zambia and South Africa stayed the shortest. First-time visitors continue to dominate over repeat visitors The findings show that the share of first time visitors was 54.7 percent slightly higher than 52.6 percent recorded in Majority of these visitors had higher preference for package tour when compared to repeat visitors. Large share of repeat visitors was from the neighboring countries owing to the growing business relations and family ties. xii
14 Wildlife continues to be the main tourism activity Wildlife and beach were the most preferred tourism activities. Wildlife activity was more pronounced in Tanzania Mainland while beach tourism was more pronounced in Zanzibar. Moreover, conference tourism is upcoming activity, which accounted for about 11 percent compared to about four percent in Majority of the interviewed visitors settled their bills in cash During the 2016 survey, cash continued to be a major mode of payment as about 84 percent of the interviewees settled their bills in cash. The findings reveal increasing usage of cash payment largely due to unacceptability of credit cards at most consumption points. These findings underscore the need to enhance efforts to sensitize on the importance of credit cards facilities. Recommendations a) The overall average length of stay of a tourist who visited Tanzania was 9 nights slightly lower than 10 nights recorded during the past five years. In view of this, there is a need of enhancing diversification and promotion of new tourism products rather than relying on wildlife tourism in order to prolong the length of stay at a destination and increase tourism earnings. It is worth noting that, the government has embarked on the process of identifying beach plots in Tanzania Mainland, suitable for beach tourism in Tanga, Coast, Dar es Salaam, Lindi and Mtwara regions. This initiative should go in tandem with incentives to attract more investments in activities such as water sports in beach areas so as invite more tourists. b) The survey results indicate that about 84 percent of the interviewed visitors settled their bills in cash, an increase of 2.7 percentage points from the previous survey. This indicates that unacceptability of credit cards continues to be a problem to the majority of visitors. This implies that there is need of enhancing efforts to sensitize owners of tourism establishments on the importance of credit card facilities. c) Majority of visitors expressed concerns on the state of roads and other facilities, particularly entry procedures that resulted into congestion at entrance to the national parks. The government is therefore urged to continue with its efforts to improve roads particularly those leading to Tarangire National Park and other facilities. xiii
15 d) Visitors raised concerns on cleanliness in the cities, towns and airports, inadequate washrooms and air condition at airports and public areas. Therefore, there is a need to enforce municipal laws on cleanliness and public awareness about the usage of garbage collection facilities such as dustbins placed in public areas. e) The findings indicate that visitors also raised concerns on lack of transparency in pricing, information on the tourist attraction and conservation measures. There is a need of enhancing availability and accessibility of information materials to tourists at both source markets and entry points. f) The findings indicate that visitors who are 65 years and above continued to be few. It should be noted that this age group is a potential market given that they have more disposable income and ample time for leisure. However, the group faced physical challenges, which call for a great concern and attention for their safety. This implies that there is a need for the government to design specific package and facilities, which will meet the specific needs of this group. xiv
16 Chapter 1: Recent developments in the tourism industry 1.1 Global prespective International tourist arrivals grew by 3.9 percent to 1,235 million in 2016, according to the UNWTO World Tourism Barometer, January 2017, the seventh consecutive year of sustained growth (Chart 1.1). However, the growth was lower than 4.6 percent recorded in 2015 as some destinations recorded lower growth in 2016 due to a series of events including terrorism, Zika virus epidemic and unfavorable currency fluctuations. Chart 1.1: International tourist arrivals to the world, In Millions ,189 1,235 1,137 1,090 1, International tourist arrivals Source: UNWTO World Tourism Barometer, January 2017 Region wise, Asia and the Pacific topped by registering a growth of international tourist arrivals of 8.4 percent in 2016, followed by Africa (Table 1.1). The Americas and Europe recorded lower growth in 2016 compared to The decline in Europe was attributed to terrorist attacks in some countries in Western Europe particularly France, German, and Belgium. Lower growth in the Americas particularly in Caribbean and Latin America was contributed by Zika virus epidemic. The growth of arrivals to the Middle East declined by 4.1 percent in 2016 largely on account of security concerns. 1
17 Table 1.1: International Tourist arrivals by regions, Region In Millions Europe Asia and the Pacific Americas Africa Middle East age Change Europe Asia and the Pacific Americas Africa Middle East Source: UNWTO World Tourism Barometer, Various Issues Europe continued to account for the largest share of tourist arrivals, followed by Asia and the Pacific, the Americas, Africa and the Middle East (Table 1.2). The same pattern was observed in the previous years. However, the share of Africa increased by 0.2 percentage points to 4.7 percent in 2016, after declining for two consecutive years. Table 1.2: Market shares of international tourist arrivals Region Europe Asia and the Pacific Americas Africa Middle East World Source: UNWTO World Tourism Barometer, Various Issues UNWTO projections indicate that international tourist arrivals worldwide will grow by between 3.0 and 4.0 percent in 2017 (Table 1.3). Region-wise, the growth is expected to be between 5.0 and 6.0 percent for both Asia and the Pacific and Africa. The growth in Americas is expected to be between 4.0 and 5.0 percent. Europe is expected to grow at 2.0 to 3.0 percent. The projections for the Middle East are positive, though with a larger degree of uncertainty and volatility. 2
18 Table 1.3: International tourist arrivals: actual growth and projection Actual Growth Projection Average World to 4.0 Europe to 3.0 Asia and the Pacific to 6.0 Americas to 5.0 Africa to 6.0 Middle East to 5.0 Source: UNWTO World Tourism Barometer, Various Issues 1.2 Tourism developments in the United Republic of Tanzania Tanzania s tourism industry is thriving and continues to be among the key activities in generating foreign exchange. The tourism industry continued to grow in 2016, with the number of tourist arrivals increasing by 12.9 percent to 1,284,279 from 1,137,182 recorded in Consequently, the county s tourism earnings rose by 12.1 percent to USD 2,131.6 million in 2016 from USD 1,902.0 million recorded in In the case of Zanzibar, arrivals increased by 40.7 percent to 284,519 resulting to a surge in tourist earnings to USD million in 2016 compared with USD million in International tourist arrivals The 2016 data from Immigration Services Department shows that, Kenya continued to be main source market for tourists arriving in Tanzania as it accounted for 18.2 percent of all international tourist arrivals (Chart 1.2). This is an increase of 18.3 percent to 233,730 compared with 197,562 visitors recorded in 2015, largely on account of increasing socio-economic interactions. The United State of America was the second largest source market with 6.8 percent followed by India, which replaced the position of the United Kingdom. The shift in the position of India is largely contributed by Dawoodi Bohra s Milad-un-Nabi celebrations that took place in Dar es Salaam in October

19 Chart 1.2 International tourist arrivals to Tanzania, top 15 source markets, 2016 Kenya United States of America India United Kingdom Burundi Germany Italy Rwanda South Africa Uganda China Zambia France Dutch Israel Source: Immigration Services Department, Meetings and conferences The third annual Diaspora Homecoming conference was held in Zanzibar Beach Resort from 24 th to 25 th August The conference attracted about 450 participants including Tanzanians living abroad and returnees and stakeholders from public and private sector. The theme of the conference was Bridging Tanzania Tourism and Investment: A New Outlook. The aim of the conference was to engage and encourage Tanzanian diaspora to participate in tourism business as a means to promote investments in the country. His Excellency Dr. Ali Mohammed Shein during the official opening ceremony of the third Diaspora conference at Zanzibar Beach Resort 4

 and Boeing (USA).")
20 1.2.3 Domestic and international flights The Government of Tanzania purchased two Bombardier Q400 planes, which were launched in October 2016 to strengthen the Air Tanzania Company Limited (ATCL). The arrival of these planes allows Air Tanzania to expand both its domestic and regional markets. The planes are currently flying to a number of destinations including Dodoma, Mwanza, Mbeya, Kigoma, Bukoba, Kilimanjaro, Mtwara, Zanzibar and Comoros. The government has also completed the process of procuring additional four aircrafts by making advance payment of USD million to Bombardier (Canada) and Boeing (USA). Out of the four aircrafts, one is expected to be delivered in 2017 and three in 2018, one being Boeing 787 Dream liner with the capacity of carrying 262 passengers. The arrival of these aircrafts will enable ATCL to fly to many destinations and hence increasing the number of international tourists visiting Tanzania. Arrival and official launching of new ATCL planes 5

21 Further, Turkish Airlines launched three times weekly flights between Istanbul and Zanzibar on 12 December The opening of new route to Zanzibar is the reflection of the increased number of visitors to the destination. Hon. Ali Abeid Amaan Karume, Minister responsible for transport lauching the new route of Turkish Airline Promotion and marketing Tanzania Tourist Board and Air Tanzania Company Ltd signed a two-year Memorandum of Understanding (MoU) on 30 th November 2016 whereby the two institutions forged partnership in promoting travel and tourism. The two institutions also launched the ATCL in-flight magazine. It was agreed in the MoU that, TTB will carry out special training for ATCL staff on how to promote and market destination Tanzania to passengers aboard. ATCL will include destination Tanzania documentary in the in-flight TV entertainment list and magazine. 6

22 Mr. Ladislaus Matindi (left) Director General ATCL and Ms Devota Mdachi-Managing Director TTB signing the MoU Tanzania Tourist Board introduces Official Tanzania Tourism s app Tanzania Tourist Board has embarked on an aggressive global e-marketing campaign for destination Tanzania by developing an Official Tanzania Tourism app. The app was developed concurrently with the establishment of the destination online tourism portal, which contains detailed information on various tourist destinations in Tanzania. The app gives an overview of what Tanzania can offer as unique tourist destination in Africa, things to do, accommodation, and how to plan a trip. It will later have provision for the potential visitors to book and make payment online. The Official Tanzania Tourism app has come at a time when there are many efforts made by private sector tourism apps. The app, which is available at Google Play Store, is accessible to android mobile phones users. This will complement the existing number of marketing and promotional tools and techniques used by the TTB in promoting destination Tanzania globally. The introduction of e-marketing campaign is expected to boost the tourism industry in the country. 7

23 1.2.6 The construction of terminal III at Julius Nyerere International Airport Julius Nyerere International Airport is currently operating beyond its capacity by handling 2.5 million passengers annually against its capacity of 1.5 million passengers. In this respect, the construction of Terminal III, which started in April 2014, will accommodate six million passengers annually. The airport will have the potential of becoming business and transport hub of the region and will help to promote Tanzania tourism industry. The look of Julius Nyerere International Airport Terminal III when completed 8
24 Chapter 2: Analysis of the survey results 2.0 Introduction This chapter presents the main findings of the international visitors exit survey conducted in The main issues covered include tourism earnings and expenditure, source markets, age group, gender and purpose of visit. Furthermore, main tourism activities, visitors impression and areas that need improvement are also discussed. 2.1 Source markets The survey findings show that, a total of 16,639 visitors to the United Republic of Tanzania (URT) were recorded from 122 source markets. The top 15 source markets accounted for 80.4 percent of the total visitors. The largest number of visitors was from the United Kingdom accounting for 12.3 percent of total visitors, followed by Kenya and the United States of America with 11.7 percent and 11.6 percent, respectively (Chart 2.1). The findings also show a notable increase in the number of visitors from Kenya, which increased its share from 9.7 percent in 2015 to 11.7 percent, making it the second largest source market for Tanzania in The position of Kenya is largely associated with its proximity to Tanzania as most Kenyans came to visit their friends and relatives. When compared with the survey conducted in 2015, there are new entrants into the top 15 source markets from the East African countries namely Burundi and Uganda, which replaced the Netherlands and Switzerland. Chart 2.1: Top 15 source markets for the URT United Kingdom Kenya United States of America Germany Italy South Africa Zambia Uganda Spain Zimbabwe France Australia Canada Burundi China
25 In the case of Tanzania Mainland, the top 15 source markets accounted for about 80.0 percent compared to 76.5 percent recorded in the 2015 survey. The leading source markets are the United Kingdom, followed by Kenya and the United States of America (Chart 2.2). Most of the top 15 source markets remained the same with slight changes in positions of some countries such as Kenya, Zambia and Uganda. Chart 2.2: Top 15 source markets for Tanzania Mainland United Kingdom Kenya United States of America Germany Zambia Italy Uganda Zimbabwe Spain France Australia South Africa Canada Burundi China In the case of Zanzibar, the top 15 source markets accounted for 84.3 percent in 2016 compared to 82.4 percent in Similarly, the list of the top 15 source markets changed slightly whereby Italy has been replaced by the United Kingdom in the leading position. The top 15 source markets have remained the same except Denmark, which has replaced the United Arab Emirates (Chart 2.3). 10
26 Chart 2.3: Top 15 source markets for Zanzibar United Kingdom Italy Germany United States of States South Africa Spain France Australia Canada Switzerland Kenya Netherlands Belgium China Denmark Age group Similar to the previous surveys, the leading proportion of visitors to Tanzania was in the age group of years accounting for 51.0 percent. The second age group was years, followed by years and those who have 65 years and above. It should be noted that visitors who are 65 years and above continue to be few in spite of having more disposable income and ample time for leisure. Visitors below 18 years accounted for the lowest share (Chart 2.4). Chart 2.4: Distribution of visitors by age group, URT Below 18 '18-24' '25-44' '45-64' 65 and Above Age Group 11
27 The findings further indicate that the majority of the visitors the under age group of came from Kenya and the United Kingdom. The second prominent age group was with most visitors coming from the United States of America, the United Kingdom and Germany. Visitors in the age of 65 years and above were the least and mainly came from the United States of America and Germany (Table 2.1). Table 2.1: Distribution of top 15 source markets by age group, URT 2016 Age Group Country of Residence Below and Above United Kingdom Kenya United States of America Germany Italy South Africa Zambia Uganda Spain Zimbabwe France Australia Canada Burundi China Others Total Number of Visitors 1,551 2,224 7,655 4, Similar to the preceding surveys, the age group of years took the lead in leisure and holidays and business activities. The majority of visitors at the age of 65 years and above came for leisure and holidays as well as visiting friends and relatives (Table 2.2). Table 2.2: Age group and purpose of visit, URT 2016 Age group Leisure and holidays Visiting friends and relatives Business Purpose of Visit Meetings and conferences Scientific and academic Volunteering Religion Other Below and Above Total Total 12
28 Out of 6,895 visitors to Zanzibar, the largest proportion was at the age group of 25 44, which accounted for 52.1 percent (Chart 2.5). Visitors under the age group of 65 years and above and below 18 years were the least accounting for 5.0 percent and 1.6 percent respectively. Chart 2.5: Distribution of visitors by age group, Zanzibar Below 18 '18-24' '25-44' '45-64' 65 and Above Age group Further, the results show that majority of the visitors under all age groups in Zanzibar came for leisure and holidays (Table 2.3). Table 2.3: Age group and purpose of visit, Zanzibar, 2016 Purpose of Visit Leisure Visiting Scientific and friends and Meetings and and Age group Business holidays relatives Volunteering conferences academic Religion Total Below and Above Total Chart 2.6 reveals that the majority of the visitors with the age group of 25 44, came under the non-package tour arrangement. Visitors of the age below 24 years preferred the non-package tour arrangement while visitors above 44 years of age had higher preference for the package tour arrangement. 13
29 Chart 2.6: Tour arrangement by age group, URT 2016 Non Package Package Below and Above Age group 2.3 Gender Survey results show that about 52 percent of visitors to the United Republic of Tanzania (URT) were male and 48.0 percent were female. There was a reasonable gender balance between men and women and the trend has been consistent over the previous surveys. In the case of Zanzibar, female visitors dominated by recording 54.1 percent compared with 45.9 percent for males. For the case of URT, the findings indicate that female visitors mainly came for leisure and holidays, scientific and academic as well as volunteering. Male visitors were dominant in business, meetings and conferences and religious purposes (Chart 2.7). Chart 2.7: Visitors by gender and purpose of visit, URT Female Male Business Meetings and conferences Other Visiting friends and relatives Scientific and academic Leisure and holidays Volunteering Purpose of visit 14
30 Results show that in terms of purpose of visit by gender in Zanzibar, male visitors mainly came for business, meeting and conferences and scientific and academic. Female visitors mainly came for leisure and holiday, visiting friends and relatives and volunteering (Chart 2.8) Chart 2.8: Visitors by gender and purpose of visit, Zanzibar Female Male Other Meetings and conferences Business Scientific and academic Visiting friends and relatives Leisure and holidays Volunteering Purpose of visit 2.4 Purpose of visit The survey results revealed that the majority who visited Tanzania (59.9 percent) came for leisure and holidays, followed by those who came to visit friends and relatives and for business purpose (Chart 2.9). Visitors who came for meetings and conferences were the least. The dominance of holidaymakers was also experienced in the previous surveys. Likewise, the share of business visitors almost doubled in 2016 compared to the number recorded in This performance is associated with conducive business environment, and crossborder trade and investment. 15
31 Chart 2.9: Purpose of visit URT, 2016 Leisure and holidays 59.9 Visiting friends and relatives 18.3 Business 11.0 Meetings and conferences 5.5 Scientific and academic 2.4 Volunteering 2.2 Other 0.6 The majority of visitors from the top 15 source markets to Tanzania who came for leisure and holidays were from the United States of America, the United Kingdom, Italy and Germany (Table 2.4). Tourists who came to visit friends and relatives were mainly from Kenya and the United Kingdom. Visitors from Zambia and Zimbabwe mostly came for business. Table 2.4: Distribution of top 15 source markets by purpose of visit, URT Purpose of Visit Country of Residence Leisure and holidays Visiting friends and relatives Business Meetings and conferences Scientific and academic Volunteering Religion Other Grand total United Kingdom Kenya United States of America Germany Italy South Africa Zambia Uganda Spain Zimbabwe France Australia Canada Burundi China Grand total Number of Visitors 7,913 2,547 1, ,373 16
32 In the case of Tanzania Mainland, the leading purpose of visit was also leisure and holidays followed by visiting friends and relatives and business (Chart 2.10). Chart 2.10: Purpose of visit Tanzania Mainland, 2016 Leisure and holidays 54.8 Visiting friends and relatives 20.4 Business 12.6 Meetings and conferences 6.1 Scientific and academic 2.8 Volunteering 2.5 Other 0.7 The pattern of purpose of visit of the top 15 source markets for Tanzania Mainland is similar to that of URT with slight changes in dominance (Table 2.5). Table 2.5: Distribution of top 15 source markets by purpose of visit, Tanzania Mainland Purpose of visit Country of Residence Leisure and holidays Visiting friends and relatives Business Meetings and conferences Scientific and academic Volunteering Religion Other Grand total United Kingdom Kenya United States of America Germany Zambia Italy Uganda Zimbabwe Spain France Australia South Africa Canada Burundi China Grand total
33 In Zanzibar, the same pattern was observed, whereby visitors who came for leisure and holidays purpose were dominant. The rest of the purposes recorded less than ten percent each (Chart 2.11). Chart 2.11: Purpose of visit Zanzibar, 2016 Leisure and holidays 86.8 Visiting friends and relatives Volunteering Meetings and conferences Business Scientific and academic Other The majority of visitors who came for leisure and holidays in Zanzibar were from Italy, the United Kingdom, Germany and the United States of America (Table 2.6). Under the business category, the majority of visitors were from South Africa and the United States of America. Table 2.6: Distribution of top 15 source markets by purpose of visit, Zanzibar Top 15 Source Markets Leisure and Holidays Visiting Friends and Relatives Business Purpose of Visit Meetings and Conference Scientific and Academic Volunteering Religion Grand Total United Kingdom Italy Germany United States of America South Africa Spain France Australia Canada Switzerland Kenya Netherlands Belgium China Denmark Grand Total
34 2.5 Travel arrangement The survey findings indicate that 58.2 percent of the tourists who visited Tanzania in 2016 came under the non-package travel arrangement. The same pattern was observed in Furthermore, the majority of visitors the from Burundi, Zimbabwe, Uganda and Zambia came under the non-package tour arrangement, while those from Australia, Italy and the United States of America came under the package tour arrangement (Table 2.7). Table 2.7: Proportion of visitors by source markets by travel arrangement, URT Top 15 Source Markets Travel Arrangement () Non-package Package Total Visitors United Kingdom ,054 Kenya ,947 United States of America ,925 Germany ,281 Italy ,248 South Africa Zambia Uganda Spain Zimbabwe France Australia Canada Burundi China Others ,266 19
35 The non-package visitors have dominated in 2015 and 2016 compared to the package visitors (Chart 2.12). The dominance of the non-package was also observed in 2008 and 2011, following the global financial crisis and sovereign debt crisis in the Euro Zone, respectively. Chart 2.12: Trends in tour arrangements, Package Non-package The change of dominance to the non-package tour arrangement is partly explained by the increase in the number of visitors from the neighboring countries namely Kenya, Zambia, Zimbabwe, Uganda, Burundi and Uganda. The results revealed that, there was an increase in visitors from the neighboring countries in the last two years who usually come under the non-package arrangement. Meanwhile, the number of visitors the under package tour arrangement from these countries remained more or less the same with the exception of Kenya and Zambia. Chart 2.13 shows the trend of visitors by travel arrangement for the last three years. 20
36 Chart 2.13: Visitors from Neighbouring countries by travel arrangement Number of visitors Non-Package Number of visitors Kenya Zambia Uganda Zimbabwe Rwanda Burundi Package Number of Visitors Kenya Zambia Uganda Zimbabwe Rwanda Burundi 21
37 When the neighboring countries were excluded from the list of visitors, the dominance of the package visitors from long haul source market continued to persists (Chart 2.14). This implies that the international phenomenon has not changed rather there has been increase in visitors regionally particularly for meetings, business as well as visiting friends and relatives. It is worth noting that, over time the proportion of non-package visitors has been increasing. Chart 2.14: Visitors by travel arrangement excluding those from neighbouring countries, URT Number of visitors Package Non-package 4,478 5,297 5,996 8,224 7,090 6,
38 For Zanzibar, the majority of visitors (57.8 percent) came under the package tour arrangement while the rest used non-package tour arrangement. Visitors with higher preference for the package tour arrangement mainly came from Italy, South Africa and Australia. Those from Kenya, Belgium and Denmark preferred the non-package tour arrangement (Table 2.8). Table 2.8: Proportion of visitors by sources markets by travel arrangement, Zanzibar Top 15 Source Markets Travel Arrangement () Non-package Package Total Visitors United Kingdom ,024 Italy Germany United States of America South Africa Spain France Australia Canada Switzerland Kenya Netherlands Belgium China Denmark Table 2.9 indicates that holidaymakers preferred the package tour arrangement compared to other purposes of visit. Table 2.9: Distribution of visitors by tour arrangement by purpose of visit, URT Purpose of Visit Leisure Visiting Meetings Scientific Tour and friends and and and Grand Arrangement holidays relatives Business conferences academic Volunteering Religion Other total Non - Package ,680 Package ,959 Total ,639 23
39 The same pattern was observed for the tour arrangement and purpose of visit for Zanzibar (Table 2.10). Table 2.10: Distribution of visitors by tour arrangement by purpose of visit, Zanzibar Purpose of Visit Visiting Leisure friends Meetings Scientific and and and and Grand Tour Arrangement holidays relatives Volunteering conferences Business academic Religion total Non - Package ,909 Package ,986 Total ,895 Table 2.11 indicates that under the non-package tour arrangement, the United Kingdom led in bringing more visitors for leisure and holidays, while those who came to visit friends and relatives were mostly from Kenya. Under business category, the majority of the visitors were from Zambia and Zimbabwe. The dominance of Zambia and Zimbabwe is partly explained by their utilization of the Dar es Salaam port for imports and exports of goods. Table 2.11: Distribution of visitors under the non-package by purpose of visit, URT Purpose of visit Visiting Leisure and friends and Meetings and Scientific and Country of residence holidays relatives Business conferences academic Volunteering Religion Other United Kingdom Kenya United States of America Germany Italy South Africa Zambia Uganda Spain Zimbabwe France Australia Canada Burundi China Total
40 The majority of business visitors who came to Tanzania under the package tour arrangement were from Italy, South Africa, Kenya and Zambia. Under the leisure and holidays category, the majority of the visitors were from the United States of America, Italy, the United Kingdom and Germany (Table 2.12). Table 2.12: Distribution of visitors under the package by purpose of visit, URT Purpose of Visit Visiting Leisure Scientific friends Meetings and and and and Top 15 source markets Holidays academic relatives conferences Business Volunteering Religion Other United Kingdom Kenya United States of America Germany Italy South Africa Zambia Uganda Spain Zimbabwe France Australia Canada Burundi China Total
41 The survey findings indicate that under the non-package tour arrangement the majority of the visitors, who came to Zanzibar for leisure and holidays, visiting friends and relatives, meetings and conferences and volunteering were from the United Kingdom while Germany and Belgium dominated under the scientific and academic category (Table 2.13). Table 2.13: Distribution of visitors under the non-package by purpose of visit, Zanzibar Purpose of Visit Country of Residence Leisure and Holidays Visiting Friends and Relatives Business Meetings and Conferences Scientific and Academic Volunteering Religion United Kingdom Italy Germany United States of America South Africa Spain France Australia Canada Switzerland Kenya Netherlands Belgium China Denmark Total
42 Table 2.14 indicates that the majority of the visitors to Zanzibar who came for leisure and holidays as well as visiting friends and relatives under the package tour arrangement were from Italy and Germany. South Africa dominated in the business, meetings and conferences categories. The majority of the visitors from Denmark, Spain and the United Kingdom came for volunteering purposes. Table 2.14: Distribution of visitors under the package by purpose of visit, Zanzibar Purpose of Visit Leisure Visiting Scientific and friends and Meetings and and Top 15 Source markets holidays relatives Volunteering conferences Business Religion academic United Kingdom Italy Germany United States of America South Africa Spain France Australia Canada Switzerland Kenya Netherlands Belgium China Denmark Total First-time and repeat visit The survey findings indicate that 54.7 percent of all the interviewees were firsttime visitors, while 45.3 percent were repeat visitors. Out of the total first-time visitors, 52.2 percent came under the package tour arrangement, while the rest used the non-package tour arrangement (Chart 2.15). The majority of the repeat visitors (88.2 percent) came under the non package tour arrangement. Preference for the non-package tour arrangement among the repeat visitors could be related with the familiarity of the destination given that most of the visitors came from the neighboring countries. For the case of Zanzibar, the majority of the repeat visitors came under the package tour arrangement. 27
43 Chart 2.15: First-time and repeat visitors by tour arrangements United Republic of Tanzania Package Non-Package Zanzibar Package Non-Package Repeat First time Repeat First time Furthermore, the results show that with the exception of Kenya, Uganda, Burundi, Zambia and Zimbabwe, the majority of visitors from the top 15 source markets were first-timers (Chart 2.16). Neighboring countries led in repeat visitors, largely because of the growing business relations and family ties between Tanzania and these countries. Chart 2:16: First-time and repeat visitors by top 15 source markets, URT Repeat First Time Spain Australia France Italy United Germany United States of Kingdom America Canada South Africa India Zimbabwe Zambia Burundi Uganda Kenya 28
44 Table 2.15 reveals that most of the tourists who were first-time visitors came for leisure and holidays. Meanwhile, the majority of repeat visitors came to visit relatives and for business purposes. Other categories such as religion, volunteering, scientific and academic had the lowest percent for both first-time and repeat visitors. Table 2.15: First-time and repeat visitors by purpose of visit, URT Purpose of visit First-time visitors Repeat visitors Leisure and holidays Visiting friends and relatives Business Meetings and conferences Volunteering Scientific and academic Religion Other Total
45 Chart 2.17 indicates that the majority of first-time visitors came for wildlife and beach tourism activities. Most of the repeat visitors came for conference tourism and visiting friends and relatives. Chart 2.17: First-time and repeat visitors by tourism activities, URT First-time visitors Wildlife 38.0 Beach 22.5 Mountain climbing Conference Cultural Visiting relatives Other Activities Business 2.0 Repeat visitors Conference 22.4 Visiting Relatives 18.8 Beach 14.2 Wildlife 10.7 Business Other Activities Shopping Cultural Mountain Climbing 1.9 Note: Other activities include hunting, bird watching water sports and diving 30
46 The results indicate that with the exception of Kenya, the majority of visitors to Zanzibar from the top 15 source markets were first-time visitors (Chart 2.18). Most of the repeat visitors were from Kenya. Chart 2.18: First-time and repeat visitors by Top 15 source markets, Zanzibar Repeat Visitors First Time Visitors Spain France Italy Australia Netherlands Switzerland Belgium Germany United States of America 58.2 China Denmark United South Africa Canada Kenya Kingdom 31
47 As indicated in Chart 2.19, leisure and holidays was the leading purpose that attracted the majority of both first-time and repeat visitors (89.6 percent and 60.3 percent respectively). Visitors who came for scientific and academic and religion purposes were the least for both first-time and repeat visitors. Chart 2.19: First-time and repeat visitors by purpose of visit, Zanzibar First-time visitors Leisure and holidays 89.6 Visiting friends and relatives Volunteering Meetings and conferences Business Scientific and academic Religion Repeat visitors Leisure and holidays 60.3 Visiting friends and relatives 27.1 Meetings and conferences 6.6 Business 3.8 Volunteering 1.4 Scientific and academic 0.5 Religion
48 The findings further show that beach and wildlife were the leading activities that attracted the majority of both first-time and repeat visitors in Zanzibar (Chart 2.20). It is worth noting that, wildlife activities were also prominent in Zanzibar partly because visitors who exited from there also came for wildlife while in Tanzania Mainland. Chart 2.20: First-time and repeat visitors by tourism activity, Zanzibar First-time Visitors Beach Wildlife Mountain climbing Cultural Visiting relatives Conference Diving and sport fishing Other activities Shopping Repeat Visitors Beach 40.1 Wildlife 20.7 Visiting relatives Conference Cultural Other activities Shopping Mountain climbing Diving and sport fishing Note: Other activities include business, hunting, bird watching water sports and diving 33
49 2.7 Source of information Survey findings show that about 42.2 percent of all the visitors got information about Tanzania from friends and relatives, followed by those who heard from travel agents and tour operators (Chart 2.21). Visitors who heard about Tanzania through travel agents and tour operators were mostly from the United States of America, United Kingdom, Kenya and South Africa, while those who received information through friends and relatives were from Kenya, the United Kingdom and France. Newspapers, magazines and brochures and web were equally important sources of information. Other sources of information were Tanzania s missions abroad, trade and tourism fairs, radio stations and television networks. Chart 2.21: Sources of information, URT Friends, relatives 42.2 Travel agent, tour operator 36.2 Others Web Newspaper, magazines, brochures Travel Advisory Trade fair Radio & TV Networks Tanzania Missions Abroad Travel party The findings of the survey indicate that about 31 percent of the respondents travelled alone (Chart 2.22). Those who travelled with their friends and relatives accounted for 26 percent, followed by those who travelled with spouses. A small proportion of visitors who came with their parents was also recorded. 34
50 Chart 2.22: Travel party, URT Alone 30.5 With other friends and relatives 26.3 With spouse 20.8 With spouse and children 12.0 With children 7.0 With parents 3.4 Unlike the case of URT, visitors to Zanzibar who travelled with spouses took the lead by accounting for 29.1 percent, followed by those who travelled with friends and relatives (Chart 2.23). Those who came with parents were the least. Chart 2.23: Travel party, Zanzibar With spouse 29.1 With other friends/relatives 28.7 With spouse and children 18.8 Alone 12.4 With children 6.6 With parents
51 2.9 Departure points The survey covered eight departure points of which three were airports and five land border posts. The results show that 75.1 percent of the visitors departed through airports and 24.9 percent through land border posts (Table 2.16). The Julius Nyerere International Airport is the main departure point for tourists as it accounted for 40.6 percent of all the departing visitors, followed by the Abeid Aman Karume International Airport and Kilimanjaro International Airport. In terms of visitors departing through land, the leading border posts were Horohoro, Tunduma and Namanga. Table 2.16: The Number of visitors by departure points, URT Departure points Visitors Julius Nyerere International Airport 6, Abeid Amani Karume International Airport 3, Kilimanjaro International Airport 2, Horohoro 1, Tunduma Namanga Mutukula Manyovu Total 16, Table 2.17 shows that Tunduma continues to be the leading departure point in handling the largest volume of visitors who came for business. This is because visitors from Zimbabwe and Zambia are using Dar es Salaam port for clearing imports and Kariakoo market for shopping. Visitors who came for leisure and holidays from long haul source market departed through AAKIA, KIA and JNIA due to availability and connectivity of many international airlines. 36
52 Table 2.17: Proportion of visitors by departure points and purpose of visit, URT Purpose of Visits Departure Points Leisure and holidays Visiting friends and relatives Business Meetings and conferences Scientific and academic Volunteering Other Total JNIA AAKIA KIA HOR TUN NAM MTU MANY Nights spent and average length of stay The length of stay for the visitors is derived from the number of nights spent in the country. Nights spent by visitors varied depending on purpose of visit and country of origin. The survey results show that 18 percent of the visitors who came to the United Republic of Tanzania spent 1 to 3 nights, 27 percent spent 4 to 7 nights, while about one third of total visitors spent 8 to 14 nights (Chart 2.24). These results are almost similar to the findings of the previous surveys. Generally, more than three-quarters of the visitors spent between 1 to 14 nights, while a few of them visitors spent between 28 to 91 nights. Chart 2.24: Distribution of visitors by nights spent, URT, to 3 4 to 7 8 to to to to 360 Nights spent 37
53 The distribution of visitors by nights spent and purpose of visit shows that the majority of the holidaymakers spent between 8 to 14 nights, while most of the business visitors spent 1 to 3 nights. Meanwhile, a large proportion of visitors who came for meetings and conference spent 4 to 7 nights (Table 2.18). Table 2.18: Distribution of visitors by the nights spent and purpose of visit, URT Purpose of visit Leisure Visiting Meetings Scientific and friends and and and Nights spent holidays relatives Business conferences academic Volunteering Religion Other 1 to to to to to to Grand total The pattern of the distribution of visitors by nights spent in Tanzania Mainland is similar to that of URT (Chart 2.25). Chart 2.25: Distribution of visitors by the nights spent, Tanzania Mainland, to 3 4 to 7 8 to to to to 360 Night spent
54 In the case of Zanzibar, more than half of the visitors spent 8 to 14 nights, while those who spent more than a month accounted for 5 percent (Chart 2.26). Chart 2.26: Distribution of visitors by the nights spent, Zanzibar to 3 4 to 7 8 to to to to 360 Nights spent The survey results show that an overall average length of stay of persons who visited Tanzania was 9 nights slightly lower than 10 nights recorded during the past five years. This is partly due to the increase in the number of the visitors from the neighboring countries whose length of stay is shorter. For instance, visitors from Burundi and Kenya spent an average of 4 nights. Visitors from Germany and Spain stayed the longest with an average of 14 and 13 nights, respectively (Table 2.19). These results are consistent with the previous findings, whereby visitors from long haul source markets stayed the longest. 39
55 Table 2.19: Length of stay by purpose of visit and top 15 source markets, URT Country of residence Business Leisure and holidays Purpose of visit Visiting friends and relatives Other Average United Kingdom Kenya United States of America Germany Italy South Africa Zambia Uganda Spain Zimbabwe France Australia Canada Burundi China Average The overall average length of stay for Tanzania Mainland was 8 nights (Table 2.20). Visitors from Germany stayed the longest with an average of 13 nights, followed by those from Australia, Canada, Spain, Italy, the United Kingdom and the United States of America. Table 2.20: Length of stay by purpose of visit and top 15 source markets, Tanzania Mainland Business Purpose of visit Leisure and holidays Visiting friends and relatives Other Average Country of residence Australia Burundi Canada China France Germany Italy Kenya South Africa Spain Uganda United Kingdom United States of America Zambia Zimbabwe Average
56 In the case of Zanzibar, the overall average length of stay remained at 6 nights the same as observed in the previous five surveys. Visitors from Denmark and Italy stayed the longest with an average of 8 nights each (Table 2.21). Table 2.21: Average length of stay by purpose of visit and top 15 source markets, Zanzibar Purpose of visit Country of residence Business Leisure and holidays Visiting friends and relatives Other Average United Kingdom Italy Germany United States of America South Africa Spain France Australia Canada Switzerland Kenya Netherlands Belgium China Denmark Average Mode of payment During the 2016 survey, about 84 percent of the interviewed visitors to the United Republic of Tanzania settled their bills in cash, followed by those who used credit cards. When comparing with 2015 survey results, there is an increase in the use of cash relative to credit cards (Chart 2.27). Meanwhile, the number of visitors who used other modes of payment such as travelers cheques bank transfers and bankers cheques remained small same as in the 2015 survey results. Similarly, about 77 percent of interviewed visitors in Zanzibar paid in cash, followed by 21 percent who used credit cards and the rest settled their bills by other modes of payment. 41
57 Chart 2.27: Modes of payment, 2016 Cash Credit Cards Other Note: Other include modes of payment such as travelers cheques bank transfers and; bankers cheques When looking at the modes of payment by tour arrangement the majority of the visitors who came under the package tour settled their bills using credit cards compared to non-package tourists. Notwithstanding, cash was more prominent in both tour arrangements (Chart 2.28). Chart 2.28: Mode of payment by tour Arrangement Cash Credit Cards Other Package Non Package 42
58 The findings further reveal that most of those visitors who used credit cards under the package tour arrangement were from the United States of America, Italy, the United Kingdom and South Africa. Likewise, under the non-package tour, the same visitors mainly used credit cards except Italy. The findings also show that most of the visitors from the neighboring countries i.e. Kenya, Uganda, Zambia and Burundi under the non-package tour settled their bills mostly in cash (Chart 2.29 and Chart 2.30). Chart 2.29: Credit cards payment by tour arrangement for top 15 source markets Package United States of America Italy United Kingdom South Africa Germany Australia Spain Canada France China Switzerland Kenya Netherlands Austria Non-Package United Kingdom United States of America Germany South Africa Kenya Italy Spain Netherlands France Belgium Canada India Zimbabwe China United Arab Emirates
59 Chart 2.30: Cash payment by tour arrangement for top 15 source markets Package United States of America United Kingdom Italy Germany South Africa Australia France Kenya Spain Canada Switzerland China Netherlands India Austria Non-Package Kenya United Kingdom Zambia United States of America Uganda Zimbabwe Germany Burundi Italy Spain South Africa India Canada France China
60 2.12 Tourism activities The survey findings show that wildlife is the main tourism activity in Tanzania followed by beach and conference. The dominance of wildlife activities over beach is largely attributed to lack of specific plans and programs for developing the beach areas for sporting and recreation activities. Other important activities were visiting friends and relatives; cultural and mountain climbing (Chart 2.31). Chart 2.31: Tourism activities in URT, 2016 Wildlife Beach Conference Visiting friends and relatives Cultural Mountain climbing Other Business Shopping Diving and sport fishing Bird watching Hunting


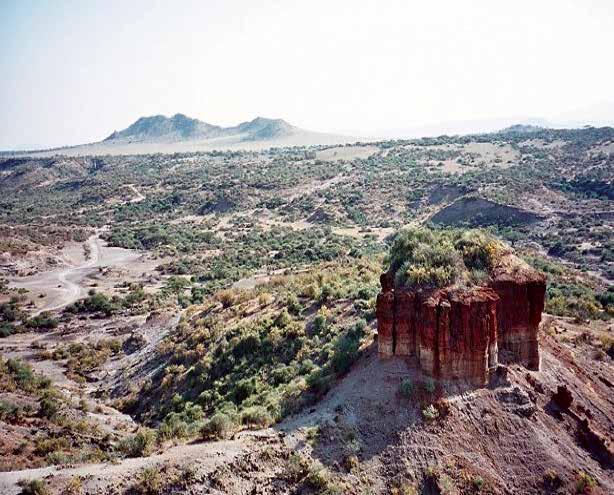


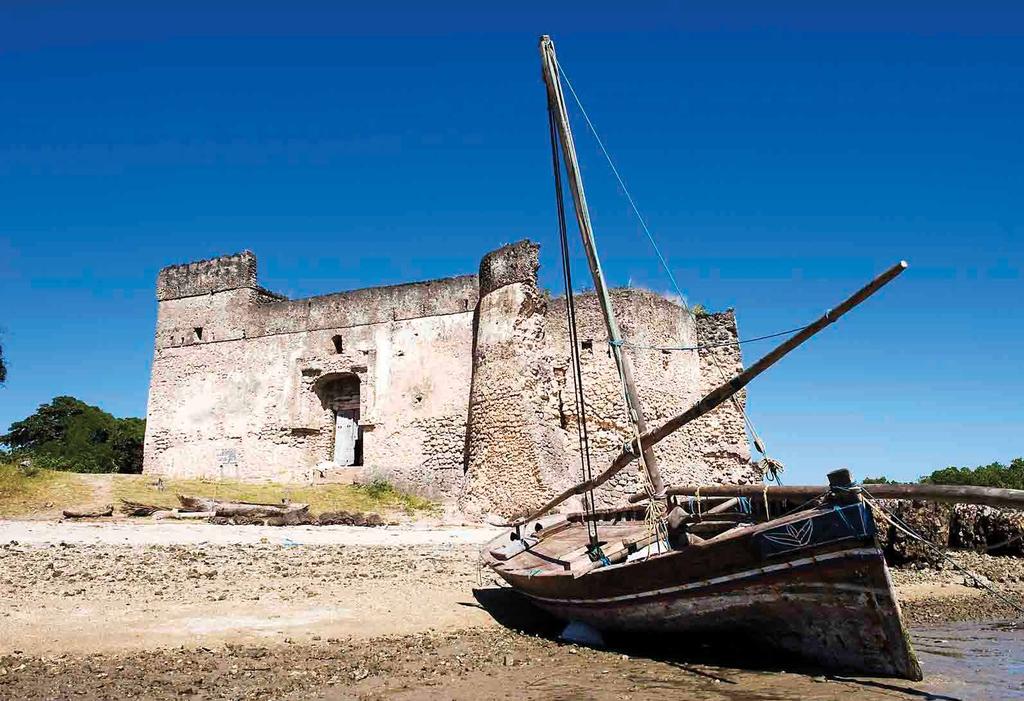
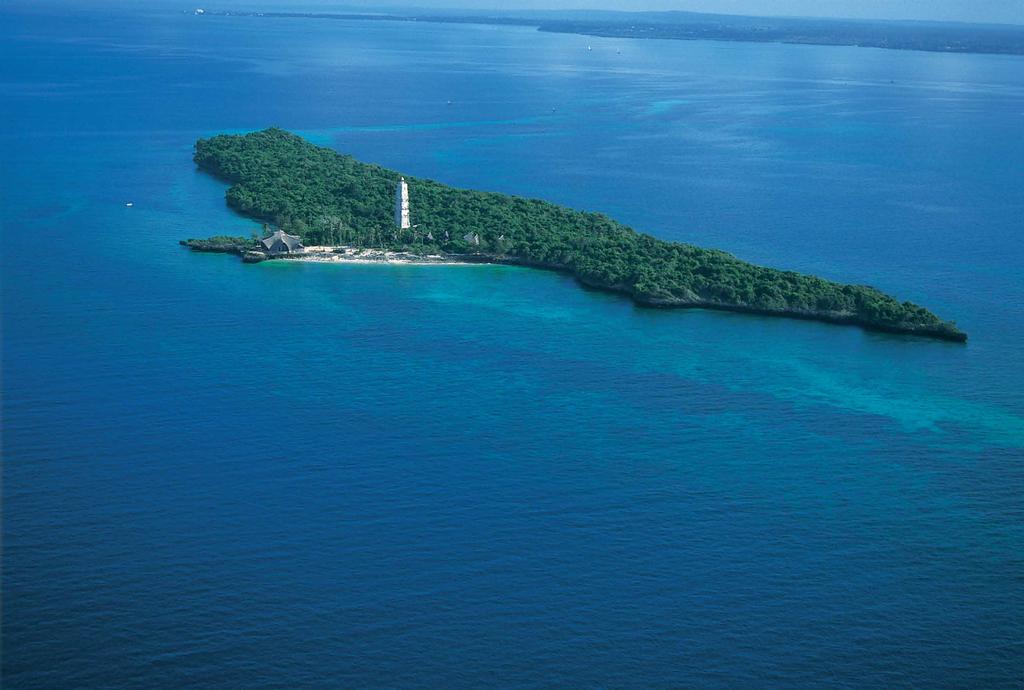
61 46 Tourism Activities in Tanzania
The 2015 International Visitors Exit Survey Report
 The 2015 International Visitors Exit Survey Report a TANZANIA TOURISM SECTOR SURVEY THE 2015 INTERNATIONAL VISITORS EXIT SURVEY REPORT October 2017 i TABLE OF CONTENTS LIST OF TABLES... iv LIST OF CHARTS...
The 2014 International Visitors Exit Survey Report THE TANZANIA TOURISM SECTOR SURVEY
 The 2014 International Visitors Exit Survey Report THE TANZANIA TOURISM SECTOR SURVEY a b TANZANIA TOURISM SECTOR SURVEY THE 2014 INTERNATIONAL VISITORS EXIT SURVEY REPORT November 2016 c d TABLE OF CONTENTS
Executive Summary... i. List of Tables and Figures viii CHAPTER 1: INTRODUCTION.. 1 CHAPTER 2: PRESENTATION OF SURVEY RESULTS 7
 TANZANIA TOURISM SECTOR SURVEY The 2004 International Visitors Exit Survey Report (DRAFT) Dar es Salaam, February 2006 ii CONTENTS Executive Summary.... i List of Tables and Figures viii CHAPTER 1: INTRODUCTION..
TANZANIA TOURISM SECTOR SURVEY. The 2008 International Visitors Exit Survey Report
 TANZANIA TOURISM SECTOR SURVEY The 2008 International Visitors Exit Survey Report TANZANIA TOURISM SECTOR SURVEY The 2008 International Visitors Exit Survey Report Dar es Salaam, June 2010 TABLE OF CONTENTS
TANZANIA TOURISM SECTOR SURVEY. The 2004 International Visitors Exit Survey Report
 TANZANIA TOURISM SECTOR SURVEY The 2004 International Visitors Exit Survey Report Dar es Salaam, December 2006 1 Tanzania Tourism Sector Survey BOT, MNRT, NBS, IMMIGRATION DEPT, ZCT, 2006 First Report,
TANZANIA TOURISM SECTOR SURVEY. The 2005 International Visitors Exit Survey Report
 TANZANIA TOURISM SECTOR SURVEY The 2005 International Visitors Exit Survey Report Dar es Salaam, October 2007 i BOT, MNRT, NBS, IMMIGRATION DEPT, ZCT, 2006 Published in 2007 Ministry of Natural Resources
SURVEY OUTGOING TOURISTS
 SURVEY OF OUTGOING TOURISTS 2006 SURVEY OF OUTGOING TOURISTS 2006 MINISTRY OF TOURISM, LEISURE & EXTERNAL COMMUNICATIONS REPUBLIC OF MAURITIUS FOREWORD The 2006 Survey of Outgoing Tourists was the eleventh
SOUTHERN AFRICA TRAVEL AND TOURISM BAROMETER REPORT 2015
 SOUTHERN AFRICA TRAVEL AND TOURISM BAROMETER REPORT 2015 1 Contents 1. TOURISM TRENDS: GLOBAL AND SOUTHERN AFRICA S MARKET SHARE IN AFRICA... 4 1.1. TOURIST ARRIVALS... 4 1.1.1. Global Tourist Arrivals
Western Cape Destination Performance Report: April-June 2016
 Number of arrivals (millions) Western Cape Destination Performance Report: April-June 2016 Global Tourism Performance According to the United Nations World Tourism Organisation, international tourist arrivals
Understanding Business Visits
 Understanding Business Visits Foresight issue 153 VisitBritain Research 1 Contents Introduction Summary and Highlights Business Visits in Context UK Business visits and spend Averages Duration of stay
Tourism Statistics. Quarter Contact Statistician: Oabona Machete Tel: (267)
") Tourism Statistics Quarter 1 2016 Contact Statistician: Oabona Machete Email: omachete@statsbots.org.bw Tel: (267) 367 1484 Tourism Statistics Quater 1 2016 1 Published by; Statistics Botswana, Private
Tourism Statistics Quarter 1 2016 Contact Statistician: Oabona Machete Email: omachete@statsbots.org.bw Tel: (267) 367 1484 Tourism Statistics Quater 1 2016 1 Published by; Statistics Botswana, Private
1.0 Introduction Zambia s Major Trading Partners Zambia s Major Export Markets... 4
 Bank of Zambia CONTENTS 1.0 Introduction... 3 2.0 Zambia s Major Trading Partners... 3 3.0 Zambia s Major Export Markets... 4 4.0 Major Source Countries Of Zambia s Imports... 5 5.0 Direction Of Trade
TRADE STATISTICS BULLETIN
 TRADE STATISTICS BULLETIN May 2014 Est. by Statistics Act 9 of 2011 Namibia Statistics Trade Statistics Bulletin, May 2014 Agency 1 MISSION STATEMENT In a coordinated manner we produce and disseminate
TOURISM BUSINESS COUNCIL OF SOUTH AFRICA TRENDS AND INDICATORS REPORT. March 2018
 TOURISM BUSINESS COUNCIL OF SOUTH AFRICA TRENDS AND INDICATORS REPORT March 2018 Compiled by: Ms. Tebogo Umanah General Manager: Policy Analysis and Strategic Projects March 2018 Page 1 CONTENTS INTRODUCTION...
Global travel patterns: an overview
 Journal of Travel Medicine, 2017, 1 5 doi: 10.1093/jtm/tax007 Perspective Perspective Global travel patterns: an overview Dirk Glaesser*, John Kester, Hanna Paulose, Abbas Alizadeh, and Birka Valentin
Country Profile: Kenya 2017
 Country Profile: Kenya 217 1. Global Tourism Performance of Kenya Domestic tourism is the major driving force of the Kenyan tourism sector. The total number of domestic trips rose from 18.1 million in
CONTENTS Executive Summary... iii 1. Introduction Major Destinations for Zambia s Exports Major Source Countries for Zambia s
 Bank of Zambia CONTENTS Executive Summary... iii 1. Introduction... 1 2. Major Destinations for Zambia s Exports... 1 3. Major Source Countries for Zambia s Imports... 4 4. Conclusion... 6 ii Executive
TOURISM BUSINESS COUNCIL OF SOUTH AFRICA TRENDS AND INDICATORS REPORT. May 2018
 TOURISM BUSINESS COUNCIL OF SOUTH AFRICA TRENDS AND INDICATORS REPORT May 2018 Compiled by: Ms. Tebogo Umanah General Manager: Policy Analysis and Strategic Projects May 2018 Page 1 CONTENTS INTRODUCTION...
1.0 Introduction Zambia s Major Trading Partners Zambia s Major Export Markets... 4
 Bank of Zambia CONTENTS 1.0 Introduction... 3 2.0 Zambia s Major Trading Partners... 3 3.0 Zambia s Major Export Markets... 4 4.0 Major Source Countries Of Zambia s Imports... 5 5.0 Direction Of Trade
Tourism Statistics
 Tourism Statistics 2006-2010 TABLE OF CONTENTS FOREWORD 4 DEFINITIONS 5 STATISTICAL SUMMARY FOR 2010 6 INTERNATIONAL TOURIST ARRIVALS 7 International Tourist Arrivals: 1994-2010 7 International Tourist
Copyrights Statistics Botswana 2016
 STATISTICS BOTSWANA TOURISM STATISTICS ANNUAL REPORT 2014 Copyrights Statistics Botswana 2016 Statistics Botswana. Private Bag 0024 Botswana Tel: (267) 367 1300. Fax: (267) 395 2201.Email: info@statsbots.org.bw
CONTENTS Executive Summary... iii 1. Introduction Major Destinations for Zambia s Exports Major Source Countries for Zambia s
 Bank of Zambia CONTENTS Executive Summary... iii 1. Introduction... 1 2. Major Destinations for Zambia s Exports... 1 3. Major Source Countries for Zambia s Imports... 4 4. Conclusion... 6 ii Executive
III. TRADE IN COMMERCIAL SERVICES BY CATEGORY
 .. TRADE IN COMMERCIAL SERVICES BY CATEGORY Transportation services China records impressive growth Exports of world transportation services reached $750 billion in 2007, an increase of 19 per cent, following
1.0 Introduction Zambia s Major Trading Partners Zambia s Major Export Markets... 4
 Bank of Zambia CONTENTS 1.0 Introduction... 3 2.0 Zambia s Major Trading Partners... 3 3.0 Zambia s Major Export Markets... 4 4.0 Major Source Countries Of Zambia s Imports... 5 5.0 Direction Of Trade
US $ 1,800 1,600 1,400 1,200 1,000
 IATA ECONOMIC BRIEFING JULY 9 INFRASTRUCTURE COSTS SUMMARY Historical data indicates that during recession periods infrastructure providers usually increase their prices while other prices are falling
Tourism Statistics Annual Report
 Tourism Statistics 2012 Annual Report Research and Development Department, June 2012 Table of Contents PREFACE... 3 THE WORLD TOURISM SCENE... 3 THIS REPORT... 3 INTERNATIONAL ARRIVAL STATISTICS... 4 INTRODUCTION...
International Visitation to the Northern Territory. Year ending September 2018
 International Visitation to the Northern Territory Year ending September 2018 INTERNATIONAL VISITORS IN THE NORTHERN TERRITORY YEAR ENDING SEPTEMBER 2018 VISITORS 289,000-1.1% NIGHTS 3.6 MILLION EXPENDITURE
International Visitation to the Northern Territory. Year ending March 2018
 International Visitation to the Northern Territory Year ending March 2018 The following is a summary of information relevant to the Northern Territory (NT) tourism industry including visitation results
The United Republic of Tanzania Ministry of Natural Resources and Tourism TOURISM DIVISION The 2013 Tourism Statistical Bulletin
 The United Republic of Tanzania Ministry of Natural Resources and Tourism TOURISM DIVISION The 2013 Tourism Statistical Bulletin INTRODUCTION THE COUNTRY Tanzania covers 945,234 sq. km made up 942,832
Digest of International Travel and Tourism Statistics 2017
 Vol. 44 Republic of Mauritius Digest of International Travel and Tourism Statistics 2017 Ministry of Finance and Economic Development Statistics Mauritius October 2018 (Price: Rs 75.00) DIGEST OF INTERNATIONAL
Ministry of Natural Resources and Tourism Tourism Division. The 2009 Tourism Statistical Bulletin
 Ministry of Natural Resources and Tourism Tourism Division The 2009 Tourism Statistical Bulletin INTRODUCTION THE COUNTRY Tanzania covers 945,234 sq. km made up 942,832 sq. km of mainland Tanzania (formerly
Forecast for Norwegian and foreign holiday and leisure traffic in Norway. Margrethe Helgebostad
 Forecast for Norwegian and foreign holiday and leisure traffic in Norway Margrethe Helgebostad 1 Optimism at the start of the summer season there are many signs that the fifth summer season in a row with
International Travel Management Study 2018
 International Travel Management Study 2018 Part 1 Business Travel Outlook Expect more trips and higher spend. Executives are packing their suitcases and flying around the world to do business for their
Strong outbound tourism demand from both traditional and emerging markets in 2017
 Strong outbound tourism demand from both traditional and emerging markets in 2017 Virtually all source markets reported higher tourism spending in 2017, reflecting continued strong demand for international
ANGUILLA VISITOR ARRIVALS 61, % 61.2% VISITOR PROFILE TOURISM AND OTHER RELATED ECONOMIC STATISTICS $ $ $819
 ANGUILLA Visitor Arrival Summary Total visitor arrivals to Anguilla totaled 118.4 thousand in 2010 compared to 112.1 thousand in 2009, an increase of 5.6 percent. Stay-over Arrivals continued to exceed
GUYANA TOURISM STATISTICAL DIGEST 2015
 GUYANA TOURISM STATISTICAL DIGEST 2015 GUYANA TOURISM STATISTICAL DIGEST 2015 EDITION National Exhibition Centre Sophia, Greater Georgetown 413741 Guyana, South America. Tel: (592) 219-0094-6 E-mail: info@guyana-tourism.com
International Visitation to the Northern Territory. Year ending December 2017
 International Visitation to the Northern Territory Year ending December 2017 The following is a summary of information relevant to the Northern Territory (NT) tourism industry including visitation results
International Visitation to the Northern Territory. Year ending September 2017
 International Visitation to the Northern Territory Year ending September 2017 The following is a summary of information relevant to the Northern Territory (NT) tourism industry including visitation results
Tourist Statistical Report 2012 and 2013
 Tourist Statistical Report 212 and 213 October 214 Produced by the Directorate of Tourism Private Bag 1336 Levinson Arcade Capital Centre Building, 4th floor Windhoek, Namibia Tel +264 61 284233/2259 Fax:
WESTERN CAPE TOURISM BAROMETER: Your Provincial Tourism Intelligence Source
 WESTERN CAPE TOURISM BAROMETER: Your Provincial Tourism Intelligence Source Volume 3, Issue 1 October-December 2008 Produced by Cape Town Routes Unlimited INTRODUCTION This barometer is a synopsis of the
PACIFIC ISLAND COUNTRIES
 QUARTERLY REVIEW OF TOURIST ARRIVALS IN PACIFIC ISLAND COUNTRIES QUARTER 4 217 I December, 217 Report prepared by : Research & Statistics Division Contacts : Jennifer Butukoro (cbutukoro@spto.org) : Elizabeth
3rd International Forum on sustainable Tourism 20th to 22nd October 2008 Bamako - Mali
 TANZANIA S POLICY ON TOURISM DEVELOPMENT 3rd International Forum on sustainable Tourism 20th to 22nd October 2008 Bamako - Mali Ministry of Natural Resources and Tourism - Tanzania 1 Tanzania basic facts
Tourism in perspective July NBTC Holland Marketing Research Department
 Tourism in perspective July 2017 NBTC Holland Marketing Research Department Table of contents Introduction 1. Developments international tourism 2. Developments inbound tourism the Netherlands 3. Analysis
INTERNATIONAL TRAVEL AND TOURISM
 INTERNATIONAL TRAVEL AND TOURISM YEAR 2014 1. INTRODUCTION This issue of the Economic and Social Indicators presents data on International Travel and Tourism for the year 2014. A brief on the compilation
III. TRADE IN COMMERCIAL SERVICES BY CATEGORY
 .. TRADE IN COMMERCIAL SERVICES BY CATEGORY Transportation services China records impressive growth of world transportation services reached $750 billion in 2007, an increase of 19 per cent, following
CONTENTS Executive Summary... iii 1. Introduction Major Destinations for Zambia s Exports Major Source Countries for Zambia s
 Bank of Zambia CONTENTS Executive Summary... iii 1. Introduction... 1 2. Major Destinations for Zambia s Exports... 1 3. Major Source Countries for Zambia s Imports... 3 4. Conclusion... 6 ii Executive
Nigeria: Tourism Market Insights 2017
 6,8% 54,1% 45,9% 93,2% Nigeria: Tourism Market Insights 217 About Nigeria According to Nielson (217), Nigeria is home to over 25 ethnic groups divided on religious, socioeconomic, and political lines.
Table of Contents. Acknowledgements. Executive Summary. Introduction Scope of the Study. 1 Introduction to Russia
 Table of Contents Acknowledgements Executive Summary Introduction Scope of the Study 1 Introduction to Russia 1.1 Country Overview 1.1.1 Geographical and Cultural Diversity 1.1.2 Wealth of Mineral Resources
III. TRADE IN COMMERCIAL SERVICES BY CATEGORY
 . TRADE IN COMMERCIAL SERVICES BY CATEGORY The Highlights Transportation services Rising seaborne trade and air traffic contribute to the increase of transportation services trade In a context of rising
Report on Target Market Trends
 Report on Target Market Trends Strengthening Tour Operator Associations in Bhutan and Costa Rica, a Bilateral Project Implemented by Association of Bhutanese Tour Operators and Ecole Experience under the
FOREIGN TRAVEL PROFESSIONAL SURVEY ABOUT ICELAND TOURISM. September 2018
 FOREIGN TRAVEL PROFESSIONAL SURVEY ABOUT ICELAND TOURISM September 2018 Fieldwork summary Promote Iceland carried out an attitude survey in July and August 2018 amidst foreign travel professionals that
2016 Edition. Lesotho Tourism Development Corporation. July Page of 39
 2016 Edition Lesotho Tourism Development Corporation July 2017 Page of 39 TABLE OF CONTENTS FOREWORD... I 1. ANNUAL TOURISM PERFORMANCE 2016... 3 1.1 KEY HIGHLIGHTS OF LESOTHO S TOURISM SECTOR..3 2. ARRIVAL
TOURISM PERFORMANCE HIGHLIGHTS 2016
 TOURISM PERFORMANCE HIGHLIGHTS 2016 Foreword As the tourism marketing arm of the South African Government, South African Tourism has developed an integrated marketing strategy that focuses on leisure and
Tourism Snapshot A focus on the markets that the CTC and its partners are active in Ontario June 2011 Volume 7, Issue 6
 Tourism Snapshot Ontario A focus on the markets that the CTC and its partners are active in www.canada.travel/corporate June 2011 Volume 7, Issue 6 Key highlights In June 2011, overnight travel to Canada
Travel and Tourism in Ukraine: Key Trends and Opportunities to 2016
 Travel and Tourism in Ukraine: Key Trends and Opportunities to 2016 Reference code: TT0037MR_SP Published: July 2012 www.timetric.com Timetric John Carpenter House 7 Carmelite Street London EC4Y 0BS United
2015 VISITOR ARRIVALS SUMMARY
 2015 VISITOR ARRIVALS SUMMARY 1. Arrivals Summary: Despite some challenges, Papua New Guinea received over 198,685 international visitors in 2015, an increase of 4% or additional 7,000 arrivals compared
Prague Tourism Developments in Q1 2018
 Prague Tourism Developments in Q1 2018 Facts and Figures: Total visitors: 1,499,044 foreign: 1,239,848 (82.7%) domestic: 259,196 (17.3%) Total visitor growth in Prague: 121,224 visitors (8.8%) foreign
Tourism in South Africa A statistical overview
 Tourism in South Africa A statistical overview Purpose of presentation Purpose of the presentation is to present different tourism statistics produced by Stats SA People like to travel we are a country
Managing through disruption
 28 July 2016 Third quarter results for the three months ended 30 June 2016 Managing through disruption 3 months ended Like-for-like (ii) m (unless otherwise stated) Change 30 June 2016 30 June 2015 change
Tourism in numbers
 Tourism in numbers 2013-2014 Glenda Varlack Introduction Tourism is a social, cultural and economic experience which involves the movement of people to countries or places outside their usual environment
PACIFIC ISLAND COUNTRIES
 QUARTERLY REVIEW OF TOURIST ARRIVALS IN PACIFIC ISLAND COUNTRIES QUARTER 1 218 March, 218 Report prepared by : Research & Statistics Division Contacts : Jennifer Butukoro (cbutukoro@spto.org) : Elizabeth
Tourism Trends, Outlook and Issues. John G.C. Kester. 6th UNWTO/PATA Forum on Tourism Trends and Outlook. Guilin, China October 2012 day 1
 Tourism Trends, Outlook and Issues 6th UNWTO/PATA Forum on Tourism Trends and Outlook Guilin, China 11-13 October 212 day 1 John G.C. Kester Programme Manager, Tourism Trends and Marketing Strategies World
PRINCIPLES FOR DETERMINING THE COSTS OF AERONAUTICAL METEOROLOGICAL SERVICE FOR EN-ROUTE AND TERMINAL AIR NAVIGATION, UNITED REPUBLIC OF TANZANIA
 PRINCIPLES FOR DETERMINING THE COSTS OF AERONAUTICAL METEOROLOGICAL SERVICE FOR EN-ROUTE AND TERMINAL AIR NAVIGATION, UNITED REPUBLIC OF TANZANIA 1. Background Information Tanzania Meteorological Agency
GOVERNMENT OF ANGUILLA. Anguilla Visitor Expenditure Survey, August 2001
 GOVERNMENT OF ANGUILLA Anguilla Visitor Expenditure Survey, August 2001 Statistical Department, Ministry of Finance March, 2002 Preface Thanks are expressed to Dawnette Bryan of the Information Systems
Prospects for international tourism
 Prospects for international tourism Project LINK UN DESA Expert Group Meeting on the World Economy, NYC, USA 24-26 October 211 John G.C. Kester Programme Manager, Tourism Trends and Marketing Strategies
Tourism snapshot Canadian Tourism Commission
 Canadian Tourism Commission Commission canadienne du tourisme Tourism snapshot www.canada.travel A focus on the markets that the CTC and its partners are active in Volume 5, Issue 04 Key highlights Following
European Journal of Economic Studies, 2016, Vol.(17), Is. 3
, Is. 3") Copyright 2016 by Academic Publishing House Researcher Published in the Russian Federation European Journal of Economic Studies Has been issued since 2012. ISSN: 2304-9669 E-ISSN: 2305-6282 Vol. 17, Is.
Copyright 2016 by Academic Publishing House Researcher Published in the Russian Federation European Journal of Economic Studies Has been issued since 2012. ISSN: 2304-9669 E-ISSN: 2305-6282 Vol. 17, Is.
International Tourism Snapshot
 International visitors to Australia International visits continue to grow Australia hosted a record number of international visitors in the year ending International visitor expenditure in Australia September
The W20. The 20 wealthiest countries in the world. Publication Date: October 2015 NEW WORLD WEALTH
 The W20 The 20 wealthiest countries in the world Publication Date: October 2015 W20 wealth rankings The following tables ranks the top 20 countries in the world by total individual wealth held. Total individual
The Role of Gauteng in South Africa s Backpacking Economy
 The Role of Gauteng in South Africa s Backpacking Economy Jonathan Brandon Mograbi Dissertation submitted to the Faculty of Science of the University of the Witwatersrand, Johannesburg, in fulfilment of
Sources of Information
 Sources of Information Bureau of Immigration: Embarkment and Disembarkment information is collected from 24 Airports, 17 Seaports and 31 Land Checkposts. International Passenger Surveys: Provide Information
Maximizing Economic Benefits of Aviation in the Region
 Maximizing Economic Benefits of Aviation in the Region Boubacar Djibo Director, Air Transport Bureau, ICAO Georgetown, Guyana 21 November 2018 Preamble. THEREFORE, the undersigned governments having agreed
International Arrivals in Africa 2017 Jan-Jul Year to Date Forward looking 2017 Aug-Dec
 www. forwardkeys. com International Arrivals in 2017 Jan-Jul Year to Date Forward looking 2017 Aug-Dec Special Focus on East n Community (EAC) August 2017 Know tomorrow s travellers 2017YTD: the Americas,
An overview of Tallinn tourism trends
 An overview of Tallinn tourism trends August 2015 The data is collected from Statistics Estonia, Tallinn Airport and Port of Tallinn. In August 2015, 179,338 stayed overnight in Tallinn s accommodation
International Tourism Snapshot
 Australia on a high International visitors to Australia Australia welcomed 7.8m international visitors in the year ending June International visitor expenditure in Australia 2017, more than any previous
Tourism Snapshot A focus on the markets that the CTC and its partners are active in
 Tourism Snapshot A focus on the markets that the CTC and its partners are active in Newfoundland and Labrador www.canada.travel/corporate October 2011 Volume 7, Issue 10 Key highlights In October 2011,
Tourism Snapshot. A focus on the markets that the CTC and its partners are active in. July 2011 Volume 7, Issue 7.
 Tourism Snapshot Echo Valley Ranch and Spa, British Columbia A focus on the markets that the CTC and its partners are active in www.canada.travel/corporate July 2011 Volume 7, Issue 7 Key highlights In
% change vs. Dec ALL VISITS (000) 2,410 12% 7,550 5% 31,148 1% Spend ( million) 1,490 15% 4,370-1% 18,710 4%
 2,410 12% 7,550 5% 31,148 1% Spend ( million) 1,490 15% 4,370-1% 18,710 4%") HEADLINES FULL YEAR 2012 (PROVISIONAL) 1 Overall visits 31.148 million visits making 2012 the best year for inbound tourism since 2008 but not a record. 1% increase in visits on 2011 (30.798 visits) slightly
HEADLINES FULL YEAR 2012 (PROVISIONAL) 1 Overall visits 31.148 million visits making 2012 the best year for inbound tourism since 2008 but not a record. 1% increase in visits on 2011 (30.798 visits) slightly
Ethiopia: Tourism Market Insights 2017
 Ethiopia: Tourism Market Insights 2017 About Ethiopia Ethiopia is Africa s second-most populous country and according to the IMF has overtaken Kenya to become the largest economy in east Africa. Real GDP
FOREWORD KEY HIGHLIGHTS... 3
 TABLE OF CONTENTS FOREWORD... 1 1. KEY HIGHLIGHTS... 3 2. ARRIVAL STATISTICS... 4 2.1. TRACKING TOURISM DEMAND 4 2.2. TOURISM ARRIVALS BY YEAR... 4 2.3.2. TOP SIX OVERSEAS MARKETS FOR LESOTHO... 7 2.3.3.
TABLE OF CONTENTS. TOURIST EXPENDITURE 31 Average Spend per Person per Night ( ) 31 Tourist Expenditure per Annum ( ) 32
 31 Tourist Expenditure per Annum ( ) 32") FALKLAND ISLANDS International Tourism Statistics Report 2013 2 3 4 TABLE OF CONTENTS PAGE INTRODUCTION 6 KEY FACTS AND FIGURES 7 INBOUND TOURISM (OVERNIGHT VISITORS) 8 TOURIST ARRIVALS 8 Tourist Arrivals
FALKLAND ISLANDS International Tourism Statistics Report 2013 2 3 4 TABLE OF CONTENTS PAGE INTRODUCTION 6 KEY FACTS AND FIGURES 7 INBOUND TOURISM (OVERNIGHT VISITORS) 8 TOURIST ARRIVALS 8 Tourist Arrivals
TOURIST ARRIVAL: YEAR IN REVIEW
 215 TOURIST ARRIVAL: YEAR IN REVIEW Research and Statistics Department Ministry of Tourism, Economic Development, Investment & Energy Statistics Division Page 1 Foreword This report provides a quantitative
Tourism Snapshot. June 2015 Volume 11, Issue 6. A focus on the markets in which Destination Canada (DC) and its partners are active.
 and its partners are active.") Tourism Snapshot Tourism PEI / Paul Baglole A focus on the markets in which Destination Canada (DC) and its partners are active. www.destinationcanada.com June Volume 11, Issue 6 Key highlights Over the
Tourism Snapshot Tourism PEI / Paul Baglole A focus on the markets in which Destination Canada (DC) and its partners are active. www.destinationcanada.com June Volume 11, Issue 6 Key highlights Over the
Responsible Tourism and the Market Harold Goodwin 2001
 Responsible Tourism and the Market Harold Goodwin 2001 In the UK, Tourism Concern, Voluntary Service Overseas (VSO) and Tearfund have run a series of campaigns with ethical and responsible tourism i themes.
Putting Museums on the Tourist Itinerary: Museums and Tour Operators in Partnership making the most out of Tourism
 1 of 5 ICME papers 2002 Putting Museums on the Tourist Itinerary: Museums and Tour Operators in Partnership making the most out of Tourism By Clare Mateke Livingstone Museum, P O Box 60498, Livingstone,
REPORT ON PERFORMANCE OF UGANDA MICE TOURISM 2016
 REPORT ON PERFORMANCE OF UGANDA MICE TOURISM 2016 A study conducted by Uganda Tourism Board 2016 PERFORMANCE OF UGANDA MICE TOURISM 2016 Page 1 Table of Contents 1. INTRODUCTION... 3 2. BACKGROUND... 4
GODINA XI SARAJEVO, BROJ 2 TOURISM STATISTICS. Tourism in BIH, February 2017
 number of nights GODINA XI SARAJEVO, 06.04.2017. BROJ 2 TOURISM STATISTICS Tourism in BIH, February 2017 In February 2017 tourists realised 56,042 tourist arrivals in Bosnia and Hercegovina which represent
Regional Conference on Air Transport. 02/03 May 2013
 Regional Conference on Air Transport 02/03 May 2013 7 May 2013 1 PRESENTATION BY SARUPANAND KINNOO Ag DIRECTOR OF CIVIL AVIATION 7 May 2013 2 OUTLINE AIR TRANSPORT CHICAGO CONVENTION BILATERAL AIR SERVICES
Western Cape Tourism Trends
 Western Cape Tourism Trends (January to March) 2014 1. Overview of key tourism trends Global According to the UNWTO World Tourism Barometer, international arrivals continued on a similar growth trend in
Tourism Towards 2030 Preview of findings
 Tourism Towards 23 Preview of findings 54th meeting of the UNWTO Commission for the Americas 11 September 212 Quito, Ecuador Carlos Vogeler Regional Director for the Americas World Tourism Organization
By Laura Goodman PO Box 1197 Houghton, 2041 Tel: FOREIGN ARRIVALS IN SOUTH AFRICA
 By Laura Goodman PO Box 1197 Houghton, 2041 Tel: 011 326 3090 Email: shopping@marketdecisions.co.za FOREIGN ARRIVALS IN SOUTH AFRICA Introduction * The interest of South Africa as a destination to overseas
Tourism in Tallinn 2008
 Tourism in Tallinn 28 In 28, 2.38 million tourists stayed in Estonian accommodation establishments, 5% of whom stayed in Tallinn. Arrivals in Tallinn: 1,189, (+4%)1 Bednights in Tallinn: 2,97, (%) Total
Tourism as an Economic Pillar. Mary Vrolijk 25 September 2015
 Tourism as an Economic Pillar Mary Vrolijk 25 September 2015 Tourism Trends. Tourism: a key role player in economies. Spinoff effects: Job creation, New small and medium enterprises(sme s), Country competiveness,
Domestic, U.S. and Overseas Travel to Canada
 Domestic, U.S. and Overseas Travel to Canada Short-Term Markets Outlook Second Quarter 2007 / Executive Summary Prepared for: The Canadian Tourism Commission (CTC) By: February 2007 www.canada.travel Background
INTERNATIONAL TRAVEL AND TOURISM
 INTERNATIONAL TRAVEL AND TOURISM JANUARY TO SEPTEMBER 2017 1. INTRODUCTION This issue of the Economic and Social Indicators presents data on International Travel and Tourism for the first nine months of
Hotel Establishments Statistics April 2013
 Hotel Establishments Statistics 2011-2012 April 2013 16 Table of Contents Introduction... 3 Key Points... 4 Hotel Establishments... 5 Number of Guests... 7 Guest Nights... 9 Average Length of Stay... 10
TRIPS OF BULGARIAN RESIDENTS ABROAD AND ARRIVALS OF VISITORS FROM ABROAD TO BULGARIA IN NOVEMBER 2018
 TRIPS OF BULGARIAN RESIDENTS ABROAD AND ARRIVALS OF VISITORS FROM ABROAD TO BULGARIA IN NOVEMBER 2018 In November 2018, the number of the trips of Bulgarian residents abroad was 426.3 thousand (Annex,
Sweden. Tourism in the economy. Tourism governance and funding
 Sweden Tourism in the economy In 2014 Sweden s GDP was SEK 3 907 billion. Tourism s share of GDP is 2.8%, and has been growing steadily for the last ten years and is an important contributor to the economy
Airline financial performance and longterm developments in air travel markets
 Airline financial performance and longterm developments in air travel markets March 2018 Brian Pearce, Chief Economist, IATA www.iata.org/economics % of invested capital Investor returns falling but above
Tourism Snapshot. A focus on the markets in which the CTC and its partners are active. October 2012 Volume 8, Issue 10.
 Tourism Snapshot Niagara Helicopters Tour A focus on the markets in which the CTC and its partners are active www.canada.travel/corporate October 2012 Volume 8, Issue 10 Total arrivals from CTC s international