Child-centred Disaster Risk and Vulnerability Assessment. Mozambique
|
|
|
- William Mills
- 6 years ago
- Views:
Transcription
1 Child-centred Disaster Risk and Vulnerability Assessment Mozambique December 2013 Dr Hanna Schmuck Consultant
2 Table of Contents Acknowledgements... 1 Abbreviations and Acronyms... 2 Foreword Introduction Methodology Disaster Risk Index Vulnerability Index Overlaying high disaster risk with high child vulnerability Limitations of the Assessment Disaster Risk Indicators Floods Cyclones Droughts Child Vulnerability Indicators Multi-dimensional Deprivation Education Nutrition HIV/AIDS Summary of the Results of the Assessment Disaster Risk Child Vulnerability Overlaying Disaster Risk and Child Vulnerability Conclusions... 25
3 Annexes Annex 1: Floods: District Risk in alphabetical order Annex 2: Floods: District Risk Ranking Annex 3: Cyclones: District Risk in alphabetical order Annex 4: Cyclones: District Risk Ranking Annex 5: Droughts: District Risk in alphabetical order Annex 6: Droughts: District Risk Ranking Annex 7: Municipalities Risk Ranking Floods, Cyclones and Droughts Annex 8: Child Vulnerability Index in alphabetical order Annex 9: Child Vulnerability Index by rank Annex 10: Maps on Flood and Cyclone Risk in Cities Annex 11: Risk Maps based on hydrological and meteorological data Maps: Map 1: Flood Risk by Districts Map 2: Cyclone Risk by Districts Map 3: Drought Risk by Districts Map 4: Multi-dimensional Deprivation by Districts Map 5: EP 1 Drop-out rate by Districts Map 6: Growth faltering by Districts Map 7: HIV/AIDS prevalence of pregnant women by Districts Map 8: Multi-Hazard High Risk Map 9: Child Vulnerability by Districts Map 10: Overlay of child vulnerability with high disaster risk... 24
4 Acknowledgements A number of organisations and individuals have provided valuable input to this Child-centred Disaster Risk and Vulnerability Assessment. I am grateful to all of them. In particular, I would like to thank the following: Dr Antonio Queface and Tomásio Januário from the University of Eduardo Mondlane in Maputo have provided technical support to extract data from the database for the Disaster Risk Indices. Olanda Bata and Antonio Mavie from FEWS NET Mozambique have provided information on previous risk mapping and helped in data interpretation. Birgit Weyss, Consultant for UNICEF, has developed the child vulnerability index. Hanoch Barlevi, Disaster Risk Reduction and Emergency Specialist of UNICEF Mozambique, who commissioned this assessment, has provided excellent support and cooperation in all aspects. And it was him who has developed the maps a key output of this exercise. Other staffs of UNICEF Mozambique have also provided important input - too many to mention here. I myself, however, have the final responsibility for the results of the assessment and this report and hope that it serves in improved targeting of the most vulnerable children of this country. Dr Hanna Schmuck, Maputo in December 2013; 1
5 Abbreviations and Acronyms AIDS ART CENOE Acquired immune deficiency syndrome Anti-retroviral therapy National Emergency Operational Centre DHS Demographic and Health Survey, 1996/97, 2003 and 2011 EP1 1 st cycle of primary education (grades 1-5) EP2 2 nd cycle of primary education (grades 6-7) FEWS NET GDP HCT HIV IAF INE INGC Famine Early Warning Systems Network Gross domestic product Humanitarian Country Team (of the UN) Human immunodeficiency virus Inquérito aos Agregados Familiares (Household Survey), 1996/97 and 2002/03 National Statistics Institute National Institute for Disaster Management (Instituto National de Gestão das Calamidades ) IOF Inquérito ao Orçamento Familiar (Household Budget Survey), 2008/09 INSIDA MICS MISAU MMAS NGO PARP PMTCT UN UNICEF WFP National Survey on Prevalence, Behavioural Risks and Information about HIV and AIDS Multiple Indicator Cluster Survey Ministry of Health Ministry of Women and Social Action Non-governmental organization Poverty Reduction Action Plan Prevention of mother-to-child transmission United Nations United Nations Children s Fund World Food Programme 2
6 Foreword Disaster Risk Reduction and Climate Change Adaptation are cross-cutting themes in joint programmes of the Government of Mozambique and UNICEF. A Child-centred Risk and Vulnerability Assessment is a fundamental step to improve UNICEF s targeting of those children which live in particularly disaster prone regions. Apart from that, it aims to ensure the integration of disaster risk reduction in the development process rather than considering it as a separate component. In view of this, this exercise was carried out parallel and complementary to the Situation Analysis (SitAn). The results and recommendations of this assessment can also help in advocating and fund-raising for disaster risk reduction and climate change programming. This exercise is also based on UNICEF s refocus on equity. Thorough analysis among and within countries showed that reaching the most deprived children and families is not only more cost effective but also accelerates the progress towards achieving the Millennium Development Goals. The study Narrowing the Gap shows that child mortality, undernutrition and other deprivations are concentrated in those harder to reach groups and that targeting them would save many more lives and have much greater impact than implementing interventions in better off areas. 1 UNICEF at a global level is therefore increasing its efforts in trying to reach the most vulnerable and underserved children and families. This report first provides a short overview on disasters in Mozambique and child vulnerability. It then explains which methodology was used to establish the disaster risk and child vulnerability indices. The next chapter provides basic information on the occurrence and impact of floods, cyclones and droughts in Mozambique and shows the risk maps for these three disasters. The tables on the district level risk ranking, which form the basis of these maps, are in the Annex. Chapter 4 explains the indicators which were used to establish the child vulnerability index: multi-dimensional deprivations, education, nutrition and HIV/AIDS. Since the issue of children s vulnerability and deprivations is elaborated thoroughly in the above mentioned Situation Analysis carried out by UNICEF, no deeper analysis is provided here. Instead, the result of the ranking the maps are presented, while the background data can be found in the Annex. Chapter 5 summarises the main results of the exercise and the last chapter draws some conclusions in view of the future use of this assessment. 1 Narrowing the Gap to meet the Goals, UNICEF See: 3
7 1 Introduction Mozambique ranks third amongst the African countries most exposed to risks from weatherrelated hazards, such as floods, cyclones and droughts. Worldwide, Mozambique ranks on place 43 out of 173 countries. 2 According to recent studies commissioned by the country s National Institute for Disaster management (INGC), as much as 25% of the population is at risk from these disasters. 3 Statistics show that hazards have increased significantly over the past fifty years. Floods occur mostly in the rainy season from December to February along major river basins, low coastal plains, and areas with drainage problems. The risk is highest in the central and southern region. Cyclones affect the entire coast from October to April, but with highest wind impact along the central area. Droughts occur Number of Events Disaster Trends in Mozambique Flood Storm 0 Drought Decade Source: Extracted from EM-DAT ( primarily in the central and southern region of the country. Epidemics, especially water-borne diseases and malaria, are widely spread and outbreaks peak during and after disasters. Malaria, for example, remains the main cause of mortality in Mozambique - 30% of all deaths 4 registered in hospitals. The situation is becoming worse due to the impact of climate change. Children, which constitute 50.5% of Mozambique s population, are one of the most vulnerable groups. The impact of climate change will challenge their well-being in future even more. 5 Models on the impact of climate change predict a 25% increase in the magnitude of large flood peaks in the Limpopo and Save Rivers and a reduction in the flow of the Zambezi River of 15%. The temperature is projected to increase between 1 o and 2.8 o C by Critical sectors that will be at higher risk include agriculture, infrastructure, power, water and sanitation, health, and nutrition. 6 More than 80% of Mozambique s population depends economically on agriculture and most families cultivate no more than three hectares. Subsistence farming is most prevalent and makes families highly vulnerable to climatic conditions. The loss of harvest or income caused by cyclones, droughts or floods can easily push a household below the poverty line. According to Government figures, the national average of poverty in 2011 was 54.7 % 2 Alliance Development Works, United Nations University Institute for Environment and Human Security (2012): World Risk Report, Germany & USA; 3 INGC (2009): Synthesis report. Study on the impact of climate change on disaster risk in Mozambique. [van Logchem B and Brito R (ed.)]. INGC, Mozambique. 4 and 5 A good overview and summary of children s vulnerability concerning various sectors in Mozambique is: Save the Children (2011): Brief Lives. Child survival and development in Mozambique, Maputo. A comprehensive literature review and latest results of research on the impact of extreme weather events and climate change on children can be found in: Intergovernmental Panel on Climate Change (IPCC) (2012): Managing the Risks of Extreme Events and Disasters to Advance Climate Change Adaptation, Cambridge; 6 INGC (2009); see also World Bank, GFDRR, ISDR (2011) and Mozambique Dashboard at 4
8 compared to 54.1 % in So, despite strong economic growth of about 7% the rate of poverty is stagnant, if not rising because with a population growth of 2.4% the actual number of poor Mozambicans may be increasing. Crop failure increases food insecurity and can lead to undernutrition. According to the World Food Programme (WFP), around 25% of the population suffers from acute food insecurity at some point in the year and approximately 34% remains chronically food-insecure and lacks an adequate diet. 8 Chronic undernutrition in children under five remains alarmingly high at 42.6 % and thereby is one of the highest in Africa. 9 Nutritional deficiencies are exacerbating the effects of HIV/AIDS % of Mozambicans between 15 and 49 years old are infected. 10 The epidemic causes not only declines in productivity and the loss of skilled workers, but also increases the vulnerability of children by making them chronically sick or orphans. About 25% of children between 10 and 14 and 31% of children between 15 and 17 years old are orphaned or vulnerable because of AIDS. 11 Lack of or poor quality education continues to be a main factor contributing to vulnerability of children. Adult illiteracy is only slowly declining, but still 59.8% amongst women aged 15 to 49 and 32 % amongst men. Though the coverage of primary schools has improved considerably, the net attendance ratio for primary education is still only 77.1%. 12 Drop-out rates have increased. Though education is compulsory and free through the age of 12 years, matriculation fees are charged and are a burden for many families. Studies reveal that learning achievements are alarming. Standardised tests carried out in 2007 found that 22% of grade 5 pupils were functionally illiterate and 33% were not functionally numerate Methodology A number of UNICEF Country Offices have carried out child-centered multi-hazard risk assessments and used different methodologies and formats to present the results. In the case of Mozambique the assessment was carried out through a document review, extracting and evaluating data from databases and consultation meetings. Based on the outcomes of these activities, the disaster risk and vulnerability indices were established and the maps developed. The disaster risk index was aggregated from the three most prevalent disasters 7 International Monetary Fund (2011): Poverty Reduction Action Plan (PARP) However, a recent World Bank Study challenges the figures from the Government: The poverty rate in 2003 was 56 % and thereby higher than Government figures, whilst it reduced to 52% by 2009 ( World Bank, 2012: Poverty in Mozambique: New Evidence from Recent Household Surveys); 8 WFP (2010): Comprehensive Food Security and Vulnerability Assessment; see also SETSAN (2009): Relatório da Monitoria da Situação de Segurança Alimentar e Nutricional em Moçambique 9 INE, MISAU & MEASURE DHS (2013) Moçambique, Inquérito Demográfico e de Saúde 2011, Instituto Nacional de Estatística & Ministério da Saúde, Maputo, & MEASURE DHS/ICF International, Calverton, Maryland, USA; 10 Instituto Nacional de Saúde, Instituto Nacional de Estatistica e ICF Macro (2010): Inquérito nacional de prevalencia, riscos comportamentais e informacao sobre HIV e SIDA em Mocambique (INSIDA), Mocambique; 11 National Statistics Institute (2009): Final Report of the Multiple Indicator Cluster Survey 2008; 12 Instituto Nacional de Saúde, Instituto Nacional de Estatistica (2013): Inquérito Demogréphico e de Saùde 2011; Maputo; 13 Southern African Consortium for Monitoring Educational Quality (SACMEQ) in 2007; for a deeper analysis see UNICEF (2013): Situation Analysis (draft); 5
9 in Mozambique - floods, cyclones and droughts. The child vulnerability index was established from multi-dimensional deprivation, education, nutrition and HIV/AIDS. A key challenge for the exercise was to get reliable data covering all districts of the country. Meetings with key stakeholders and experts therefore played an important role to validate and confirm the information obtained from documents and statistics. The institutions involved Government offices, national and international organisations and academics. A first round of meetings was held when selecting the indicators and a second round of meetings was held to discuss the preliminary outcomes of the assessment. 2.1 Disaster Risk Index Presently, institutions and organisations dealing with disaster risk management in Mozambique are using maps showing high, medium and low risk for floods, cyclones and droughts which were developed by FEWS NET in cooperation with INGC and other government offices in 2005 (see Annex). These maps are not based on human impact, but scientific data. According to FEWS NET staff in Maputo, the following data was used to establish those maps: Floods: based on hydrological and meteorological information from INAM, INGC, DNA, National Oceanic and Atmospheric Administration (NOAA) satellites and different mathematical models from the year 1975 to 2000; Cyclones: based on information between 1930 and 2000 and a combination of historic records from publications and scientific data collected by National Institute of Meteorology; Droughts: based on data from 1981 to 2000 on the normalized difference vegetation index (NDVI); the NDVI is derived from data collected by National Oceanic and Atmospheric Administration (NOAA) satellites, and processed by the Global Inventory Monitoring and Modelling Studies group (GIMMS) at the National Aeronautical and Space Administration (NASA); UNICEF decided to develop risk indices and maps which a) Provide information for all districts in Mozambique. b) reflect human impact based on historical data as indicator for risk c) include information for the last 30 years up to date, The only database containing this information is the free and open-source Disaster Information System (DesInventar) database. It provides information on the place and year of a disaster and number of affected from the years 1979 to mid The database is hosted by the INGC with technical and financial assistance by UNDP/GRIP and UNISDR. Maputo s University of Eduardo Mondlane (UEM) is providing the local technical assistance. 14 DesInventar is a conceptual and methodological tool for the generation of National Disaster Inventories and the construction of databases of damage, losses and in general the effects of disasters. also known as Global Risk Information Platform (GRIPWEB): 6

10 The above mentioned existing maps and the experts who developed them were nevertheless an important reference to compare, validate and in some case correct data extracted from the database. This refers especially for information on droughts, as data appeared to be exaggerated, which will be explained more in detail below. About 15% of the 128 districts showed dubious results when doing the ranking and for these final decisions whether to classify them as low, medium or high risk were based on opinion of experts. EM-DAT, which is managed by the Centre for Research on the Epidemiology of Disasters (CRED) in Belgium, was used as complementary source of information, especially to compare the information on number of affected on the biggest disasters, such as the floods of 2000 and 2001 and the drought of Before using DesInventar, meetings were held with UEM staff that had collected and entered the data. The information available in the database was collected through extensive field work: A team of the UEM had travelled to most of the districts and collected around files from the period 1979 to June 2012 from district administrations and other local institutions. The information was scrutinised for duplication and viable information and reduced to so-called data cards which were then entered into the database. The disaster risk index was established for districts and municipalities (cities) separately, since the nature and impact of a disaster is quite different in a densely populated, urban are compared to a rural setting. Apart from that, the index was developed separately for floods, cyclones and droughts through the following procedure: 1. Extracting data on floods, cyclones and droughts from the open-source DesInventar database ( an example how a data card looks like: 15 The web-site of Prevention web ( has also disaster statistics based on EM-DAT. The EM-DAT contains information on disasters which fulfil at least one of the following criteria: a) Ten or more people reported killed, b) Hundred or more people reported affected, c) Declaration of a state of emergency or c) Call for international assistance. Information is collected from various sources such as UN agencies, non-governmental organizations, insurance companies, research institutes and press agencies. EM-DAT is internally updated on a daily basis. However, the publicly accessible information is updated every three months, after all the data has been validated and cross-checked with different sources. 7
11 2. Organising the data per district and municipality, cross-checking questionable and doubtful information with original data cards in the database, cross-checking exceptional events with the EMDAT-database and making amendments. In summary, the following figures are the basis of the risk indices and maps: 16 For Districts: Number of events Floods 889 8,751,282 Cyclones 124 1,698,553 Droughts 610 5,399,429 Number of Affected Total 1,623 15,849,264 For Municipalities: Number of events Number of Affected Floods ,435 Cyclones ,077 Droughts ,393 Total 101 1,354, Calculation of impact: total number of affected people over the last 33 years; 4. Calculation of exposure: number of affected per district inhabitants per district (as per 2007 census) x 33 (as from 1979 to 2013) 5. Establishment of ranking from low over medium to high risk based; decision on transition from low to medium and from medium to high risk based on big discrepancies in number of affected and exposure and experts opinion; 6. Establishment of final risk indices for floods, cyclones and droughts with four categories (see Annex): 0 = no information (grey) 1 = low risk (green) 2= medium risk (yellow) 3 = high risk (red) 7. Development of risk maps (see chapter 3); 16 The numbers of reported casualties was not considered for the indices, as in Mozambique they are low compared to these kind of disasters in other countries (see chapter 3). They would also not change the result of the risk index. For floods, the number of reported casualties at district level in the last 33 years resulted in 1.568, for cyclones in 205 and for droughts in 342 after making the mentioned amendments. In the municipalities, 57 casualties were ascribed to floods, 101 to cyclones and 0 to drought. 8
12 2.2 Vulnerability Index A child vulnerability index at district level does not yet exist for Mozambique. In 2010, UNICEF Mozambique has carried out a comprehensive review on the situation of children in Mozambique. 17 In the second half of 2013, parallel to the child-centred disaster risk and vulnerability assessment, UNICEF updated this report through its Situation Analysis of Children in Mozambique by focussing on recent trends and developments, taking into account the latest data on a wide range of child-related indicators. 18 However, both analyses have been carried out at provincial level. District level data and analysis are still very limited. Since this exercise was to be carried out at district level, the choice for indicators was very restricted and guided by the following questions: a) For which indicators is data on district level available and to a reasonable degree reliable? b) Which indicators are appropriate and meaningful to describe children s vulnerability within the social and cultural context of Mozambique? c) Which kind indicators encompass several aspects of children s vulnerability? Four indicators were used: a) Multi-dimensional deprivation, b) education, c) nutrition and d) HIV/AIDS. All indicators were given equal weight, since the result by giving different weights was similar. The source of the data for (a) is a study carried out under the Ministry of Planning and Development. 19 The data of (b) was provided by the Ministry of Education and the data for (c) and (d) were provided by the Ministry of Health. In detail, the child vulnerability index was calculated based on the performance of a particular district in relation to the national average: Districts with indicators worse than 10,1 % than the national average: value 2 = high vulnerability (red); Districts with indicators within the range of 10 % above or below the national average: value 1 = average vulnerability (yellow); Districts with indicators 10,1 % better than the national average: value 0 = low vulnerability (green); The value of the composite index was calculated by summing up the vulnerability values of the four indicators (high = 2, medium = 1, low = 0); Based on the result, a child vulnerability index was established ranging from 0 (lowest) to 8 (highest), as shown in the Annex. To develop the child vulnerability map, the 8 values were divided into three categories: 17 UNICEF (2010): Child poverty and disparities in Mozambique 2010, Maputo 18 These were the 2011 Demographic and Health Survey (DHS), recent administrative data, policy and planning documents, and studies. The report also analyses the trends into a longer perspective by drawing on data from successive rounds of national surveys, including the DHS in 1997, 2003 and 2011, the Multiple Indicator Cluster Survey (MICS) in 2008, and the household budget surveys (IAF and IOF) in 2002/03 and 2008/ Government of Mozambique, Ministry of Planning and Development, National Directorate of Studies and Policy Analysis (2013): Small Area Estimates of District Level Welfare: A Multi-Dimensional Approach, Discussion papers No. 70, July 2013, by Channing Arndt, M. Azhar Hussain, Vincenzo Salvucci, Finn Tarp and Lars P. Østerdal; 9
13 0-2 = low vulnerability 3-4 = medium vulnerability 5-8 = high vulnerability 2.3 Overlaying high disaster risk with high child vulnerability The multi-hazard risk map was overlaid with the child vulnerability map to visualise in which districts children are both highly prone to disasters as well as vulnerable in the sectors of nutrition, education, HIV/AIDS and poverty. 2.4 Limitations of the Assessment The biggest challenge of the assessment was availability of data which covers all districts and the reliability of the data eventually available. Since the data was collected and entered in the respective report by human beings it contains errors. In some cases it was possibly also manipulated for political or economic means. Main limitations of the data used for the child vulnerability index: Data on child vulnerability at district level is hardly available and therefore only four indicators could be used to establish the child vulnerability index. The data on nutrition is facility based. It covers only those children who reached the health centre. Apart from that, it obviously contains measuring inaccuracies, as the data is mostly less than five %. This is probably rather on the conservative side, because Mozambique s average for chronic undernutrition for children under five years old is 42.6 % (DHS 2011) and for acute undernutrition 6%. The data on HIV/AIDS only refers to the sub-set of the population - women who are pregnant and accessed antenatal care. Apart from that, during data collection by health personnel at the facilities there is the likelihood of double counting of women already HIV positive at entry with those tested HIV positive during ante-natal care. This may result in an overestimation of the positivity rate for HIV. However, it can be assumed that mistakes in data entry are consistent throughout the districts. Whilst the data does not provide fully reliable information it still allows to compare between districts, which was the purpose of the assessment. Main limitations of the data used for the disaster risk indices: According to managers of the database from the University of Eduardo Mondlane, a considerable number of reports on disasters can assumed to be lost or destroyed through climatic conditions, pests, civil war etc. Hence, the data used for the indices only shows trends, but does not give an accurate picture. The definition of drought is unclear. The term often seems to have been used as synonym for food insecurity, which may be caused by other factors than climatic conditions (see chapter 3). 10
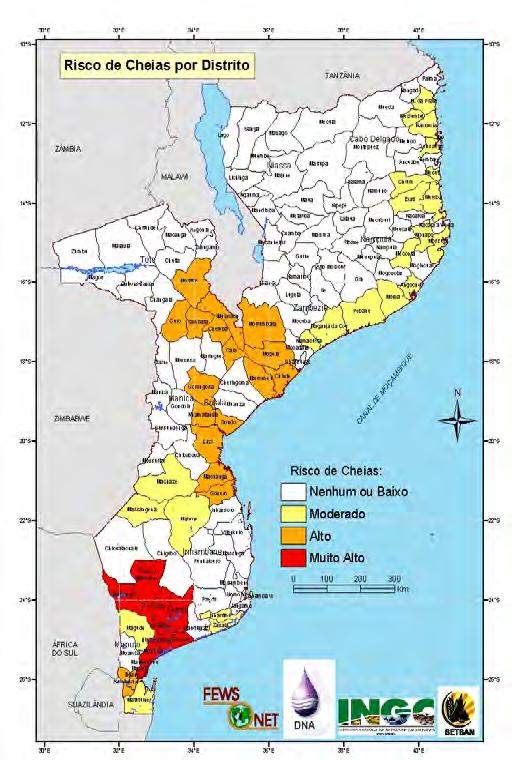
14 Since July 2012 the DesInventar database was not updated due to lack of funding. Numbers of affected by the massive floods of 2013 were obtained from the INGC and hence considered for the flood risk index. But information on other disasters with less impact which may have happened since mid 2012 in other parts of the country was not obtained and hence not considered. Nevertheless, the result of the ranking overlaps in most cases with the risk maps developed by FEWS NET and INGC and this reveals that the data is reasonably reliable and allows to compare between districts and to identify trends. To reconfirm the relative accurateness of the information obtained from the DesInventar database, opinions of experts were taken to validate the result. 3 Disaster Risk Indicators 3.1. Floods Historical analyses show that many of the approximately 100 rivers of Mozambique are exceeding the danger level every two to three years. 20 However, due to an increase of population density along the rivers and the impact of climate change, they are affecting more and more people. Heavy rains are responsible for the floods both in Mozambique as well as upstream in neighbouring countries. They can also be aggravated by water discharge from dams within Mozambique, such as the Cahora Bassa, or in neighbouring countries, such as the Kariba in Zambia. The most likely time for floods to occur is from November to March in the southern region of the country and from January to April in the central and northern regions. There is also a high probability of flooding following tropical storms or cyclones. They can aggravate already on-going river floods, as they bring extremely strong and heavy rainfall within a short period and their occurrence coincides with the rainy (flood) season from October to April. According to the result of the risk assessment, people living in districts along the Limpopo, Incomáti and Save (in the south) and the Búzi, Pungue, Zambezi and Licungo (in the centre) were most affected by floods in the last three decades (see map on the next page). With regard to urban centres, people in parts of the cities of Beira, Maputo and Xai Xai were most exposed to flooding (see map in the Annex). Floods destroy homesteads, agricultural land, household items, infrastructure and crops and render people temporarily homeless. Daily productive activities in general are severely disrupted. Epidemics, such as cholera and malaria, are strongly linked to floods and lead to fatalities, whilst drowning is rather rare. The most recent floods were in the first quarter of 2013, the worst in the past 13 years. The toll are 478,892 affected, of which 172,479 were displaced. There were 117 casualties, out 20 INGC (2009): Synthesis report. Study on the impact of climate change on disaster risk in Mozambique. [van Logchem B and Brito R (ed.)], page 3; 11
15 of which 45 in Gaza Province alone. However, worth while noting is that 39 of the 117 reported deaths were caused by lightening. 21 Children as one of the most vulnerable groups were affected in several ways: They were separated from their families, suffered psychotraumatic shocks, had less to eat, suffered from diseases such as diarrhoea and all kinds of infections, and in general had little space to play and meet as they stayed in cramped conditions in camps. 20% of students in Gaza could not attend school for a number of weeks. 21 Républica de Moçambique, Ministério da Planificação e Desenvolvimento: Diagnóstico Preliminar e Acções de Reconstrução Pós-Calamidades 2013, Maputo, Março de 2013; 12

16 Map 1: Flood Risk by Districts 13
17 3.2 Cyclones Tropical storms or cyclones occur along the coastal regions of Mozambique and are caused by tropical depressions in the Indian Ocean. 22 They are the strongest and the most destructive meteorological events worldwide due to strong winds and torrential rains. The biggest impact in Mozambique is the destruction of crops and fruit trees (such as cashew and coconut), the destruction of homesteads and infrastructure. They also lead to injuries, but same as for floods only occasionally cause casualties, mainly from falling trees or collapsing buildings. As mentioned in the previous section, cyclones bring intense rainfall which can cause flooding. Tropical storms or cyclones occur along the coast in the central and northern regions of the country between October and April. Of the 56 cyclones that passed through the Mozambique Channel between 1980 and 2007, 15 struck the Mozambican coast. Their frequency and intensity has increased in the past years: Whilst between 1980 and 1993 only two cyclones were classified in categories 3 to 5, seven with the same categories were observed between and The result of the risk mapping shows that people living in the coastal districts in Nampula and Inhambane Province were most affected by cyclones in the past thirty years (see map on the next page). With regard to municipalities, people living in the cities of Nampula and Nacala were most affected (see map in the Annex). 22 A tropical storm is called a cyclone when the wind speed exceeds 118 km/h (see 23 INGC (2009): Synthesis report. Study on the impact of climate change on disaster risk in Mozambique. [van Logchem B and Brito R (ed.)]; 14

18 Map 2: Cyclone Risk by Districts 15
19 3.3 Droughts Different from a flood or cyclone, a drought is a slow onset hazard which can last one or two years or for a much longer period. Since over 95% of the food crops in Mozambique are produced under rain-fed conditions and 80% of the population live from agriculture, droughts can lead to severe problems. 24 They do not only affect agricultural production, but also sanitation and hygiene of people and animal husbandry, as water holes dry up. During and after droughts communities not only experience food shortages and hence undernutrition, but also restricted access to water and outbreak of communicable diseases. In the longerterm, droughts lead to the increase of prices of food and agricultural products. So-called secas (droughts) are considered a chronic problem in some regions of southern and central part Mozambique, which is confirmed by the result of the risk mapping: People in the districts of the Provinces of Gaza and Tete were most affected, followed by people living in some inland districts of Inhambane (see map on next page). However, entries classified under droughts in the DesInventar database show that the issue of drought in Mozambique is complex and has to be looked at critical: Local authorities reported a drought for some district in the Provinces of Gaza and Maputo every year since Also the number of deaths due to drought tends to be exaggerated. A key example 25 are deaths due to lack of rain in Gaza Province in Drought is often given as the reason for low agricultural productivity or a failed harvest. However, the term drought is context-specific and hence can be subjective. Climatic conditions in some parts of Mozambique are definitely not comparable to those in the Sahel or other extremely arid regions of the world. Droughts in Mozambique, according to the NAPA (2007), are inter-linked with desertification. They result from low levels of precipitation or changes in their spatial and temporal distribution (hence natural, climate driven causes) combined with anthropogenic (or human) activities, such as the overuse of agricultural land, over-grazing, bush fires, fire wood gathering, charcoal production and industrial forestry. 26 The study of INGC (2009) 27 confirms that droughts in Mozambique are a result of environmental degradation and inadequate use of land: Shifting cultivation through slash and burn is the traditional farming method. Bush land or trees were only cut to the extent of the need by an extended family for their own food supply through cultivation. The timber was a by-product used for cooking and, in some areas, construction of shelters for people and animals. The increase of population reduced the time the vegetation had to re-grow on fallow land, resulting in reductions in soil fertility and increase of erosion of fertile soil and FAO (2011): Nutrition Country Profile, Republic of Mozambique; 25 This kind of information is often not cross-checked or looked into and therefore according to other databases, such as EM-DAT, drought has caused more casualties than floods or cyclones in the past. 26 Ministry for the Coordination of Environmental Affairs (MICOA) (2007): National Adaptation Programme for Action (NAPA); 27 INGC (2009): Study on the impact of climate change on disaster risk in Mozambique, Synthesis report; 16

20 Map 3: Drought Risk by Districts 17

21 4 Child Vulnerability Indicators 4.1 Multi-dimensional Deprivation District level poverty rates are not available for Mozambique, but a study under the Ministry of Planning and Development has ranked all districts based on a multi-dimensional deprivation index. 28 This ranking has been used for the composite child vulnerability index. The mentioned study applied an approach based on so-called first order dominance (FOD) to small area estimation. Districts were ranked by status according to five welfare indicators using census data from The above mentioned study based the ranking on the following five binary welfare indicators: 1. Safe water: piped water inside or outside the house/yard, spring water, hand pumped well water, or mineral/bottled water; Map 4: Multi-dimensional Deprivation by Districts 2. Sanitation: having access to flush toilet, toilet with septic tank, or an improved latrine; 3. Education: households where at least one household member has some education; 4. Electricity. households with electricity for lighting; 5. Radio: households with a functioning radio; As shown on the map, the highest number of districts are in Nampula (fourteen), followed by Zambézia (eleven), Niassa (nine), Cabo Delgado (eight), Tete (seven), and Sofala (five. 28 Government of Mozambique, Ministry of Planning and Development, National Directorate of Studies and Policy Analysis (2013): Small Area Estimates of District Level Welfare: A Multi-Dimensional Approach, Discussion papers No. 70, July 2013, by Channing Arndt, M. Azhar Hussain, Vincenzo Salvucci, Finn Tarp and Lars P. Østerdal; 18
 and the upper primary, EP 2, comprises two years (Grades 6 and 7). The official age of entry into school is 6 years.")

22 4.2 Education Education is compulsory and free through the age of Map 5: EP 1 Drop-out rate by Districts 12 years. The lower primary school, EP 1, consists of five years of schooling (Grades 1 to 5) and the upper primary, EP 2, comprises two years (Grades 6 and 7). The official age of entry into school is 6 years. One main factor of drop-outs from EP 1 is late enrolment and repetition of students, because when they reach a certain age parents or care-takers tend to send them to work. Data on drop-out rates from EP 1 are available from district level and were taken as one indicator for the vulnerability index. The data was provided by the Ministry of Education and is from the year It can be considered as reliable, as it is a standard procedure for all schools to collect it. The data (see Annex) is the % of children who discontinued attending school in grade 5 from the total number of children enrolled in the beginning of the year. 29 As can be seen from the map, Niassa Province has the highest number of districts with EP 1 drop-out rates (13 districts), followed by Sofala (nine districts), Tete (seven districts) and Cabo Delgado (five districts). 4.3 Nutrition The only data providing information from district level on child nutrition is collected by health facilities during routine visits by parents with children under five (0 to 59 months). The data for 2012 (all months) was provided by the Ministry of Health and gives information on growth faltering, which is defined as the percentage of children who do did not gain weight, or who lost weight, over a period of three visits (which would normally be a time span of at least three months). Map 6: Growth faltering by Districts The map shows that Tete and Nampula have the highest number of districts (eight) with growth faltering, followed by Sofala (six), Zambézia, Niassa and Manica (five). 29 According to concerned government offices, the drop-out rate is the difference between enrolled students in the beginning of the school year and the number of students who reach the end of the school year. The difference is then divided by the number of enrolled students in the beginning of the school year and multiplied by the factor
23 4.4 HIV/AIDS District level data on HIV prevalence rates does not exist yet for Mozambique. In 2009, the first national Map 7: HIV/AIDS prevalence of pregnant women by Districts HIV/AIDS survey was undertaken and provides information on, amongst others, HIV prevalence at provincial level. 30 The only data presently available from district level that can be used as a proxy to give an indication on HIV/AIDS is routine data from health facilities on women attending antenatal care (PMTCT). The information used for the indicator is from the year 2012 for all months and was provided by the Ministry of Health. As can be seen on the map, Zambézia Province has the highest number of districts (12) with high HIV prevalence of pregnant women in antenatal care, followed by Gaza (ten districts), Maputo (nine districts) and Sofala (four districts). 30 Instituto Nacional de Saude, Instituto Nacional de Estatistica e ICF Macro (2010): Inquerito nacional de prevalencia, riscos comportamentais e informacao sobre HIV e SIDA em Mocambique (INSIDA), Mocambique; INS & MEASURE DHS (2010) Mozambique: National Survey on Prevalence, Behavioral Risks and Information about HIV and AIDS (2009 INSIDA), Key findings, Instituto Nacional de Saúde, Maputo, & MEASURE DHS/ICF Macro, Calverton, Maryland, USA 20
24 5 Summary of the Results of the Assessment The maps developed on the basis of the indices were presented in the previous chapter whilst the results of the indices themselves are in the Annex of this document. This chapter summarises the results of the indices and mapping. 5.1 Disaster Risk Floods: The highest number of high flood prone districts is in Gaza Province with seven districts, followed by Sofala with five, Zambézia with four and Tete with three districts. Beira, Maputo and Xai Xai are the most affected cities. Province Gaza Sofala Zambézia Tete Maputo Inhambane Manica Cabo Delgado District Bilene Macia, Chibuto, Chókwè, Guijá, Mabalane, Massingir, Xai-Xai Buzi, Caia, Chemba, Machanga, Marromeu Chinde, Maganja da Costa, Mopeia, Morrumbala Magoe, Mutarara, Zumbu Manhiça Govuro Tambara Macomia Cyclones: Most of the high cyclone risk districts are Nampula Province (seven), followed by Inhambane Province with three districts. With regard to urban areas, people living in Nacala, Ilha de Moçambique and Nampula are most affected. Province Nampula Inhambane Sofala District Angoche, Memba, Mogincual, Monapo, Mossuril, Nacala-a-Velha, Meconta Govuro, Vilankulo, Inhassoro Machanga Droughts: Gaza Province has the highest number of drought prone districts (seven), followed by Tete (five) and Inhambane (four). With regard to municipalities, inhabitants of Tete are the most affected by drought, though it is difficult to understand which impact drought can have for an urban population since they do not live from farming. 31 Province Gaza Tete Inhambane Sofala District Chibuto, Chicualacuala, Chigubo, Guijá, Mabalane, Massangena, Massingir Cahora-Bassa, Changara, Chiúta, Magoe, Mutarara Funhalouro, Govuro, Mabote, Panda Chibabava 31 For this reason, a risk map for droughts for cities was not developed. 21
, Machanga (Sofala), Mutarara and Magoe (both in")
25 Multi-hazard high risk: Inhabitants of the district Govuro in Inhambane Province are affected by all three disasters. Affected by floods as well as by droughts are people in Chibuto, Guijá, Mabalane, Massingir (all in Gaza Province), Machanga (Sofala), Mutarara and Magoe (both in Tete Province). Map 8: Multi-Hazard High Risk 22
, Zambézia (six districts), Cabo Delgado (five districts), Nampula and Niassa (each four districts), Manica (three), Gaza (two districts) and Inhambane (one district).")
26 5.2 Child Vulnerability According to the results of the composite vulnerability index as shown in the map below, children in Sofala Province are most vulnerable (eight districts), followed by Tete (seven districts), Zambézia (six districts), Cabo Delgado (five districts), Nampula and Niassa (each four districts), Manica (three), Gaza (two districts) and Inhambane (one district). Map 9: Child Vulnerability by Districts 23

27 5.3 Overlaying Disaster Risk and Child Vulnerability The concept of overlaying the map of child vulnerability with the map of multi-hazard risk allows to capture in which districts children have a challenging situation concerning their well-being and at the same time are prone to one, two or even three types of natural hazards. The table and the map below show the result. Province Sofala Tete Zambézia Gaza Inhambane District Caia, Chemba, Chibabava, Machanga Changara, Chiúta, Mutarara, Magoe Maganja da Costa, Mopeia, Morrumbala Chicualacuala, Chigubo Panda Map 10: Overlay of child vulnerability with high disaster risk 24
28 6 Conclusions This assessment is a first step towards improved targeting of children which live under a double burden: High vulnerability in their well-being and disaster risk. To validate and fully understand the situation of children in Mozambique additional district level data is required. To properly reduce vulnerability of children, there is a need for a more in depth analysis in the identified high risk districts. Such an assessment should take in consideration cultural, social-economic, political and environmental aspects that contribute to vulnerability. Also, the DesInventar database should be updated to ensure that the recent impact of disasters is properly reflected. Combined with statistical data, a field assessment on child deprivation and the impact of disasters on children would be useful which takes also the view of the inhabitants of the concerned districts, especially parents or care-takers of children and the children themselves. Apart from that, a mapping of capacities needs to be undertaken: The availability and quality of facilities which support and foster children s well-being (health centres, schools, etc.) as well as disaster risk management structures (local disaster risk management committees, trained community volunteers etc.). Local, indigenous coping capacities would complement the analysis. To improve geographic and thematic targeting, a mapping of past and on-going interventions from organisations and institutions on disaster risk management and child well-being would be necessary. Based on its outcome, UNICEF and other humanitarian organisations can decide whether they need to intervene on a short-, medium or longer term and through which kind of activities to improve the situation of children in Mozambique. Disaster Risk Reduction should not be seen as a separate component, but integrated in all development sectors. 25
29 Annexes Annex 1: Floods: District Risk in alphabetical order Risk Ranking Floods Province District Risk Cabo Delgado Ancuabe 1 Cabo Delgado Balama 1 Cabo Delgado Chiúre 1 Cabo Delgado Macomia 3 Cabo Delgado Mecúfi 1 Cabo Delgado Meluco 2 Cabo Delgado Mocimboa da Praia 1 Cabo Delgado Montepuez 2 Cabo Delgado Mueda 1 Cabo Delgado Muidumbe 2 Cabo Delgado Namuno 1 Cabo Delgado Nangade 1 Cabo Delgado Palma 2 Cabo Delgado Pemba 1 Cabo Delgado Quissango 1 Gaza Bilene Macia 3 Gaza Chibuto 3 Gaza Chicualacuala 2 Gaza Chigubo 1 Gaza Chókwè 3 Gaza Guijá 3 Gaza Mabalane 3 Gaza Mandlakazi 2 Gaza Massangena 2 Gaza Massingir 3 Gaza Xai-Xai 3 Inhambane Funhalouro 1 Inhambane Govuro 3 Inhambane Homoine 1 Inhambane Inharrime 1 Inhambane Inhassoro 2 Inhambane Jangamo 0 Inhambane Mabote 2 Inhambane Massinga 1 Inhambane Morrumbene 1 Inhambane Panda 1 Inhambane Vilankulo 2 Inhambane Zavala 1 Manica Báruè 1 Manica Gondola 1 Manica Guro 1 Manica Machaze 1 Manica Macossa 0 Manica Manica 1 Manica Mossurize 1 Manica Sussundenga 1 Manica Tambara 3 Maputo Boane 2 Maputo Magude 2 Maputo Manhiça 3 Maputo Cidade de Maputo 1 Maputo Marracuene 2 Maputo Matutuíne 2 Maputo Moamba 1 Maputo Namaacha 2 Nampula Angoche 1 Nampula Nacarôa 1 Nampula Lalaua 1 Nampula Malema 1 Nampula Meconta 1 Nampula Monapo 1 Nampula Mogincual 1 Nampula Mossuril 1 26 Province District Risk Nampula Muecate 1 Nampula Murrupula 1 Nampula Nacala-a-Velha 1 Nampula Eráti 1 Nampula Nampula (Rapale) 0 Nampula Ribáuè 0 Niassa Cuamba 1 Niassa Lago 1 Niassa Lichinga 1 Niassa Majune 1 Niassa Mandimba 1 Niassa Marrupa 1 Niassa Maúa 1 Niassa Mavago 0 Niassa Mecanhelas 1 Niassa Mecula 1 Niassa Metarica 1 Niassa Muembe 1 Niassa N'gauma 1 Niassa Nipepe 1 Niassa Sanga 1 Sofala Buzi 3 Sofala Caia 3 Sofala Chemba 3 Sofala Cheringoma 2 Sofala Chibabava 2 Sofala Dondo 2 Sofala Gorongosa 0 Sofala Machanga 3 Sofala Maringue 2 Sofala Marromeu 3 Sofala Muanza 1 Sofala Nhamatanda 2 Tete Angónia 1 Tete Cahora-Bassa 2 Tete Changara 2 Tete Chifunde 1 Tete Chiúta 2 Tete Macanga 0 Tete Magoe 3 Tete Maravia 1 Tete Moatize 2 Tete Mutarara 3 Tete Tsangano 0 Tete Zumbu 3 Zambezia Alto Molocue 1 Zambezia Chinde 3 Zambezia Gilé 1 Zambezia Gurué 1 Zambezia Ile 1 Zambezia Inhassunge 1 Zambezia Lugela 1 Zambezia Maganja da Costa 3 Zambezia Milange 1 Zambezia Mocuba 1 Zambezia Mopeia 3 Zambezia Morrumbala 3 Zambezia Namacurra 2 Zambezia Namarroi 1 Zambezia Nicoadala 2 Zambezia Pebane 1
30 Annex 2: Floods: District Risk Ranking Province District Risk Inhambane Jangamo 0 Manica Macossa 0 Nampula Mecubúri 0 Nampula Nampula (Rapale) 0 Nampula Ribáuè 0 Niassa Mavago 0 Sofala Gorongosa 0 Tete Macanga 0 Tete Tsangano 0 Cabo Delgado Ancuabe 1 Cabo Delgado Balama 1 Cabo Delgado Chiúre 1 Cabo Delgado Mecúfi 1 Cabo Delgado Mocimboa da Praia 1 Cabo Delgado Mueda 1 Cabo Delgado Namuno 1 Cabo Delgado Nangade 1 Cabo Delgado Pemba 1 Cabo Delgado Quissango 1 Gaza Chigubo 1 Inhambane Funhalouro 1 Inhambane Homoine 1 Inhambane Inharrime 1 Inhambane Massinga 1 Inhambane Morrumbene 1 Inhambane Panda 1 Inhambane Zavala 1 Manica Báruè 1 Manica Gondola 1 Manica Guro 1 Manica Machaze 1 Manica Manica 1 Manica Mossurize 1 Manica Sussundenga 1 Maputo Cidade de Maputo 1 Maputo Moamba 1 Nampula Angoche 1 Nampula Nacarôa 1 Nampula Lalaua 1 Nampula Malema 1 Nampula Meconta 1 Nampula Memba 1 Nampula Mogovolas 1 Nampula Moma 1 Nampula Monapo 1 Nampula Mogincual 1 Nampula Mossuril 1 Nampula Muecate 1 Nampula Murrupula 1 Nampula Nacala-a-Velha 1 Nampula Eráti 1 Niassa Cuamba 1 Niassa Lago 1 Niassa Lichinga 1 Niassa Majune 1 Niassa Mandimba 1 Niassa Marrupa 1 Niassa Maúa 1 Niassa Mecanhelas 1 Niassa Mecula 1 Niassa Metarica 1 Niassa Muembe 1 Niassa N'gauma 1 Niassa Nipepe 1 Niassa Sanga 1 27 Province District Risk Tete Angónia 1 Tete Chifunde 1 Tete Maravia 1 Zambezia Alto Molocue 1 Zambezia Gilé 1 Zambezia Gurué 1 Zambezia Ile 1 Zambezia Inhassunge 1 Zambezia Lugela 1 Zambezia Milange 1 Zambezia Mocuba 1 Zambezia Namarroi 1 Zambezia Pebane 1 Cabo Delgado Meluco 2 Cabo Delgado Montepuez 2 Cabo Delgado Muidumbe 2 Cabo Delgado Palma 2 Gaza Chicualacuala 2 Gaza Mandlakazi 2 Gaza Massangena 2 Inhambane Inhassoro 2 Inhambane Mabote 2 Inhambane Vilankulo 2 Maputo Boane 2 Maputo Magude 2 Maputo Marracuene 2 Maputo Matutuíne 2 Maputo Namaacha 2 Sofala Cheringoma 2 Sofala Chibabava 2 Sofala Dondo 2 Sofala Maringue 2 Sofala Nhamatanda 2 Tete Cahora-Bassa 2 Tete Changara 2 Tete Chiúta 2 Tete Moatize 2 Zambezia Namacurra 2 Zambezia Nicoadala 2 Cabo Delgado Macomia 3 Gaza Bilene Macia 3 Gaza Chibuto 3 Gaza Chókwè 3 Gaza Guijá 3 Gaza Mabalane 3 Gaza Massingir 3 Gaza Xai-Xai 3 Inhambane Govuro 3 Manica Tambara 3 Maputo Manhiça 3 Sofala Buzi 3 Sofala Caia 3 Sofala Chemba 3 Sofala Machanga 3 Sofala Marromeu 3 Tete Magoe 3 Tete Mutarara 3 Tete Zumbu 3 Zambezia Chinde 3 Zambezia Maganja da Costa 3 Zambezia Mopeia 3 Zambezia Morrumbala 3
31 Annex 3: Cyclones: District Risk in alphabetical order Province District Risk Cabo Delgado Ancuabe 0 Cabo Delgado Balama 0 Cabo Delgado Chiúre 0 Cabo Delgado Macomia 0 Cabo Delgado Mecúfi 0 Cabo Delgado Meluco 0 Cabo Delgado Mocimboa da Praia 0 Cabo Delgado Montepuez 0 Cabo Delgado Mueda 0 Cabo Delgado Muidumbe 1 Cabo Delgado Namuno 0 Cabo Delgado Nangade 0 Cabo Delgado Palma 0 Cabo Delgado Pemba 0 Cabo Delgado Quissango 0 Gaza Bilene Macia 0 Gaza Chibuto 1 Gaza Chicualacuala 0 Gaza Chigubo 0 Gaza Chókwè 0 Gaza Guijá 0 Gaza Mabalane 0 Gaza Mandlakazi 0 Gaza Massangena 0 Gaza Massingir 0 Gaza Xai-Xai 1 Inhambane Funhalouro 0 Inhambane Govuro 3 Inhambane Homoine 0 Inhambane Inharrime 1 Inhambane Inhassoro 3 Inhambane Jangamo 0 Inhambane Mabote 1 Inhambane Massinga 1 Inhambane Morrumbene 0 Inhambane Panda 0 Inhambane Vilankulo 3 Inhambane Zavala 0 Manica Báruè 0 Manica Gondola 0 Manica Guro 0 Manica Machaze 0 Manica Macossa 0 Manica Manica 0 Manica Mossurize 0 Manica Sussundenga 0 Manica Tambara 0 Maputo Boane 0 Maputo Magude 1 Maputo Manhiça 1 Maputo Cidade de Maputo 1 Maputo Marracuene 1 Maputo Matutuíne 0 Maputo Moamba 0 Maputo Namaacha 1 Nampula Angoche 3 Nampula Nacarôa 2 Nampula Lalaua 0 Nampula Malema 1 Nampula Meconta 3 Nampula Mecubúri 1 Nampula Memba 3 Nampula Mogovolas 2 Nampula Moma 2 Nampula Monapo 3 Nampula Mogincual 3 Nampula Mossuril 3 28 Province District Risk Nampula Muecate 2 Nampula Murrupula 1 Nampula Nacala-a-Velha 3 Nampula Eráti 0 Nampula Nampula (Rapale) 1 Nampula Ribáuè 0 Niassa Cuamba 0 Niassa Lago 0 Niassa Lichinga 0 Niassa Majune 0 Niassa Mandimba 0 Niassa Marrupa 0 Niassa Maúa 0 Niassa Mavago 0 Niassa Mecanhelas 0 Niassa Mecula 0 Niassa Metarica 0 Niassa Muembe 0 Niassa N'gauma 0 Niassa Nipepe 0 Niassa Sanga 0 Sofala Buzi 2 Sofala Caia 0 Sofala Chemba 0 Sofala Cheringoma 0 Sofala Chibabava 1 Sofala Dondo 1 Sofala Gorongosa 0 Sofala Machanga 3 Sofala Maringue 0 Sofala Marromeu 1 Sofala Muanza 0 Sofala Nhamatanda 1 Tete Angónia 0 Tete Cahora-Bassa 0 Tete Changara 0 Tete Chifunde 0 Tete Chiúta 0 Tete Macanga 0 Tete Magoe 0 Tete Maravia 0 Tete Moatize 0 Tete Mutarara 0 Tete Tsangano 0 Tete Zumbu 0 Zambezia Alto Molocue 0 Zambezia Chinde 1 Zambezia Gilé 0 Zambezia Gurué 0 Zambezia Ile 0 Zambezia Inhassunge 1 Zambezia Lugela 0 Zambezia Maganja da Costa 2 Zambezia Milange 0 Zambezia Mocuba 0 Zambezia Mopeia 0 Zambezia Morrumbala 2 Zambezia Namacurra 0 Zambezia Namarroi 0 Zambezia Nicoadala 0 Zambezia Pebane 2
32 Annex 4: Cyclones: District Risk Ranking Province District Risk Zambezia Alto Molocue 0 Cabo Delgado Ancuabe 0 Tete Angónia 0 Cabo Delgado Balama 0 Manica Báruè 0 Gaza Bilene Macia 0 Maputo Boane 0 Tete Cahora-Bassa 0 Sofala Caia 0 Tete Changara 0 Sofala Chemba 0 Sofala Cheringoma 0 Gaza Chicualacuala 0 Tete Chifunde 0 Gaza Chigubo 0 Cabo Delgado Chiúre 0 Tete Chiúta 0 Gaza Chókwè 0 Niassa Cuamba 0 Nampula Eráti 0 Inhambane Funhalouro 0 Zambezia Gilé 0 Manica Gondola 0 Sofala Gorongosa 0 Gaza Guijá 0 Manica Guro 0 Zambezia Gurué 0 Inhambane Homoine 0 Zambezia Ile 0 Inhambane Jangamo 0 Niassa Lago 0 Nampula Lalaua 0 Niassa Lichinga 0 Zambezia Lugela 0 Gaza Mabalane 0 Tete Macanga 0 Manica Machaze 0 Cabo Delgado Macomia 0 Manica Macossa 0 Tete Magoe 0 Niassa Majune 0 Niassa Mandimba 0 Gaza Mandlakazi 0 Manica Manica 0 Tete Maravia 0 Sofala Maringue 0 Niassa Marrupa 0 Gaza Massangena 0 Gaza Massingir 0 Maputo Matutuíne 0 Niassa Maúa 0 Niassa Mavago 0 Niassa Mecanhelas 0 Cabo Delgado Mecúfi 0 Niassa Mecula 0 Cabo Delgado Meluco 0 Niassa Metarica 0 Zambezia Milange 0 Maputo Moamba 0 Tete Moatize 0 Cabo Delgado Mocimboa da Praia 0 Zambezia Mocuba 0 Cabo Delgado Montepuez 0 Zambezia Mopeia 0 Inhambane Morrumbene 0 Province District Risk Cabo Delgado Mueda 0 Niassa Muembe 0 Tete Mutarara 0 Zambezia Namacurra 0 Zambezia Namarroi 0 Cabo Delgado Namuno 0 Cabo Delgado Nangade 0 Niassa N'gauma 0 Zambezia Nicoadala 0 Niassa Nipepe 0 Cabo Delgado Palma 0 Inhambane Panda 0 Cabo Delgado Pemba 0 Cabo Delgado Quissango 0 Nampula Ribáuè 0 Niassa Sanga 0 Manica Sussundenga 0 Manica Tambara 0 Tete Tsangano 0 Inhambane Zavala 0 Tete Zumbu 0 Sofala Chibabava 1 Gaza Chibuto 1 Zambezia Chinde 1 Maputo Cidade de Maputo 1 Sofala Dondo 1 Inhambane Inharrime 1 Zambezia Inhassunge 1 Inhambane Mabote 1 Maputo Magude 1 Nampula Malema 1 Maputo Manhiça 1 Maputo Marracuene 1 Sofala Marromeu 1 Inhambane Massinga 1 Nampula Mecubúri 1 Cabo Delgado Muidumbe 1 Nampula Murrupula 1 Maputo Namaacha 1 Nampula Nampula (Rapale) 1 Sofala Nhamatanda 1 Gaza Xai-Xai 1 Sofala Buzi 2 Zambezia Maganja da Costa 2 Nampula Mogovolas 2 Nampula Moma 2 Zambezia Morrumbala 2 Nampula Muecate 2 Nampula Nacarôa 2 Zambezia Pebane 2 Nampula Angoche 3 Inhambane Govuro 3 Inhambane Inhassoro 3 Sofala Machanga 3 Nampula Meconta 3 Nampula Memba 3 Nampula Mogincual 3 Nampula Monapo 3 Nampula Mossuril 3 Nampula Nacala-a-Velha 3 Inhambane Vilankulo 3 29
33 Annex 5: Droughts: District Risk in alphabetical order Province District Risk Cabo Delgado Ancuabe 0 Cabo Delgado Balama 1 Cabo Delgado Chiúre 1 Cabo Delgado Macomia 1 Cabo Delgado Mecúfi 1 Cabo Delgado Meluco 1 Cabo Delgado Mocimboa da Praia 1 Cabo Delgado Montepuez 1 Cabo Delgado Mueda 1 Cabo Delgado Muidumbe 0 Cabo Delgado Namuno 1 Cabo Delgado Nangade 1 Cabo Delgado Palma 1 Cabo Delgado Pemba 0 Cabo Delgado Quissango 1 Gaza Bilene Macia 2 Gaza Chibuto 3 Gaza Chicualacuala 3 Gaza Chigubo 3 Gaza Chókwè 2 Gaza Guijá 3 Gaza Mabalane 3 Gaza Mandlakazi 2 Gaza Massangena 3 Gaza Massingir 3 Gaza Xai-Xai 2 Inhambane Funhalouro 3 Inhambane Govuro 3 Inhambane Homoine 2 Inhambane Inharrime 2 Inhambane Inhassoro 2 Inhambane Jangamo 1 Inhambane Mabote 3 Inhambane Massinga 2 Inhambane Morrumbene 2 Inhambane Panda 3 Inhambane Vilankulo 2 Inhambane Zavala 1 Manica Báruè 2 Manica Gondola 0 Manica Guro 2 Manica Machaze 2 Manica Macossa 1 Manica Manica 1 Manica Mossurize 2 Manica Sussundenga 2 Manica Tambara 2 Maputo Boane 1 Maputo Magude 2 Maputo Manhiça 2 Maputo Cidade de Maputo 0 Maputo Marracuene 2 Maputo Matutuíne 2 Maputo Moamba 2 Maputo Namaacha 2 Nampula Angoche 1 Nampula Nacarôa 2 Nampula Lalaua 1 Nampula Malema 1 Nampula Meconta 1 Nampula Mecubúri 0 Nampula Memba 2 Nampula Mogovolas 0 Nampula Moma 0 Nampula Monapo 2 Nampula Mogincual 1 30 Province District Risk Nampula Mossuril 2 Nampula Muecate 0 Nampula Murrupula 1 Nampula Nacala-a-Velha 2 Nampula Eráti 1 Nampula Nampula (Rapale) 0 Nampula Ribáuè 0 Niassa Cuamba 1 Niassa Lago 0 Niassa Lichinga 0 Niassa Majune 1 Niassa Mandimba 0 Niassa Marrupa 1 Niassa Maúa 0 Niassa Mavago 1 Niassa Mecanhelas 0 Niassa Mecula 0 Niassa Metarica 0 Niassa Muembe 0 Niassa N'gauma 0 Niassa Nipepe 0 Niassa Sanga 0 Sofala Buzi 1 Sofala Caia 2 Sofala Chemba 2 Sofala Cheringoma 1 Sofala Chibabava 3 Sofala Dondo 2 Sofala Gorongosa 1 Sofala Machanga 2 Sofala Maringue 1 Sofala Marromeu 2 Sofala Muanza 1 Sofala Nhamatanda 0 Tete Angónia 0 Tete Cahora-Bassa 3 Tete Changara 3 Tete Chifunde 1 Tete Chiúta 3 Tete Macanga 0 Tete Magoe 3 Tete Maravia 2 Tete Moatize 2 Tete Mutarara 3 Tete Tsangano 0 Tete Zumbu 2 Zambezia Alto Molocue 1 Zambezia Chinde 1 Zambezia Gilé 1 Zambezia Gurué 0 Zambezia Ile 1 Zambezia Inhassunge 1 Zambezia Lugela 0 Zambezia Maganja da Costa 1 Zambezia Milange 0 Zambezia Mocuba 1 Zambezia Mopeia 2 Zambezia Morrumbala 1 Zambezia Namacurra 0 Zambezia Namarroi 0 Zambezia Nicoadala 2 Zambezia Pebane 1
34 Annex 6: Droughts: District Risk Ranking Province District Risk Cabo Delgado Ancuabe 0 Cabo Delgado Muidumbe 0 Cabo Delgado Pemba 0 Manica Gondola 0 Maputo Cidade de Maputo 0 Nampula Mecubúri 0 Nampula Mogovolas 0 Nampula Moma 0 Nampula Muecate 0 Nampula Nampula (Rapale) 0 Nampula Ribáuè 0 Niassa Lago 0 Niassa Lichinga 0 Niassa Mandimba 0 Niassa Maúa 0 Niassa Mecanhelas 0 Niassa Mecula 0 Niassa Metarica 0 Niassa Muembe 0 Niassa N'gauma 0 Niassa Nipepe 0 Niassa Sanga 0 Sofala Nhamatanda 0 Tete Angónia 0 Tete Macanga 0 Tete Tsangano 0 Zambezia Gurué 0 Zambezia Lugela 0 Zambezia Milange 0 Zambezia Namacurra 0 Zambezia Namarroi 0 Cabo Delgado Balama 1 Cabo Delgado Chiúre 1 Cabo Delgado Macomia 1 Cabo Delgado Mecúfi 1 Cabo Delgado Meluco 1 Cabo Delgado Mocimboa da Praia 1 Cabo Delgado Montepuez 1 Cabo Delgado Mueda 1 Cabo Delgado Namuno 1 Cabo Delgado Nangade 1 Cabo Delgado Palma 1 Cabo Delgado Quissango 1 Inhambane Jangamo 1 Inhambane Zavala 1 Manica Macossa 1 Manica Manica 1 Maputo Boane 1 Nampula Angoche 1 Nampula Lalaua 1 Nampula Malema 1 Nampula Meconta 1 Nampula Mogincual 1 Nampula Murrupula 1 Nampula Eráti 1 Niassa Cuamba 1 Niassa Majune 1 Niassa Marrupa 1 Niassa Mavago 1 Sofala Buzi 1 Sofala Cheringoma 1 Sofala Gorongosa 1 Sofala Maringue 1 Sofala Muanza 1 Tete Chifunde 1 31 Province District Risk Zambezia Alto Molocue 1 Zambezia Chinde 1 Zambezia Gilé 1 Zambezia Ile 1 Zambezia Inhassunge 1 Zambezia Maganja da Costa 1 Zambezia Mocuba 1 Zambezia Morrumbala 1 Zambezia Pebane 1 Gaza Bilene Macia 2 Gaza Chókwè 2 Gaza Mandlakazi 2 Gaza Xai-Xai 2 Inhambane Homoine 2 Inhambane Inharrime 2 Inhambane Inhassoro 2 Inhambane Massinga 2 Inhambane Morrumbene 2 Inhambane Vilankulo 2 Manica Báruè 2 Manica Guro 2 Manica Machaze 2 Manica Mossurize 2 Manica Sussundenga 2 Manica Tambara 2 Maputo Magude 2 Maputo Manhiça 2 Maputo Marracuene 2 Maputo Matutuíne 2 Maputo Moamba 2 Maputo Namaacha 2 Nampula Nacarôa 2 Nampula Memba 2 Nampula Monapo 2 Nampula Mossuril 2 Nampula Nacala-a-Velha 2 Sofala Caia 2 Sofala Chemba 2 Sofala Dondo 2 Sofala Machanga 2 Sofala Marromeu 2 Tete Maravia 2 Tete Moatize 2 Tete Zumbu 2 Zambezia Mopeia 2 Zambezia Nicoadala 2 Gaza Chibuto 3 Gaza Chicualacuala 3 Gaza Chigubo 3 Gaza Guijá 3 Gaza Mabalane 3 Gaza Massangena 3 Gaza Massingir 3 Inhambane Funhalouro 3 Inhambane Govuro 3 Inhambane Mabote 3 Inhambane Panda 3 Sofala Chibabava 3 Tete Cahora-Bassa 3 Tete Changara 3 Tete Chiúta 3 Tete Magoe 3 Tete Mutarara 3
35 Annex 7: Municipalities Risk Ranking Floods, Cyclones and Droughts Floods Province Municipality Risk Nampula Nacala 0 Niassa Lichinga 0 Manica Chimoio 2 Tete Tete 2 Zambezia Quelimane 2 Cabo Delgado Pempa 1 Inhambane Maxixe 1 Inhambane Inhambane 1 Maputo Matola 1 Nampula Ilha de Moçamb. 1 Nampula Nampula 1 Gaza Xai-Xai 3 Maputo Maputo 3 Sofala Beira 3 Cyclones Province Municipality Risk Cabo Delgado Pemba 0 Inhambane Maxixe 0 Manica Chimoio 0 Maputo Matola 0 Niassa Lichinga 0 Tete Tete 0 Gaza Xai-Xai 1 Inhambane Inhambane 1 Maputo Maputo 1 Sofala Beira 2 Zambezia Quelimane 2 Nampula Ilha de Moçamb. 3 Nampula Nacala 3 Nampula Nampula 3 Droughts Province Municipality Risk Cabo Delgado Pemba 0 Inhambane Maxixe 0 Manica Chimoio 0 Maputo Maputo 0 Maputo Matola 0 Niassa Lichinga 0 Zambezia Quelimane 0 Gaza Xai-Xai 1 Sofala Beira 1 Nampula Nampula 1 Nampula Ilha de Moçamb. 2 Inhambane Inhambane 2 Nampula Nacala 2 Tete Tete 3 32
36 Annex 8: Child Vulnerability Index in alphabetical order Province District Deprivation rank 33 EP1 dropout Nutrition (bad growth) HIV/AIDS Vuln. Index Cabo Delgado Ancuabe 96 5,5% 1,0% 9,7% 2 Cabo Delgado Balama 83 9,9% 1,2% 1,8% 2 Cabo Delgado Chiúre 108 5,9% 2,8% 4,9% 4 Cabo Delgado Macomia ,0% 1,2% 8,7% 4 Cabo Delgado Mecúfi 85 9,4% 1,6% 14,4% 3 Cabo Delgado Meluco 128 4,6% 1,0% 3,8% 2 Cabo Delgado Mocimboa da Praia 81 11,0% 7,1% 9,4% 5 Cabo Delgado Montepuez 66 5,6% 1,7% 5,8% 1 Cabo Delgado Mueda 63 12,9% 1,1% 24,0% 5 Cabo Delgado Muidumbe 89 10,1% 1,4% 28,7% 6 Cabo Delgado Namuno 123 5,6% 0,9% 2,8% 2 Cabo Delgado Nangade 78 9,9% 5,9% 58,0% 7 Cabo Delgado Palma 142 7,4% 2,0% 4,7% 3 Cabo Delgado Pemba 45 5,6% 1,3% 5,1% 0 Cabo Delgado Cidade da Pempa 11 1,0% 2,0% 13,2% 2 Cabo Delgado Quissango 126 8,5% 2,6% 4,2% 5 Gaza Bilene Macia 20 5,8% 2,2% 24,6% 4 Gaza Chibuto 23 4,2% 2,0% 25,9% 3 Gaza Chicualacuala 51 10,2% 2,9% 26,9% 6 Gaza Chigubo ,7% 2,9% 24,1% 8 Gaza Chókwè 25 1,6% 1,2% 42,8% 2 Gaza Guijá 41 5,9% 0,8% 24,3% 2 Gaza Mabalane 46 8,1% 1,4% 22,6% 3 Gaza Mandlakazi 49 4,1% 1,8% 24,2% 3 Gaza Massangena 98 8,2% 1,3% 14,5% 4 Gaza Massingir 37 10,5% 1,4% 12,9% 3 Gaza Xai-Xai 27 6,4% 1,5% 33,8% 2 Gaza Cidade da Xai-Xai 3 3,8% 1,3% 25,9% 2 Inhambane Funhalouro 62 9,0% 1,1% 11,7% 1 Inhambane Govuro 33 5,1% 1,3% 15,0% 1 Inhambane Cidade de Maxixe 10 2,9% 1,4% 11,0% 0 Inhambane Homoine 21 2,7% 0,5% 13,2% 1 Inhambane Inharrime 32 6,5% 0,5% 8,4% 0 Inhambane Inhassoro 54 8,9% 0,3% 17,6% 3 Inhambane Jangamo 26 1,3% 0,6% 8,0% 0 Inhambane Cidade de Inhambane 6 2,9% 0,9% 8,4% 0 Inhambane Mabote 84 4,8% 0,8% 16,6% 3 Inhambane Massinga 30 7,8% 0,5% 12,7% 1 Inhambane Morrumbene 38 6,0% 0,6% 9,8% 0 Inhambane Panda 113 9,4% 1,0% 16,1% 5 Inhambane Vilankulo 68 5,5% 1,3% 14,0% 2 Inhambane Zavala 60 3,4% 0,8% 8,0% 0 Manica Báruè 36 12,0% 0,8% 7,5% 2 Manica Gondola 24 5,4% 2,2% 14,1% 3 Manica Cidade de Chimoio 2 9,3% 2,2% 15,8% 5 Manica Guro 72 9,8% 1,1% 9,4% 2 Manica Machaze 58 9,0% 2,2% 26,8% 5 Manica Macossa 80 5,3% 4,2% 7,0% 3 Manica Manica 18 13,0% 2,2% 12,7% 5 Manica Mossurize ,0% 0,6% 11,4% 4 Manica Sussundenga 64 8,4% 1,9% 13,8% 4 Manica Tambara 132 4,6% 2,1% 4,8% 3 Maputo Boane 16 4,8% 0,4% 28,9% 2 Maputo Magude 43 7,8% 3,9% 19,2% 4 Maputo Manhiça 34 7,6% 1,1% 24,4% 2 Maputo Cidade da Matola 7 4,9% 0,7% 23,7% 2 Maputo Cidade de Maputo 6 3,3% 3,9% 25,4% 4 Maputo Marracuene 19 1,9% 1,1% 28,0% 2 Maputo Matutuíne 42 13,1% 0,4% 26,3% 4 Maputo Moamba 31 6,9% 0,3% 21,2% 2 Maputo Namaacha 22 5,7% 1,8% 24,3% 3
37 Province District Deprivation rank 34 EP1 dropout Nutrition (bad growth) HIV/AIDS Vuln. Index Nampula Angoche 76 8,3% 2,9% 10,9% 4 Nampula Nacarôa 139 9,6% 5,0% 5,3% 5 Nampula Lalaua 105 6,9% 2,2% 5,3% 4 Nampula Malema 70 3,1% 1,7% 7,1% 1 Nampula Meconta 77 12,3% 0,9% 6,8% 3 Nampula Mecubúri 133 9,4% 1,4% 13,4% 4 Nampula Memba 143 5,8% 1,2% 6,9% 2 Nampula Ilha de Moçamb ,9% 3,7% 19,0% 7 Nampula Mogovolas ,5% 1,5% 2,8% 4 Nampula Moma 118 7,4% 0,6% 6,7% 2 Nampula Monapo 103 8,4% 1,7% 7,3% 3 Nampula Mogincual ,4% 1,3% 4,2% 4 Nampula Mossuril 135 1,9% 2,8% 9,2% 4 Nampula Muecate 130 9,8% 1,9% 9,3% 4 Nampula Murrupula ,1% 1,0% 3,6% 4 Nampula Cidade de Nacala 35 9,0% 1,1% 10,3% 1 Nampula Nacala-a-Velha ,1% 1,8% 4,3% 5 Nampula Eráti 138 8,0% 4,0% 5,5% 4 Nampula Nampula (Rapale) ,3% 2,5% 4,2% 6 Nampula Cidade de Nampula 13 5,5% 1,8% 12,8% 2 Nampula Ribáuè 57 7,0% 3,4% 8,3% 2 Niassa Cuamba 28 13,5% 2,0% 7,0% 3 Niassa Lago 59 15,7% 2,3% 9,7% 4 Niassa Lichinga 61 17,9% 2,0% 4,9% 3 Niassa Cidade de Lichinga 15 8,0% 3,1% 7,4% 2 Niassa Majune 95 10,5% 2,1% 8,1% 6 Niassa Mandimba 91 14,3% 3,5% 5,8% 6 Niassa Marrupa 122 7,9% 1,8% 4,2% 3 Niassa Maúa 125 9,6% 2,9% 5,1% 5 Niassa Mavago 92 11,4% 2,0% 11,2% 5 Niassa Mecanhelas 93 8,7% 1,9% 2,9% 4 Niassa Mecula 65 23,7% 0,2% 7,0% 3 Niassa Metarica ,5% 1,2% 4,9% 4 Niassa Muembe 88 14,9% 0,6% 7,8% 4 Niassa N'gauma 82 12,5% 1,2% 3,6% 3 Niassa Nipepe ,2% 0,7% 6,3% 4 Niassa Sanga 44 19,2% 1,6% 4,6% 2 Sofala Buzi 52 11,8% 1,7% 12,8% 3 Sofala Caia 56 16,6% 2,4% 13,3% 5 Sofala Chemba 90 13,2% 3,6% 6,2% 6 Sofala Cheringoma 74 10,5% 2,1% 9,2% 5 Sofala Chibabava 131 8,5% 1,7% 15,9% 5 Sofala Cidade da Beira 8 4,6% 1,0% 22,4% 2 Sofala Dondo 17 10,7% 3,5% 22,8% 6 Sofala Gorongosa ,5% 2,2% 6,3% 6 Sofala Machanga ,0% 1,3% 15,3% 6 Sofala Maringue ,9% 3,2% 3,4% 6 Sofala Marromeu 50 7,1% 1,7% 9,5% 1 Sofala Muanza 79 5,2% 1,1% 6,7% 1 Sofala Nhamatanda 40 12,6% 1,9% 12,1% 3 Tete Angónia 53 15,3% 1,2% 5,2% 2 Tete Cahora-Bassa 47 8,4% 3,0% 10,4% 3 Tete Changara 97 8,5% 3,9% 12,9% 6 Tete Cidade de Tete 14 0,0% 3,1% 17,9% 4 Tete Chifunde 86 13,5% 3,0% 5,6% 5 Tete Chiúta ,8% 1,8% 12,2% 5 Tete Macanga 107 5,0% 2,3% 1,4% 4 Tete Magoe ,5% 1,5% 25,0% 6 Tete Maravia ,6% 2,7% 4,5% 6 Tete Moatize 48 8,3% 2,0% 10,2% 2 Tete Mutarara ,3% 3,6% 5,6% 6 Tete Tsangano 69 12,2% 3,5% 14,4% 6 Tete Zumbu 144 5,3% 0,9% 18,0% 4 Zambezia Alto Molocue 101 2,1% 0,5% 21,8% 4 Zambezia Chinde 73 5,7% 1,8% 32,5% 4
38 Province District Deprivation rank EP1 dropout Nutrition (bad growth) HIV/AIDS Vuln. Index Zambezia Gilé 94 5,3% 3,1% 6,7% 4 Zambezia Gurué ,3% 1,1% 28,7% 6 Zambezia Ile 99 7,9% 0,5% 5,6% 2 Zambezia Inhassunge 104 6,5% 4,8% 32,6% 6 Zambezia Lugela 87 6,6% 1,4% 14,5% 2 Zambezia Maganja da Costa 145 8,7% 1,4% 24,1% 5 Zambezia Milange 137 4,9% 0,3% 18,6% 4 Zambezia Mocuba 39 8,3% 1,8% 12,7% 3 Zambezia Mopeia ,5% 2,8% 18,2% 8 Zambezia Morrumbala 109 6,3% 5,7% 22,3% 6 Zambezia Namacurra 55 6,2% 0,8% 33,4% 2 Zambezia Namarroi 75 5,1% 2,0% 3,8% 2 Zambezia Cidade de Quelimane 29 5,1% 1,3% 32,6% 2 Zambezia Nicoadala 112 6,4% 1,5% 21,3% 4 Zambezia Pebane 136 5,0% 2,9% 17,8% 6 35
39 Annex 9: Child Vulnerability Index by rank Province District Vuln. Rank Gaza Chigubo 8 Zambezia Pebane 8 Cabo Delgado Quissango 7 Nampula Nampula (Rapale) 7 Cabo Delgado Palma 6 Gaza Massangena 6 Nampula Murrupula 6 Niassa Metarica 6 Niassa Nipepe 6 Sofala Buzi 6 Sofala Caia 6 Sofala Chemba 6 Sofala Machanga 6 Sofala Maringue 6 Tete Tsangano 6 Tete Chiúta 6 Tete Macanga 6 Tete Magoe 6 Tete Mutarara 6 Zambezia Maganja da Costa 6 Zambezia Mopeia 6 Zambezia Morrumbala 6 Zambezia Nicoadala 6 Cabo Delgado Nangade 5 Cabo Delgado Chiúre 5 Cabo Delgado Namuno 5 Inhambane Panda 5 Manica Sussundenga 5 Manica Mossurize 5 Manica Tambara 5 Nampula Memba 5 Nampula Muecate 5 Niassa Muembe 5 Niassa Marrupa 5 Sofala Cidade da Beira 5 Sofala Muanza 5 Sofala Gorongosa 5 Tete Cidade de Tete 5 Tete Chifunde 5 Zambezia Inhassunge 5 Cabo Delgado Montepuez 4 Cabo Delgado Muidumbe 4 Gaza Bilene Macia 4 Gaza Chicualacuala 4 Manica Manica 4 Manica Machaze 4 Maputo Moamba 4 Maputo Cidade de Maputo 4 Maputo Cidade da Matola 4 Nampula Ilha de Moçamb. 4 Nampula Nacarôa 4 Nampula Lalaua 4 Nampula Mecubúri 4 Nampula Moma 4 Nampula Monapo 4 Nampula Mogincual 4 Nampula Mossuril 4 Nampula Nacala-a-Velha 4 Niassa Lago 4 Niassa Lichinga 4 Niassa Majune 4 Niassa Mavago 4 Niassa Maúa 4 Tete Angónia 4 Tete Maravia 4 36
40 Province District Vuln. Rank Tete Zumbu 4 Zambezia Chinde 4 Zambezia Ile 4 Zambezia Alto Molocue 4 Zambezia Gurué 4 Zambezia Milange 4 Cabo Delgado Mueda 3 Cabo Delgado Macomia 3 Gaza Chibuto 3 Gaza Massingir 3 Gaza Xai-Xai 3 Gaza Cidade da Xai-Xai 3 Inhambane Vilankulo 3 Inhambane Zavala 3 Manica Cidade de Chimoio 3 Manica Guro 3 Manica Macossa 3 Maputo Namaacha 3 Nampula Meconta 3 Nampula Ribáuè 3 Niassa Sanga 3 Niassa Cidade de Lichinga 3 Niassa Mandimba 3 Niassa Mecanhelas 3 Niassa Mecula 3 Sofala Nhamatanda 3 Sofala Cheringoma 3 Tete Changara 3 Zambezia Lugela 3 Cabo Delgado Ancuabe 2 Cabo Delgado Balama 2 Cabo Delgado Mecúfi 2 Cabo Delgado Mocimboa da Praia 2 Cabo Delgado Meluco 2 Gaza Chókwè 2 Gaza Guijá 2 Gaza Mabalane 2 Gaza Mandlakazi 2 Inhambane Mabote 2 Manica Báruè 2 Manica Gondola 2 Maputo Boane 2 Maputo Magude 2 Maputo Manhiça 2 Maputo Marracuene 2 Maputo Matutuíne 2 Nampula Cidade de Nampula 2 Nampula Angoche 2 Nampula Mogovolas 2 Nampula Eráti 2 Niassa Cuamba 2 Niassa N'gauma 2 Sofala Chibabava 2 Tete Cahora-Bassa 2 Tete Moatize 2 Zambezia Mocuba 2 Zambezia Cidade de Quelimane 2 Zambezia Gilé 2 Zambezia Namacurra 2 Zambezia Namarroi 2 Cabo Delgado Cidade da Pempa 1 Inhambane Cidade de Inhambane 1 Inhambane Cidade de Maxixe 1 Inhambane Funhalouro 1 Inhambane Inhassoro 1 Nampula Cidade de Nacala 1 Nampula Malema 1 Sofala Dondo 1 Sofala Marromeu 1 37
41 Province District Vuln. Rank Cabo Delgado Pemba 0 Inhambane Govuro 0 Inhambane Homoine 0 Inhambane Inharrime 0 Inhambane Jangamo 0 Inhambane Massinga 0 Inhambane Morrumbene 0 38


42 Annex 10: Maps on Flood and Cyclone Risk in Cities 39


43 Annex 11: Risk Maps based on hydrological and meteorological data 40
 MOZAMBIQUE UPDATE ON IMPLEMENTING ARTICLE 5 12th Meeting of States Parties to the Anti-Personnel Mine Ban Convention 1 Results of Activities 2008-2012 The 2007-2008 Baseline reported the existence of 541
South-South Learning Exchange Visit, Mozambique IT/ITES Experiences and Challenges
 South-South Learning Exchange Visit, 9 of February 2009 Mozambique IT/ITES Experiences and Challenges By Carlos Tamele (ctame@micti.co.mz) Constantino Sotomane (sotomane@micti.co.mz) Country Background
Cost of PEC-Zonal Activities in Mozambique Analysis of contract costs from 2008 up to 2011 Júlia Zita, Arjen Naafs
 Briefing Note Moz. D 01 Cost of PEC-Zonal Activities in Mozambique Analysis of contract costs from 2008 up to 2011 Júlia Zita, Arjen Naafs (moz.washcost@gmail.com) WASHCost August, 2011(Translated February
MOZAMBIQUE mvam Bulletin #6: January 2017
 mvam Bulletin #6: January 2017 Maize meal and rice prices remain high in Tete province Key points: Maize meal and rice remained very expensive in Tete province in January Maize grain is available in all
Sampling methodology Mozambique
 Working Paper Moz-WP1 Sampling methodology Mozambique Using the MICS 1 as base for WASHCost WASHCost team March 2010 Version 1.3 1 Multiple Cluster Indicator Survey 1 WASHCost Mozambique Sampling strategy
Educational inequality in Mozambique
 Educational inequality in Mozambique Servaas van der Berg (Resep, Stellenbosch University) Carlos da Maia (World Bank) Cobus Burger (Resep, Stellenbosch University) WIDER conference on Poverty and Inequality
MOZAMBIQUE. Drought Humanitarian Situation Report
 UNICEF Mozambique/March 2016 MOZAMBIQUE Drought Humanitarian Situation Report Failed maize crops: UNICEF Mozambique/March, 2016/Bonde SITUATION IN NUMBERS Highlights The Technical Secretariat for Food
EDM RURAL ELECTRIFICATION PLAN
 EDM RURAL ELECTRIFICATION PLAN By Marcelino Alberto Executive Board Member mgildo@edm.co.mz EDM, E.P. Mozambique Maputo 16 th November 2011 1 Company Profile: The EDM as a State Company was established
Assessment Report Tropical Cyclone IDAI Mozambique Beira City
 Assessment Report Tropical Cyclone IDAI Mozambique Beira City OVERVIEW The rapid assessment of Beira was conducted on 29 March with 12 inter-agency assessment teams from INGC, IFRC, UN agencies and NGOs.
Centro de Promoção de Investimentos (Investment Promotion Centre) BOOK OF OPPORTUNITIES Joint Venture with Mozambican Companies
 BOOK OF OPPORTUNITIES Joint Venture with Mozambican Companies") Centro de Promoção de Investimentos ( Promotion Centre) BOOK OF OPPORTUNITIES Joint Venture with Mozambican Companies January 2015 1. Agriculture/Agri-business/Forestry ( Project) 1.1. Farming and Livestock
Centro de Promoção de Investimentos ( Promotion Centre) BOOK OF OPPORTUNITIES Joint Venture with Mozambican Companies January 2015 1. Agriculture/Agri-business/Forestry ( Project) 1.1. Farming and Livestock
The World Bank. Key Dates. Project Development Objectives. Components. Overall Ratings. Public Disclosure Authorized
 Public Disclosure Authorized AFRICA Mozambique Water Global Practice IBRD/IDA Specific Investment Loan FY 2008 Seq No: 16 ARCHIVED on 30-Oct-2015 ISR21080 Implementing Agencies: Public Disclosure Authorized
18,669 children targeted for treatment of malnutrition
 Mozambique: Drought Office of the Resident Coordinator, Situation Report No. 2 (As of 03 March 2016) This report is prepared by the Humanitarian Country Team/Office of the Resident Coordinator in Mozambique.
MOZAMBIQUE mvam Bulletin #5: December 2016
 Maize meal prices fall in Gaza Key points: Maize grain in Xai-Xai and maize meal in Marara remained expensive in December Prices dropped for rice, maize meal and cooking oil in Xai-Xai, and for maize meal
MOZAMBIQUE mvam Bulletin #8: March 2017
 Maize grain prices have fallen throughout the country Key points: In March, maize grain prices fell almost everywhere in anticipation of the green harvest Maize meal prices in most districts are below
MOZAMBIQUE UPDATE ON DEMINING COMPLETION
 MOZAMBIQUE UPDATE ON DEMINING COMPLETION Meeting of the MASG By Hans Risser and Justus Okoko New York, 18 Octoberr 2013 1 Background Mozambique landmine problem was once one of the most severe in the world,
Japan International Cooperation Agency
 Japan International Cooperation Agency Facts and Figures about JICA 1. What is JICA? Since joining the Colombo plan in 1954, Japan has been providing financial and technical assistance to developing countries
GROUP OF EXPERTS ON No. 15 GEOGRAPHICAL NAMES
 UNITED NATIONS Working Paper GROUP OF EXPERTS ON No. 15 GEOGRAPHICAL NAMES Twenty-third Session Vienna, 28 March 4 April 2006 Item 5 of the Provisional Agenda: Reports of the divisions Africa South Division
PART IV ECONOMIC FEASIBILITY STUDY
 PART IV ECONOMIC FEASIBILITY STUDY Part IV Economic Feasibility Study Chapter1 Existing Traffic Flow Patterns 1.1 Introduction This chapter aims to analyze traffic flow patterns on the Study Road based
HUMANITARIAN RESPONSE PLAN
 2018-2019 HUMANITARIAN RESPONSE PLAN (Revised following Cyclone Idai, March 2019) November 2018 - June 2019 Photo: UNOCHA / Saviano Abreu MOZAMBIQUE TOTAL FINANCIAL MOZAMBIQUE REQUIREMENTS HUMANITARIAN
SOUTHERN AFRICA TROPICAL CYCLONE IDAI
 SOUTHERN AFRICA TROPICAL CYCLONE IDAI FACT SHEET #3, FISCAL YEAR (FY) 2019 MARCH 29, 2019 NUMBERS AT A GLANCE 493 Official Confirmed Deaths in Mozambique GoM March 2019 181 Number of Deaths in Zimbabwe
Business and Investment Opportunities in the Industrial Sector
 REPUBLIC OF MOZAMBIQUE MINISTRY OF INDUSTRY AND TRADE NATIONAL DIRECTORATE OF INDUSTRY Business and Investment Opportunities in the Industrial Sector Mozambique Business Luncheon JHB 28 th June 2012 By:Dr.
MOZAMBIQUE, BOTSWANA, SWAZILAND, ZIMBABWE: FLOODS
 MOZAMBIQUE, BOTSWANA, SWAZILAND, ZIMBABWE: FLOODS 3 March, 2000 appeal no. 04/2000 (revision 2) situation report no. 03 period covered: 22 February - 2 March, 2000 Appeal 04/2000 was originally launched
MOZAMBIQUE. Vitamin and Mineral Nutrition Information System (VMNIS)
") Vitamin and Mineral Nutrition Information System (VMNIS) WHO Global Database on Anaemia The database on Anaemia includes data by country on prevalence of anaemia and mean haemoglobin concentration Last
Vitamin and Mineral Nutrition Information System (VMNIS) WHO Global Database on Anaemia The database on Anaemia includes data by country on prevalence of anaemia and mean haemoglobin concentration Last
Gender and Climate change:
 Gender and Climate change: Mozambique Case Study Executive Summary by Dr Natasha Ribeiro 1. Introduction a) Country Situation Mozambique is situated on the eastern coast of southern Africa. It is bordered
SOUTHERN AFRICA TROPICAL CYCLONE IDAI
 SOUTHERN AFRICA TROPICAL CYCLONE IDAI FACT SHEET #6, FISCAL YEAR (FY) 2019 APRIL 9, 2019 NUMBERS AT A GLANCE 602 Official Confirmed Deaths in Mozambique GRM April 2019 299 Number of Deaths in Zimbabwe
Tourism Inhambane Baseline Survey
 Tourism Inhambane Baseline Survey Presented to Deutsche Gesellschaft für Internattionale Zusammenarbeit GmbH Inhambane, February 2014 Contents ACRONYMS AND ABBREVIATIONS 5 EXECUTIVE SUMMARY 6 1 INTRODUCTION
PPCR/SC.4/5 October 9, Meeting of the PPCR Sub-Committee Washington, D.C. October 28, REVIEW OF ON-GOING WORK OF THE MDBs IN DJIBOUTI
 PPCR/SC.4/5 October 9, 2009 Meeting of the PPCR Sub-Committee Washington, D.C. October 28, 2009 REVIEW OF ON-GOING WORK OF THE MDBs IN DJIBOUTI Proposed Sub-Committee Decision The Sub-Committee reviewed
CONSERVATION STATUS OF THE LION (Panthera leo) IN MOZAMBIQUE _ PHASE 1: PRELIMINARY SURVEY
 IN MOZAMBIQUE _ PHASE 1: PRELIMINARY SURVEY") CONSERVATION STATUS OF THE LION (Panthera leo) IN MOZAMBIQUE _ PHASE 1: PRELIMINARY SURVEY Final Report - October 2008 TITLE: CO-AUTHORS: Conservation status of the lion (Panthera leo) in Mozambique Phase
CONSERVATION STATUS OF THE LION (Panthera leo) IN MOZAMBIQUE _ PHASE 1: PRELIMINARY SURVEY Final Report - October 2008 TITLE: CO-AUTHORS: Conservation status of the lion (Panthera leo) in Mozambique Phase
SOUTHERN AFRICA TROPICAL CYCLONE IDAI
 SOUTHERN AFRICA TROPICAL CYCLONE IDAI FACT SHEET #4, FISCAL YEAR (FY) 2019 APRIL 3, 2019 NUMBERS AT A GLANCE 598 Official Confirmed Deaths in Mozambique GoM April 2019 181 Number of Deaths in Zimbabwe
Appeal coverage: 116.4%; Click here to go to the attached Contributions list, or refer to Federation s website.
 MOZAMBIQUE 8 December 2003 Appeal No. 01.18/2003 Appeal Target: CHF 806,03 5 (USD 552,375 or EUR 547,916) Programme Update No. 2 Period covered: June November 2003 The Federation s mission is to improve
Mozambique Food Security Outlook April to September 2009
 Mozambique Food Security Outlook April to September 2009 InMarch,moderatefoodinsecuritywasfoundin most of southern Tete and parts of Manica, Zambézia,andcoastalNampulaprovinces(Figure 1). Aside from these
REPUBLIC OF MOZAMBIQUE SOFALA PROVINCE
 REPUBLIC OF MOZAMBIQUE SOFALA PROVINCE PRESENTATION ON THE OCCASION OF THE BUSINESS SEMINAR INVESTING IN SOFALA, MOZAMBIQUE Centurion Lake Hotel, Pretória 22 JUNE 2012 1 Ladies and gentlemen, distinguished
Keywords: 1MZ/abundance/African lion/conflicts/conservation/distribution/hunting/inquiry/ lion/panthera leo/status/survey
 Chardonnet, P., Mésochina, P., Renaud, P.-C., Bento, C., Conjo, D., Fusari, A., Begg, C., and Foloma, M. 2008. Conservation status of the lion (Panthera leo) in Mozambique - Phase 1: Preliminary Survey.
Summary table of disaster occurrences, by hazards types, scale, and geographic region
 ANNEX BASIC RANGE OF DISASTER-RELATED STATISTICS TABLES Statistical tables are organised into worksheets according to basic components in the DSRF. The variables represent queries from a disaster-related
Southern Africa: Floods
 Southern Africa: Floods DREF operation n MDR63001 GLIDE n FL-2008-000004- LSO/MOZ/MWI/SWZ/ZMB/ZWE 11 January 2008 The International Federation s Disaster Relief Emergency Fund (DREF) is a source of un-earmarked
MOZAMBIQUE News reports & clippings 344 Poverty survey supplement - 31 October 2016 Editor: Joseph Hanlon (
 MOZAMBIQUE News reports & clippings 344 Poverty survey supplement - 31 October 2016 Editor: Joseph Hanlon ( j.hanlon@open.ac.uk) To subscribe: tinyurl.com/sub-moz To unsubscribe: tinyurl.com/unsub-moz
Southern Africa Growing Season : Heading for a Record Drought?
 Southern Africa Growing Season 2015-2016: Heading for a Record Drought? HIGHLIGHTS The current growing season (October 2015 April 2016) in Southern Africa is developing under the peak phase of El Nino
The main audience for this study
 Johanesburg, 11 October 2002 1 The main audience for this study 2 What does this study offer? A pre-feasibility evalution of agro-industrial processing projects in the Limpopo Corridor; projects resting,
Southern Africa Floods Situation Update# 3 2 February 2011
 Southern Africa Floods Situation Update# 3 2 February 2011 This report was issued by the Regional Office for Southern & Eastern Africa (ROSEA). It covers the period from 27 January to 2 February 2011.
Central & Southern Mozambique Floods AFMZ81 Appeal Target: US$1,124,565
 Appeal Mozambique 150 route de Ferney, P.O. Box 2100 1211 Geneva 2, Switzerland Tel: 41 22 791 6033 Fax: 41 22 791 6506 E-mail: act@act-intl.org Coordinating Office Central & Southern Mozambique Floods
REPUBLIC OF MOZAMBIQUE
 SAIHC14-5.4F REPUBLIC OF MOZAMBIQUE INSTITUTO NACIONAL DE HIDROGRAFIA E NAVEGAÇÃO NATIONAL REPORT TO THE 14 th SOUTHERN AFRICA AND ISLANDS HYDROGRAPHIC COMMISSION CONFERENCE Saint-Gilles La Réunion 6 th
Papua New Guinea Disaster Risk Reduction Framework
 2018/SOM1/EPWG/014 Agenda Item: 8.2 Papua New Guinea Disaster Risk Reduction Framework Purpose: Information Submitted by: Papua New Guinea 13 th Emergency Preparedness Working Group Meeting Port Moresby,
Mozambique Political Process Bulletin
 Cidade de Maputo Maputo Gaza Maputo Matola Manhiça Namaacha Chibuto Mandlakazi David Simango Frelimo Frelimo 661,034 67 Fre 51 8 5 JPC Eduardo Namburete Renamo Renamo UNAMO CEV JPC Arão Nhacale Frelimo
Where to Go? Strategic Modelling of Access to Emergency Shelters in Mozambique
 Disasters, 2004, 28(1): 82 97 Where to Go? Strategic Modelling of Access to Emergency Shelters in Mozambique Melanie Gall University of South Carolina This paper, through spatial-analysis techniques, examines
CANADA CARIBBEAN DISASTER RISK MANAGEMENT FUND. Island Snapshot. Trinidad and Tobago
 Island Snapshot Trinidad and Tobago About the CCDRMF The Canada Caribbean Disaster Risk Management Fund (CCDRMF) is one component of Global Affairs Canada s 1 (GAC) larger regional Caribbean Disaster Risk
28 MONTHS AS PROJECT MANAGER WITH THE BRIGADA MÓVEL IN MORRUMBENE, MOZAMBIQUE
 MEDICUS MUNDI ITALIA 28 MONTHS AS PROJECT MANAGER WITH THE BRIGADA MÓVEL IN MORRUMBENE, MOZAMBIQUE Mozambique, one of the South Eastern-African Countries, actually ranks 181 st among the 189 countries
INSTITUTO NACIONAL DE ESTATÍSTICA SUMMARY
 INSTITUTO NACIONAL DE ESTATÍSTICA SUMMARY Multiple Indicator Cluster Survey 2008 Cover photo: UNICEF Mozambique With support from Mozambique Multiple Indicator Cluster Survey 2008 SUMMARY INSTITUTO NACIONAL
HONDURAS THE DATA THE PROJECT THE COUNTRY OUR WORK IN HONDURAS
 HONDURAS LIVING WATER INTERNATIONAL PO BOX 35496 HOUSTON, TX 77235-5496 877.594.4426 WWW.WATER.CC THE DATA THE PROJECT Project Location: Nueava Maranones Pozo# 3, Trujillo, Colon, Honduras GPS Coordinates:
Estimating Utility Consistent Poverty Lines: With Illustrations from Mozambique and Tanzania. Channing Arndt University of Copenhagen
 Estimating Utility Consistent Poverty Lines: With Illustrations from Mozambique and Tanzania Channing Arndt University of Copenhagen Motivation for GAPP What is happening in Africa? Operational Foci Relative
Putting Museums on the Tourist Itinerary: Museums and Tour Operators in Partnership making the most out of Tourism
 1 of 5 ICME papers 2002 Putting Museums on the Tourist Itinerary: Museums and Tour Operators in Partnership making the most out of Tourism By Clare Mateke Livingstone Museum, P O Box 60498, Livingstone,
Swaziland. HDI values and rank changes in the 2013 Human Development Report
 Human Development Report 2013 The Rise of the South: Human Progress in a Diverse World Explanatory note on 2013 HDR composite indices Swaziland HDI values and rank changes in the 2013 Human Development
Chapter 1: The Population of NHS Greater Glasgow and Clyde
 Population Estimate (thousands) Chapter 1: The Population of NHS Greater Glasgow and Clyde Population Trends and Projections National Records of Scotland estimated (NRS SAPE) 1 the 2013 NHS Greater Glasgow
Procurement Plan National PPFD
 Public Disclosure Authorized Public Disclosure Authorized Public Disclosure Authorized Public Disclosure Authorized Procurement Plan National PPFD I. General 1. Project information: Republic of Mozambique,
NAMIBIA: FLOODS. In Brief
 NAMIBIA: FLOODS Appeal no. 09/04 (provisional) 1 April 2004 The Federation s mission is to improve the lives of vulnerable people by mobilizing the power of humanity. It is the world s largest humanitarian
Catchment and Lake Research
 LARS 2007 Catchment and Lake Research Multilateral versus bilateral agreements for the establishment of river based organizations: comparison of legal, economic and social benefits in the Zambian experience.
ZAMBIA: KAZUNGULA FLOODS
 ZAMBIA: KAZUNGULA FLOODS No. MDRZM002 31 March 2006 The Federation s mission is to improve the lives of vulnerable people by mobilizing the power of humanity. It is the world s largest humanitarian organization
Scientific Support to the Danube Strategy
 Monday, 29 September 2014 CONCEPT PAPER Scientific Support to the Danube Strategy The of the European Commission is coordinating an initiative aiming to provide scientific support to the European Union
Figure 1.1 St. John s Location. 2.0 Overview/Structure
 St. John s Region 1.0 Introduction Newfoundland and Labrador s most dominant service centre, St. John s (population = 100,645) is also the province s capital and largest community (Government of Newfoundland
Southern Africa Humanitarian Update
 Southern Africa Humanitarian Update Monthly Bulletin - Johannesburg February 2007 HIGHLIGHTS REGIONAL: Angola: Flooding Flooding conditions conditions continued in the region as weeks of torrential rains
CUBA: HURRICANE IRENE
 CUBA: HURRICANE IRENE 18 April, 2000 appeal no. 27/99 situation report no. 01 - Final Report period covered: 02 November, 1999-2 March 2000 The Cuban Red Cross completed distribution of water tanks, and
A Case Study: Shared Connectivity Between Schools in Inhambane
 A Case Study: Shared Connectivity Between Schools in Inhambane Workshop de disseminação de resultados do Projecto First Mile First Inch (FMFI) Ministério da Educação e Cultura Location Govuro Inhassoro
The results of the National Tourism Development Strategy Assessments
 The results of the National Tourism Development Strategy Assessments - 2012 (I) The assessment tool In 2012 the Sustainable Tourism Working Group of the CEEweb for Biodiversity prepared a guidance for
Southern Africa: Floods
 Southern Africa: Floods Preliminary Emergency appeal n MDR63001 GLIDE n FL-2008-00004- LSO/MOZ/MWI/NMB/SWZ/ZMB/ZWE 18 January 2008 This Preliminary Emergency Appeal seeks CHF 8,064,000 (USD 7.3m or EUR
PREFACE. Service frequency; Hours of service; Service coverage; Passenger loading; Reliability, and Transit vs. auto travel time.
 PREFACE The Florida Department of Transportation (FDOT) has embarked upon a statewide evaluation of transit system performance. The outcome of this evaluation is a benchmark of transit performance that
Terms of Reference (ToR) for a Short-Term assignment
 for a Short-Term assignment") Terms of Reference (ToR) for a Short-Term assignment Technical assistance requested Expert for climate change mitigation and adaptation Project Title Outline of the Climate Adaptation Strategy and basin-wide
Terms of Reference (ToR) for a Short-Term assignment Technical assistance requested Expert for climate change mitigation and adaptation Project Title Outline of the Climate Adaptation Strategy and basin-wide
PRIMA Open Online Public Consultation
 PRIMA Open Online Public Consultation Short Summary Report Published on 1 June 2016 Research and Introduction Objective of the consultation: to collect views and opinions on the scope, objectives, and
Aboriginal and Torres Strait Islander Life Expectancy and Mortality Trend Reporting
 Aboriginal and Torres Strait Islander Life Expectancy and Mortality Trend Reporting Technical Report December 2015 Amended May 2016 Authors: Clare Coleman, Nicola Fortune, Vanessa Lee, Kalinda Griffiths,
Netherlands. Tourism in the economy. Tourism governance and funding
 Netherlands Tourism in the economy The importance of domestic and inbound tourism for the Dutch economy is increasing, with tourism growth exceeding the growth of the total economy in the last five years.
"ST. KLIMENT OHRIDSKI FACULTY OF GEOLOGY AND GEOGRAPHY
 SOFIA UNIVERSITY "ST. KLIMENT OHRIDSKI FACULTY OF GEOLOGY AND GEOGRAPHY APPLICATION OF THE MODEL "DRIVING FORCES PRESSURE STATE - RESPONSE FOR ASSESSMENT OF FLOOD RISK RADOSTINA BORISOVA DOCHEVA Bachelor
MADAGASCAR: POST-FLOOD FOOD SECURITY AND CHOLERA PREVENTION
 MADAGASCAR: POST-FLOOD FOOD SECURITY AND CHOLERA PREVENTION appeal no: 13/98 3 April 1998 THIS APPEAL SEEKS CHF 258,000 IN CASH, KIND AND SERVICES TO ASSIST 20,000 BENEFICIARIES FOR 3 MONTHS Summary Torrential
Executive Summary. Background of the issue
 Executive Summary Thousands of villagers in risk of losing their homes to a lake formed by a landslide which could burst its banks within days, the possible massive flood could affect more than 50,000
Analysis of en-route vertical flight efficiency
 Analysis of en-route vertical flight efficiency Technical report on the analysis of en-route vertical flight efficiency Edition Number: 00-04 Edition Date: 19/01/2017 Status: Submitted for consultation
COMMUNITY BASED TOURISM DEVELOPMENT (A Case Study of Sikkim)
") COMMUNITY BASED TOURISM DEVELOPMENT (A Case Study of Sikkim) SUMMARY BY RINZING LAMA UNDER THE SUPERVISION OF PROFESSOR MANJULA CHAUDHARY DEPARTMENT OF TOURISM AND HOTEL MANAGEMENT KURUKSHETRA UNIVERSITY,
COMMUNITY BASED TOURISM DEVELOPMENT (A Case Study of Sikkim) SUMMARY BY RINZING LAMA UNDER THE SUPERVISION OF PROFESSOR MANJULA CHAUDHARY DEPARTMENT OF TOURISM AND HOTEL MANAGEMENT KURUKSHETRA UNIVERSITY,
Eastern Caribbean Humanitarian Situation Report No. 12
 @UNICEF/Romaro Richardon/Anguilla2017 Eastern Caribbean Humanitarian Situation Report No. 12 14 November 2017 Highlights As of mid-november, the majority of schools in Anguilla, Antigua, British Virgin
UNICEF Namibia Representative: Micaela De Sousa 1 st April 2014 Safari Hotel, Windhoek
 UNICEF Namibia Representative: Micaela De Sousa Minister of Agriculture, Water and Forestry: Hon. John Mutorwa Minister of Health and Social Services: Hon. Dr Richard Kamwi Her Worship Mayor of City of
SOUTHERN AFRICA THE SEASON
 SOUTHERN AFRICA THE 2017-2018 SEASON Bulletin 1, 2018, Southern Africa January 2018 H I G H L I G H T S Highlights...... 2 Current Seasonal Status....3 Southern Africa is experiencing significant rainfall
Areas in which anti personnel mines are known or suspected to be implaced
 Algeria: Areas in which Anti personnel mines are known or suspected to be implaced. Mines areas inherited from the colonial period are located on Algeria s eastern with Tunisia and Western border with
CANADA CARIBBEAN DISASTER RISK MANAGEMENT FUND. Island Snapshot. Dominica
 Island Snapshot Dominica About the CCDRMF The Canada Caribbean Disaster Risk Management Fund (CCDRMF) is one component of Global Affairs Canada s 1 (GAC) larger regional Caribbean Disaster Risk Management
Update on FLOODS in Nigeria
 EUROPEAN COMMISSION JOINT RESEARCH CENTRE Update on FLOODS in Nigeria JRC Emergency Report #021 Nigeria, 19th of September 2018 Executive Summary The National Emergency Management Agency (NEMA) informs
THE MOST AND LEAST CHILD-FRIENDLY GOVERNMENTS IN AFRICA
 The Most and Least Child-friendly Governments in Africa 5 THE MOST AND LEAST CHILD-FRIENDLY GOVERNMENTS IN AFRICA We must put the best interests of children at the heart of all political and business decision-making,
Appendix B Ultimate Airport Capacity and Delay Simulation Modeling Analysis
 Appendix B ULTIMATE AIRPORT CAPACITY & DELAY SIMULATION MODELING ANALYSIS B TABLE OF CONTENTS EXHIBITS TABLES B.1 Introduction... 1 B.2 Simulation Modeling Assumption and Methodology... 4 B.2.1 Runway
THE TWENTY FIRST ANNUAL SOUTHERN AFRICA REGIONAL CLIMATE OUTLOOK FORUM MID-SEASON REVIEW AND UPDATE
 STATEMENT FROM THE TWENTY FIRST ANNUAL SOUTHERN AFRICA REGIONAL CLIMATE OUTLOOK FORUM (SARCOF-21) MID-SEASON REVIEW AND UPDATE, SADC HEADQUARTERS, GABORONE, BOTSWANA, 5 8 DECEMBER 2017. SUMMARY The bulk
ACTION PLAN FOR THE PERIOD concerning the STRATEGY ON IMPLEMENTATION OF THE FRAMEWORK AGREEMENT ON THE SAVA RIVER BASIN
 Doc. 1S-26-O-11-5/1-2 ACTION PLAN FOR THE PERIOD 2011-2015 concerning the STRATEGY ON IMPLEMENTATION OF THE FRAMEWORK AGREEMENT ON THE SAVA RIVER BASIN April 2011 Table of Contents INTRODUCTION... 5 1.
CHAPTER IV OVERVIEW. Indonesia. The capital is Dompu. Dompu Regency has an area of 2, km².
 CHAPTER IV OVERVIEW A. General Description of the Research Sites Dompu Regency, is a district in West Nusa Tenggara Province, Indonesia. The capital is Dompu. Dompu Regency has an area of 2,321.55 km².
Eastern Caribbean Humanitarian Situation Report No. 13
 @UNICEF/Andrew Ward/2017 Eastern Caribbean Humanitarian Situation Report No. 13 30 November 2017 Highlights As of 27 November, the majority of schools in Anguilla, Antigua, British Virgin Islands (BVI),
EARTHJUSTICE 350.ORG HUMAN RIGHTS ADVOCATES GREENPEACE INTERNATIONAL
 EARTHJUSTICE 350.ORG HUMAN RIGHTS ADVOCATES GREENPEACE INTERNATIONAL 1 November 2010 Office of the High Commissioner for Human Rights Palais Wilson, 52 rue des Pâquis, CH-1201 Geneva, Switzerland Re: Universal
Tourism and Wetlands
 CONVENTION ON WETLANDS (Ramsar, Iran, 1971) 43 rd Meeting of the Standing Committee Gland, Switzerland, 31 October 4 November 2011 DOC. SC43-27 Tourism and Wetlands Action requested. The Standing Committee
MEASURING ACCESSIBILITY TO PASSENGER FLIGHTS IN EUROPE: TOWARDS HARMONISED INDICATORS AT THE REGIONAL LEVEL. Regional Focus.
 Regional Focus A series of short papers on regional research and indicators produced by the Directorate-General for Regional and Urban Policy 01/2013 SEPTEMBER 2013 MEASURING ACCESSIBILITY TO PASSENGER
BRIEFING DOCUMENT. Baobab (Adansonia digitata L.) Fruit Pulp Powder. Production Capacity and Sustainability in Southern Africa
 Fruit Pulp Powder. Production Capacity and Sustainability in Southern Africa") BRIEFING DOCUMENT Baobab (Adansonia digitata L.) Fruit Pulp Powder Production Capacity and Prepared by: PhytoTrade Africa Unit W215, Holywell Centre, 1 Phipp Street, London EC2A 4PS Postnet Suite 223,
BRIEFING DOCUMENT Baobab (Adansonia digitata L.) Fruit Pulp Powder Production Capacity and Prepared by: PhytoTrade Africa Unit W215, Holywell Centre, 1 Phipp Street, London EC2A 4PS Postnet Suite 223,
Instituto Nacional de Desminagem
 ++ República de Moçambique Ministério dos Negócios Estrangeiros e Cooperação Instituto Nacional de Desminagem CONVENTION ON THE PROHIBITION OF THE USE, STOCKPILING, PRODUCTION AND TRANSFER OF ANTI-PERSONNEL
REDD+ IN YUCATAN PENINSULA
 REDD+ IN YUCATAN PENINSULA JOINING FORCES TO PRODUCE AND PRESERVE 2 3 Campeche, Yucatan, and Quintana Roo combat deforestation together in the Yucatan Peninsula and build a new path for growth A peninsular
Global Sustainable Tourism Destinations Criteria
 Global Sustainable Tourism Destinations Criteria Draft destination level Global Sustainable Tourism Criteria as proposed after Destinations and International Standards joint working group meeting and follow-up
Kosovo Roadmap on Youth, Peace and Security
 Kosovo Roadmap on Youth, Peace and Security Preamble We, young people of Kosovo, coming from diverse ethnic backgrounds and united by our aspiration to take Youth, Peace and Security agenda forward, Here
BOTSWANA AGRICULTURAL CENSUS REPORT 2015
 BOTSWANA AGRICULTURAL CENSUS REPORT 2015 STATISTICS BOTSWANA BOTSWANA AGRICULTURAL CENSUS REPORT 2015 1 BOTSWANA AGRICULTURAL CENSUS REPORT 2015 2 BOTSWANA AGRICULTURAL CENSUS REPORT 2015 BOTSWANA AGRICULTURAL
Development Cooperation Ireland public expenditure review report
 Development Cooperation Ireland public expenditure review report Front cover: Queuing for water, Massinga Village, Inhambane Province Alfredo Binda Public Expenditure Review Report on the Inhambane Provincial
Disaster Risk Management in Tourism Destinations
 Disaster Risk Management in Tourism Destinations Dr. Stefanos Fotiou United Nations Environment Programme Division of Technology, Industry and Economics This presentation is about Tourism and Risk Tourism
Aboriginal and Torres Strait Islander Life Expectancy and Mortality Trend Reporting to 2014
 Aboriginal and Torres Strait Islander Life Expectancy and Mortality Trend Reporting to 2014 Technical Report June 2016 Authors: Clare Coleman, Nicola Fortune, Vanessa Lee, Kalinda Griffiths, Richard Madden
Analysing the performance of New Zealand universities in the 2010 Academic Ranking of World Universities. Tertiary education occasional paper 2010/07
 Analysing the performance of New Zealand universities in the 2010 Academic Ranking of World Universities Tertiary education occasional paper 2010/07 The Tertiary Education Occasional Papers provide short
URBAN DYNAMICS WESTERN CAPE 67
 URBAN DYNAMICS WESTERN CAPE 67 5. SOCIO-ECONOMIC CONTEXT 5.1 Demographic Profile 5.1.1 Introduction The demographic information contained in the synopsis is derived from the supposedly inaccurate 2001
QUÉBEC DECLARATION ON ECOTOURISM World Ecotourism Summit Québec City, Canada, 2002
 QUÉBEC DECLARATION ON ECOTOURISM World Ecotourism Summit Québec City, Canada, 2002 The participants at the Summit acknowledge the World Summit on Sustainable Development (WSSD) in Johannesburg, August/September