AGENDA. Alaska Marine Highway System Background Data. Fiscal Year 2015 Look Forward. Dayboat Alaska Class Ferry Reservations & Manifest System
|
|
|
- Todd Lucas
- 5 years ago
- Views:
Transcription


1
2 AGENDA Alaska Marine Highway System Background Data Fiscal Year 2015 Look Forward Dayboat Alaska Class Ferry Reservations & Manifest System 2
3 MISSION STATEMENT DOT&PF: Keep Alaska moving through service and infrastructure. 3


4 ORGANIZATION/LEADERSHIP Deputy Commissioner General Manager Marine Engineering Operations Business Development 1,018 Personnel Vessel Operations Shore-side Facilities (Terminals) - 87 Marine Engineering - 24 Reservations & Marketing - 23 Administration

5 FLEET COMPOSITION 5
6 TERMINAL COMPOSITION 35 ports of call ranging from Bellingham as the southern terminus, Valdez as the northern terminus, and Dutch Harbor as the western terminus. 17 in Southeast Alaska, Canada, and Washington and 18 in Southcentral and Southwest Alaska Of the 35 ports of call: 17 State owned facilities (12 manned / 5 unmanned) 4 leased facilities (Bellingham, Prince Rupert, Seldovia and Kodiak) 14 privately owned operating under a terminal use agreement Life extending capital projects managed by Southeast Region of DOT Annual maintenance managed by AMHS 6

7 ROUTE SUMMARY Alaska Marine Highway Service Route: Passengers: Vehicles: BC Ferries Service Route: Passengers: Vehicles: Washington State Ferry Service Route: Passengers: Vehicles: 3,500 miles 340, , miles 13,000,000 8,000, Miles 12,000,000 10,000,000 7
8 Embarkations MONTHLY TRAFFIC ACTIVITY 70,000 AMHS FY09 FY15 YTD Monthly Embarkations As of December 31, ,000 Passengers 50,000 40,000 30,000 20,000 Vehicles 10,000 0 Jul Aug Sept Oct Nov Dec Jan Feb Mar Apr May June FY09 FY10 FY11 FY12 FY13 FY14 FY15 8
 usage has increased from 18.5% - 41.")
9 ON-TIME DEPARTURES/CUSTOMER SATISFACTION 100% 95% 90% 85% 80% 75% 70% 65% 60% 55% 50% % On Time Departures % Satisfied Customers * Online Automatic Reservations System (OARS) usage has increased from 18.5% % for the period 2005 through


10 OPERATING EXPENDITURE ANALYSIS* FY08 FY14 Millions $200.0 $180.0 $160.0 $140.0 $120.0 $100.0 $80.0 $60.0 $40.0 $20.0 $- $171.0 $172.5 $166.0 $158.7 $143.1 $141.6 $ General Fund Generated Revenues *Does not include $ $15.0 Million in overhaul and deferred maintenance funded through the GF Capital Budget. 10
 (in Millions) AMHS FY2014 Annual Operating Costs ($166.0) (in Millions) Passenger Service Sales $4.")

11 FY14 REVENUES & COSTS AMHS FY2014 Revenue Sources ($50.9) (in Millions) AMHS FY2014 Annual Operating Costs ($166.0) (in Millions) Passenger Service Sales $4.3 / 8% Stateroom ticket sales $5.3 / 10% Investment Interest $.2 / 1% Passenger Ticket Sales $16.6 / 33% Fuel $32.0 / 19% Commodities $8.6 / 5% Support Services $2.4 / 1% Wages $65.8 / 40% Services $16.0 / 10% Cardeck Ticket Sales $24.5 / 48% Travel $2.8 / 2% Payroll Benefits $38.4 / 23% 11
12 FY15 LOOK FORWARD Current Status: Managing to the budget Traffic numbers have improved currently 7% above FY14 Minimal mechanical casualties some weather cancellations Tariff increase of 4.5% implemented on summer 2015 schedule Dayboat Alaska Class Ferry Reservations & Manifest System 12

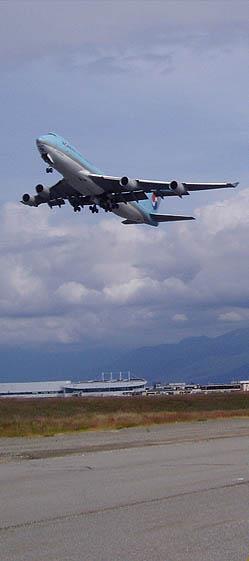
13 DAYBOAT ALASKA CLASS FERRIES Construction contract signed early October 2014 Due 2018 Ferries will be 280-feet long Seat up to 300 passengers Carry 53 standard vehicles Feature bow and stern doors Enclosed car decks Controllable pitch propellers to maximize maneuverability and efficiency. 13


14 RESERVATIONS & MANIFEST SYSTEM Project kicked off in October 2014 The system is estimated to be fully implemented by October 1, 2015 Carus works with 28 ferry operators spread over 13 countries Operators in the Baltic, UK, mainland Europe, Africa, Australia, and the US Clients cover every aspect of the ferry industry and operate virtually every type of vessel 14

15 THE CARRES SYSTEM The CarRes system will allow AMHS to: Automate check-in and boarding as needed Create routines for Customer Relationship Management Apply industry standards for business processes and streamlined operations in: Ticketing, e-tickets, and ticketless travel Check-in & boarding via the use of handheld wireless scanners to check in vehicles and passengers Automation of processes Integration with other AMHS/SOA systems 15
 228-7274 Matt.McLaren@Alaska.")
16 Questions? Captain John Falvey - General Manager Alaska DOT&PF, AMHS (907) John.Falvey@Alaska.gov Matt McLaren Business Development Mgr Alaska DOT&PF, AMHS (907) Matt.McLaren@Alaska.Gov 09/08/2011 Alaska Marine Highway System Alaska DOT&PF 16
AGENDA. 09/15/2015 Integrity Excellence Respect
 AGENDA Fiscal Year 2015 Accomplishments & Events Traffic Report Revenue Report & Historical Comparisons Fleet Update Terminal Update Budgetary Constraints Fiscal Year 2016 Operating Plan Fiscal Year 2017
ALASKA MARINE HIGHWAY FUND. Annual Financial Report 2018
 ALASKA MARINE HIGHWAY FUND Annual Financial Report 2018 For the fiscal year ended June 30, 2018 Alaska Marine Highway System Fund ANNUAL FINANCIAL REPORT For the fiscal year ended June 30, 2018 Prepared
January 2018 Air Traffic Activity Summary
 January 2018 Air Traffic Activity Summary Jan-2018 Jan-2017 CY-2018 CY-2017 Passengers 528,947 505,421 4.7% 528,947 505,421 4.7% Passengers 537,332 515,787 4.2% 537,332 515,787 4.2% Passengers 1,066,279
DTTAS Quarterly Aviation Statistics Snapshot Quarter Report
 Contents DTTAS Quarterly Aviation Statistics Snapshot Quarter 3 2018 Report 1.1 Dublin Airport Key Statistics... 1 1.2 Cork Airport Key Statistics... 3 1.3 Shannon Airport Key Statistics... 5 1.4 Total
PERFORMANCE REPORT JANUARY Keith A. Clinkscale Performance Manager
 PERFORMANCE REPORT JANUARY 2018 Keith A. Clinkscale Performance Manager INTRODUCTION/BACKGROUND Keith A. Clinkscale Performance Manager FIXED ROUTE DASHBOARD JANUARY 2018 Safety Max Target Goal Preventable
DTTAS Quarterly Aviation Statistics Snapshot Quarter Report
 Contents DTTAS Quarterly Aviation Statistics Snapshot Quarter 4 2015 Report 1.1 Dublin Airport Key Statistics... 1 1.2 Cork Airport Key Statistics... 3 1.3 Shannon Airport Key Statistics... 5 1.4 Total
DTTAS Quarterly Aviation Statistics Snapshot Quarter Report
 Contents DTTAS Quarterly Aviation Statistics Snapshot Quarter 1 2018 Report 1.1 Dublin Airport Key Statistics... 1 1.2 Cork Airport Key Statistics... 3 1.3 Shannon Airport Key Statistics... 5 1.4 Total
AK DOT/PF Overview. 11/4/2016 Alaska DOT&PF
 Alaska AK DOT/PF Overview 11/4/2016 Alaska DOT&PF 2 Alaska AKDOT/PF Overview Our mission is to "Keep Alaska Moving through service and infrastructure." 11/4/2016 Alaska DOT&PF 3 Organization REGIONAL STATISTICS
Board Box. October Item # Item Staff Page 1. Key Performance Indicators Sep 2018 M. Mungia Financial Report Aug 2018 H.
 Board Box October 2018 Item # Item Staff Page 1. Key Performance Indicators Sep 2018 M. Mungia 2-10 2. Financial Report Aug 2018 H. Rodriguez 11-15 ITEM 1 October 31, 2018 TO: FROM: RE: BOARD OF DIRECTORS
PERFORMANCE REPORT DECEMBER 2017
 PERFORMANCE REPORT DECEMBER 2017 Note: New FY2018 Goal/Target/Min or Max incorporated in the Fixed Route and Connection Dashboards. Keith A. Clinkscale Performance Manager INTRODUCTION/BACKGROUND Keith
METRO OPERATIONS COMMITTEE
 Los Angeles County Metropolitan Transportation Authority Item 1 CHIEF OPERATIONS OFFICER S S REPORT METRO OPERATIONS COMMITTEE Lonnie Mitchell Chief Operations Officer May 19, 20 1 Employee Recognition
2018 Alaska General Contractors Annual Conference ALASKA MARINE HIGHWAY SYSTEM
 2018 Alaska General Contractors Annual Conference. ALASKA MARINE HIGHWAY SYSTEM Alaska Ferry Transportation Act The first Alaska Legislature approved the Alaska Ferry Transportation Act in 1959, authorizing
MONTHLY OPERATIONS REPORT SEPTEMBER 2015
 MONTHLY OPERATIONS REPORT SEPTEMBER 215 Table of Contents SEPTEMBER 215 Section Page September Highlights... 3 Strategic Goals Progress Update... 4 Ridership... 6 Revenue... 9 Expenses... 1 System Summary...
Greater Orlando Aviation Authority Board Meeting. Wednesday, January 17, 2018
 Greater Orlando Aviation Authority Board Meeting Wednesday, Award Recognition South Terminal Complex Phase 1 and Phase 2 Planning Overview Greater Orlando Aviation Authority AGENDA PASSENGER TRAFFIC
Ferry System Governance. Presented By: EBDG Presented To: Statewide Ferry Summit Date: August 20, 2016
 Ferry System Governance Presented By: EBDG Presented To: Statewide Ferry Summit Date: August 20, 2016 AMHS Mission Statement The mission of the Alaska Marine Highway System is to provide safe, reliable,
SIA GROUP FINANCIAL RESULTS
 FINANCIAL RESULTS For Ended 30 June 2018 197200078R Operating Result Q1 Q1 Better/ FY18/19 FY17/18 R1 (Worse) ($M) ($M) (%) Total Revenue 3,844 3,864 (0.5) Q1 Better/ FY17/18 R2 (Worse) ($M) (%) 3,689
PERFORMANCE REPORT NOVEMBER 2017
 PERFORMANCE REPORT NOVEMBER 2017 Note: New FY2018 Goal/Target/Min or Max incorporated in the Fixed Route and Connection Dashboards. Keith A. Clinkscale Performance Manager INTRODUCTION/BACKGROUND In June
I T N E T R E N R A N T A I T ON O AL A L A R A R R I R VA V L A S L S A N A D N D D E D PA
 INTERNATIONAL ARRIVALS AND DEPARTURES July 2015 Government of Tonga SD18M-36 Statistical Bulletin Month of Change from Change from July 2015 Number previous month previous year All Arrivals 8,252-28.0
The Role of Visitors in Alaska s Economy Prepared for: Alaska Chamber
 The Role of Visitors in Alaska s Economy Prepared for: Alaska Chamber October 25, 2018 McDowell Group Multidisciplinary research and consulting firm since 1972 19 professional staff in Anchorage, Juneau,
MONTHLY OPERATIONS REPORT DECEMBER 2015
 MONTHLY OPERATIONS REPORT DECEMBER 215 Table of Contents DECEMBER 215 Section Page December Highlights... 3 Strategic Goals Progress Update... 4 Ridership... 6 Revenue... 9 Expenses... 1 System Summary...
2017/ Q1 Performance Measures Report
 2017/2018 - Q1 Performance Measures Report Contents Ridership & Revenue... 1 Historical Revenue & Ridership... 1 Revenue Actual vs. Planned... 3 Mean Distance Between Failures... 5 Maintenance Cost Quarter
AUGUST 2008 MONTHLY PASSENGER AND CARGO STATISTICS
 Inter-Office Memo Reno-Tahoe Airport Authority Date: October 2, 2008 To: Statistics Recipients From: Tom Medland, Director Air Service Business Development Subject: RENO-TAHOE INTERNATIONAL AIRPORT PASSENGER
Sound Transit Operations December 2014 Service Performance Report. Ridership
 Ridership Total Boardings by Mode Mode Dec-13 Dec-14 % YTD-13 YTD-14 % ST Express 1,266,130 1,396,787 10.3% 16,605,299 17,661,976 6.4% Sounder 248,710 285,016 14.6% 3,035,735 3,361,317 10.7% Tacoma Link
JET AIRWAYS (I) LTD. Presentation on Financial Results Q2 FY10
 LTD. Presentation on Financial Results Q2 FY10") JET AIRWAYS (I) LTD Presentation on Financial Results Q2 FY10 October 27, 2009 1 1 1 Agenda Domestic operating environment Jet Airways performance highlights JetLite performance highlights Outlook 2 2
JET AIRWAYS (I) LTD Presentation on Financial Results Q2 FY10 October 27, 2009 1 1 1 Agenda Domestic operating environment Jet Airways performance highlights JetLite performance highlights Outlook 2 2
Jet Airways (India) Ltd. Presentation on Annual Results FY06. May 2006
 Ltd. Presentation on Annual Results FY06. May 2006") Jet Airways (India) Ltd. Presentation on Annual Results FY06 May 2006 1 Agenda 1. Performance Highlights 2. Sahara Acquisition Update 3. Outlook 2 Performance Highlights 3 Domestic landscape capacity growth
Jet Airways (India) Ltd. Presentation on Annual Results FY06 May 2006 1 Agenda 1. Performance Highlights 2. Sahara Acquisition Update 3. Outlook 2 Performance Highlights 3 Domestic landscape capacity growth
2017/2018 Q3 Performance Measures Report. Revised March 22, 2018 Average Daily Boardings Comparison Chart, Page 11 Q3 Boardings figures revised
 2017/2018 Q3 Performance Measures Report Revised March 22, 2018 Average Daily Boardings Comparison Chart, Page 11 Q3 Boardings figures revised Contents Ridership & Revenue... 1 Historical Revenue & Ridership...
Manual vs. Automatic Operation and Operational Restrictions
 Customer Services, Operations, and Safety Committee Board Information Item IV-B March 11, 2010 Manual vs. Automatic Operation and Operational Restrictions Page 81 of 91 Washington Metropolitan Area Transit
With the completion of this project, we would like to follow-up on the projections as well as highlight a few other items:
 TO: FROM: Mayor and Council Interim City Manager Rebecca Underhill, Director of Finance DATE: February 28, 2014 SUBJECT: Water Meter Project Analysis On March 28, 2012, Acting City Manager Mike Loftin
LOUIS ARMSTRONG NEW ORLEANS INTERNATIONAL AIRPORT For the Period Ending September 30, Enplaned Passengers by Airline
 Domestic Scheduled Enplaned Passengers by Airline Alaska Airlines 7,070 4,331 63.2% 59,552 42,265 40.9% 1.2% 1.0% Virgin America 0 803-100.0% 12,231 803 1423.2% 0.3% 0.0% Allegiant Air 1,333 2,063-35.4%
Analysts Briefing. 24 June Cathay Pacific Airways Limited
 Analysts Briefing 24 June 2016 Cathay Pacific Airways Limited Operating performance - overview Challenging business environment. Load factor lower than expectations on weakening passenger demand. Strong
SAN LUIS OBISPO COUNTY REGIONAL AIRPORT ANNUAL AIRLINE PASSENGER SUMMARY SUMMARY BY YEAR AND MONTH 4/11/2018
 ANNUAL AIRLINE PASSENGER SUMMARY SUMMARY BY YEAR AND MONTH 4/11/ JAN FEB MAR IL E Y T 35,023 36,435 38,282 38,390 37,848 35,589 38,325 37,433 32,324 31,169 32,771 33,627 30,978 24,586 23,382 2017 24,586
STATISTICAL BULLETIN ON MONTHLY MIGRATION STATISTICS DECEMBER 2016 SERIES NO. SDT: 39-M 55. Government of Tonga
 SERIES NO. SDT: 39-M 55 Government of Tonga STATISTICAL BULLETIN ON MONTHLY MIGRATION STATISTICS DECEMBER 2016 Statistics Department P.O. Box 149, Nuku alofa, Kingdom of Tonga Website: www.spc.int/prism/tonga/
JET AIRWAYS (I) LTD. Presentation on Financial Results Q July 24, 2009
 LTD. Presentation on Financial Results Q July 24, 2009") JET AIRWAYS (I) LTD Presentation on Financial Results Q1 2010 July 24, 2009 1 1 1 Agenda Domestic operating environment Jet Airways performance highlights JetLite performance highlights Outlook 2 2 2 Domestic
JET AIRWAYS (I) LTD Presentation on Financial Results Q1 2010 July 24, 2009 1 1 1 Agenda Domestic operating environment Jet Airways performance highlights JetLite performance highlights Outlook 2 2 2 Domestic
PERFORMANCE REPORT DECEMBER Performance Management Office
 PERFORMANCE REPORT DECEMBER 2018 Performance Management Office INTRODUCTION/BACKGROUND Performance Management Office FIXED ROUTE DASHBOARD FY 2019 Safety Max Target Goal Preventable Collisions per 100k
Weekly Performance Update
 Pr. Rupert Vancouver Grain Monitoring Program Weekly Performance Update January, 19 For Grain (1-19 CY) Summary 1. Stocks in Store (' tonnes) Country Elevators % of Working T his Week Last Week Var. fro
Weekly Performance Update
 Pr. Rupert Vancouver Grain Monitoring Program Weekly Performance Update February 19, 19 For Grain (18-19 CY) Summary 1. Stocks in Store (' tonnes) Country Elevators % of Working T his Week Last Week Var.
North Central Regional Transit District. Quick Facts. Our Mission Statement:
 North Central Regional Transit District Our Mission Statement: The mission of the North Central Regional Transit District is to provide safe, secure and effective public transportation within North Central
U.S. DOMESTIC INDUSTRY OVERVIEW FOR MARCH
 Inter-Office Memo Reno-Tahoe Airport Authority Date: April 30, 2009 To: Statistics Recipients From: Krys T. Bart, A.A.E., President/CEO Subject: RENO-TAHOE INTERNATIONAL AIRPORT PASSENGER STATISTICS U.S.
 SCHEDULE OF REVENUES BY SOURCE September 1, 2015 - May 31, 2016 CV Transit District State Administered Program Transit Transit Aging Local Toll Total Total Excess Revenue Grant No Grant Name Federal Federal
Weekly Performance Update
 Pr. Rupert Vancouver Grain Monitoring Program Weekly Performance Update January, 19 For (1-19 CY) Summary 1. Stocks in Store (' tonnes) Country Elevators % of Working T his Week Last Week Var. fro m Last
International Visitation to the Northern Territory. Year ending June 2017
 International Visitation to the Northern Territory Year ending June 217 The following is a summary of information relevant to the Northern Territory tourism industry including visitation results from Tourism
Grain Monitoring Program
 Pr. Rupert Vancouver Grain Monitoring Program Weekly Performance Update.November, 1 For 1 (1-19 CY) Summary 1. Stocks in Store (' tonnes) Country Elevators % of Working T his Week Last Week Var. fro m
SEPTEMBER 2015 BOARD INFORMATION PACKAGE
 SEPTEMBER 2015 BOARD INFORMATION PACKAGE MEMORANDUM TO: Members of the Airport Authority FROM: Lew Bleiweis, Executive Director DATE: September 11, 2015 Financial Report (document) Informational Reports:
Singapore Airlines Group Analyst/Media Briefing HALF YEAR FY RESULTS 5 NOVEMBER 2012 THE PARENT AIRLINE 1H FY2012/13 RESULTS
 Singapore Airlines Group Analyst/Media Briefing HALF YEAR FY2012-13 13 RESULTS 5 NOVEMBER 2012 THE PARENT AIRLINE 1H FY2012/13 RESULTS THE PARENT AIRLINE COMPANY RESULTS 2Q & 1H FY12/13 2Q/12 $million
IATA FUEL EFFICIENCY CAMPAIGN
 IATA FUEL EFFICIENCY CAMPAIGN Juergen Haacker Director, Operations Montreal, IATA Fuel Efficiency Campaign Jet fuel price driving airline fuel efficiency Increased 5% from 2003-2005 Industry is on track
International Visitation to the Northern Territory. Year ending March 2017
 International Visitation to the Northern Territory Year ending March 217 The following is a summary of information relevant to the Northern Territory tourism industry including visitation results from
Naples, Marco Island, Everglades Convention and Visitors Bureau April 2013 Visitor Profile
 RESEARCH DATA SERVICES, INC. 777 SOUTH HARBOUR ISLAND BOULEVARD SUITE 260 TAMPA, FLORIDA 33602 TEL (813) 254-2975 FAX (813) 223-2986 Naples, Marco Island, Everglades Convention and Visitors Bureau April
 1 2 23 24 15 16 7 8 9 Ancillary Revenue target per pax RM55 10 Online 365 11 212 13 14 14 Quarter Ended: 31 March RM'000 Revenue 2,068,227 Operating expenses: - Staff costs (286,663) - Depreciation
LOUIS ARMSTRONG NEW ORLEANS INTERNATIONAL AIRPORT For the Period Ending August 31, Enplaned Passengers by Airline
 Enplaned Passengers by Airline Domestic Scheduled Alaska Airlines 3,797 4,077-6.9% 36,538 35,188 3.8% 1.0% 1.0% Allegiant Air 5,698 743 666.9% 41,738 14,843 181.2% 1.1% 0.4% American Airlines (US Air)
April 2012 Visitor Profile
 RESEARCH DATA SERVICES, INC. 777 SOUTH HARBOUR ISLAND BOULEVARD SUITE 260 TAMPA, FLORIDA 33602 TEL (813) 254-2975 FAX (813) 223-2986 Naples, Marco Island, Everglades Convention and Visitors Bureau April
Ferry Advisory Committee Meeting Minutes
 Ferry Advisory Committee Meeting Minutes Meeting Details: FAC: Salt Spring Island Ferry Advisory Committee Date: June 14, 2006 Location: Harbour House Hotel, Ganges Time: 6:00 p.m. Attendees: Committee
International Visitation to the Northern Territory. Year ending December 2017
 International Visitation to the Northern Territory Year ending December 2017 The following is a summary of information relevant to the Northern Territory (NT) tourism industry including visitation results
STAYING TRUE. Scotia Capital Transportation & Aerospace Conference. November 15, 2011
 STAYING TRUE Scotia Capital Transportation & Aerospace Conference November 15, 2011 FORWARD-LOOKING STATEMENT Certain information in this presentation and statements made during this presentation, including
FASTRAK PROGRESS REPORT
 FASTRAK PROGRESS REPORT JANUARY MARCH 213 The FasTrak Progress Report is prepared on a quarterly basis and is regularly distributed with the FasTrak Project Management Team (PMT) agenda and notice. A copy
APRIL 2016 BOARD INFORMATION PACKAGE
 APRIL 2016 BOARD INFORMATION PACKAGE MEMORANDUM TO: Members of the Airport Authority FROM: Lew Bleiweis, Executive Director DATE: April 8, 2016 Financial Report (document) Informational Reports: A. February,
AIRPORTS DIVISION. The Hawaii Airports System Is Self-Supporting
 AIRPORTS DIVISION Department of Transportation AIRPORTS DIVISION The Hawaii Airports System Is Self-Supporting The State of Hawaii s General Fund (tax revenues) does not fund the operation of the Airports
Cathay Pacific Airways 2011 Analyst Briefing 23 June 2011
 Cathay Pacific Airways 2011 Analyst Briefing 23 June 2011 1 Airline Strategy Grow our international network, expand frequencies and further develop Hong Kong as one of the world s leading aviation hubs
International Visitation to the Northern Territory. Year ending September 2017
 International Visitation to the Northern Territory Year ending September 2017 The following is a summary of information relevant to the Northern Territory (NT) tourism industry including visitation results
December 2013 Passenger and Cargo Traffic Statistics Reno-Tahoe International Airport
 December 2013 Passenger and Cargo Traffic Statistics Reno-Tahoe International Airport January 24, 2014 U.S. DOMESTIC INDUSTRY OVERVIEW FOR DECEMBER 2013 All RNO Carriers Domestic Systemwide year over year
August 2014 Passenger and Cargo Traffic Statistics Reno-Tahoe International Airport
 August 2014 Passenger and Cargo Traffic Statistics Reno-Tahoe International Airport October 8, 2014 U.S. DOMESTIC INDUSTRY OVERVIEW FOR AUGUST 2014 All RNO Carriers Domestic Systemwide year over year comparison
FASTRAK PROGRESS REPORT
 FASTRAK PROGRESS REPORT OCTOBER DECEMBER 212 The FasTrak Progress Report is prepared on a quarterly basis and is regularly distributed with the FasTrak Project Management Team (PMT) agenda and notice.
DECEMBER2014. InternationalVisitorArrivalstoBC. CanadianRe-entriestoBC. TravelPartiestoVisitorCentresbyRegion
 Research,Planning&Evaluation Page1 USTotal USOvernight Europe Asia/Pacific International Overnight - - - 4,453,346 245,014 286,729 444,425 727,196 703,547 574,646 442,525 286,160 269,439 237,541 236,124
Presentation to the Portfolio Committee on Transport by the Director of Civil Aviation Captain Colin Jordaan. 22 October 2010
 Presentation to the Portfolio Committee on Transport by the Director of Civil Aviation Captain Colin Jordaan 22 October 2010 SACAA Mandate The South African Civil Aviation Authority (SACAA) is an agency
JET AIRWAYS (I) LTD. Presentation on Financial Results Q3 2012
 LTD. Presentation on Financial Results Q3 2012") JET AIRWAYS (I) LTD Presentation on Financial Results Q3 2012 20.01.2012 1 1 1 Domestic operating environment 2 2 2 Domestic industry. 8.00 7.00 6.00 5.00 4.00 3.00 Q3 12 vs Q3 11 Industry capacity 17%
JET AIRWAYS (I) LTD Presentation on Financial Results Q3 2012 20.01.2012 1 1 1 Domestic operating environment 2 2 2 Domestic industry. 8.00 7.00 6.00 5.00 4.00 3.00 Q3 12 vs Q3 11 Industry capacity 17%
Passenger and Cargo Statistics Report
 Passenger and Cargo Statistics Report RenoTahoe International Airport August 2015 U.S. DOMESTIC INDUSTRY OVERVIEW FOR AUGUST 2015 All RNO Carriers Domestic Systemwide year over year comparison Average
Analyst Briefing. 12 June Cathay Pacific Airways Limited
 Analyst Briefing 12 June 2015 Cathay Pacific Airways Limited Operating Performance The positive operating environment continues into the first half of 2015. Robust passenger demand and healthy cargo demand.
Oasis Palm **** (Cancún)
") EMAIL season 02JAN17 21FEB17 CheckIn 3:00 PM CheckOut 12:00 AM MoSu 147,15 196,20 283,40 370,60 011,99 Inclusive 011,99 Inclusive halfboard fullboard MoSu All above mentioned rates must be markedup with
EMAIL season 02JAN17 21FEB17 CheckIn 3:00 PM CheckOut 12:00 AM MoSu 147,15 196,20 283,40 370,60 011,99 Inclusive 011,99 Inclusive halfboard fullboard MoSu All above mentioned rates must be markedup with
Passenger and Cargo Statistics Report
 Passenger and Cargo Statistics Report RenoTahoe International Airport June 2017 U.S. DOMESTIC INDUSTRY OVERVIEW FOR JUNE 2017 All RNO Carriers Domestic Systemwide year over year comparison Average Load
DASHBOARD DEC YOUR MONTHLY UPDATE FOR IOWA ONE CALL
 Executive Summary Per the Board s request, we have added this Executive Summary to the Monthly Dashboard. We ll be including it from now on. It will provide you with a running total of the number of tickets
JANUARY 2017 BOARD INFORMATION PACKAGE
 JANUARY 2017 BOARD INFORMATION PACKAGE MEMORANDUM TO: Members of the Airport Authority FROM: Lew Bleiweis, Executive Director DATE: January 13, 2017 Financial Report (document) Informational Reports: A.
GREATER BOISE AUDITORIUM DISTRICT REGULAR BOARD MEETING OF THE BOARD OF DIRECTORS. AGENDA Revised. September 20, 2016
 GREATER BOISE AUDITORIUM DISTRICT REGULAR BOARD MEETING OF THE BOARD OF DIRECTORS AGENDA Revised September 20, 2016 BOISE CENTRE Willows Room 2:00 p.m. I. Call to Order II. III. IV. Changes or Additions
Capital Metropolitan Transportation Authority. Monthly Performance Report
 Capital Metropolitan Transportation Authority Monthly Performance Report SEPTEMBER 2010 Ridership Report Budget to Actual Ridership Budget Target: 2,335,906 Actual: 2,291,235 Ridership Comparison Fiscal
Montie Brewer, President and CEO Joshua Koshy, Executive VP and CFO UBS Transport Conference
 Montie Brewer, President and CEO Joshua Koshy, Executive VP and CFO UBS Transport Conference 1 London, England September 17, 2007 Agenda Strongly positioned international airline Investment proposition
Grand Oasis Palm **** (Cancún)
") EMAIL season 02JAN17 21FEB17 CheckIn 3:00 PM CheckOut 12:00 AM MoSu 168,95 239,80 348,80 011,99 Inclusive 011,99 Inclusive MoSu 176,58 255,06 371,69 011,99 Inclusive 011,99 Inclusive Continental halfboard
EMAIL season 02JAN17 21FEB17 CheckIn 3:00 PM CheckOut 12:00 AM MoSu 168,95 239,80 348,80 011,99 Inclusive 011,99 Inclusive MoSu 176,58 255,06 371,69 011,99 Inclusive 011,99 Inclusive Continental halfboard
JANUARY 2018 BOARD INFORMATION PACKAGE
 JANUARY 2018 BOARD INFORMATION PACKAGE MEMORANDUM TO: Members of the Airport Authority FROM: Lew Bleiweis, Executive Director DATE: January 19, 2018 Financial Report (document) Informational Reports: A.
STATISTICAL BULLETIN ON INTERNATIONAL ARRIVALS, DEPARTURES AND MIGRATION 2011 SERIES NO. SDT: Government of Tonga
 SERIES NO. SDT: 38-13 Government of Tonga STATISTICAL BULLETIN ON INTERNATIONAL ARRIVALS, DEPARTURES AND MIGRATION 2011 Statistics Department, P.O. Box 149, Nuku alofa, Kingdom of Tonga Website: www.spc.int/prism/tonga/
May 2011 Passenger and Cargo Traffic Statistics Reno-Tahoe International Airport
 May 2011 Passenger and Cargo Traffic Statistics Reno-Tahoe International Airport July 5, 2011 U.S. DOMESTIC INDUSTRY OVERVIEW FOR MAY 2011 All RNO Carriers Systemwide year over year comparison Average
U.S. DOMESTIC INDUSTRY OVERVIEW FOR OCTOBER 2010 All RNO Carriers Systemwide year over year comparison
 Inter-Office Memo Reno-Tahoe Airport Authority Date: November 22, 2010 To: Chairman and Board of Trustees From: Krys T. Bart, A.A.E., President/CEO Subject: RENO-TAHOE INTERNATIONAL AIRPORT OCTOBER 2010
Passenger and Cargo Statistics Report
 Passenger and Cargo Statistics Report Reno-Tahoe International Airport December 2014 U.S. DOMESTIC INDUSTRY OVERVIEW FOR DECEMBER 2014 All RNO Carriers Domestic Systemwide year over year comparison Average
SAS Group Q Teleconference
 SAS Group Q4 2012 Teleconference December 12, 2012 1 Break-even result in 2012 despite 1.6 bn SEK higher fuel cost 23 MSEK EBT (before non-recurring items) despite 1.6 bn SEK higher fuel cost Positive
AUGUST2014. InternationalVisitorArrivalstoBC. CanadianRe-entriestoBC. TravelPartiestoVisitorCentresbyRegion. Jan Feb Mar Apr May Jun YTD USTotal
 Research,Planning&Evaluation Page1 USTotal USOvernight Europe Asia/Pacific International Overnight -.9% 7.8% - -1.% 2,46,435 574,646 442,525 286,16 269,439 237,541 236,124 3.4% - 8.8% 7.7% - 9.7% 1,3,364
AVSP 7 Summer Section 1: Executive Summary
 AVSP 7 Summer 2016 Section 1: Executive Summary Introduction AVSP Overview The Alaska Visitor Statistics Program (AVSP) is a statewide visitor study periodically commissioned by the Alaska Department of
FIXED ROUTE DASHBOARD JULY 2018
 FIXED ROUTE DASHBOARD JULY 2018 Safety Max Target Goal Preventable Collisions per 100k Miles Non-Preventable Collisions per 100k Miles Total Incidents per 10,000 Boardings 1.6 1.3 0.8 2.63 2.1 2.0 1.60
Performance Metrics for Oceanic Air Traffic Management. Moving Metrics Conference Pacific Grove, California January 29, 2004 Oceanic Metrics Team
 Performance Metrics for Oceanic Air Traffic Management Moving Metrics Conference Pacific Grove, California January 29, 2004 Oceanic Metrics Team Agenda Metrics Team Michele Merkle, FAA AUA-600 Lynne Hamrick,
Inter-Office Memo Reno-Tahoe Airport Authority
 Inter-Office Memo Reno-Tahoe Airport Authority Date: November 30, 2009 To: Statistics Recipients From: Krys T. Bart, A.A.E., President/CEO Subject: RENO-TAHOE INTERNATIONAL AIRPORT PASSENGER STATISTICS
JET AIRWAYS (I) LTD. Presentation on Financial Results Q4 FY08
 LTD. Presentation on Financial Results Q4 FY08") JET AIRWAYS (I) LTD Presentation on Financial Results Q4 FY08 June 24, 2008 1 1 1 Agenda Domestic operating environment Jet Airways performance highlights JetLite performance highlights Consolidated Jet
JET AIRWAYS (I) LTD Presentation on Financial Results Q4 FY08 June 24, 2008 1 1 1 Agenda Domestic operating environment Jet Airways performance highlights JetLite performance highlights Consolidated Jet
October 2013 Passenger and Cargo Traffic Statistics Reno-Tahoe International Airport
 October 2013 Passenger and Cargo Traffic Statistics Reno-Tahoe International Airport December 4, 2013 U.S. DOMESTIC INDUSTRY OVERVIEW FOR OCTOBER 2013 All RNO Carriers Systemwide year over year comparison
November 2013 Passenger and Cargo Traffic Statistics Reno-Tahoe International Airport
 November 2013 Passenger and Cargo Traffic Statistics Reno-Tahoe International Airport December 26, 2013 U.S. DOMESTIC INDUSTRY OVERVIEW FOR NOVEMBER 2013 All RNO Carriers Domestic Systemwide year over
Corporate presentation CIBC Whistler Institutional Investor Conference January 21, 2010
 Corporate presentation CIBC Whistler Institutional Investor Conference January 21, 2010 Forwardlooking statement Certain information in this presentation and statements made during this presentation, including
SYSTEM BRIEF DAILY SUMMARY
 SYSTEM BRIEF SUMMARY * ANNUAL (PEAK HOURS 7:00 AM TO 10:00 PM MON-SAT) MaxTemp NEL (MWH) Hr Ending Hr Ending LOAD ENERGY (MWH) INCREMENTAL COST DAY DATE Civic TOTAL MAXIMUM @Max MINIMUM @Min FACTOR ON
CWC LA - Cash Balance (January 2012)
") CWC LA - Cash Balance 2012-13 (January 2012) 1,200,000 Cash Balance 1,000,000 800,000 ($1,000s) 600,000 400,000 200,000 - CWC LA - Actuals/Projected CWC LA - ed (Nov) 1 1 CWC Hollywood - Financial Dashboard
CWC LA - Cash Balance 2012-13 (January 2012) 1,200,000 Cash Balance 1,000,000 800,000 ($1,000s) 600,000 400,000 200,000 - CWC LA - Actuals/Projected CWC LA - ed (Nov) 1 1 CWC Hollywood - Financial Dashboard
Monthly Airport Passenger Activity Summary. December 2011
 T F Green Airport 01/17/12 Monthly Airport Passenger Activity Summary December 2011 Calendar Year Basis Year Year December December Percent to Date to Date Percent 2011 2010 Change 2011 2010 Change Enplaned
U.S. DOMESTIC INDUSTRY OVERVIEW FOR MAY 2009
 Inter-Office Memo Reno-Tahoe Airport Authority Date: June 30, 2009 To: Statistics Recipients From: Krys T. Bart, A.A.E., President/CEO Subject: RENO-TAHOE INTERNATIONAL AIRPORT PASSENGER STATISTICS U.S.
AVSP 7 Summer Section 9: Summary Profiles - Fly/Drive, Highway, Ferry, and Campground Users
 AVSP 7 Summer 2016 Section 9: Summary Profiles - Fly/Drive, Highway, Ferry, and Summary Profile: Highway, Ferry, and This chapter profiles the highway, ferry, and campground user markets. Definitions and
CORPORATE STEVE BOOKING SMITH CHANNELS
 JAPAN AIRLINES: NAVIGATING THE FUTURE Steve Myer, Tokyo September 30, 2016 CORPORATE STEVE BOOKING SMITH CHANNELS VICE PRESIDENT, GLOBAL & STRATEGIC SALES, THE AMERICAS SEPTEMBER 20, 2016 RENO, NEVADA
November 2011 Visitor Profile
 RESEARCH DATA SERVICES, INC. 777 SOUTH HARBOUR ISLAND BOULEVARD SUITE 260 TAMPA, FLORIDA 33602 TEL (813) 254-2975 FAX (813) 223-2986 Naples, Marco Island, Everglades Convention and Visitors Bureau November
Grand Oasis Cancún ***** (Cancún)
") EMAIL season 02JAN17 21FEB17 CheckIn 3:00 PM CheckOut 12:00 AM MoSu 174,40 250,70 365,15 011,99 Inclusive 011,99 Inclusive MoSu 182,03 265,96 388,04 011,99 Inclusive 011,99 Inclusive MoSu 189,66 281,22
EMAIL season 02JAN17 21FEB17 CheckIn 3:00 PM CheckOut 12:00 AM MoSu 174,40 250,70 365,15 011,99 Inclusive 011,99 Inclusive MoSu 182,03 265,96 388,04 011,99 Inclusive 011,99 Inclusive MoSu 189,66 281,22
Wheat Reference Prices Port Terminal Services 2017/2018
 Reference Prices Terminal Services 2017/2018 1. INTRODUCTION This document sets out a summary of Viterra s Reference Prices that are payable in respect of the provision of Terminal Services for Bulk for
AUCKLAND DESTINATION OVERVIEW
 AUCKLAND DESTINATION OVERVIEW JULY 218 An in-depth overview of Auckland s visitor economy from the latest arrival, accommodation, spend and cruise data through to past five-year commentary. Prepared August
Driving Ridership Strategic Partnerships
 Driving Ridership Strategic Partnerships Feb 29, 2012 Presented by Priya Bhasin-Singh, Strategic Marketing Associate priya.bhasin-singh@edmonton.ca 2012 APTA Marketing & Communications Conference About