Motor neurone disease in England 1996 to A geographical profile of mortality.
|
|
|
- Primrose Bell
- 5 years ago
- Views:
Transcription
1
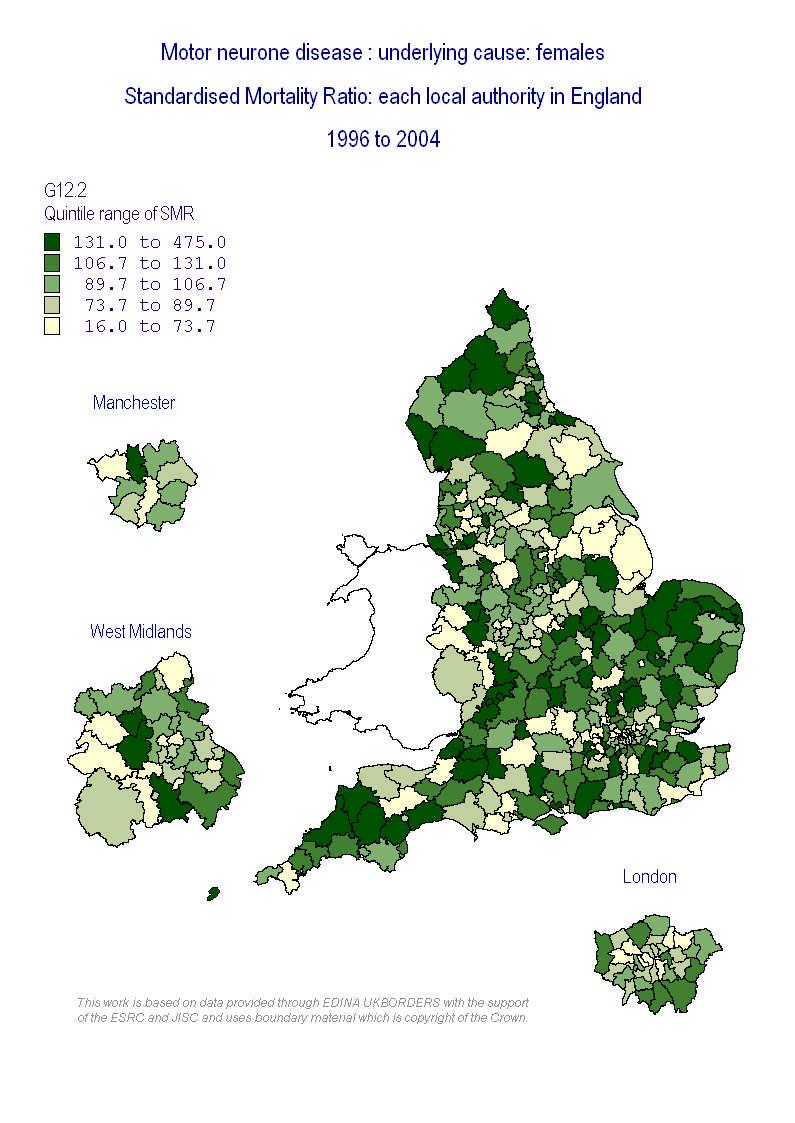
2 Motor neurone disease in England 1996 to A geographical profile of mortality. Authors: Michael Goldacre, David Yeates, Leicester Gill, Myfanwy Griffith, Henry McGuinness, Daniel Meddings Published by: Unit of Health-Care Epidemiology, Oxford University, and South East England Public Health Observatory, 2005 This document provides a geographical profile of mortality from motor neurone disease in England. The geographical areas covered are the standard local authority areas of England. The period covered is January to December The data are analysed from mortality files supplied to the Public Health Observatories by the Office for National Statistics. This analysis includes mortality data about males and females of all ages. The maps, charts and tables show both-sexes-combined and sex-specific results, including standardised mortality ratios (SMRs). The first set provides the data for males and females combined, the second for males, and the third for females. Within each set, the data in the map are shown as quintiles of local authorities, with the one-fifth of local authorities with the lowest SMRs shown in the lightest colour and the one-fifth of local authorities with the highest SMRs shown in the darkest colour. The error-bar chart provides a plot of the values of the SMR for each local authority area. Each vertical line represents one local authority area. It shows the point estimate for the SMR for the area with its 95% confidence. At a glance, the error-bar charts show the spread of SMRs across England and the extent to which variation across the country is statistically significant.
3 The scatter-plot shows the SMR for each local authority area plotted against the local authorities score for the Index of Multiple Deprivation (IMD 2004). Within each set, the first table shows the individual values of SMRs for each local authority, with the local authorities ranked in alphabetical order. For each local authority, the information in the table provides data about mortality showing the observed number of people who died (Obs.); the expected number (Exp.), obtained by applying national age-sex-specific rates to the age-sex distribution of the local authority population; and the SMR, calculated by indirect standardisation, with the 95% lower and upper confidence limits for the rate. The first part of the first table shows SMRs for the disease as the underlying cause of death. The second part shows SMRs for the disease as any mention. The second table shows the local authority areas ranked according to the value of the SMR (ranked from lowest to highest ratio) for the disease as the underlying cause. The third table shows the local authority areas ranked according to the value of the SMR (ranked from lowest to highest ratio) for mentions. Some technical notes: Dataset used: UHCE-built file from SEPHO, template 6 Diagnosis codes used: ICD ; ICD10 G12.2 Diagnosis position: underlying cause; and al mentions Period covered: deaths from to Age/sex restriction: all ages, both sexes Place of residence at time of death: England
4 We are very grateful for technical and clerical support from Susan Flynn and for statistical advice from Valerie Seagroatt. David Yeates, Leicester Gill, Myfanwy Griffith, Susan Flynn and Valerie Seagroatt are funded by the NHS National Centre for Research Capacity Development. Henry McGuinness and Daniel Meddings are funded by the South East England Public Health Observatory. Copyright UHCE Oxford University and South East England Public Health Observatory. The maps are based on data provided through EDINA UKBORDERS with the support of the ESRC and JISC and use boundary material which is copyright of the Crown. Source: 2001 Census Output Area Boundaries. Crown copyright Crown copyright material is reproduced with the permission of the Controller of HMSO.
5
6
7 Motor neurone disease : average IMD score plotted against the SMR (underlying cause) for each local authority, Males y = x R 2 = Average IMD 2004 score SMR per population
8 Motor neurone disease :SMR (underlying cause) for each local authority, Males 450 SMR per 100,000 with 95% confidence s local authorities
9 Label Mortality to 2004 IMD 2004: Average Score Underlying cause Motor neurone disease, all ages, Males Mentions StHA GOR Obs. Exp. SMR Obs. Exp. SMR Ratio mentions to underlyin g cause N/A ALL ENGLAND UB Adur 17.0 Q19 J UB Allerdale 22.9 Q13 B UB Alnwick 16.1 Q09 A UB Amber Valley 18.9 Q24 E UC Arun 15.6 Q19 J UB Ashfield 27.8 Q24 E UB Ashford 13.4 Q18 J UB Aylesbury Vale 8.3 Q16 J UB Babergh 11.3 Q01 G AB Barking and Dagenham 31.3 Q06 H AC Barnet 16.1 Q05 H CC Barnsley 33.0 Q23 D UC Barrow-In-Furness 33.0 Q13 B UB Basildon 20.7 Q03 G UB Basingstoke and Deane 8.8 Q17 J UC Bassetlaw 25.7 Q24 E HA Bath and North East Somerset UA 12.2 Q20 K UD Bedford 17.5 Q02 G UC Berwick-upon-Tweed 21.2 Q09 A AD Bexley 15.0 Q07 H CN Birmingham 37.6 Q27 F UB Blaby 8.7 Q25 E EX Blackburn with Darwen UA 32.3 Q13 B EY Blackpool UA 33.9 Q13 B UD Blyth Valley 26.1 Q09 A UC Bolsover 30.5 Q24 E BL Bolton 29.4 Q14 B UB Boston 21.9 Q24 E HN Bournemouth UA 23.7 Q22 K MA Bracknell Forest UA 8.6 Q16 J CX Bradford 32.9 Q12 D UC Braintree 13.2 Q03 G
10 Label Mortality to 2004 IMD 2004: Average Score Underlying cause Motor neurone disease, all ages, Males Mentions StHA GOR Obs. Exp. SMR Obs. Exp. SMR Ratio mentions to underlyin g cause N/A ALL ENGLAND UB Breckland 14.5 Q01 G AE Brent 26.0 Q04 H UD Brentwood 8.9 Q03 G UB Bridgnorth 12.3 Q26 F ML Brighton and Hove UA 25.7 Q19 J HB Bristol, City of UA 27.7 Q20 K UC Broadland 9.6 Q01 G AF Bromley 13.2 Q07 H UB Bromsgrove 10.1 Q28 F UB Broxbourne 14.7 Q02 G UD Broxtowe 16.0 Q24 E UD Burnley 31.8 Q13 B BM Bury 23.5 Q14 B CY Calderdale 25.4 Q12 D UB Cambridge 14.6 Q01 G AG Camden 34.7 Q05 H UB Cannock Chase 20.3 Q26 F UC Canterbury 16.2 Q18 J UB Caradon 18.4 Q21 K UD Carlisle 22.2 Q13 B UC Carrick 19.2 Q21 K UE Castle Morpeth 15.8 Q09 A UC Charnwood 12.1 Q25 E UF Chelmsford 8.6 Q03 G UB Cheltenham 14.4 Q20 K UB Cherwell 11.2 Q16 J UB Chester 17.0 Q15 B UD Chesterfield 27.1 Q24 E UB Chester-Le-Street 21.4 Q10 A UD Chichester 10.7 Q19 J UC Chiltern 6.2 Q16 J UE Chorley 17.2 Q13 B
11 Label Mortality to 2004 IMD 2004: Average Score Underlying cause Motor neurone disease, all ages, Males Mentions StHA GOR Obs. Exp. SMR Obs. Exp. SMR Ratio mentions to underlyin g cause N/A ALL ENGLAND UC Christchurch 12.6 Q22 K UG Colchester 14.6 Q03 G UC Congleton 9.5 Q15 B UE Copeland 25.7 Q13 B UB Corby 27.1 Q25 E UC Cotswold 8.8 Q20 K CQ Coventry 28.2 Q28 F UB Craven 11.9 Q11 D UE Crawley 14.8 Q19 J UD Crewe and Nantwich 17.1 Q15 B AH Croydon 19.9 Q08 H UC Dacorum 9.5 Q02 G EH Darlington UA 24.6 Q10 A UD Dartford 17.2 Q18 J UC Daventry 10.2 Q25 E FK Derby UA 27.7 Q24 E UF Derbyshire Dales 12.5 Q24 E UD Derwentside 28.2 Q10 A CE Doncaster 31.5 Q23 D UE Dover 18.7 Q18 J CR Dudley 22.1 Q27 F UE Durham 18.5 Q10 A AJ Ealing 23.4 Q04 H UF Easington 41.8 Q10 A UC East Cambridgeshire 10.6 Q01 G UB East Devon 12.7 Q21 K UD East Dorset 8.2 Q22 K UC East Hampshire 8.1 Q17 J UD East Hertfordshire 6.3 Q02 G UC East Lindsey 24.6 Q24 E UD East Northamptonshire 11.8 Q25 E FB East Riding of Yorkshire UA 15.3 Q11 D
12 Label Mortality to 2004 IMD 2004: Average Score Underlying cause Motor neurone disease, all ages, Males Mentions StHA GOR Obs. Exp. SMR Obs. Exp. SMR Ratio mentions to underlyin g cause N/A ALL ENGLAND UC East Staffordshire 18.5 Q26 F UC Eastbourne 21.5 Q19 J UD Eastleigh 8.9 Q17 J UE Ellesmere Port and Neston 19.8 Q15 B UB Elmbridge 7.0 Q19 J AK Enfield 23.1 Q05 H UH Epping Forest 13.3 Q03 G UC Epsom and Ewell 6.9 Q19 J UG Erewash 19.3 Q24 E UC Exeter 21.6 Q21 K UE Fareham 7.8 Q17 J UD Fenland 19.8 Q01 G UC Forest Heath 11.1 Q01 G UD Forest of Dean 15.9 Q20 K UF Fylde 13.1 Q13 B CH Gateshead 33.2 Q09 A UE Gedling 16.4 Q24 E UE Gloucester 19.9 Q20 K UF Gosport 16.3 Q17 J UG Gravesham 18.1 Q18 J UD Great Yarmouth 27.7 Q01 G AL Greenwich 31.5 Q07 H UD Guildford 8.3 Q19 J AM Hackney 45.1 Q06 H ET Halton UA 34.3 Q15 B UC Hambleton 10.4 Q11 D AN Hammersmith and Fulham 27.8 Q04 H UD Harborough 7.2 Q25 E AP Haringey 37.7 Q05 H UJ Harlow 21.4 Q03 G UD Harrogate 11.1 Q11 D AQ Harrow 13.5 Q04 H
13 Label Mortality to 2004 IMD 2004: Average Score Underlying cause Motor neurone disease, all ages, Males Mentions StHA GOR Obs. Exp. SMR Obs. Exp. SMR Ratio mentions to underlyin g cause N/A ALL ENGLAND UG Hart 4.2 Q17 J EB Hartlepool UA 37.7 Q10 A UD Hastings 31.7 Q19 J UH Havant 20.1 Q17 J AR Havering 14.8 Q06 H GA Herefordshire, County of UA 15.7 Q28 F UE Hertsmere 12.0 Q02 G UH High Peak 15.1 Q24 E AS Hillingdon 17.7 Q04 H UE Hinckley and Bosworth 11.1 Q25 E UF Horsham 6.7 Q19 J AT Hounslow 23.3 Q04 H UE Huntingdonshire 10.2 Q01 G UG Hyndburn 28.5 Q13 B UD Ipswich 23.4 Q01 G MW Isle of Wight UA 21.1 Q17 J AU Islington 42.7 Q05 H UB Kennet 10.1 Q20 K AW Kensington and Chelsea 21.5 Q04 H UD Kerrier 25.2 Q21 K UE Kettering 15.3 Q25 E UE Kings Lynn and West Norfolk 19.1 Q01 G FA Kingston upon Hull, City of UA 41.1 Q11 D AX Kingston upon Thames 11.6 Q08 H CZ Kirklees 26.2 Q12 D BX Knowsley 46.6 Q15 B AY Lambeth 34.2 Q07 H UH Lancaster 22.3 Q13 B DA Leeds 27.7 Q12 D FN Leicester UA 32.8 Q25 E UF Lewes 12.9 Q19 J AZ Lewisham 28.6 Q07 H
14 Label Mortality to 2004 IMD 2004: Average Score Underlying cause Motor neurone disease, all ages, Males Mentions StHA GOR Obs. Exp. SMR Obs. Exp. SMR Ratio mentions to underlyin g cause N/A ALL ENGLAND UD Lichfield 12.0 Q26 F UD Lincoln 27.2 Q24 E BY Liverpool 49.8 Q15 B KA Luton UA 23.3 Q02 G UG Macclesfield 11.1 Q15 B UH Maidstone 11.5 Q18 J UK Maldon 10.7 Q03 G UC Malvern Hills 13.1 Q28 F BN Manchester 48.9 Q14 B UF Mansfield 32.5 Q24 E LC Medway UA 18.0 Q18 J UG Melton 10.1 Q25 E UB Mendip 14.5 Q22 K BA Merton 14.5 Q08 H UC Mid Bedfordshire 7.7 Q02 G UD Mid Devon 17.1 Q21 K UE Mid Suffolk 9.8 Q01 G UG Mid Sussex 6.4 Q19 J EC Middlesborough UA 40.7 Q10 A MG Milton Keynes UA 15.6 Q16 J UE Mole Valley 6.2 Q19 J UJ New Forest 10.4 Q17 J UG Newark and Sherwood 19.8 Q24 E CJ Newcastle upon Tyne 34.5 Q09 A UE Newcastle-under-Lyme 19.9 Q26 F BB Newham 40.4 Q06 H UE North Cornwall 22.8 Q21 K UE North Devon 20.6 Q21 K UE North Dorset 11.4 Q22 K UJ North East Derbyshire 18.9 Q24 E FC North East Lincolnshire UA 29.4 Q11 D UF North Hertfordshire 10.1 Q02 G
15 Label Mortality to 2004 IMD 2004: Average Score Underlying cause Motor neurone disease, all ages, Males Mentions StHA GOR Obs. Exp. SMR Obs. Exp. SMR Ratio mentions to underlyin g cause N/A ALL ENGLAND UE North Kesteven 11.5 Q24 E FD North Lincolnshire UA 21.2 Q11 D UF North Norfolk 16.9 Q01 G UC North Shropshire 16.6 Q26 F HC North Somerset UA 14.1 Q20 K CK North Tyneside 26.0 Q09 A UB North Warwickshire 16.4 Q28 F UH North West Leicestershire 15.9 Q25 E UC North Wiltshire 8.4 Q20 K UF Northampton 20.2 Q25 E UG Norwich 28.3 Q01 G FY Nottingham UA 41.8 Q24 E UC Nuneaton and Bedworth 21.2 Q28 F UJ Oadby and Wigston 9.7 Q25 E BP Oldham 30.7 Q14 B UD Oswestry 17.1 Q26 F UC Oxford 19.7 Q16 J UJ Pendle 27.6 Q13 B UF Penwith 29.0 Q21 K JA Peterborough UA 23.4 Q01 G HG Plymouth UA 26.2 Q21 K HP Poole UA 14.3 Q22 K MR Portsmouth UA 24.9 Q17 J UK Preston 28.5 Q13 B UG Purbeck 12.6 Q22 K MC Reading UA 18.8 Q16 J BC Redbridge 17.8 Q06 H EE Redcar and Cleveland UA 30.6 Q10 A UD Redditch 19.4 Q28 F UF Reigate and Banstead 9.0 Q19 J UG Restormel 23.9 Q21 K UL Ribble Valley 10.3 Q13 B
16 Label Mortality to 2004 IMD 2004: Average Score Underlying cause Motor neurone disease, all ages, Males Mentions StHA GOR Obs. Exp. SMR Obs. Exp. SMR Ratio mentions to underlyin g cause N/A ALL ENGLAND BD Richmond upon Thames 9.7 Q08 H UE Richmondshire 12.5 Q11 D BQ Rochdale 33.7 Q14 B UL Rochford 8.7 Q03 G UM Rossendale 24.1 Q13 B UG Rother 16.2 Q19 J CF Rotherham 28.2 Q23 D UD Rugby 13.6 Q28 F UG Runnymede 7.8 Q19 J UJ Rushcliffe 9.0 Q24 E UL Rushmoor 10.4 Q17 J FP Rutland UA 6.6 Q25 E UF Ryedale 12.9 Q11 D BR Salford 38.2 Q14 B UD Salisbury 11.8 Q20 K CS Sandwell 35.4 Q27 F UG Scarborough 24.1 Q11 D UG Sedgefield 29.1 Q10 A UC Sedgemoor 17.4 Q22 K CA Sefton 26.1 Q15 B UH Selby 13.1 Q11 D UK Sevenoaks 9.6 Q18 J CG Sheffield 28.4 Q23 D UL Shepway 20.8 Q18 J UE Shrewsbury and Atcham 15.7 Q26 F CT Solihull 16.4 Q27 F UE South Bedfordshire 12.3 Q02 G UE South Bucks 8.1 Q16 J UG South Cambridgeshire 6.4 Q01 G UK South Derbyshire 14.8 Q24 E HD South Gloucestershire UA 9.8 Q20 K UG South Hams 14.2 Q21 K
17 Label Mortality to 2004 IMD 2004: Average Score Underlying cause Motor neurone disease, all ages, Males Mentions StHA GOR Obs. Exp. SMR Obs. Exp. SMR Ratio mentions to underlyin g cause N/A ALL ENGLAND UF South Holland 15.3 Q24 E UG South Kesteven 12.2 Q24 E UG South Lakeland 12.0 Q13 B UH South Norfolk 10.7 Q01 G UG South Northamptonshire 6.6 Q25 E UD South Oxfordshire 7.7 Q16 J UN South Ribble 14.0 Q13 B UF South Shropshire 15.5 Q26 F UD South Somerset 13.7 Q22 K UF South Staffordshire 11.7 Q26 F CL South Tyneside 33.1 Q09 A MS Southampton UA 23.7 Q17 J KF Southend-On-Sea UA 21.7 Q03 G BE Southwark 35.4 Q07 H UH Spelthorne 10.4 Q19 J UG St. Albans 7.7 Q02 G UF St. Edmundsbury 11.5 Q01 G BZ St. Helens 32.0 Q15 B UG Stafford 12.9 Q26 F UH Staffordshire Moorlands 16.5 Q26 F UH Stevenage 15.6 Q02 G BS Stockport 18.1 Q14 B EF Stockton-On-Tees UA 26.3 Q10 A GL Stoke-On-Trent UA 35.3 Q26 F UE Stratford-On-Avon 8.8 Q28 F UF Stroud 10.2 Q20 K UG Suffolk Coastal 11.5 Q01 G CM Sunderland 34.2 Q09 A UJ Surrey Heath 4.9 Q19 J BF Sutton 13.3 Q08 H UM Swale 20.9 Q18 J HX Swindon UA 17.2 Q20 K
18 Label Mortality to 2004 IMD 2004: Average Score Underlying cause Motor neurone disease, all ages, Males Mentions StHA GOR Obs. Exp. SMR Obs. Exp. SMR Ratio mentions to underlyin g cause N/A ALL ENGLAND BT Tameside 29.8 Q14 B UK Tamworth 19.7 Q26 F UK Tandridge 8.3 Q19 J UE Taunton Deane 16.3 Q22 K UH Teesdale 16.4 Q10 A UH Teignbridge 17.0 Q21 K GF Telford and Wrekin UA 21.8 Q26 F UN Tendring 23.1 Q03 G UN Test Valley 8.7 Q17 J UG Tewkesbury 10.1 Q20 K UN Thanet 25.6 Q18 J UJ Three Rivers 9.4 Q02 G KG Thurrock UA 21.2 Q03 G UP Tonbridge and Malling 9.6 Q18 J HH Torbay UA 23.7 Q21 K UK Torridge 21.4 Q21 K BG Tower Hamlets 45.9 Q06 H BU Trafford 20.2 Q14 B UQ Tunbridge Wells 10.5 Q18 J UF Tynedale 15.5 Q09 A UQ Uttlesford 6.7 Q03 G UE Vale of White Horse 6.9 Q16 J UH Vale Royal 17.1 Q15 B DB Wakefield 29.1 Q12 D CU Walsall 29.4 Q27 F BH Waltham Forest 30.2 Q06 H BJ Wandsworth 20.9 Q08 H UG Wansbeck 30.5 Q09 A EU Warrington UA 19.4 Q15 B UF Warwick 12.6 Q28 F UK Watford 14.5 Q02 G UH Waveney 21.8 Q01 G
19 Label Mortality to 2004 IMD 2004: Average Score Underlying cause Motor neurone disease, all ages, Males Mentions StHA GOR Obs. Exp. SMR Obs. Exp. SMR Ratio mentions to underlyin g cause N/A ALL ENGLAND UL Waverley 6.2 Q19 J UH Wealden 9.4 Q19 J UJ Wear Valley 32.6 Q10 A UL Welwyn Hatfield 12.6 Q02 G MB West Berkshire UA 7.9 Q16 J UL West Devon 16.3 Q21 K UH West Dorset 13.3 Q22 K UP West Lancashire 21.1 Q13 B UH West Lindsey 17.7 Q24 E UF West Oxfordshire 6.3 Q16 J UF West Wiltshire 12.0 Q20 K BK Westminster 31.7 Q04 H UJ Weymouth and Portland 21.2 Q22 K BW Wigan 29.3 Q14 B UP Winchester 7.0 Q17 J ME Windsor and Maidenhead UA 8.2 Q16 J CB Wirral 30.1 Q15 B UM Woking 7.3 Q19 J MF Wokingham UA 5.1 Q16 J CW Wolverhampton 32.2 Q27 F UE Worcester 17.7 Q28 F UH Worthing 15.7 Q19 J UF Wychavon 11.3 Q28 F UF Wycombe 9.7 Q16 J UQ Wyre 17.8 Q13 B UG Wyre Forest 17.8 Q28 F FF York UA 14.5 Q11 D
20 Motor neurone disease : SMR for each local authority (underlying cause) - sorted from highest to lowest, Males SMR Melton Alnwick East Hertfordshire North Shropshire North Devon Elmbridge Kennet Watford Blyth Valley Christchurch Fenland Hartlepool UA Stevenage Rutland UA Newark and Sherwood Forest Heath South Oxfordshire Ipswich East Devon Castle Morpeth Epsom and Ewell Northampton Hastings Mendip Mole Valley Halton UA Redditch Kettering Waverley Shrewsbury and Atcham Teesdale Berwick-upon-Tweed Hart Mid Suffolk North East Derbyshire Kingston upon Thames Congleton Ribble Valley High Peak Restormel Spelthorne Rother Derwentside Chester-Le-Street Bromsgrove Kerrier Maidstone Gloucester Daventry Hinckley and Bosworth South Somerset Tonbridge and Malling Thurrock UA Selby Windsor and Maidenhead UA
21 Motor neurone disease : SMR for each local authority (underlying cause) - sorted from highest to lowest, Males SMR West Wiltshire Crewe and Nantwich Bath and North East Somerset UA Durham Reigate and Banstead North Kesteven North Norfolk Wokingham UA Babergh Worcester Uttlesford Stockton-On-Tees UA Chiltern Purbeck North Hertfordshire Dartford Newham South Norfolk Gosport Salisbury Arun Oadby and Wigston Bridgnorth Preston Warrington UA Copeland Ashfield Torbay UA West Devon Huntingdonshire Oswestry Surrey Heath Southampton UA Southend-On-Sea UA Bradford Bournemouth UA Torridge Barrow-In-Furness Milton Keynes UA Woking Guildford South Cambridgeshire Aylesbury Vale Islington Derbyshire Dales South Kesteven Plymouth UA South Hams Blaby Cheltenham East Cambridgeshire Broxtowe Easington South Gloucestershire UA Charnwood
22 Motor neurone disease : SMR for each local authority (underlying cause) - sorted from highest to lowest, Males SMR South Tyneside Braintree Broadland Bromley Poole UA Gravesham Craven Stratford-On-Avon Brighton and Hove UA Camden Havering Warwick Waltham Forest Blackburn with Darwen UA Kirklees Penwith Wansbeck Weymouth and Portland Forest of Dean West Lancashire Wear Valley Worthing Hillingdon Dover Knowsley Mid Devon Nottingham UA Newcastle upon Tyne Thanet Cotswold Sheffield Chester North Tyneside Horsham Walsall Bristol, City of UA Leicester UA Colchester Eastbourne Barnet Taunton Deane West Berkshire UA Chichester Rushcliffe Solihull Derby UA Dacorum Bolsover Fylde St. Helens North Cornwall Chelmsford Blackpool UA East Hampshire Kings Lynn and West Norfolk
23 Motor neurone disease : SMR for each local authority (underlying cause) - sorted from highest to lowest, Males SMR Harborough South Ribble Luton UA Richmond upon Thames Gateshead Teignbridge Wigan West Oxfordshire Dudley Corby East Lindsey Herefordshire, County of UA Havant Fareham Wirral Tamworth Pendle Doncaster Waveney Coventry Oxford Bury Tandridge Rushmoor Leeds Norwich Bexley Wakefield Gedling Ealing Southwark Wyre Forest Bassetlaw Hambleton Harlow Caradon Sefton Tendring Rochdale Chesterfield Kingston upon Hull, City of UA Harrow Lincoln Amber Valley Scarborough Swindon UA East Dorset Great Yarmouth North Warwickshire Stockport Isle of Wight UA Portsmouth UA South Shropshire York UA Carlisle
24 Motor neurone disease : SMR for each local authority (underlying cause) - sorted from highest to lowest, Males SMR Eastleigh Sunderland Wealden Carrick Barnsley Richmondshire Croydon North Wiltshire New Forest Exeter East Staffordshire Tunbridge Wells Wycombe St. Edmundsbury Oldham Stafford West Lindsey Hertsmere North East Lincolnshire UA Lambeth Burnley Medway UA Winchester Three Rivers Suffolk Coastal Birmingham Cherwell Manchester Vale of White Horse Staffordshire Moorlands Lewisham Runnymede Middlesborough UA South Lakeland South Bucks South Derbyshire Harrogate North West Leicestershire Stoke-On-Trent UA Stroud Bedford East Riding of Yorkshire UA North Somerset UA Sedgefield Erewash Rossendale Canterbury Darlington UA Mansfield Vale Royal Wolverhampton South Staffordshire Wyre Sedgemoor South Bedfordshire
25 Motor neurone disease : SMR for each local authority (underlying cause) - sorted from highest to lowest, Males SMR Ashford Nuneaton and Bedworth Trafford Sutton Chorley Salford Newcastle-under-Lyme Bolton East Northamptonshire Test Valley Lewes Lancaster Barking and Dagenham Swale Basingstoke and Deane Ryedale Hyndburn Redbridge Cambridge Breckland Boston Liverpool Greenwich Reading UA Malvern Hills Merton North Lincolnshire UA Basildon Hounslow Sandwell Broxbourne Tameside Peterborough UA Sevenoaks Cannock Chase Telford and Wrekin UA Haringey Redcar and Cleveland UA Maldon Tewkesbury North Dorset Calderdale Rochford Welwyn Hatfield Hammersmith and Fulham Wychavon West Dorset Brentwood Kensington and Chelsea Enfield Tynedale Allerdale Brent Bracknell Forest UA Rotherham
26 Motor neurone disease : SMR for each local authority (underlying cause) - sorted from highest to lowest, Males SMR Lichfield Macclesfield Shepway Tower Hamlets South Holland Mid Sussex Hackney Adur South Northamptonshire Westminster Ellesmere Port and Neston Crawley Mid Bedfordshire Wandsworth Rugby St. Albans Epping Forest
27 Motor neurone disease : SMR for each local authority (mentions) sorted from highest to lowest, Males SMR Melton Hartlepool UA Newark and Sherwood East Hertfordshire South Oxfordshire Elmbridge Alnwick Stevenage Blyth Valley North Shropshire Hart Mendip Tonbridge and Malling Castle Morpeth Ipswich Kennet North Devon Watford Halton UA North Hertfordshire Christchurch Fenland High Peak Mid Suffolk Kingston upon Thames Mole Valley Berwick-upon-Tweed Derwentside Northampton Waverley Uttlesford West Wiltshire Epsom and Ewell Forest of Dean East Devon Dartford Rutland UA Bath and North East Somerset UA North East Derbyshire Forest Heath Bradford Rother Ribble Valley Bromsgrove Shrewsbury and Atcham Southampton UA Wansbeck Charnwood North Norfolk East Cambridgeshire Windsor and Maidenhead UA Reigate and Banstead Redditch Hastings Worcester
28 Motor neurone disease : SMR for each local authority (mentions) sorted from highest to lowest, Males SMR Kettering Spelthorne Restormel Babergh Salisbury Chiltern Camden Teesdale Eastleigh Barrow-In-Furness Newham Gloucester Selby Kerrier South Somerset Hinckley and Bosworth Eastbourne Congleton Arun Ashfield Waltham Forest Derbyshire Dales Cheltenham Bridgnorth South Cambridgeshire Broadland Thurrock UA Preston Oadby and Wigston Aylesbury Vale Crewe and Nantwich Pendle Wear Valley Bromley Chester-Le-Street Torbay UA Gosport Wokingham UA North Kesteven Copeland Dacorum Tandridge Braintree Leicester UA Havering Maidstone Daventry Southend-On-Sea UA Cotswold Weymouth and Portland Stratford-On-Avon Kirklees Newcastle upon Tyne Barnet Guildford
29 Motor neurone disease : SMR for each local authority (mentions) sorted from highest to lowest, Males SMR Plymouth UA Stockton-On-Tees UA Bournemouth UA Walsall Torridge South Kesteven South Tyneside South Gloucestershire UA Bassetlaw South Norfolk Durham Woking Worthing Thanet Warrington UA Rochdale Huntingdonshire St. Helens Blackburn with Darwen UA West Lancashire St. Edmundsbury Craven Hillingdon Milton Keynes UA Vale of White Horse Islington South Bedfordshire South Hams West Oxfordshire Bolsover Runnymede Purbeck Easington Luton UA Knowsley Broxtowe Harborough Brighton and Hove UA Gedling Sheffield Sunderland Surrey Heath Chesterfield Havant Blackpool UA West Devon Penwith Scarborough Bury Chester Oswestry North Tyneside Kings Lynn and West Norfolk Rushcliffe Fylde
30 Motor neurone disease : SMR for each local authority (mentions) sorted from highest to lowest, Males SMR Chelmsford Wirral East Staffordshire Derby UA Wigan Blaby Sedgefield Amber Valley Richmond upon Thames Leeds Nottingham UA Chichester Oldham South Staffordshire Dudley Bexley Gravesham Wycombe Horsham Stockport Poole UA Warwick Gateshead Harrogate West Berkshire UA Taunton Deane Colchester East Lindsey Canterbury Hertsmere Doncaster Wealden North Cornwall Coventry Barnsley South Ribble Wyre Forest Dover Teignbridge Lancaster Mid Devon Caradon Bristol, City of UA Broxbourne Kingston upon Hull, City of UA Wakefield Norwich Rushmoor Solihull Basildon Waveney Swindon UA Nuneaton and Bedworth Herefordshire, County of UA Lambeth
31 Motor neurone disease : SMR for each local authority (mentions) sorted from highest to lowest, Males SMR Burnley Stafford Bedford Fareham Sedgemoor New Forest North Warwickshire South Shropshire Southwark West Lindsey Isle of Wight UA Oxford Sefton Tunbridge Wells Wyre East Hampshire Newcastle-under-Lyme Tameside Hambleton Ealing North East Lincolnshire UA Lincoln Redbridge Trafford Birmingham Harrow Cambridge Corby Wolverhampton Portsmouth UA Ryedale Tamworth Barking and Dagenham Sandwell Tynedale Great Yarmouth East Riding of Yorkshire UA Croydon Carlisle Salford Mansfield Erewash East Dorset Sevenoaks Suffolk Coastal Middlesborough UA Manchester Carrick Tendring North Lincolnshire UA Lewes Three Rivers Tewkesbury Exeter North Wiltshire
32 Motor neurone disease : SMR for each local authority (mentions) sorted from highest to lowest, Males SMR Medway UA Liverpool South Bucks York UA Harlow Bolton Rotherham South Derbyshire Winchester Lewisham Stoke-On-Trent UA North Somerset UA Staffordshire Moorlands Merton South Holland Breckland Swale South Lakeland Darlington UA Stroud Richmondshire Malvern Hills Basingstoke and Deane Kensington and Chelsea Sutton Vale Royal Hyndburn Hounslow Reading UA Cherwell Lichfield Boston Redcar and Cleveland UA Test Valley North West Leicestershire Rossendale Greenwich Peterborough UA Maldon Haringey Calderdale Ellesmere Port and Neston Shepway Hammersmith and Fulham Chorley Ashford Adur Brent East Northamptonshire Allerdale North Dorset Enfield Rochford West Dorset Telford and Wrekin UA
33 Motor neurone disease : SMR for each local authority (mentions) sorted from highest to lowest, Males SMR Brentwood Welwyn Hatfield Wandsworth Bracknell Forest UA Wychavon Cannock Chase Hackney Tower Hamlets South Northamptonshire Mid Sussex Macclesfield Westminster Crawley Mid Bedfordshire St. Albans Rugby Epping Forest
34
Council Performance Ratings 2010
 Council Performance Ratings 2010 Tameside Metropolitan Borough Council North West 4 - Performs excellently Wandsworth Borough Council London 4 - Performs excellently City of Westminster Council London
Amber Valley Bexley Breckland Blackpool UA Blackpool UA Barrow-in-Furness Blackburn with Darwen. Blackburn with Darwen Basildon
 Less than or equal to 0.4% Band D equivalent growth Year 1 (2011-12) Year 2 (2012-13) Year 3 (2013-14) Year 4 (2014-15) Year 5 (2015-16) Year 6 (2016-17) Adur Allerdale Barrow-in-Furness Adur Adur Adur
PQ Local Authorities with exceedances of NO 2 annual mean limit value (based on 2015
 PQ 47949 - Local Authorities with exceedances of NO 2 annual mean limit value (based on 2015 compliance assessment) Local Authorities with exceedances of NO 2 annual mean limit value (based on 2015 compliance
Levy-supported starts (May 2017 to April 2018) Local Authority District
 Local Authority District") Number of levy-supported apprenticeship starts by local authority district since the introduction of apprenticeship levy (May 2017 - April 2018 provisional) Local Authority District Levy-supported starts
Number of levy-supported apprenticeship starts by local authority district since the introduction of apprenticeship levy (May 2017 - April 2018 provisional) Local Authority District Levy-supported starts
Winners of the Exemplar Awards 2016
 Winners of the Exemplar Awards 2016 Winner of the Exemplar Award 2016 Leeds City Council Winner of the Peer Award 2016 David Lloyd, Huntingdonshire District Council Data Quality & Performance Awards 2016
Living Rents. 4th quartile earnings. Local Authority
 Local Authority 4th quartile earnings 1 bed Living Rents 2 bed 3 bed United Kingdom 251.80 70.50 91.66 112.81 Great Britain 253.00 70.84 92.09 113.34 England and Wales 252.90 70.81 92.06 England 253.60
Annex 3: CCGs confirmed for waves 1, 2, 3 and 4 for authorisation
 Annex 3: s confirmed for waves 1, 2, 3 and 4 for authorisation Below is a list of the clinical commissioning groups (s) which will be put forward for authorisation in wave 1, split by Commissioning Board
SUPPLEMENTARY INFORMATION: REGIONAL AND POLITICAL PARTY SUMMARIES. Liveable Lives Research Team
 Acting on Equalities: Are Local Authorities in England Meeting the Duties of the Equality Act 2010 and Addressing Sexual Orientation & Gender Identity? SUPPLEMENTARY INFORMATION: REGIONAL AND POLITICAL
School improvement monitoring and brokering grant provisional allocations for illustrative purposes
 School improvement monitoring and brokering grant provisional allocations for illustrative purposes The school improvement monitoring and brokering grant was announced on 30 November 2016. This grant of
NHS South Warwickshire CCG
 1 West Midlands South Worcestershire, Redditch, Bromsgrove & Wyre Forest (Fast Track with 2 & 3) NHS Redditch and Bromsgrove Worcestershire West Midlands NHS South Worcestershire NHS Wyre Forest 2 West
S31 Grant determination for a high needs strategic planning fund in : DCLG ref 31/2916
 S31 Grant determination for a high needs strategic planning fund in 2016-17: DCLG ref 31/2916 Purpose of the fund Local authorities can use this fund to carry out a strategic review of their high needs
Council Tax since
 27 December 2015 Council Tax since 1996-97 Since 2010, central government has offered grants to local authorities to freeze or cut Council Tax. Additionally, local authorities wishing to Council Tax by
For information. The information in this circular does not affect the content of the HB Guidance Manual.
 Housing Benefit Circular Department for Work and Pensions Caxton House, Tothill Street, London SW1H 9NA HB S5/2014 SUBSIDY CIRCULAR WHO SHOULD READ Housing Benefit managers and staff. Officers preparing
England screening uptake rates
 England screening uptake rates The average screening uptake rate in England is 58% In some cases it is as low as 33% 44% of s in England are below the national average Seven out of ten of the worst areas
Chief Executives of Local Planning Authorities in England [Via ] Dear Chief Executive, Planning application fees: the Government s offer
![Chief Executives of Local Planning Authorities in England [Via ] Dear Chief Executive, Planning application fees: the Government s offer](/thumbs/73/69457604.jpg "Chief Executives of Local Planning Authorities in England [Via ] Dear Chief Executive, Planning application fees: the Government s offer") Simon Gallagher Director of Planning Department for Communities and Local Government Third Floor, Fry Building 2 Marsham Street London, SW1P 4DF www.communities.gov.uk Chief Executives of Local Planning
Simon Gallagher Director of Planning Department for Communities and Local Government Third Floor, Fry Building 2 Marsham Street London, SW1P 4DF www.communities.gov.uk Chief Executives of Local Planning
Healthwatch is the independent champion for people who use health and social care services.
 B R I E F I N G State of Support Local Healthwatch Funding 2017/18 30 November 2017 Overview Healthwatch is the independent champion for people who use health and social care services. Across the country
Census Briefing Paper One. Housing Tenure Structure in England (2001)
") 1 Census Briefing Paper One Housing Tenure Structure in England (2001) Summary The aim of this briefing paper is to provide an accessible summary of information from the 2001 census. The main objective
1 Census Briefing Paper One Housing Tenure Structure in England (2001) Summary The aim of this briefing paper is to provide an accessible summary of information from the 2001 census. The main objective
Planned Expenditure by Local Authorities: Services for Young People
 Planned Expenditure by Local Authorities: Services for Young People Section 251 Under Section 251 of the Apprenticeships, Skills, Children and Learning Act 2009, local authorities are required to submit
Research Report England Repossession Hotspots 2010/11
 Research Report England Repossession Hotspots From the Shelter policy library June 2011 www.shelter.org.uk 2011 Shelter. All rights reserved. This document is only for your personal, non-commercial use.
Numbers achieving 3 A grades in specific A-Level combinations by school type and LEA
 Numbers achieving 3 A grades in specific A-Level combinations by school type and LEA Statistics Report Series No. 9 Joanne L. Emery February 2009 Research Division Statistics Group Assessment, Research
CCG Annual Assessment 2017/18
 Annual Assessment 2017/18 annual assessment 2017/18 Publications Gateway reference number: 08247 Version number: 3.0 First published: 12 July 2018 Prepared by: NHS England Assessment Team Classification:
6. Further information on each of the variables is as follows:
 Local Authority Housing Assets data collection - Guidance 1. To help us gather detailed local data to inform development of the Sale of High Value Assets policy, we are asking all stock owning local authorities
Business bailiff instructions
 Local authority Residential/consumer bailiff instructions Residential properties Business bailiff instructions Business properties Authority Type % of residential properties % of business properties Adur
Coronary revascularisation in England A geographical profile of hospital admissions
 Coronary revascularisation in England 2009-2011 A geographical profile of hospital admissions Unit of Health Care Epidemiology, University of Oxford 2013 Coronary revascularisation in England 2009-2011
EMBARGOED UNTIL 00:01 MONDAY 30 APRIL 2007 RESEARCH NOTE 12 COUNCILLORS ALLOWANCES
 EMBARGOED UNTIL 00:01 MONDAY 30 APRIL 2007 www.taxpayersalliance.com RESEARCH NOTE 12 COUNCILLORS ALLOWANCES In the interests of open and accountable government, and in advance of the local government
RAC Foundation for Motoring Local Authority Parking Finances in England
 RAC Foundation for Motoring Local Authority Parking Finances in England 2012-13 By David Leibling 1. Introduction Local authorities are required to submit details of their finances to the Department of
Strategic Estate Advisers Contact Details
 Strategic Estate Advisers Midlands & East of CCG Basildon & Brentwood Ian Greggor i.greggor@communityhealthpartnerships.co.uk Bedfordshire Anthony Smith anthony.smith@property.nhs.uk Birmingham Cross City
Local Authority to Jobcentre Plus District
 Local Authority to Jobcentre Plus District Local Authority Aberdeen City Aberdeenshire Adur Allerdale Amber Valley Angus Argyll and Bute Arun Ashfield Ashford Aylesbury Vale Babergh Barking and Dagenham
 LICENSING AUTHORITY EMAIL Adur Teresa.bowley@adur-worthing.gov.uk Allerdale deborah.fletcher@allerdale.gov.uk Amber Valley licensing@ambervalley.gov.uk Arun glenn.james@arun.gov.uk Ashfield J.Alison@ashfield.gov.uk
The local elections of 4 May Research Paper 95/ May 1995
 The local elections of 4 May 1995 Research Paper 95/59 10 May 1995 This paper provides a brief summary of the local elections which took place in most of England and Wales on 4 May 1995. It also summarises
2016-BASED HOUSEHOLD PROJECTIONS
 2016-BASED HOUSEHOLD PROJECTIONS PLANNING DESIGN ENVIRONMENT PEGASUSGROUP.CO.UK ECONOMICS 2016-BASED HOUSEHOLD PROJECTIONS The Office for National Statistics (ONS) released its 2016-household projections
CAMERON S COUNCIL TAX PLEDGE
 CAMERON S COUNCIL TAX PLEDGE A REPORT BY LIBERAL CONSPIRACY / THE MINISTRY OF TRUTH OCTOBER 2009 SUMMARY FINDINGS On Friday 2 nd October 2009, The Sun newspaper unveiled David Cameron s 10 Key Pledges
business register and employment survey ONS Crown Copyright Reserved [from Nomis on 15 February 2011]
![business register and employment survey ONS Crown Copyright Reserved [from Nomis on 15 February 2011]](/thumbs/89/100799196.jpg "business register and employment survey ONS Crown Copyright Reserved [from Nomis on 15 February 2011]") business register and employment survey ONS Crown Copyright Reserved [from Nomis on 15 February 2011] date 2009 "TSA: Tourism Industries" industry Full-time employees Part-time employees Area Employees
business register and employment survey ONS Crown Copyright Reserved [from Nomis on 15 February 2011] date 2009 "TSA: Tourism Industries" industry Full-time employees Part-time employees Area Employees
Specialised perinatal community team that meets Perinatal Quality Network Standards Type 1
 7 DATA UK Health Teams (Provision in 7) Specialised perinatal community team that meets Perinatal Quality Network Standards Type http://bit.ly/jouvad http://bit.ly/ahavex More than in women develop a mental
The 2014-based Household Projections for England
 The 2014-based Projections for England On 12th July 2016, CLG published the 2014-based Projections for England, which project average household growth of 210,000 each year across the country between 2014
356,500 people commuted to jobs in the City of London. 40 per cent from inner London, 29 per cent from outer London, 31 per cent from outside London
 CIS 2014-11 Commuting in London July 2014 The 2011 Census recorded the place of work and method of travel to work of all respondents aged 16 or over. The Special Workplace Statistics dataset provides information
#element of bullying / harassment South West 2gether NHS FT Mental Health Small
 1 South West 2gether NHS FT Mental Health Small 3 2 0 3 0 Aintree University Hospital NHS FT Yorks and Humber Airedale NHS FT Combined Acute and Community Small 28 0 8 7 1 North West Alder Hey Children's
1. On-street income, expenditure and income from penalty charges. 2. Off-street income, expenditure 3. Total transport income, expenditure
 RAC Foundation for Motoring Local Authority Parking Finances in England 2015-16 1. Introduction Local authorities are required to submit details of their finances to the Department of Communities and Local
Stephanie Payne Sent: 01 February :17 To: FOI 1/11 (registration of homeless people)
") From: Stephanie Payne Sent: 01 February 2011 12:17 To: Subject: FOI 1/11 (registration of homeless people) FOI 1/11 Dear Thank you for your request under the Freedom of Information Act 2000 dated 15 January
From: Stephanie Payne Sent: 01 February 2011 12:17 To: Subject: FOI 1/11 (registration of homeless people) FOI 1/11 Dear Thank you for your request under the Freedom of Information Act 2000 dated 15 January
Area1 Area Code Cut-off Date In Bank Date Area North East Essex. 28th 14th Mid Essex South East Essex
 North East Essex 5PW Mid Essex 5PX West Essex 5PV 28th 14th Mid Essex South East Essex 5P1 South West Essex 5PY Somerset 5QL 27th 15th Somerset York 5NV 27th 15th North Yorkshire and Humber Rotherham 5H8
Oriel 2018 (2019intake) Hospital and Health Board Employers
 Hospital and Health Board Employers") Oriel 2018 (2019intake) Hospital and Health Board Employers Employer Name ABERTAWE BRO MORGANNWG UNIVERSITY HEALTH BOARD AINTREE UNIVERSITY HOSPITAL NHS FOUNDATION TRUST AIREDALE NHS FOUNDATION TRUST ALDER
Oriel 2018 (2019intake) Hospital and Health Board Employers Employer Name ABERTAWE BRO MORGANNWG UNIVERSITY HEALTH BOARD AINTREE UNIVERSITY HOSPITAL NHS FOUNDATION TRUST AIREDALE NHS FOUNDATION TRUST ALDER
Swine Flu Weekly Vaccine Uptake 2009/10 - Frontline HCWs (Primary Care Organisations) Week 4 w/e 31/01/2010 For organisations under HPA
 Week 4 w/e 31/01/2010 For organisations under HPA") Swine Flu Weekly Vaccine Uptake 2009/10 - Frontline HCWs (Primary Care Organisations) Week 4 w/e 31/01/2010 For organisations under HPA Trust Code Trust Name SHA Org Code SHA Name Swine Flu Vaccination
Swine Flu Weekly Vaccine Uptake 2009/10 - Frontline HCWs (Primary Care Organisations) Week 4 w/e 31/01/2010 For organisations under HPA Trust Code Trust Name SHA Org Code SHA Name Swine Flu Vaccination
CHAPLAINCY COSTS SURVEY, ENGLAND
 CHAPLAINCY COSTS SURVEY, ENGLAND APRIL 2009 Mental Health & Care Trusts, NHS & Foundation Trusts & Primary Care Trusts Trust Salaries per annum ( )* Staff - Whole time Equivalent 2gether NHS Foundation
Local Authority Parking Finances in England
 Local Authority Parking Finances in England 1. Introduction Local authorities are required to submit details of their finances to the Department of Communities and Local Government (DCLG, now the Ministry
Local Authority codes
 Local Authority codes LA Code Authority Name LA Code Authority Name S12000033 Aberdeen City S12000034 Aberdeenshire E07000223 Adur District Council E07000026 Allerdale Borough Council E07000032 Amber Valley
AUTHORITY Central Bedfordshire Bedford Mid and South Bedfordshire Luton Bracknell Forest Reading Slough W Berkshire Windsor & Maidenhead Wokingham
 COUNTY AUTHORITY DESIGNATION CONTACT Bedfordshire Central Bedfordshire Unitary Authority RightsofWay@centralbedfordshire.gov.uk Bedford Metropolitan Borough row@bedford.gov.uk Mid and South Bedfordshire
Grant in Aid funding allocated to Risk Management Authorities. in 2016/17
 Grant in Aid funding allocated to Risk Management Authorities in 2016/17 Risk Management Authority Grant in Aid ( ) Environment Agency 197,082,658 Adur and Worthing Councils 400,000 Ainsty 2008 IDB Allerdale
PARKING FINES: THE 328 MILLION ENFORCEMENT INDUSTRY
 EMBARGOED UNTIL 00.01AM WEDNESDAY 25 NOVEMBER www.driversalliance.org.uk www.taxpayersalliance.com RESEARCH NOTE 2 PARKING FINES: THE 328 MILLION ENFORCEMENT INDUSTRY Many people perceive parking enforcement
STAMP IDENTIFICATION NUMBERS
 STAMP IDENTIFICATION NUMBERS DEPARTMENT OF TRADE AND INDUSTRY WEIGHTS AND MEASURES (PRESCRIBED STAMP) REGULATIONS 1968 LIST OF IDENTIFICATION NUMBERS National Weights and Measures Laboratory Stanton Avenue
Money Advice Service Over-Indebtedness 2017
 Money Advice Service Over-Indebtedness 2017 Indebtedness has been calculated for all local authorities and regions of the United Kingdom, to estimate the proportions of individuals that are likely to be
RSN Economic Profiling Service
 RSN Economic Profiling Service Introduction The RSN has developed an economic profiling service for its members. Information will be provided based on the indicators and to the frequency set out in the
Identifying Pro-Growth Locations in England. May 2018
 Identifying Pro-Growth Locations in England May 2018 About Turley Turley is a national planning and development consultancy which, since being founded in 1983, has established a strong reputation for providing
Most regions saw price falls during 2012
 www.nationwide.co.uk/hpi Embargoed until 0700 Thurs 3 Jan 2013 Most regions saw price falls during 2012 11 out of 13 UK regions saw annual price falls during 2012 London best performing region in 2012
Identifying Pro-Growth Locations in England. June 2018
 Identifying Pro-Growth Locations in England June 2018 About Turley Turley is a national planning and development consultancy which, since being founded in 1983, has established a strong reputation for
UK Referendum Estimated Results Timetable
 UK Referendum Estimated Results Timetable Your Guide to Referendum Night Here is APCO Worldwide s guide to help you track the referendum results as they come in. The results of the UK referendum on EU
BBC Local Democracy Reporter allocation
 BBC Local Democracy Reporter allocation Map shows distribution of reporters by BBC Nation and Region see page two, Table B for detail Page The distribution of reporters in Northern Ireland will be undertaken
Research Note th June Council liabilities
 Research Note 136 26th June 2014 Council liabilities Public sector debt is forecast by the Office for Budgetary Responsibility to exceed 1.3 trillion in 2014-15. 1 However, as explained by previous TaxPayers
Local Authority Contact List 9th March 2009 England, Wales and Northern Ireland Authority Telephone Fax
 www.bouncetime.co.uk Local Authority Contact List 9th March 2009 England, Wales and Northern Ireland Authority Telephone Fax Adur District Council 01273 461493 01273 454847 Allerdale Borough Council 01900
Dear Louise. I can confirm that the full list of approved sites for this study is:
 From: TOTENHOFER, Ashley (HEALTH RESEARCH AUTHORITY) Sent: 28 June 2018 13:06 To: SAVIC, Louise (LEEDS TEACHING HOSPITALS NHS TRUST) Subject: RE: DALES 232512 Dear Louise I can confirm that the full list
National Child Development Study. Revised Region Variables
 National Child Development Study Revised Region Variables First Edition Jane Elliott, Jon Johnson and Peter Shepherd November 2006 Centre for Longitudinal Studies Bedford Group for Lifecourse & Statistical
Suitability of the subsurface for infiltration SuDS in Great Britain
 The British Geological Survey Suitability of the subsurface for in Great Britain Infiltration Drainage Ground stability Groundwater protection What are? Infiltration SuDS are sustainable drainage systems
Visitor Attractions Trends in England 2014
 Visitor Attractions Trends in England 2014 Annual Report for Heritage Counts Prepared for Historic England 1. Introduction and Background This report presents key tables from the historic properties element
WRAP Household food waste collections guide Appendix A
 WRAP Household food waste collections guide Appendix A PrimaryKey UK local authority Social Grade D Social Grade D & E 2011 (%) Social Grade D & E 2011 (proportion) Name 1 Stockton-on-Tees 30.5 0.305 2
Visitor Attractions Trends in England 2017
 Visitor Attractions Trends in England 2017 Annual Report for Heritage Counts Prepared for Historic England Report Contents 1. Introduction and Background 2 1.1 Visitor Attraction Definition 2 1.2 Research
Visitor Attractions Trends in England 2016
 Visitor Attractions Trends in England 2016 Annual Report for Heritage Counts Prepared for England 1. Introduction and Background This report presents key tables from the properties element of the Survey
The local elections of
 The local elections of 17 MAY 99 6 May 1999 This paper provides a brief summary of the local elections which took place in most parts of Great Britain on 6 May 1999. In the interest of producing the paper
Local Government Finance Settlement 2015/16 initial analysis
 Local Government Finance Settlement 2015/16 initial analysis Standard Note: SN07079 Last updated: 6 January 2015 Author: Section Neil Johnston Social and General Statistics The provisional local government
House prices in London continue to climb
 www.nationwide.co.uk/hpi Q2 2014 Embargoed until 0700 Wed 2 Jul 2014 House prices in London continue to climb All UK regions saw annual price rises in Q2 2014 London continues to lead, with annual price
Happiness is a town called Harrogate destination named happiest place to live for THIRD year running
 Rightmove plc 3 rd & 4 th Floor 33 Soho Square London W1D 3QU Under embargo until 00.01 Thursday 6 th August Happiness is a town called Harrogate destination named happiest place to live for THIRD year
House prices fall in most regions during the third quarter
 www.nationwide.co.uk/hpi Q3 2010 Embargoed until 0700 Thurs 30 Sep 2010 House prices fall in most regions during the third quarter House prices fell in nine out of thirteen UK regions in the third quarter
Q Embargoed until March 2010
 www.nationwide.co.uk/hpi Embargoed until 0700 30 March 2010 London mini-boom leads UK price growth UK house prices increased by 1.6% quarter-on-quarter in Q1 London saw the strongest growth in the quarter
The impact of E10 Dr Ivo Wengraf, RAC Foundation July 2018
 The impact of E10 Dr Ivo Wengraf, RAC Foundation July 2018 Summary Under the Government s Renewable Transport Fuel Obligation fuel suppliers have added a biofuel element to the fuel they supply to road
Technical specification: BS 4449:2005 GRADE B500B BAR AND COIL
 BS 4449:2005 GRADE B500B BAR AND COIL DIAMETER SIZE EXTRA* COIL EXTRA* 8 mm 40.00 15.00 10 mm 25.00 15.00 12 mm 20.00 15.00 Base price + the following extras per size and/or format (coil) 16 mm - 15.00
NHS Retirement Fellowship
 NHS Retirement Fellowship Reg. Charity No: 287936 THE CHARITY The NHS Retirement Fellowship is a charity registered with the Charity Commission for England and Wales. FOUNDER PRESIDENT The Founder President
Council Pensions: The 53 billion black hole
 www.taxpayersalliance.com Research Note 61 Council Pensions: The 53 billion black hole Local government pensions are more sustainable than other public sector schemes, which are unfunded. However, the
Happy and healthy Hart tops 2012 Quality of Life Survey
 NOT FOR BROADCAST OR PUBLICATION BEFORE 00.01HRS Saturday 22 nd December 2012 The seventh annual Halifax Quality of Life Survey tracks where living standards are highest in the United Kingdom by ranking
Table 4.1 Organisation and management
 Table 4.1 Organisation and management North East Offered to: M'g't Main Partner Others Nu Pr Se Sp Ps RU In Ot by fund'g authorities Gateshead a a a r a a Lib Lib n/a North Tyneside a a a a a a a a Lib
Variations in housebuilding rates between local authorities in England
 Variations in housebuilding rates between local authorities in England Michael Oxley and Chihiro Udagawa March 2015 Introduction In early 2014, Michael Oxley received an ESRC Impact Acceleration Account
Three in a row for Hart as it hangs on to title of best place to live
 NOT FOR BROADCAST OR PUBLICATION BEFORE 00.01HRS 21 DECEMBER 2013 The eighth annual Halifax Quality of Life Survey tracks where living standards are highest in the United Kingdom by ranking local performance
One Public Estate and Land Release Fund
 One Public Estate and Land Release Fund Purpose This report updates the on recent funding announcements in relation to the One Public Estate (OPE) and Land Release Fund (LRF). It also provides an update
LOCAL AUTHORITY PROJECTS ENDORSED BY THE INTERDEPARTMENTAL PROJECT REVIEW GROUP (PRG
 LOCAL AUTHORITY PROJECTS ENDORSED BY THE INTERDEPARTMENTAL PROJECT REVIEW GROUP (PRG) The latest list of endorsed projects was published in this revised format by the ODPM on 24 November 2004. If you are
List of Sharer Organisations (Updated December 2017)
") List of Sharer Organisations (Updated December 2017) MOD and related organisations Allied Forces based in or transiting the UK and, while in the UK, performing identical functions to those others on the
List of Sharer Organisations (Updated December 2017) MOD and related organisations Allied Forces based in or transiting the UK and, while in the UK, performing identical functions to those others on the
2017 Rough Sleeping Statistics An analysis of 2017 rough sleeping counts and estimates
 Rough Sleeping Statistics An analysis of rough sleeping counts and estimates On 25 January 2018, the Ministry of Housing, Communities and Local Government released the autumn figures for rough sleeping.
List of Sharer Organisations (Updated April 2013)
") List of Sharer Organisations (Updated April 2013) MOD and related organisations Allied Forces based in or transiting the UK and, while in the UK, performing identical functions to those others on the list
List of Sharer Organisations (Updated April 2013) MOD and related organisations Allied Forces based in or transiting the UK and, while in the UK, performing identical functions to those others on the list
Regional and social differences in Coronary Heart Disease 2008
 Regional and social differences in Coronary Heart Disease 2008 Peter Scarborough, Steven Allender, Viv Peto and Mike Rayner Health Promotion Research Group Department of Public Health, University of Oxford
Clinical Guideline 042. Dementia: supporting people with dementia and their carers. Costing template. Implementing NICE-SCIE guidance in England
 Clinical Guideline 042 Dementia: supporting people with dementia and their carers Costing template Implementing NICE-SCIE guidance in England November 2006 NICE [title] - Cost Impact Assessment Cost impact
HOMELESSNESS IN GREAT BRITAIN HOW MANY PEOPLE ARE HOMELESS - THE NUMBERS BEHIND THE STORY
 HOMELESSNESS IN GREAT BRITAIN HOW MANY PEOPLE ARE HOMELESS - THE NUMBERS BEHIND THE STORY November 2018 Contents Chapter 1: Methodology 3 Chapter 2: Key fdgs 5 Chapter 3: and regional results 6 Chapter
Funding for Better Care Fund : Disabled Facilities Grant element
 Funding for Better Care Fund 2016-17 : Disabled Facilities Grant element Rows 5 to 207 show the DFG for upper tier local authorities and the breakdown by lower tier local authority Rows 213 to 338 show
Patients. Geography: Unitary Authorities, Counties and other areas. Administrative area geography in England and Wales. Unitary Authorities
 Appendix D: Methodology of standardised acceptance rates calculation and administrative area geography and Registry population groups in England & Wales Chapter 4, on the incidence of new patients, includes
Jnr. NBL League Structure
 2016-2017 Jnr. NBL League Structure UNDER 18 MEN Updated: 28/06/2016 NORTH PREMIER Cheshire Phoenix Juniors Derby Trailblazers Leeds Allerton Force Academy Leicester Riders Manchester Magic Myerscough
Virgin Media Street Works Contact List
 Civils Engineering, and Contact List Civils Engineering, & Virgin Media Street Works Contact List Senior Contact Virgin Media Address Phone / Fax Email Statutory, Regulatory & Standards (Street works Legislative
2018 TOWN HALL RICH LIST. Theo Hutchinson April 2018
 2018 TOWN HALL RICH LIST Theo Hutchinson April 2018 For the eleventh comprehensive list of local authority employees in the United Kingdom whose total annual 6-17 financial year, the most recent full year
1 April Key Points and Trends. 28
 Quarterly Location Statistics (QLS) 1 April 15 This statistical release presents figures on the National and International locations of all UK Regular Forces Personnel and MOD civilian personnel. Statistical
UNIVERSITY OF WALES INSTITUTE, CARDIFF ATHROFA PRIFYSGOL CYMRU, CAERDYDD. UK Competitiveness INDEX Robert Huggins Piers Thompson
 UNIVERSITY OF WALES INSTITUTE, CARDIFF ATHROFA PRIFYSGOL CYMRU, CAERDYDD UK Competitiveness INDEX 2010 Robert Huggins Piers Thompson UK Competitiveness Index 2010 Robert Huggins and Piers Thompson Centre
NATIONAL INSTITUTE FOR HEALTH AND CLINICAL EXCELLENCE. Association of Psychoanalytic Psychotherapy in the NHS (Older Adults Section)
") Action with Communities in Rural England Addenbrooke's/MRC Epidemiology Unit Adur, Arun & Worthing PCT Age Concern England Amateur Rowing Association Amateur Swimming Association Amber Valley PCT Association
Action with Communities in Rural England Addenbrooke's/MRC Epidemiology Unit Adur, Arun & Worthing PCT Age Concern England Amateur Rowing Association Amateur Swimming Association Amber Valley PCT Association
The NICDEX is back for it s third year.
 2018 PUBLISHED BY IN PARTNERSHIP WITH 2 www.pearson.com NICDEX 2018 NICDEX 2018 is here, but why create a college league table? Nick Linford @nicklinford The NICDEX is back for it s third year. At its
Workless households for areas across the UK in 2010
 Workless households for areas across the UK in 2010 Coverage: UK Date: 08 September 2011 Geographical Area: Local Authority County Theme: Labour Market Animated YouTube Video A short video podcast explaining
*** STRICTLY EMBARGOED UNTIL 7.00AM THURSDAY 2 APRIL 2009 *** Price falls across all regions in Q1 2009
 Price falls across all regions in 2009 Northern Ireland sees first moderation in price falls in two years Scotland saw prices fall sharply during but still the most resilient market Wales sees biggest
NATIONAL OFFICERS AND EXECUTIVE MEMBERS
 NATIONAL OFFICERS AND EXECUTIVE MEMBERS 2014 2016 National Officers President Max Hyde Senior Vice-President Philipa Harvey Junior Vice-President Anne Swift Treasurer Ian Murch Ex-President Beth Davies
Excessive taxes on motorists in each council area in the UK
 www.taxpayersalliance.com Research Note 95 11 November 2011 ive on motorists in each council area in the UK In March 2011 the Government cut the rate of Fuel Duty by 1p a litre. But it is unclear whether