Safe Harbor Statement
|
|
|
- Douglas Green
- 5 years ago
- Views:
Transcription
1
2 Safe Harbor Statement Some of the statements contained in this presentation discuss future expectations or state other forward-looking information. Those statements are subject to risks identified in this press release and in ASUR s filings with the SEC. Actual developments could differ significantly from those contemplated in these forward-looking statements. The forward-looking information is based on various factors and was derived using numerous assumptions. Our forward-looking statements speak only as of the date they are made and, except as may be required by applicable law, we do not have an obligation to update or revise them, whether as a result of new information, future or otherwise. Page 2
3 Management Team Long Serving Experienced Management Fernando Chico Pardo Chairman of the Board of Directors with company since 2005 Adolfo Castro Rivas Chief Executive and Officer Head of Investor Relations with company since 2000 Claudio Góngora Morales General Counsel Alejandro Pantoja López Chief Infrastructure Officer with company since 1999 with company since 2001 Agustín Arellano Rodríguez Director of International Projects Manuel Gutiérrez Sola Chief Officer with company since 2010 with company since 2000 Carlos Trueba Coll General Director of Cancún Airport Héctor Navarrete Muñoz General Director of Regional Airports with company since 1998 with company since 1999 Page 3
4 Investment Highlights Key value drivers Long-term concession investments in attractive locations in Mexico Established regulatory framework Track record of consistent passenger growth Balanced mix of international and domestic traffic Successful, market leading commercial business strategy Strong cash flow profile and solid balance sheet Robust corporate governance and board of directors with experienced management Page 4
 Airports Environmental Management Systems certified under ISO 14001")
5 Focus on Corporate Social Responsibility Sustainability is a key strategy in our business model Member of Dow Jones and Bolsa Mexicana de Valores sustainability indices Active participant of United Nations Global Compact, in Mexico and internationally Certified by CEMEFI as Socially Responsible Company (10 th year) Airports Environmental Management Systems certified under ISO Environmental Compliance certification from Mexican Environmental Protection Agency Focus on quality of life for employees and community relations Strict standards of corporate governance and business ethics Page 5
6 Airport operations in attractive locations in Mexico and the Caribbean Geographical presence Page 6

7 Cancún: Close to major U.S. destinations Illustrative flight times from various destinations Page 7

8 Private airports / airport groups listed on global stock exchanges ASUR and GAP are the only Latin American Airport Groups listed on NYSE Page 8

9 Ownership overview FCHP & ADO Page 9 * Shares with voting rights and delegated voting rights, as of December 30, 2016

10 Established regulatory framework with a track record of rate setting precedents Dual Till System Regulated + Non Regulated Page 10 Note: 2016 per PAX, expressed In nominal pesos as of Dec 2016; passenger traffic excludes transit and general aviation passengers ASUR adjusts specific tariffs / prices once every six months using the Mexican producer price index, excluding petroleum).
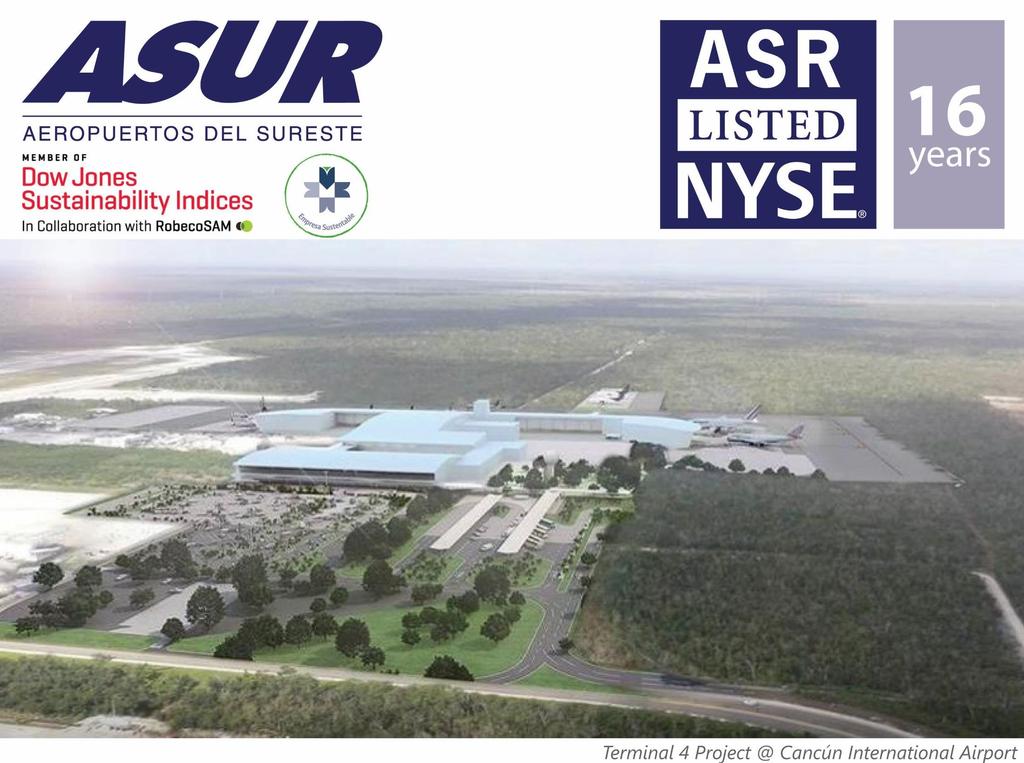
11 Visibility of capital expenditure requirements through ,282 million pesos invested ,500 3,000 2,500 2,000 MDP investment commitments (expressed in December 2016 Million Pesos) 1, Construction of Terminal 4 in Cancún 1, Visibility on capital expenditure requirements, as maximum rate negotiated along with Master Development Plan (MDP) is a function of programmed capex Key projects completed: 1999: Government capex backlog 2005: 9/11 security standards :Terminal 3 and second runway in CUN 2011: Passenger flow separation in CUN Terminal building expansion: : HUX, MID, OAX and VSA : Terminal 2 & 3 in CUN and VER Key future projects: New Terminal 4 in CUN Required works for Airport Certification (9 airports) 1 Committed investments from May 1999 to Dec M Pesos pesos have been paid each year (anticipated) Terminal 3 Cancún Airport Note: Committed investments according to Master Development Plan, expressed in million pesos as of December 2016 based on the Mexican construction price index in accordance with the terms of the Master Development Plan. Page 11


12 ASUR s airports are among the most frequented in Mexico Mexican Airports by PAX (thousand PAX) 1 According to the Communications and Transport Ministry s website Page 12 Source: Company financials, AICM website: Note: Selected airport sample includes ASUR, GAP, OMA and OHL concessions and the Mexico City airport; PAX traffic excludes transit and general aviation PAX
13 Revenue and passenger breakdown 2016 Revenue per PAX: Ps Ps.7,637M by business Non-aeronautical 41% 38% Regulated 62% by airport Villahermosa 3.2% Merida 5.5% Other 10.6% Cancun 80.7% Aeronautical 59% 2016 PAX 28.4M by type Domestic 46% International 54% by airport Other 13.4% Villahermosa 4.4% Merida 6.8% Cancun 75.4% Page 13 Source: Company filings; Note: Non-aeronautical revenues are derived from leasing of space in airports to airlines, restaurants, retailers and other commercial tenants and access fees collected from third parties providing complementary services (such as catering, handling, and ground transport). revenues are all non-aeronautical and include revenues related to retail (duty free & duty paid), food & beverages, advertising, banking & foreign exchange, car rental, car parking, ground transport, teleservices and others. from Construction Services are not included. PAX traffic excludes transit and general aviation.
14 Company 0.0 ASUR traffic evolution M16 6M CAGR: 6.4% Page 14 Source: ASA from ASUR management thereafter Note: Transit and general aviation excluded CAGR (INT L): 7.1% CAGR (DOM): 5.8% CAGR (Cancun): 7.9%

15 ASUR has a balanced mix of domestic and international traffic Passenger traffic by Origin Destination (million PAX) Region % Change 16 vs. 15 % of % CAGR total Mexico USA Europe Canada Latin America Asia & Others NA 0.0 NA ASUR Note: % of total refers to 2016 figure Note: Excludes transit and general aviation; Page 15
16 Historically, traffic has recovered and grown after exogenous events Passenger traffic during last 12- months at each specific date (million PAX) 30.0 M 16.2 M 13.8 M EVENT RECOVERY AFTER Type of PAX Historical Max. (%) Jun 17 vs. Hist. Max Sep 01: 9/11 13 months Domestic Jun % Oct 05: H. Wilma 16 months International Jun % Page 16 May 09: H1N1 26 months TOTAL Jun %
17 Available airplanes After 8.5 years, Mexico recovered the level of Airplanes Available Page Industry Estimates: 388 available airplanes Source: Available Airplanes in Mexico (155) Jun-08 Sep-10 Dec (40) (80) (120) (160) (200) Available airplanes New airplanes - existing airlines Lost airplanes - suspended airlines Lost vs. New Airplanes a) Existing Airlines jun-08 dic-16 New Airplanes Var. % INTERJET % VOLARIS % AEROMEXICO % VIVAAEROBUS % AEROMAR % MAGNICHARTERS % TAR % GLOBAL AIR 4 1 (3) (75)% Subtotal % b) Suspended Airlines jun-08 dic-16 Lost Airplanes MEXICANA 78 0 (78) ALMA 15 0 (15) AEROCALIFORNIA 22 0 (22) AVOLAR 8 0 (8) ALADIA 3 0 (3) AVIACSA 26 0 (26) NOVA AIR 3 0 (3) Subtotal (155) 25 8%
 converted at a 2016 average FX of PS. 18.")

 Non Regulated as % of Total (excluding")


18 Successful commercial strategy 2016 commercial revenue per PAX vs. peers (US$/PAX) converted at a 2016 average FX of PS /US$ for Mexican Airports Nominal CAGR : 23.0% (Mexican CPI CAGR : 4.1%) revenues per passenger per quarter evolution (Pesos / Passenger in Mexican pesos as of date reported) Non Regulated as % of Total (excluding from Construction Services) Page 18 Selected Int ASUR GAP OMA 1 International average includes figures for Fraport, TAV Airports, Copenhagen Airports, Vienna Airport, Aeroports do Paris and Zurich Airport; Note: OMA commercial revenues exclude revenues from Cargo; GAP commercial exclude revenues from Montego Bay operations; Amounts converted to US$ at a 2016 average FX of Ps /US$ (banxico.org.mx), where applicable; Note: revenue per passenger recorded in 3Q 05 reflects a one time payment from Dufry Mexico of Ps.39.5mm; revenue recorded in 4Q 06 reflects a one time payment of Ps.19.1mm from Aldeasa for a new concession contract at Terminal 3 in Cancun International. Passenger traffic excludes transit and general aviation; revenue per passenger CAGR based on full year 2000 and full year 2015 figures
19 Track record of consistent revenue growth and profitability Total CAGR : 13.4% Not including from Construction Services EBITDA & EBITDA Margin (Ps. Mm) CAGR 06 16: 15.3% EBITDA margin calculated without from Construction Services for comparability with previous periods Growth rates: CAGR (%) Passenger traffic 6.0% Total revenues 13.4% EBITDA 15.4% Net income 20.7% Mexican CPI 4.4% Page 19 Figures for 2010, 2011, 2012, 2013, 2014, 2015 & 2016 reflect adoption of MIFRS-17 Note: From 1999 to 2007 figures in nominal Mexican pesos adjusted for inflation as of Dec. 31 st of each year Source for Mexican CPI: IMF; Note: CAGRs calculated in Mexican peso terms; from Construction Services not included; passenger figures exclude passengers in transit or general aviation
 CAGR in 2006 2016 (%)")


20 ASUR has positively differentiated itself ACI has named Cancun as the best airport in Latin America for 4 consecutive years Revenue per PAX in 2016 ASUR GAP OMA CAGR in PAX Traffic (%) CAGR in (%) ASUR GAP OMA CAGR in EBITDA (%) ASUR GAP OMA Page 20 NOTES: 1. from Construction services are excluded for ASUR, GAP & OMA. 2. ASUR figures exclude revenues & participation of 2016 EBITDA from San Juan Airport Operations (Puerto Rico). 3. GAP figures exclude 2016 revenues of $1,622.0 million pesos (equivalent to $50.39 pesos/pax) & exclude 2016 EBITDA of $847.2 million pesos from Montego Bay Airport Operations. 4. OMA figures exclude 2016 revenues of $317.2 million pesos (equivalent to $16.91 pesos/pax) & exclude 2016 EBITDA of $120.4 million pesos from NH Hotel (Mexico City Airport), Hilton Garden Inn Hotel (Monterrey Airport) & Aero Industrial Park.


 Growth rates: 06 16")


 3.")


21 have grown at a faster rate than total costs and PAX traffic Revenue and cost per PAX comparison (Ps./PAX) NOTE: Total Revenue per passenger does not include revenues from construction services. Controllable expenses per passenger exclude: D&A, Concession Fee, Technical Assistance and Cost of Sales from Direct Operation. 3Q 10: Does not reflect the Ps million increase in the reserve for doubtful accounts resulting from the bankruptcy announced by Grupo Mexicana de Aviación 2016 operating cost breakdown (%) Growth rates: CAGR (%) Passenger traffic 7.5% Cost of services 7.6% 13.1% Administrative services 7.7% EBITDA 15.3% Total costs 6.7% Net Income 21.3% Mexican inflation (CPI) 3.9% Mexican GDP growth 2.1% Page 21 Growth rates in Mexican peso terms; Mexican inflation growth rate calculated as the % change in CPI indexed to 2006; total costs include concession fee, technical assistance, administrative services, costs of services and D&A; PAX traffic excludes Transit and G.A. PAX.
22 Dividends evolution EBITDA CAPEX (Ps. million) Net Income, retained earnings and dividends evolution (Ps. thousands) Page 22 1 Note: Figures in nominal Mexican pesos for the respective year; for illustrative purposes, dividend in each year in the chart above relates to the dividend paid in nominal pesos in the year thereafter, i.e. dividend shown in year (x) in the chart above is actually the dividend paid in year (x+1) according to ASUR financial statements; Note: Retained Earnings for the years 2010, , 2013, 2014, 2015 & 2016 reflect the adoption of IFRS 2 Note: 4.00 pesos per share paid in May 2013; 4.40 pesos per share paid in December Note: 6.16 pesos per share approved by the Annual General Shareholders Meeting on April 26 th, 2017 and to be paid on June 15 th, 2017.
23 Robust corporate governance and board of directors High Corporate Governance Standards Board of Directors Audit Committee Operations Committee Nom & Comp Committee Acq. & Contracts Committee Fernando Chico Pardo Founder and President of Promecap X X X X José Antonio Pérez Antón CEO of Grupo ADO X X X Roberto Servitje Sendra 1 Former Chairman of Grupo Bimbo X X Ricardo Guajardo Touche 1 Former president of BBVA Bancomer X X X Francisco Garza Zambrano 1 Former President of CEMEX North America X X Guillermo Ortiz Martinez 1 Former Governor of Mexico Central Bank for 12 yrs. X X Rasmus Christiansen 1 Former CEO of Copenhagen Airports International X X X Luis Chico Pardo Former economist at the Bank of Mexico Aurelio Pérez Alonso Deputy Chief Executive Officer of Grupo ADO X X X 1 Five out of nine board members are independent Sarbanes-Oxley compliant Four committees led by board members Audit committee comprised of 3 independent members of the board of directors Page 23

24 What s Next? Short & Long Term Objectives Further develop our commercial business Improve our passenger volumes World Class service ASQ Program Improve capital structure Monitor new business opportunities Page 24
25 ASUR: International Presence in Puerto Rico Page 25 SJU Aerostar: Limited liability company Ownership: ASUR, 60% PSP Investments, 40% Luis Munoz Marin International Airport (SJU), in San Juan Puerto Rico (9.0M PAX during 2016) is the largest and busiest airport in the Caribbean. Feb 27 th, 2013 initiated with the operation of the airport: Term of 40 years Upfront payment of $615M USD Airlines serving LMM will collectively make aggregate payments of $62M USD/yr for the first five years; years 6-40 the payment will be increased annually by the U.S. CPI Revenue-sharing payments to PRPA: fixed at $2.5M USD first five years; 5% of gross airport revenues (years 6-30); 10% of gross airport revenues (years 31-40) Minimal Capital Improvement projects: $34M USD Consolidation: Equity method up to may 2017 May 26 th, 2017: ASUR increases its participation to 60%. Jun 1 st, 2017: ASUR begins consolidating its operations in Aerostar.
26 ASUR: International Presence in Puerto Rico SJU Passenger Traffic SJU accounts for over 93% of Puerto Rican passenger traffic Approximately 83% of enplanements are origin and destination ( O&D ) SJU is served by a strong and diverse group of 35 airlines Aerostar works closely with the airlines and the Puerto Rico Tourism Company in the development of new routes and expansion of services to existing destinations SJU: Summary of Passenger Traffic Page 26
27 Aerostar 2016 & 2017 Aerostar Total for 2Q 07: $666,509 (thousands of Mexican pesos) SJU: Main Data LMM Page 27
28 ASUR: International Presence in Puerto Rico SJU Consistent growth in commercial revenues from an increased number of concessions, optimized passenger flow and improved product offerings. Around $170M USD invested in modernizing terminal offerings through new concession concepts, self-operating Convenience Stores, and updated parking and car rental facilities SJU: Page 28
Safe Harbor Statement
 Safe Harbor Statement Some of the statements contained in this presentation discuss future expectations or state other forward-looking information. Those statements are subject to risks identified in this
Safe Harbor Statement
 Safe Harbor Statement Some of the statements contained in this presentation discuss future expectations or state other forward-looking information. Those statements are subject to risks identified in this
Safe Harbor Statement
 Safe Harbor Statement Some of the statements contained in this presentation discuss future expectations or state other forward-looking information. Those statements are subject to risks identified in this
Investment Highlights
 Investment Highlights Key value drivers Long-term concession investments in attractive locations in Mexico Established regulatory framework Track record of consistent passenger growth Balanced mix of international
Company Overview. Regulation. Operational. Information. Commercial Revenues. Financial. Information. Strategic Matters. International.
 Some of the statements contained in this presentation discuss future expectations or state other forward-looking information. Those statements are subject to risks identified in this press release and
UBS CEO Conference February 2006
 UBS CEO Conference www.asur.com.mx February 2006 1 Contents Company Overview Strategic Partner Key Perfomance Revenues Historical Pax Traffic Strategy Master Development Program Financial Highligths Peers
Investment Highlights
 Third Quarter 2014 Investment Highlights 1 Mexican airport portfolio positioned to take full advantage of global growth. 2 Diversified business model contributing to earnings resilience. 3 Well-defined
Third Quarter 2015 Results
 Third Quarter 2015 Results Investment Highlights Positioned to take full advantage of global growth Diversified business model Well-defined strategy to capitalize on favorable industry dynamic Successful
ASUR 2Q11 PASSENGER TRAFFIC UP 2.89% YOY
 In Mexico ASUR Lic. Adolfo Castro (52) 5552-84-04-08 acastro@asur.com.mx In the U.S. Breakstone Group Susan Borinelli (646) 330-5907 sborinelli@breakstone-group.com ASUR 2Q11 PASSENGER TRAFFIC UP 2.89%
Investment Highlights
 Second Quarter 2014 Investment Highlights 1 Mexican airport portfolio positioned to take full advantage of global growth. 2 Diversified business model contributing to earnings resilience. 3 Well-defined
INVESTOR PRESENTATION FOURTH QUARTER 2017 RESULTS
 INVESTOR PRESENTATION FOURTH QUARTER 2017 RESULTS This presentation may contain forward-looking information and statements. Forward-looking statements are statements that are not historical facts. These
UBS Latin American New Opportunities Conference. June 11 th -12 th, 2007
 UBS Latin American New Opportunities Conference June 11 th -12 th, 2007 Company Overview OMA operates a diversified portfolio of 13 airports distributed throughout Northern and Central Mexico and is diversified
First Quarter 2016 Results
 First Quarter 2016 Results This presentation may contain forward-looking information and statements. Forward-looking statements are statements that are not historical facts. These statements are only predictions
Grupo Aeroportuario del Centro Norte SAB de CV SECOND QUARTER 2018 RESULTS
 Grupo Aeroportuario del Centro Norte SAB de CV SECOND QUARTER 2018 RESULTS This presentation may contain forward-looking information and statements. Forward-looking statements are statements that are not
COMMERCIAL REVENUES ASUR March/April 2005
 COMMERCIAL REVENUES ASUR March/April 2005 Starring role for duty free as ASUR posts sharp rise in commercial revenues By Martin Moodie Grupo Aeroportuario del Sureste (ASUR) is a Mexican airport operator
ASUR 2Q15 PASSENGER TRAFFIC UP 14.27% YOY
 In Mexico ASUR Lic. Adolfo Castro (52) 5552-84-04-08 acastro@asur.com.mx In the U.S. MBS Value Partners Susan Borinelli (646) 330-5907 susan.borinelli@mbsvalue.com For Immediate Release ASUR 2Q15 PASSENGER
ASUR 2Q14 PASSENGER TRAFFIC UP 10.65% YOY
 In Mexico ASUR Lic. Adolfo Castro (52) 5552-84-04-08 acastro@asur.com.mx In the U.S. Breakstone Group Susan Borinelli (646) 330-5907 sborinelli@breakstone-group.com ASUR 2Q14, Page 1 of 21 For Immediate
First Quarter 2010 Earnings Report
 First Quarter 2010 Earnings Report April 23, 2010 Mexican airport operator Grupo Aeroportuario del Centro Norte, S.A.B. de C.V., known as OMA (NASDAQ: OMAB; BMV: OMA), reported its unaudited, preliminary
INVESTOR PRESENTATION THIRD QUARTER 2017 RESULTS
 INVESTOR PRESENTATION THIRD QUARTER 2017 RESULTS This presentation may contain forward-looking information and statements. Forward-looking statements are statements that are not historical facts. These
Third Quarter 2010 Earnings Report
 Third Quarter 2010 Earnings Report October 19, 2010 Mexican airport operator Grupo Aeroportuario del Centro Norte, S.A.B. de C.V., known as OMA (NASDAQ: OMAB; BMV: OMA), reported its unaudited, preliminary
Grupo Aeroportuario del Sureste SAB de CV ADR ASR
 Page 1 of 5 Morningstar Analyst Rating. Last Price Day Change Open Price Day Range 52-Week Range Proj. Yield Market Cap Volume Avg Vol. Forward P/E P/B P/S P/CF $ 182.83 ]1.49 0.82 % $ 181.61 179.47-184.58
INVESTOR PRESENTATION SECOND QUARTER 2017 RESULTS
 INVESTOR PRESENTATION SECOND QUARTER 2017 RESULTS This presentation may contain forward-looking information and statements. Forward-looking statements are statements that are not historical facts. These
OMA Announces Fourth Quarter 2011 Earnings
 OMA Announces Fourth Quarter 2011 Earnings Monterrey, Mexico, February 23, 2012 -Mexican airport operator Grupo Aeroportuario del Centro Norte, S.A.B. de C.V., known as OMA (NASDAQ: OMAB; BMV: OMA), reported
THIRD QUARTER RESULTS 2018
 THIRD QUARTER RESULTS 2018 KEY RESULTS In the 3Q18 Interjet total revenues added $ 6,244.8 million pesos that represented an increase of 7.0% over the revenue generated in the 3Q17. In the 3Q18, operating
THIRD QUARTER RESULTS 2017
 THIRD QUARTER RESULTS 2017 KEY RESULTS In the 3Q17 Interjet total revenues added $5,835.1 million pesos that represented an increase of 22.0% over the revenue generated in the 3Q16. In the 3Q17, operating
FOURTH QUARTER RESULTS 2017
 FOURTH QUARTER RESULTS 2017 KEY RESULTS In the 4Q17 Interjet total revenues added $5,824.8 million pesos that represented an increase of 10.8% over the revenue generated in the 4Q16. In the 4Q17, operating
ASUR 4Q13 PASSENGER TRAFFIC UP 8.99% YOY
 `In Mexico ASUR Lic. Adolfo Castro (52) 5552-84-04-08 acastro@asur.com.mx In the U.S. Breakstone Group Susan Borinelli (646) 330-5907 sborinelli@breakstone-group.com ASUR 4Q13 PASSENGER TRAFFIC UP 8.99%
SECOND QUARTER RESULTS 2018
 SECOND QUARTER RESULTS 2018 KEY RESULTS In the 2Q18 Interjet total revenues added $ 5,781.9 million pesos that represented an increase of 9.6% over the revenue generated in the 2Q17. In the 2Q18, operating
FIRST QUARTER RESULTS 2017
 FIRST QUARTER RESULTS 2017 KEY RESULTS In the 1Q17 Interjet total revenues added $4,421.5 million pesos that represented an increase of 14.8% over the income generated in the 1Q16. In the 1Q17, operating
Santander Conference Acapulco. January 2007
 Santander Conference Acapulco January 2007 Post-IPO Shareholder Ownership IPO on November 29, 2006; 47% free float Aeroinvest* 74.5% 25.5% SETA Public Float B Shares (Mexico) 50% ADSs 50% 36.0%* 16.7%
Copa Holdings Reports Net Income of $57.7 million and EPS of $1.36 for the Third Quarter of 2018
 Copa Holdings Reports Net Income of $57.7 million and EPS of $1.36 for the Third Quarter of 2018 November 14, 2018 PANAMA CITY, Nov. 14, 2018 /PRNewswire/ -- Copa Holdings, S.A. (NYSE: CPA), today announced
Volaris Reports Strong First Quarter 2015: 32% Adjusted EBITDAR Margin, 9% Operating Margin
 Volaris Reports Strong First Quarter 2015: 32% Adjusted EBITDAR Margin, 9% Operating Margin Mexico City, Mexico, April 22, 2015 Volaris* (NYSE: VLRS and BMV: VOLAR), the ultra-low-cost airline serving
OPERATING AND FINANCIAL HIGHLIGHTS
 Copa Holdings Reports Financial Results for the Fourth Quarter of 2018 Excluding special items, adjusted net profit came in at $44.0 million, or Adjusted EPS of $1.04 Panama City, Panama --- February 13,
OPERATING AND FINANCIAL HIGHLIGHTS. Subsequent Events
 Copa Holdings Reports Net Income of $103.8 million and EPS of $2.45 for the Third Quarter of 2017 Excluding special items, adjusted net income came in at $100.8 million, or EPS of $2.38 per share Panama
ASUR 1Q17 PASSENGER TRAFFIC UP 8.42% YOY
 In Mexico ASUR Lic. Adolfo Castro +52-5552-84-04-08 acastro@asur.com.mx In the U.S. MBS Value Partners Susan Borinelli +1-646-330-5907 susan.borinelli@mbsvalue.com ASUR 1Q17 PASSENGER TRAFFIC UP 8.42%
Copa Holdings Reports Net Income of $136.5 million and EPS of $3.22 for the First Quarter of 2018
 Copa Holdings Reports Net Income of $136.5 million and EPS of $3.22 for the First Quarter of 2018 May 9, 2018 PANAMA CITY, May 9, 2018 /PRNewswire/ -- Copa Holdings, S.A. (NYSE: CPA), today announced financial
THIRD QUARTER AND NINE MONTHS OF 2014 KEY RESULTS
 THIRD QUARTER AND NINE MONTHS OF 2014 KEY RESULTS In 3Q14 INTERJET total revenues were $ 3,643.4 million, representing an increase of 9.9% on revenues generated in the 3Q13. Accumulated 9M14 INTERJET total
FIRST QUARTER RESULTS 2016
 FIRST QUARTER RESULTS 2016 KEY RESULTS In 1Q16 Interjet total revenues added $3,850.8 million pesos that represented an increase of 21.9% over the income generated in the 1Q15. In 1Q16 total passengers
OPERATING AND FINANCIAL HIGHLIGHTS
 Copa Holdings Reports Financial Results for the Fourth Quarter of 2015 Excluding special items, adjusted net income came in at $31.7 million, or EPS of $0.73 per share Panama City, Panama --- February
OPERATING AND FINANCIAL HIGHLIGHTS. Subsequent Events
 Copa Holdings Reports Financial Results for the First Quarter of 2016 Excluding special items, adjusted net income came in at US$69.9 million, or EPS of US$1.66 per share Panama City, Panama --- May 5,
First Quarter Grupo Aeroportuario del Centro Norte S.A.B. de C.V.
 First Quarter 204 Grupo Aeroportuario del Centro Norte S.A.B. de C.V. Investment Highlights Mexican airport portfolio positioned to take full advantage of global growth. 2 Diversified business model contributing
Results 2Q17. August 9, 2017
 Results 2Q17 August 9, 2017 2Q17 Highlights Indicators 2Q17 Var. x 2Q16 ASK (BN) 10.4-3.0% Traffic (000) 7,261-1.3% RPK (BN) 8.1 +0.5% Load Factor 77.9% +2.7 p.p. Yield (R$ cents) 23.2 +4.8% Pax Revenue
OPERATING AND FINANCIAL HIGHLIGHTS SUBSEQUENT EVENTS
 Copa Holdings Reports Financial Results for the Third Quarter of 2016 Excluding special items, adjusted net income came in at $55.3 million, or adjusted EPS of $1.30 per share Panama City, Panama --- November
Earnings Report 1 st Quarter 2016 Grupo Viva Aerobus
 Earnings Report 1 st Quarter 2016 Grupo Viva Aerobus Grupo Viva Aerobus announces results for the first quarter of 2016 Mexico City, Mexico, April 29, 2016- Grupo Viva Aerobus S.A. de C.V. ( Grupo Viva
IAG results presentation. Quarter One th May 2018
 IAG results presentation Quarter One 2018 4 th May 2018 Highlights Willie Walsh, Chief Executive Officer Highlights Another strong quarter performance with an operating profit of 280m (5.6% margin, +2.3pts)
OPERATING AND FINANCIAL HIGHLIGHTS. Subsequent Events
 Copa Holdings Reports Net Income of US$113.1 Million and EPS of US$2.57 for the First Quarter of 2015 Excluding special items, adjusted net income came in at US$106.0 million, or EPS of US$2.41 per share
Grupo Viva Aerobus announces results for the third quarter of 2016
 Earnings Earnings Report Report 3 rd rd Quarter Quarter 2016 2016 Grupo Grupo Viva Viva Aerobus Aerobus Grupo Viva Aerobus announces results for the third quarter of 2016 Mexico City, Mexico, October 27,
Copa Holdings Reports Net Income of $49.9 million and EPS of $1.18 for the Second Quarter of 2018
 Copa Holdings Reports Net Income of $49.9 million and EPS of $1.18 for the Second Quarter of 2018 Panama City, Panama --- Aug 8, 2018. Copa Holdings, S.A. (NYSE: CPA), today announced financial results
OPERATING AND FINANCIAL HIGHLIGHTS
 Copa Holdings Reports Net Income of US$32.0 Million and EPS of US$0.72 for the Second Quarter of 2012 Excluding special items, adjusted net income came in at $58.6 million, or EPS of $1.32 per share Panama
Results of Tourism Activity
 Results of Tourism Activity Mexico, July 2016 Lago de San Miguel Regla, Hidalgo. Jardín en Hacienda San Gabriel, Morelos. Parras, Coahuila. Paseo Santa Lucía, Monterrey. Undersecretariat of Planning and
Results 3 rd Quarter 2003
 Grupo Posadas, s, S.A. de C.V. & Subsidiaries October 28 th, 2003 Results 3 rd Quarter 2003 Total revenue and EBITDA increased by 10 and 12 % respectively Coastal hotels continue to improve, rates on urban
Copa Holdings Reports Net Income of US$113.9 Million for the Fourth Quarter of 2013
 Copa Holdings Reports Net Income of US$113.9 Million for the Fourth Quarter of 2013 Panama City, Panama --- February 12, 2014. Copa Holdings, S.A. (NYSE: CPA), today announced financial results for the
Air China Limited Annual Results. March Under IFRS
 Air China Limited 21 Annual Results Under IFRS March 211 Agenda Part 1 Highlights Part 2 Business Overview Part 3 Financial Overview Part 4 Outlook 2 Part 1 Highlights Steady Economic Growth; Asia Pacific
Santander 22 nd Annual Latin American Conference. Cancun, January 2018
 Santander 22 nd Annual Latin American Conference Cancun, January 2018 This presentation may include forward-looking comments regarding the Company s business outlook and anticipated financial and operating
Thank you for participating in the financial results for fiscal 2014.
 Thank you for participating in the financial results for fiscal 2014. ANA HOLDINGS strongly believes that safety is the most important principle of our air transportation business. The expansion of slots
Heathrow (SP) Limited
 Limited") Draft v2.0 10 Feb Heathrow (SP) Limited Results for year ended 31 December 2013 24 February 2014 Strong operational and financial performance in 2013 Passenger satisfaction at record high and over 72 million
Draft v2.0 10 Feb Heathrow (SP) Limited Results for year ended 31 December 2013 24 February 2014 Strong operational and financial performance in 2013 Passenger satisfaction at record high and over 72 million
OPERATING AND FINANCIAL HIGHLIGHTS SUBSEQUENT EVENTS
 Copa Holdings Reports Net Income of US$6.2 Million and EPS of US$0.14 for the Third Quarter of 2015 Excluding special items, adjusted net income came in at $37.4 million, or EPS of $0.85 per share Panama
Results of Tourism Activity Mexico, February 2017
 Results of Tourism Activity Mexico, February Undersecretariat of Planning and Tourism Policy Available in http://www.datatur.sectur.gob.mx/sitepages/versionesrat.aspx DIRECTORy ENRIQUE DE LA MADRID CORDERO
FIRST QUARTER 2014 RESULTS
 FIRST QUARTER 2014 RESULTS Mexico City, April 29, 2014 - Grupo Aeromexico S.A.B de C.V. ( Aeromexico ) (BMV: AEROMEX), the largest airline in Mexico, today reported its unaudited consolidated results for
ACI Annual Assembly Conference & Exhibition
 ACI Annual Assembly Conference & Exhibition Benefits and efficiencies of managing a group of airports versus just one Revenue side: More Competiveness Promoting intra-company routes GAP gets the advantage
OPERATING AND FINANCIAL HIGHLIGHTS
 Copa Holdings Reports Net Income of US$18.6 Million and EPS of US$0.42 for the Second Quarter of 2010 Excluding special items, adjusted net income came in at $26.3 million, or $0.60 per share Panama City,
ACI-NA/World Conference & Exhibition. PPPs: Will it work for your Airport?
 ACI-NA/World Conference & Exhibition PPPs: Will it work for your Airport? Dr. Yiannis Paraschis CEO Athens International Airport & Chairman ACI World September 12 th 2012 Forms & level of privatisation
Mexico City 26 th of April 2016 ANNUAL SHAREHOLDERS MEETING
 Mexico City 26 th of April 2016 ANNUAL SHAREHOLDERS MEETING Material for the Ordinary Annual General Meeting of the Shareholders of Grupo Aeroportuario del Sureste, S.A.B. de C.V. to be held 26 th April
Q Fast growth continued, Comparable operating result at record high levels Pekka Vauramo
 2018 Fast growth continued, Comparable operating result at record high levels 17.7.2018 Pekka Vauramo 2 A good - Comparable operating result increased to new seasonal high Revenue Comparable operating
Heathrow (SP) Limited
 Limited") 28 April 2014 Heathrow (SP) Limited Results for three months ended 31 March 2014 Strong operational and financial performance at the outset of the new regulatory period Highest ever passenger satisfaction
28 April 2014 Heathrow (SP) Limited Results for three months ended 31 March 2014 Strong operational and financial performance at the outset of the new regulatory period Highest ever passenger satisfaction
Copa Holdings Reports Fourth Quarter and Full Year 2007 Results
 Copa Holdings Reports Fourth Quarter and Full Year 2007 Results Panama City, Panama --- February 21, 2008. Copa Holdings, S.A. (NYSE: CPA), parent company of Copa Airlines and Aero Republica, today announced
Management Presentation. May 2013
 Management Presentation May 2013 Forward looking statements This presentation as well as oral statements made by officers or directors of Allegiant Travel Company, its advisors and affiliates (collectively
Bank of America Merrill Lynch 2018 Emerging Markets Corporate Credit Conference. Miami, May 2018
 Bank of America Merrill Lynch 2018 Emerging Markets Corporate Credit Conference Miami, May 2018 This presentation may include forward-looking comments regarding the Company s business outlook and anticipated
26 October 2017 Icelandair Group Interim Report NET PROFIT USD 101 MILLION IN THIRD QUARTER
 NET PROFIT USD 101 MILLION IN THIRD QUARTER Total income in Q3 up by 10% between years, to USD 536.0 million Passenger revenue higher than expected EBITDA unchanged year on year, at USD 161.1 million Passenger
Financial Results 3 rd Quarter MAR/2016 (FY2015)
") Financial Results MAR/2016 (FY2015) January 29 th, 2016 CONTENTS P.1 P.2 P.3 P.4~ Overview of FY MAR/16 Results Operating Revenue Operating Profit 1,030 1,020 1,010 +1.0Bn 1,022.3 1,023.4 (+0.1%) 180 160
Financial Results MAR/2016 (FY2015) January 29 th, 2016 CONTENTS P.1 P.2 P.3 P.4~ Overview of FY MAR/16 Results Operating Revenue Operating Profit 1,030 1,020 1,010 +1.0Bn 1,022.3 1,023.4 (+0.1%) 180 160
SEAT CAPACITY MEXICO MARKET ANALYSIS. June International Seats 51% Domestic Seats 49%
 MEXICO MARKET ANALYSIS SEAT CAPACITY 2015 Total Seats: 87,747,805 Mexico s seat capacity is roughly equally split between the domestic and international market. The Mexico-USA market contributes to a significant
MGM Resorts International Reports Second Quarter Financial Results
 NEWS RELEASE MGM Resorts International Reports Second Quarter Financial Results 8/5/2014 Consolidated Adjusted EBITDA Increased 8%, Led By 10% Growth In Wholly Owned Domestic Resorts MGM China Declares
Deutsche Bank 16 th Annual Global Emerging Markets. New York, September 2017
 Deutsche Bank 16 th Annual Global Emerging Markets New York, September 2017 This presentation may include forward-looking comments regarding the Company s business outlook and anticipated financial and
AEROFLOT ANNOUNCES FY 2017 IFRS FINANCIAL RESULTS
 AEROFLOT ANNOUNCES FY 2017 IFRS FINANCIAL RESULTS Moscow, 1 March 2018 Aeroflot Group ( the Group, Moscow Exchange ticker: AFLT) today publishes its audited financial statements in accordance with International
H RESULTS BOLOGNA, SEPTEMBER 4 TH 2017
 H1 RESULTS BOLOGNA, SEPTEMBER 4 TH H1 GROUP 2 GROUP OVERVIEW STRONG GROWTH TRACK RECORD AND MOMENTUM STRATEGIC LOCATION AND WEALTHY CATCHMENT AREA H1 Among top 50 airports in Europe # 7 airport in Italy
5. Economic performance
 AT 1 1 Economic performance STOCK MAINTAINING LEADERSHIP EFFICIENCY AND COMPETITIVENESS Income Costs INVESTMENT GENERATING CAPACITY AND VALUE AT 1 1 Profitability CHALLENGES AIMS 2018 PROGRESS IN SDG The
Competition in the domestic airline sector in Mexico *
 Competition in the domestic airline sector in Mexico * Agustin J. Ros Senior Economist, OECD April 23, 2010 * This work is output from the CFC-OECD Competition Assessment Project. Opinions expressed do
Management Presentation. November 2018
 Management Presentation November 2018 Forward looking statements This presentation as well as oral statements made by officers or directors of Allegiant Travel Company, its advisors and affiliates (collectively
Copa Holdings Reports Record Earnings of US$41.8 Million for 4Q06 and US$134.2 Million for Full Year 2006
 Copa Holdings Reports Record Earnings of US$41.8 Million for 4Q06 and US$134.2 Million for Full Year 2006 Panama City, Panama --- March 7, 2007. Copa Holdings, S.A. (NYSE: CPA), parent company of Copa
Earnings Report 4 th Quarter 2016 Grupo Viva Aerobus
 Earnings Report 4 th Quarter 2016 Grupo Viva Aerobus Grupo Viva Aerobus announces results for the fourth quarter of 2016 Mexico City, Mexico, February 20, 2016- Grupo Viva Aerobus S.A. de C.V. ( Grupo
Finnair Q Result
 Finnair Q1 2015 Result 7 May 2015 CEO Pekka Vauramo, Interim CFO Mika Stirkkinen 1 Turbulent market environment The weakness of the Finnish economy continued to be reflected in the demand in the first
J.P. Morgan 2019 Global Emerging Markets Corporate Conference. Miami, February 2019
 J.P. Morgan 2019 Global Emerging Markets Corporate Conference Miami, February 2019 This presentation may include forward-looking comments regarding the Company s business outlook and anticipated financial
The Mexico Fund, Inc.
 The Mexico Fund, Inc. Monthly Summary Report November 213 Prepared By: Impulsora del Fondo México, sc Investment Advisor to the Fund www.themexicofund.com The information presented in this report has been
Results of Tourism Activity Mexico, March 2017
 Results of Tourism Activity Mexico, March Undersecretariat of Planning and Tourism Policy Available in http://www.datatur.sectur.gob.mx/sitepages/versionesrat.aspx DIRECTORy ENRIQUE DE LA MADRID CORDERO
Corporate presentation CIBC Whistler Institutional Investor Conference January 21, 2010
 Corporate presentation CIBC Whistler Institutional Investor Conference January 21, 2010 Forwardlooking statement Certain information in this presentation and statements made during this presentation, including
Results of Tourism Activity
 Results of Tourism Activity Mexico, June Undersecretariat of Planning and Tourism Policy Available in http://www.datatur.sectur.gob.mx/sitepages/versionesrat.aspx DIRECTORy ENRIQUE DE LA MADRID CORDERO
Results of Tourism Activity Mexico, May 2017
 Results of Tourism Activity Mexico, May Undersecretariat of Planning and Tourism Policy Available in http://www.datatur.sectur.gob.mx/sitepages/versionesrat.aspx DIRECTORy ENRIQUE DE LA MADRID CORDERO
PRESS RELEASE Financial Results. Rising passenger traffic at 12.5m Exceeding 1bn in consolidated revenue
 PRESS RELEASE 2016 Financial Results Rising passenger traffic at 12.5m Exceeding 1bn in consolidated revenue Kifissia, 23 March 2017 AEGEAN reports full year 2016 results with consolidated revenue at 1,020m,
Management Presentation. November 2011
 Management Presentation November 2011 Forward looking statements This presentation as well as oral statements made by officers or directors of Allegiant Travel Company, its advisors and affiliates (collectively
Results of Tourism Activity Mexico, April 2017
 Results of Tourism Activity Mexico, April Undersecretariat of Planning and Tourism Policy Available in http://www.datatur.sectur.gob.mx/sitepages/versionesrat.aspx DIRECTORy ENRIQUE DE LA MADRID CORDERO
Sydney Airport. Investment Highlights
 Sydney Airport Investment Highlights Disclaimer General Securities Warning This presentation has been prepared by Sydney Airport Holdings Limited (ACN 075 295 760 / AFSL 236875). This presentation is not
Southwest Airlines Co. (NYSE: LUV) ONE YEAR PRICE RANGE : $ $73.62 LAST PRICE: $ ANALYST RATING: Long. VALUATION DATE: July 13, 2017
 ONE YEAR PRICE RANGE : $ $73.62 LAST PRICE: $ ANALYST RATING: Long. VALUATION DATE: July 13, 2017") Southwest Airlines Co. (NYSE: LUV) ONE YEAR PRICE RANGE : $69.66 - $73.62 LAST PRICE: $62.08 ANALYST RATING: Long VALUATION DATE: July 13, 2017 NEXT EARNINGS DATE: July 27, 2017 Investment Thesis: Dominant
Southwest Airlines Co. (NYSE: LUV) ONE YEAR PRICE RANGE : $69.66 - $73.62 LAST PRICE: $62.08 ANALYST RATING: Long VALUATION DATE: July 13, 2017 NEXT EARNINGS DATE: July 27, 2017 Investment Thesis: Dominant
GATWICK AIRPORT JOINS VINCI AIRPORTS December 2018
 GATWICK AIRPORT JOINS VINCI AIRPORTS December 2018 Asset presentation Gatwick is the 2 nd largest airport in the UK and the 8 th busiest in Europe with 46 mpax Key features 46 mpaxin FY18, in the wealthiest
AviAlliance The Airport Management Company
 AviAlliance The Airport Management Company Q4 / 2017 Contents AviAlliance GmbH page 3 Airport portfolio page 4 14 Athens International Airport page 5 Budapest Airport page 7 Düsseldorf Airport page 9 Hamburg
Management Presentation. March 2016
 Management Presentation March 2016 Forward looking statements This presentation as well as oral statements made by officers or directors of Allegiant Travel Company, its advisors and affiliates (collectively
Finnair Q result. 25 October 2017 CEO Pekka Vauramo
 Finnair Q3 2017 result 25 October 2017 CEO Pekka Vauramo 1 All-time best quarter Revenue up by 15% to record level of 735 M Aircraft flew full, passenger load factor was 87% Asian routes and San Francisco
Management Presentation. August 2012
 Management Presentation August 2012 Forward looking statements This presentation as well as oral statements made by officers or directors of Allegiant Travel Company, its advisors and affiliates (collectively
AirportInfo. Non-Aeronautical Revenue
 AirportInfo Non-Aeronautical Revenue July 2017 Non-Aeronautical Revenue Non-aeronautical revenue critically determines the financial viability of an airport, as these revenue sources tend to generate higher
Amadeus Jan-Jun 2018 Results
 2018 Amadeus IT Holding and its affiliates and subsidiaries Amadeus Jan-Jun 2018 Results July 27, 2018 Disclaimer This presentation may contain certain statements which are not purely historical facts,
Volaris Reports First Quarter 2017 Results: 19% Adjusted EBITDAR Margin
 Volaris Reports First Quarter 2017 Results: 19% Adjusted EBITDAR Margin Mexico City, Mexico, April 20, 2017 Volaris* (NYSE: VLRS and BMV: VOLAR), the ultra-low-cost airline serving Mexico, the United States