DELIVERING RELIABLE OPERATION AND AGILE RESPONSE
|
|
|
- Byron Armstrong
- 5 years ago
- Views:
Transcription

1 > ANNUAL REPORT 2002 For the Year Ended March 31, 2002 DELIVERING RELIABLE OPERATION AND AGILE RESPONSE Tokyo and Eastern Honshu EAST JAPAN RAILWAY COMPANY

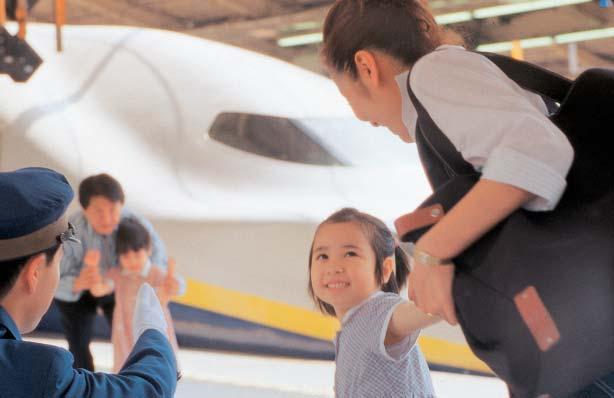
2 > PROFILE With passenger safety foremost in mind, JR East is moving forward and outward in an agile response to the opportunities and challenges of the economy. > JR East is the largest passenger railway company in the world, serving about 16 million passengers daily. > JR East alone provides nearly half of the huge volume of railway transportation in the Tokyo Area. > JR East operates a five-route Shinkansen (Bullet Train) network between Tokyo and major cities in eastern Honshu (mainland). > JR East s strong and stable core transportation business contributes 70% of operating revenues. > JR East has ability to leverage passenger traffic and railway assets to develop non-transportation businesses. > JR East has abundant and stable cash flow. Forward Looking Statements Statements contained in this report with respect to JR East Group s plans, strategies and beliefs that are not historical facts are forward looking statements about the future performance of JR East Group which are based on management s assumptions and beliefs in light of the information currently available to it. These forward looking statements involve known and unknown risks, uncertainties and other factors that may cause JR East Group s actual results, performance or achievements to differ materially from the expectations expressed herein. These factors include, without limitation, (i) JR East Group s ability to successfully maintain or increase current passenger levels on its railway services, (ii) JR East Group s ability to improve the profitability of its railway and other operations, (iii) JR East Group s ability to expand its non-railway operations and (iv) general changes in economic conditions and laws, regulations and government policies in Japan.

3 > CONTENTS Financial Highlights JR East at a Glance Message from the Management An Interview with the President Major Topics for the Year under Review Suica Redeveloped Ueno Station 18 Review of OperationsTransportation Shinkansen Bullet Train Network Tokyo Metropolitan Area Network Intercity and Regional Networks Travel Agency Services 26 Review of OperationsNon-Transportation Station Space Utilization Shopping Centers & Office Buildings Other Services Advanced Technology Development Environment Preservation and Social Contribution Facts about Key Issues Financial Section JR East in Perspective Organization Board of Directors and Corporate Auditors Glossary 1
4 > FINANCIAL HIGHLIGHTS East Japan Railway Company and Subsidiaries Years ended March 31, 2000, 2001 and 2002 Millions of Yen Percent Millions of U.S. Dollars (except for per share data) Change (except for per share data) / For the Year: Operating revenues... Operating income... Net income... Depreciation... Free Cash Flows*... 2,502, ,957 66, , ,277 2,546, ,751 69, , ,151 2,543, ,340 47, , , % $19,123 2, ,421 2,627 Amount per share of common stock (yen and U. S. dollars) : Net income... Net income and depreciation... 16,741 99,137 17,294 99,706 11,888 92, At Year-End: Total assets... Long-term debt (including current portion)... Long-term liabilities incurred for purchase of railway facilities** (including current portion)... Total long-term debt... 7,308,391 2,319,664 2,499,023 4,818,687 7,247,089 2,307,483 2,392,241 4,699,724 7,022,271 2,060,838 2,318,997 4,379, % $52,799 15,495 17,436 32,931 Total shareholders equity , , , ,998 Percent Net income as a percentage of revenues... Return on average equity (ROE)... Ratio of operating income to average assets (ROA)... Equity ratio... Debt-to-equity ratio % % % Notes: 1. Yen figures have been translated to U.S. dollars at the rate of 133 to US$1 as of March 31, 2002, solely as a convenience to readers. 2. There were 96 consolidated subsidiaries as of March 31, 2000 and 2001, and 101 as of March 31, Accounting Standards for Retirement Benefits were adopted beginning with the year ended March 31, * Cash flows from operating activities and cash flows from investing activities ** Long-term liabilities incurred for purchase of the Tohoku and Joetsu Shinkansen facilities, the Akita hybrid Shinkansen facilities and the Tokyo Monorail facilities 2,500 Operating Revenues and Operating Income Billions of Yen Net Income Billions of Yen 80 5,000 Total Long-Term Debt Billions of Yen 8,000 Total Assets and Total Shareholders Equity Billions of Yen Net Income and Depreciation Billions of Yen 400 2, ,000 6, , ,000 4, ,000 2, ,000 2, Operating revenues Operating income Long-term liabilities incurred for purchase of railway facilities Long-term debt Total assets Total shareholders equity 2
5 > JR EAST AT A GLANCE Transportation JR East s 7,538.1-kilometer rail network covers the eastern half of Honshu (mainland), including the Tokyo metropolitan area. The Company operates a transport business whose mainstay is passenger transport by railway through the use of this very profitable network. In the year ended March 31, 2002 (fiscal 2002), transportation operating revenues were 1,789.6 billion ($13,456 million). Major components of the transportation segment are as follows: Operating Revenues (Note) Operating Income Fiscal 2002 Shinkansen Bullet Train Network High-speed train services linking Tokyo with major cities Tokyo Metropolitan Area Network Trains serving the Tokyo area, the largest market in Japan Intercity and Regional Networks Intercity transportation other than Shinkansen network and regional transportation outside of the Tokyo metropolitan area network Travel Agency Services View Plaza (travel agencies at stations) and other outlets selling travel products Bus Services Bus services conducted in addition to railway operations 70% 74% Station Space Utilization Approximately 16 million passengers embark at JR East s stations every day. Station space utilization offers retailing and restaurant services to these customers through outlets at the stations and sales inside the trains. Station space utilization revenues were billion ($2,771 million) for fiscal Major components of the station space utilization segment are as follows: 14% Operating Revenues (Note) 8% Operating Income Retailing Retailing activities such as Kiosk outlets and convenience stores, both at stations, and sales of food, drinks and other goods on trains Restaurants Fast food stores and a variety of restaurants operated mainly at or near stations Shopping Centers & Office Buildings Shopping centers & office buildings activities include operating shopping centers and leasing office buildings and are carried out at stations used by enormous numbers of customers. Shopping centers & office buildings revenues were billion ($1,243 million) for fiscal % Operating Revenues (Note) 12% Operating Income Other Services JR East holds a large volume of assets with much potential for future development. Among these are land at or near stations, particularly in the Tokyo area. The utilization of these assets is mutually beneficial for activities in the other services segment and for railway operations. For fiscal 2002, the other services revenues amounted to billion ($1,653 million). Major components of this segment are as follows: 9% Operating Revenues (Note) 5% Operating Income Advertising and Publicity Advertising and publicity in stations and inside trains Hotel Operations Chain hotel businesses, including Metropolitan Hotels and HOTEL METS operated as part of the JR East Hotel Chain Information Services Information processing development, operations and support for Internet businesses and related activities Housing Development and Sales Primarily the development and sales of housing sites, houses and condominiums at locations along JR East s rail lines Card Business The View Card, a credit card that is honored at stations, stores at stations, hotels, shopping centers and VISA card member merchants Others Wholesales, truck delivery, cleaning and other businesses Note: Operating revenues mean operating revenues from outside customers. 3


6 > MESSAGE FROM THE MANAGEMENT The East Japan Railway Company (JR East) Group provides high-quality and advanced services based on sound management, with railway operations as its core, to fulfill its obligations to shareholders. For this purpose, every individual employee of the Group will endeavor to support safe and punctual transportation and supply convenient and high-quality products. Every employee will take on the challenge of improving the standard of services and raising the level of technology in order to further gain the confidence and trust of customers. As a Trusted Life-Style Service Creating Group, we will go forward with our customers to contribute to the achievement of better living standards, the cultural development of local communities and the protection of the global environment. > FISCAL 2002 RESULTS During the year ended March 31, 2002 (fiscal 2002), the Japanese economy reentered a period of weakness due to stagnation of production activities, exacerbated by reduction of exports due to the slowdown of the economy overseas. In addition, in September 2001 terrorist attacks occurred in the USA, which increased future uncertainties even further. Although exports and production appeared to stop declining towards the end of the fiscal year, the economy remained in the doldrums in general with weak personal consumption due to continuing severe employment condi- Masatake Matsuda Chairman tions and lower capital expenditures. JR East with its consolidated subsidiaries continued to make efforts to expand revenues by maximizing the use of operational resources such as railway networks of the Shinkansen lines and stations in order to overcome such severe situations and implemented measures to increase the efficiency of business operations by carrying out a comprehensive review of overall expenses. As a result, operating revenues decreased 0.1% to 2,543.4 billion ($19,123 million), while operating income decreased 2.3% to billion ($2,378 million). Net income decreased 31.3% to 47.6 billion ($358 million), affected by an increase in other expenses due to revaluation of part of securities held and loss on sales of fixed assets, despite lower interest expenses and gain on sales of investment in securities as a result of sales of some of its Japan Telecom shares. Mutsutake Otsuka President and CEO > ATTAINMENT OF FULL PRIVATIZATION Since its inception, JR East has continued to make efforts to implement the principle of the Japanese National Railways (JNR) restructuring to establish its independent management assuming sole responsibility for its own actions. The Law of Part Amendment to the Law concerning Passenger Railway Companies and the Japan Freight Railway Company (Law No. 61 in 2001) took effect on December 1, 2001, under which the regulations that had restricted JR East were abolished. In June 2002, full privatization, which had been the purpose of the JNR restructuring and the greatest management issue of JR East, was finally achieved through the disposal of the 500,000 shares of JR East owned by Japan Railway Construction Public Corporation. Full privatization will allow greater management flexibility and maneuverability. At the same time, it will also raise the expectations of 4
7 shareholders, customers and communities. In addition, we anticipate that the management environment surrounding JR East will present greater challenges due to uncertainties of future economic conditions, as well as a continuing decline in the birthrate and a rapidly aging population, and increased competition with other means of transportation. JR East will carry out the Group s medium-term business plan, New Frontier 21, speedily and surely in order to become a corporate group which is appreciated by all the people surrounding JR East in a true sense by dealing with these environmental changes appropriately. > MEDIUM-TERM BUSINESS PLAN JR East announced on November 29, 2000 the Group s medium-term business plan, which it calls New Frontier 21, for the period from fiscal 2002 to fiscal Based on this plan, JR East Group aims to create life-style services trusted by its customers via corporate activities open to the world to become what it calls a Trusted Life-Style Service Creating Group. Specifically, management will be carried out with five visions: creating customer value and pursuing customer satisfaction, innovation of business through the creation of technologies, harmony with society and coexistence with the environment, creating motivation and vitality, and raising shareholder value. We set five numerical goals to be achieved by or in fiscal In November 2001, adjustments were made with regard to consolidated free cash flows and the reduction of nonconsolidated total long-term debt. The objective for consolidated free cash flows, which was initially set at 180 billion in fiscal 2006 was revised to 200 billion. The objective for the reduction of nonconsolidated total long-term debt was initially set at 500 billion by fiscal 2006, and was revised to 750 billion. The other three objectives include improvement of the consolidated ROE (return on average equity) to 10.0%, increase of the consolidated ROA (the ratio of operating income to average assets) to 5.5%, and the reduction of 10,000 in the number of employees of the parent company. > CORPORATE GOVERNANCE To facilitate adequate and timely decisionmaking by the board of directors based on sufficient discussions, JR East is working on upgrading its corporate governance procedures. This includes incorporating the opinions of directors from outside JR East and corporate auditors. Furthermore, JR East is strengthening ties between the parent company corporate auditors and the auditors at each Group company. The objective is to ensure the soundness of the management of each Group company, with recognition that a company is evaluated on the performance of its entire group. Regarding the disclosure of information, JR East is strengthening its public information activities to ensure the public is better informed about JR East Group. JR East is also actively implementing investor relations activities, including information meetings for analysts and investors. > ESTABLISHMENT OF A SOUND MANAGEMENT BASE As an entirely private-sector enterprise, JR East intends to earn even greater trust by increasing customer satisfaction by offering safe and stable transportation and higher-quality services under customer-oriented management. JR East will also implement a management style balancing assertiveness and defensiveness and increase profits level by placing massive management resources into areas that are located in a superior competitive position and creating a basis for future growth. By implementing these measures, JR East will endeavor to fulfill the entrustment of the shareholders and investors. As in the past, we respectfully ask for your support and cooperation for the management team of JR East. July 2002 Masatake Matsuda Chairman Mutsutake Otsuka President and CEO 5
 in December 2001, JR East has become the")
8 > AN INTERVIEW WITH THE PRESIDENT > Mutsutake Otsuka, President and CEO, talks about the current and the future JR East, a company which accomplished full privatization recently. Mutsutake Otsuka President and CEO Following its exclusion from the Law for Passenger Railway Companies and the Japan Freight Railway Company (the JR Law) in December 2001, JR East has become the first JR company to achieve full privatization through the sale of all remaining shares held by the Japan Railway Construction Public Corporation. As President of JR East, how do you view this achievement? It is no longer necessary to obtain approval of the Minister of Land, Infrastructure and Transport for key management issues, as was required under the JR Law. In addition, the government is no longer able to intervene as a shareholder. I expect this freedom to have a significant positive effect on management, since we are now able to make various decisions more quickly. At the same time, I feel that we have taken on a much heavier burden of responsibility in terms of our ability to meet the expectations of our shareholders, as well as other stakeholders, including customers and the communities that we serve. Our key management concepts from now on, even more than before, will be autonomy and self-responsibility. Fifteen years have passed since the Japanese National Railways reforms. The path to full privatization was a long one, yet I believe that the process was a positive one in the sense that we had 15 years to build our strength. I look forward to our new challenges with great excitement. JR East is the focus of rising expectations. In November 2000, you launched the New Frontier 21 medium-term business plan. How do you want to change JR East now that you have achieved full privatization? In fact, when we developed New Frontier 21, we proceeded on the assumption that full privatization would be achieved. I am determined to complete all of the elements in the plan. Having achieved full privatization, I want us not just to reach, but also to exceed the numerical targets, and to do that ahead of 6
 October 1993 The first public sale of shares held by JNRSC 1,500,000 (37.")
9 > AUTONOMY AND SELF-RESPONSIBILITY Chronological table Shares held by government agency April 1987 JR East was established upon the division and privatization of the Japanese National Railways. 4,000,000 (100.0%) October 1993 The first public sale of shares held by JNRSC 1,500,000 (37.5%) Listed on the First Section of the Tokyo Stock Exchange and other exchanges in Japan August 1999 The second public sale of shares held by JRCC, a successor of JNRSC 500,000 (12.5%) June 2001 The JR Law Amendment Bill was passed. December 2001 The amendment to the JR Law took effect. June 2002 The third sale of shares held by JRCC Full privatization achieved. 0 (0%) JNRSC: Japanese National Railways Settlement Corporation JRCC: Japan Railway Construction Public Corporation schedule. I see full privatization as a driving force for New Frontier 21. You have completed the first year of New Frontier 21. What progress have you made? I regard the first year of a medium-term plan to be extremely important. I made it very clear to employees that we must all work to achieve results that would provide a strong initial impetus for New Frontier 21. In retrospect, it is clear that our business activities over the past year were affected by a number of events, including unforeseen ones. The September 11 terrorist attacks in the United States appear to have had a huge impact on the Japanese economy. The economy was already faltering, and the attacks pushed it further into recession. Inevitably, this situation affected our business. For example, operating revenue from our Shinkansen line operations was not as much as we had planned. Though the business environment was very difficult in terms of earnings, we were able to reduce our total long-term debt at year end by almost 320 billion. Contributing factors included the sale of our shares in Japan Telecom Co., Ltd. and the efficient operation of our new cash management system. Based on this result, I decided that it would be better to raise the target figures for New Frontier 21, so that the entire JR East Group could work New Frontier 21 Medium-Term Business Plan of JR East Group Creating Motivation and Vitality Creating Customer Value and Pursuing Customer Satisfaction Harmony with Society and Coexistence with the Environment together toward more ambitious outcomes. I therefore increased the target for reduction of nonconsolidated total long-term debt for the five-year period from 500 billion to 750 billion. I also decided to raise our free cash flows target for fiscal 2006 from 180 billion to 200 billion. We will continue to meet the challenge of these higher targets. Innovation of Business through the Creation of Technologies Raising Shareholder Value 7
10 > AN INTERVIEW WITH THE PRESIDENT > SPEEDY AND FLEXIBLE MANAGEMENT In addition, we introduced last November an automatic fare collecting system based on our Suica IC card. In December, we started operation of the new Shonan-Shinjuku line, which traverses central Tokyo and directly links the southern and northern suburbs of the metropolis. It was developed as part of our continuing efforts to enhance our network in the Tokyo metropolitan area, which is now our main priority. We acquired The Orangepage, Inc. in December and Tokyo Monorail Co., Ltd. in February. I expect these two companies to make an important contribution to the strengthening of the JR East Group. In February, Ueno station was opened after the completion of renovation work. Ueno was in effect the first station to be upgraded under the Station Renaissance program. It was an eventful year. However, we were able to launch new initiatives that have already started to contribute to performance and will continue to do so in the future. We also valued our financial instruments and real estate for sale at market prices and wrote off past latent losses. We encountered some issues, but overall I think it would be fair to say that it was a very fruitful year. You referred to the acquisition of The Orangepage and Tokyo Monorail. This kind of M&A activity seems to be a new direction for JR East. What criteria did you apply when making these decisions? We acquired companies that offered synergy benefits with our business activities. We were also taking advantage of the acquired companies leadership and experience in their fields with time efficiency. Tokyo Monorail provides access to Tokyo s Haneda International Airport. About 90% of its passengers link with the monorail system through our network, so they are our customers, too. The benefit that we gain from the acquisition of Tokyo Monorail is the ability to run our network and the monorail as an integrated system. There are plans for the construction of a new runway at Haneda, and passenger numbers are expected to grow. Looking at our Tokyo metropolitan area network and the monorail system, both are expected to play an important role in serving the expansion, and we see very promising synergies. That is why we acquired Tokyo Monorail. As a publisher of a very popular magazine, the Orangepage collects and analyzes information about consumer trends and develops products on the basis of that information. It has superb capabilities in this field. At first glance we seemed to have many opportunities to contact end users, but in fact our opportunities were relatively small. We expect the Orangepage to make an extremely important contribution to the development of our business activities, especially in the area of nontransportation business. Another showcase project for JR East is the plan that you recently announced for a major redevelopment of Tokyo station. How do you view this bold initiative? The Tokyo station redevelopment concept has been extensively discussed in the Company, Free Cash Flows Billions of Yen % ROE (Return on average equity) ROA [Ratio of operating income to average assets] % Nonconsolidated Total Long-term Debt Billions of Yen 500 billion 5,000 reduction achieved in 3 years 750 billion 4,537.5 reduction over 5 years 4,000 4, , , ,000 75,000 70,000 65,000 60,000 Number of Employees of Parent Company Number of employees 75,380 74,050-10,000 65, , ( ( 0 3, ( 50, ( ( ( 8
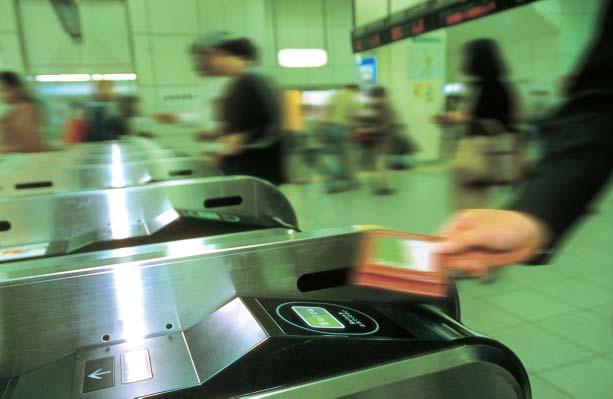
11 and we have also been in negotiation with outside entities. Because the investment involved is so huge, we needed to find ways to reduce capital expenditures while maximizing returns. One of the factors that drove our decision to go ahead with the redevelopment was the fact that we were able to trim the overall construction costs substantially by selling surplus air rights not required for the station building, or by transferring those air rights for other purposes. By using these transferred air rights, we were able to design a more efficient plan for commercial buildings than was thought possible in the past. Tokyo station is the face of Tokyo, and of Japan. We believe that JR East can benefit significantly by improving of this facility, and by establishing assets with high earning potential there. We want to make Tokyo station an important Tokyo landmark. There are also benefits to revitalization of Tokyo. We therefore discussed the plan with the Governor of Tokyo before making the decision to proceed. We intend to restore the two-story station building on the Marunouchi (western) side to its original three-story design, as completed in 1914 and renovate the plaza in front of the station to create a vista that suits Tokyo s status as a capital city. On the Yaesu (eastern) side, we will develop twin 200-meter-class buildings with space for generating income by the shopping center & office building businesses. The project will inevitably take a long time, since we need to minimize the inconvenience to the many people who use the station. We will complete the twin buildings on the Yaesu side in fiscal 2008 and 2011, and the overall improvement of Tokyo station will be finished in fiscal I have high hopes for this scheme, as our core project after the New Frontier 21 period. There is considerable interest in the new Suica service, which was launched in November. The service has reportedly been very successful. What is the current situation? It was very difficult to set the time for the launch of the Suica automatic fare collecting system, because it would affect so many people. In a system like this, even a small error can cause massive disruption. We therefore conducted extensive field testing and monitoring, and it was not until November 18 that we were fully confident to proceed. As a result of these careful preparations, we were able to introduce the system without significant problems. There has been a dramatic rise in the number of cardholders, which is already in excess of four million. The system is well supported by passengers, most of whom find it extremely convenient. At present Suica cards cannot be used to access the Shinkansen lines, but many passengers ask us why they cannot use their cards on the Shinkansen or other private railway lines. Having launched the system successfully, we now have a solid foundation for future expansion in various directions. In April we introduced a common Suica system for the Tokyo Monorail to allow passengers to board using their Suica cards. In December we will start through services between our Saikyo line and Rinkai line. It will be possible to provide a common Suica system on Rinkai line at that time. In fiscal 2004, JR West plans to introduce an automatic fare collecting system using an IC card identical to Suica. If other railway operators introduce compatible systems, passengers will be able to change from one network to another simply by using their Suica cards. I believe that the system has considerable potential to increase rail travel, or to halt downward trends. How do you view the potential of the Suica system in terms of future concepts and ideas? We do not see the Suica card as something that people will use only when traveling on trains. In fact we are making good progress with plans to integrate the Suica card with our credit card View Card in fiscal We are also considering the addition of electronic money function. Another concept calls for the installation of Suica chips in mobile telephones. The technology now available will allow passengers to use their mobile handsets to make reservations, go through the gate, and pay for fare adjustments. In this way, Suica has huge potential for the future. The Suica system will dramatically enhance passenger convenience. It will also bring major benefits to the Company. Because it is a contact-less system, the automatic fare collecting gates have fewer mechanical parts 9

12 > AN INTERVIEW WITH THE PRESIDENT than magnetic card systems. This translates into lower maintenance costs. Also, if Suica cards became more common, it could be possible to reduce the number of ticket vending machines, ticket offices and other facilities. Station staffing requirements would be reduced and additional space would become available for new business operations at locations in the Tokyo metropolitan area where passenger traffic is heavy. The card also promotes spontaneous and carefree use of trains. Instead of waiting in line at a ticket machine, that person can simply touch their Suica card to the automatic fare collecting gate and pass through immediately. Moreover, passengers no longer need to study route maps to work out the fares to their destinations. The system is extremely easy to use, and we believe that this characteristic has the potential to attract passengers to use rail travel more frequently, though we have not yet carried out detailed analyses. I call this the "dream card" because it has so many possibilities. We do not see the Suica card as something that people will use only when traveling on trains. I call this the dream card because it has so many possibilities. Have any other Japanese railway operators introduced large-scale IC card systems like Suica? Not at present. For that reason, we believe that the Suica card could easily become the de facto standard. Rapid processing is especially important in major cities, where passengers flow through the gates continuously. With conventional magnetic card systems, processing takes around 0.7 seconds per passenger. With the Suica system, that has been reduced to just over 0.1 seconds. No other system can process passenger data as quickly. In December 2002, the Tohoku Shinkansen line will be extended to Hachinohe. You referred earlier to the improvement of the rail network, including the opening of a new line in Tokyo. What other plans do you have to enhance the railway operations? Railway operations is obviously our core activity, and it is extremely important that we manage it well. The fulfillment of our Tokyo metropolitan area network and the Shinkansen bullet train network is especially crucial from this perspective. We plan to concentrate capital investment in these areas, and we will continue to develop new measures. We have completed the development of Shinkansen lines to connect most of the major regional cities in our service area with Tokyo. The only remaining area is Aomori, much of which will be covered when the Shinkansen line extension to Hachinohe is completed in December of this year. This will drastically reduce the time required to reach destinations, thereby enhancing our competitiveness relative to air transport. We are also taking the opportunity for an in-depth review of our Shinkansen services. One major change will be introduction of new cars designed to reduce swaying and improve passenger comfort. We are also looking at the issue of on-board ticket inspections, which may disturb passenger comfort. We are considering the elimination of this system, at least on Shinkansen trains. We will introduce a system under which all passenger information will be transmitted to the conductor s terminal as each passenger passes through the gate. The conductor will know immediately whether or not a passenger has the required tickets. We will continue to enhance our Shinkansen services to improve the traveling experience for our passengers. Let me ask you about the Tokyo metropolitan area network, which is another core transportation service. You spoke earlier about the 10
13 > AIMING TO BECOME THE WORLD S NUMBER-ONE RAILWAY existing tracks wherever possible, we simply passenger numbers might possibly increase Shin-Aomori Hachinohe introduced direct services between the Shonan from 30,000 a day to over 100,000. area in southern Tokyo and cities north of I mentioned the improvement of synergies Akita Morioka Tokyo in the direction of Omiya, via Shinjuku station. In fact, there are capacity bottlenecks and convenience between our network and the Tokyo Monorail service, and the start of Shinjo on Shonan-Shinjuku line, and we operate few trains during the morning and evening rush through services with Rinkai line. These initiatives can also been seen as part of our efforts Yamagata Niigata Sendai Fukushima hours. Though the number of trains is not large, the line is used by over 30,000 people daily. About one-third of those passengers to strengthen our network. We plan to establish another new direct service similar to the Shonan-Shinjuku line. This Joetsu have transferred to our service from parallel line will also link southern and northern Tokyo, Nagano services operated by major private railway but through Tokyo station. That would elimi- Takasaki Omiya Tokyo companies, because our service is more convenient or faster. When work to alleviate bottlenecks is completed, we will be able to oper- nate the need for some trains to pull in and head back out in the opposite direction at current terminal stations, such as Tokyo and Ueno, ate trains throughout the day. We think that and it will be possible to review train-yard sit- Tohoku Shinkansen Akita Hybrid Shinkansen (Through Service from Morioka to Akita) Yamagata Hybrid Shinkansen (Through Service from Fukushima to Shinjo) Joetsu Shinkansen Nagano Shinkansen Extension to Hachinohe (December 2002) Under Construction Omiya Akabane new Shonan-Shinjuku line, and it appears to have become extremely popular. Is there scope for further improvements in the Tokyo metropolitan area network? There is. The construction of additional tracks on existing lines and the construction of new lines involve enormous capital expenditure, and it is very difficult to recover that investment. Our strategy is to improve our network by using existing facilities as effectively as possible. The opening of Shonan-Shinjuku line involved minimal capital expenditure. Using Ikebukuro Ueno Shinjuku Hachioji Tokyo Shin-Kiba Takao Hamamatsucho Osaki Tokyo Teleport Haneda Airport Yokohama Note: Rinkai line is operated by Tokyo Waterfront Area Rapid Transit Corporation. Shonan-Shinjuku line (Through service via Shinjuku) Chuo Liner (Guaranteed-seat service) Tokyo Monorail Through service between Saikyo line and Rinkai line [December 2002 planned] Tohoku through line [Fiscal 2010 planned] (Through service via Tokyo) 11
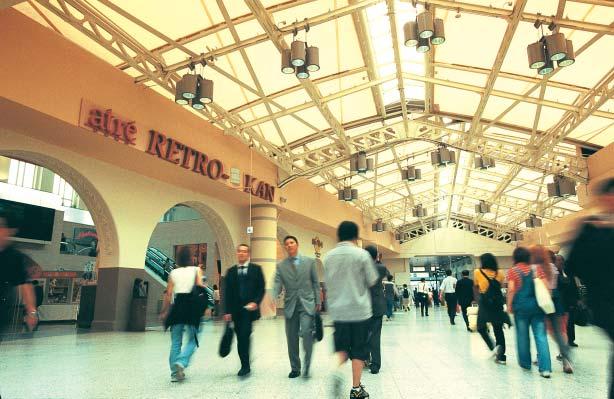
14 > AN INTERVIEW WITH THE PRESIDENT > BALANCING ASSERTIVENESS AND DEFENSIVENESS ing. One of our yards in the Tokyo metropolitan area currently cover around 200,000 square meters of prime real estate. A substantial part of that land would become surplus to requirements, and we are now considering alternative uses for the extra area, including its sale. One of the stated aims of New Frontier 21 is to seek to become the world s number-one railway. What are your specific thoughts on this? Our system is already the biggest in the world. But scale alone is not enough. We want to build a system that will be the best in the world by every definition, including safety, speed, customer service and maintenance. As I have already stated, railway operations are the core activity of the JR East Group, and it is extremely important that we maximize quality in all aspects of that activity. We have achieved full privatization. This is a good time to rid ourselves once more of the attitude that we have already accomplished enough. We must always search for new challenges. I believe absolutely that we need to examine our own performance carefully. Is our present speed good enough? How can we overcome environmental problems? In this sense, the goal of becoming number one in the world is a way of motivating ourselves to accept challenges. That attitude will lead to sustained improvement in our passenger services, and improved services will attract more passengers. The development of new technology is crucial to our success in meeting these challenges. Historically, the Railway Technical Research Institute has carried out technology development for the entire JR Group, but we also wanted to undertake a variety of technology development activities ourselves, and we therefore integrated and strengthened existing organizations and established the Research and Development Center of the JR East Group in December Areas of research include future railway concepts, safety improvement measures, enhanced maintenance systems, and customer services. Another focus of New Frontier 21 is the Station Renaissance program, the aim of which is to create the station environments for the 21st century. Public reaction to the development of Ueno station under that program appears to have been very positive. Yes, indeed. We opened the redeveloped Ueno station in February The aim of Station Renaissance is to develop stations not just as facilities for use by train passengers, but as places that will be used more by everyone. We want our stations to be places where people gather, visit and see or find something interesting. Our railway services are used by 16 million people everyday. If we can provide services that reflect the needs of these people, we will be able to enhance customer convenience while improving our earnings. Our aim when we started the program was to develop total station environments from this perspective. Ueno station was the first major project to be redeveloped under this concept. We did not limit our plans solely to the development of rows of attractive restaurants and shops. We wanted to turn the station into a place that could be enjoyed by all users, and by the local community as well. For example, we now have barrier-free facilities on all platforms. There are escalators and elevators everywhere, and we have also provided nursing rooms for mothers with babies. We approached the renovation project as a community initiative. Ueno station is located close to Tokyo National University of Fine Arts and Music, one of the world s leading educational institutions in fine arts field. So we sought their advice in the development of designs for the station. We also invited some local merchants to establish stores in the station. I have taken a close interest in this project, and I often go to Ueno station on Sunday. I am pleased to hear people saying that they have been impressed by the changes that we have made, and that they now find the station a very attractive and convenient place. I have also noticed that more young women are visiting the station now. Cosmos Plan STATION RENAISSANCE Creating New Station Environments for the 21st Century Sunflower Plan 12
15 Ueno station was not very popular with young women in the past. Now that the station has changed, is the visitor profile also changing? Indeed. There have been dramatic changes. As we develop other stations in the future, we may not necessarily use the same approach as we did at Ueno. What will be the same, however, will be our determination to turn the overall environment of each station into an exciting, attractive place to visit and spend time in, while enhancing its unique characteristics. That is the goal of the Station Renaissance program. We want our stations to be enjoyed by as broad a cross-section of society as possible. That is why we have improved our barrier-free facilities so that physically handicapped and aged people can visit our stations with confidence. Am I right in thinking this is community development rather than just station development? Yes. And when people come to our stations, we also benefit from business opportunities. What effect has the station development had on operating revenues for non-transportation businesses throughout Ueno station? It is too early to make any conclusions, because we just started operating the redeveloped station. However, the total number of people using Ueno station has risen, and the performance of our consumer service businesses is exceeding planned levels. We have achieved a synergy between our railway operations and our consumer service activities. I see. Your aim is to turn stations into something that are not only facilities that people simply pass through, but places where people will congregate. Finally, I would like to hear your views on full privatization again. When you took office as President of JR East in June 2000, you said that you wanted to achieve full privatization as quickly as possible, and then to establish a clear direction and goals with strengthened group management. Would you like to reaffirm your determination to shareholders as you move into the second year of New Frontier 21? I am very aware that full privatization means increased responsibilities for our management team. I am determined to achieve further improvement in our business performance, and to realize our New Frontier 21 goals as far ahead of schedule as possible and surpass objectives. The Japanese economy is not yet in recovery mode. Instead of taking a pessimistic view, however, I believe that we must work to maximize our results by using our resources to the When people come to our stations, we also benefit from business opportunities. In Ueno, we have already achieved a synergy between our railway operations and our consumer service activities. full. That is why I try to maintain a sense of speed as we implement various measures. We are determined to provide results that better reflect the expectations of our shareholders. I believe that all employees of JR East should make full privatization their opportunity to become true professionals. JR East was established 15 years ago. Now we are making another new start. New Frontier 21 is now in its second year. I want to use the successes of the first year to drive accelerated progress in the second. Our basic policies call for the establishment of a sound management base and strengthening financial position, and for strategies that ensure that capital expenditures do not exceed the level of depreciation. While remaining faithful to these policies, I believe that we also need to meet new challenges aggressively. In addition, I want to start laying foundations for our activities in the medium- to long-term future. My aim is to maintain a balance between aggressive and defensive strategies. 13

16
.")
17 > MAJOR TOPICS FOR THE YEAR UNDER REVIEWSUICA > DREAM CARD CONTAINING VARIOUS POSSIBILITIES JR East is the first company in Japan to introduce a large-scale IC card automatic fare collecting system. Under this system, passengers can pass through automatic fare collecting gates just by touching their commuter pass case containing an IC cardsuica (Super Urban Intelligent CArd). It can be used either as a high-tech commuter pass (Suica Pass) or a stored-fare railway ticket (Suica IO Card), replacing the magnetic cards that were formerly used. Because Suica Pass also has stored-fare function, settlement is done automatically by the fare collecting gate when passengers ride a train beyond the area covered by their commuter pass. Furthermore, it is possible to renew the valid period of the commuter pass by using the same card, due to a rewriting function. In addition, because the information of individual commuter passes is registered, reissue can be made promptly following loss. In this way, services that had not been offered before are now provided. Possibilities for new services and business development have been growing with the development of the Suica infrastructure, including the addition of an electronic money function, integration with the credit card of JR East, View Card, and integration with mobile phones. The Suica card will be integrated with the credit card of JR East, View Card, and will become functional as a credit card in fiscal Furthermore, JR East is considering enabling the card to be used for shopping at stores and shopping centers in and around stations of JR East by adding an electronic money function. JR East is also considering developing a new service, Mobile Suica, where booking a seat or paying for tickets can be made electronically; customers can travel without tickets just by carrying a mobile phone with them or make purchases at stores in and around stations. Suica was introduced in November 2001, and is currently in use at 470 stations, including 9 Tokyo Monorail stations, in an area covering almost all of the Tokyo metropolitan area. Future of Suica Trends of Suica Holders Promotion of combination with View Card Contactless IC card JR East menu Buying commuter passes Buying reserved seat tickets Consideration of developing Mobile Suica Infrastructure for introducing electronic money function 4,500,000 4,000,000 3,500,000 3,000,000 2,500,000 2,000,000 1,500,000 1,000, ,000 Persons /18 Nov. Dec. Jan. Feb. Mar. Apr. May. Suica Pass (Commuter pass) Suica IO Card (Stored-fare railway ticket) Suica Holder About 4.27 million people use Suica as of June 2002 (of which 2.27 million people use Suica Passes). 15
18
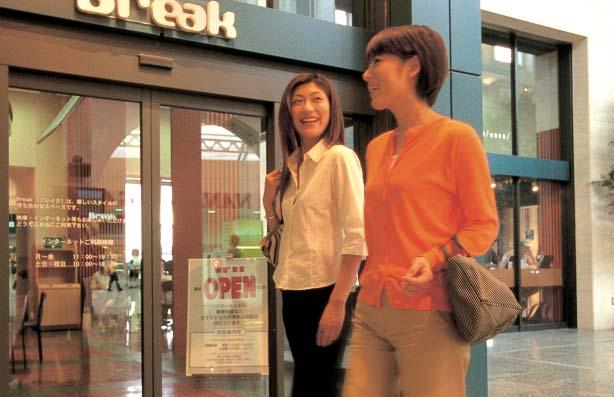
19 > MAJOR TOPICS FOR THE YEAR UNDER REVIEWREDEVELOPED UENO STATION > FROM A STATION OF PASSING TO A STATION OF GATHERING JR East Group has been making great efforts to carry out the Station Renaissance program for creating new station environments for the 21st century. The purposes of the program are to enhance customers convenience and to increase earnings power by bringing out 100% of the potential of the stations, which are the largest operational resources of the Group. This is one of the strategies of its medium-term business plan, New Frontier 21. The Cosmos Plan, which is a main part of Station Renaissance, is a new project targeting stations serving more than 200,000 passengers daily and major terminal stations in prefectural capitals. Station facilities will be completely reviewed and substantial new space will be created by constructing artificial ground, etc. The reborn Ueno station Ueno station was reborn in February 2002 as the first station developed under the Cosmos Plan. Ueno station, which originally opened in 1883, is one of the main stations within Yamanote line. The Ueno district is full of history, culture and vitality. JR East enhanced its earning power through the creation of a user-friendly station while maintaining the traditional aspects of the community. In addition, it opened new shopping street, atré Ueno, consisting of 54 restaurants and stores in a newly created commercial space of about 6,000 m 2. As a result, through the synergy effect of JR East s ability to attract customers at Ueno station and the activities of its nontransportation businesses, revenues from short-distance passenger tickets of the station increased UENO STATION IN THE TOKYO AREA and atré Ueno s sales are exceeding the pace of original projections. Omiya JR East will continue to make great efforts to further implement the Station Renaissance program, Ikebukuro Ueno which will enhance customer convenience Shibuya Tokyo Shinjuku Hachioji and the earning power of JR East by adding new Shinagawa Chiba functions and services compatible with the character and features of each station. Yokohama Six Busiest Yamanote-line Stations (avg. passengers daily) Shinjuku Ikebukuro Shibuya Tokyo Shinagawa Ueno Figures for fiscal , , , ,222 1,140,510 Yamanote line 1,507,582 5,000 4,000 3,000 2,000 1,000 0 Comparison of Major City Transportation Markets Number of Passengers (millions) 10,000 JR East N.A. Tokyo London Berlin Urban Railways (including JR East) Subways N.A. Paris Rome New York Tokyo: the year ended March 31, 2000 Reference: Statistics of Railways, Survey of Regional Movement, Ministry of Land, Infrastructure and Transport Urban Railways: 8 main passenger railways and JR East (JR East figures include data from the bordering lines of JR Central) Subways: Teito Rapid Transit Authority and Tokyo Metropolitan Transportation Bureau London: the year ended March 31, 2000 Reference: Transport Statistics Great Britain 2001 Subways: LUL Berlin: the year ended December 31, 1997 Reference: DBAG Annual Report and Accounts 1997 Urban Railways: Berlin S-Bahn GmbH Subways: BVG Paris: the year ended December 31, 2000 Reference: Rapport annuel 2000 RATP Urban Railways and Subways: RATP Rome: the year ended December 31, 2000 Reference: HPs of ATAC-Cotral Subways: Metroferro SpA New York: the year ended December 31, 2000 Reference: NYMTA Annual Report 2000, HPs of MTA, Jane's Urban Transport Systems 2001/2002 Urban Railways: Long Island Railroad, Metro-North Railroad, NJ Transit Subways: New York City Transit Authority, Staten Island Railway, PATH 17
20
21 > REVIEW OF OPERATIONSTRANSPORTATION > TRANSPORTATION BUSINESS SUPPORTS JR EAST AS A STABLE PROFIT RESOURCE. Aiming to Become the World s Number One Railway The railway is a safe and reliable mode of transportation. It is excellent method for transporting large volumes of passengers and freight rapidly, especially over medium and long distances. Railways are also extremely energy efficient and environment-friendly. JR East is using these characteristics to the full as it strives to build the best rail system in the world. Passenger Volume Passenger-Kilometers Japan U.K. Germany France Italy U.S ,419.7 Railways Motor Vehicles Airlines Ship Figures for Japan are for the year ended March 31, 2001; figures for the U.K. are for the year ended March 31, 2000; figures for Germany, France and Italy are for the year ended December 31, 1999; and figures for the U.S. are for the year ended December 31, Accident Frequency per One Million Train-Kilometers Billions 3,987.1 Number of Accidents Largest Passenger Volume Japan s economic and geographical characteristics are reflected in the heavy reliance of Japanese society on railways. JR East, which serves an area that includes Tokyo, boasts the highest passenger volume in the world. Safety and Reliability Japanese railways are famous for operating punctually. JR East maintains extensive safety and accident-prevention systems. This commitment is reflected in an extremely low accident rate and extremely reliable transportation services. JR East s average delay per train was 0.4 minutes for Shinkansen and 0.7 minutes for conventional lines, and railway operating accidents per one million train-kilometers were 0.45 cases in fiscal JR Group 0.65 Consumer-Focus Services U.K. N.A. JR East maintains a thorough commitment to con- Germany France sumers in all of its activities. Its aim is to provide services that precisely match customer needs. Italy U.S. N.A. Note: 1. As of December 31, 1999, except JR Group (including JR East) figures as of March 31, Germany: Deutsche Bahn AG (German Railways), France: Société Nationale des Chemins de fer Français (French National Railways), Italy: Ferrovie dello Stato S.p.A.(Italian National Railways), 3. Prepared by JR East based on materials from International Union of Railways (Union Internationale des Chemins de fer) 0.73 Environment Protection JR East makes strong efforts to protect the environment. It is working to minimize the environmental load from its activities by setting targets to be achieved by fiscal 2006 and by implementing its own action programs to achieve those targets. Operating Revenues Operating Income Passenger-Kilometers 70% (Millions of Yen) ,789, ,801,370 74% (Millions of Yen) , ,631 (Millions of Kilometer) Shinkansen network 17,741 17,679 Tokyo metropolitan area network 76,200 76,457 Intercity and regional networks 30,975 31,028 Notes: 1. Percentage is a ratio of fiscal Operating revenues mean operating revenues from outside customers. 19
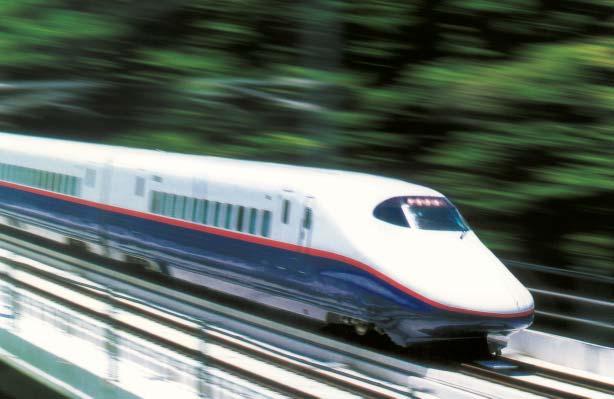
22 > REVIEW OF OPERATIONSTRANSPORTATION > SHINKANSEN BULLET TRAIN NETWORK > OVERVIEW JR East operates a five-route Shinkansen network, comprising the Tohoku, Joetsu and Nagano Shinkansen lines and the Yamagata and Akita hybrid Shinkansen lines, with through service to conventional lines (see map). The kilometer Tohoku Shinkansen runs between Tokyo and Morioka. The fastest train on this line covers the distance in 2 hours and 21 minutes. The kilometer Joetsu Shinkansen links Omiya and Niigata. Minimum time between Tokyo and Niigata (333.9 kilometers) is 1 hour and 37 minutes. The kilometer Nagano Shinkansen extends from Takasaki to Nagano. This service cuts travel time between Tokyo and Nagano (222.4 kilometers) to 1 hour and 19 minutes. Yamagata hybrid Shinkansen (through service to conventional lines) covers kilometers between Tokyo and Shinjo, and its shortest travel time is 3 hours and 7 minutes. Akita hybrid Shinkansen (through service to conventional lines) covers kilometers between Tokyo and Akita, and its shortest travel time is 3 hours and 49 minutes. Revenues from the conventional line sectors of hybrid Shinkansen services are credited to intercity and regional networks. Competition with Air Services Japanese railways enjoy a competitive advantage over air services in medium- and longdistance transportation up to 750 kilometers. All major cities in the area served by JR East fall within this radius from Tokyo, which means that JR East is well positioned to compete with airlines. > OPERATIONAL HIGHLIGHTS Extension of Shinkansen to Hachinohe In December 2002, the Tohoku Shinkansen will reach the city of Hachinohe. Hachinohe is located 96.6 kilometers from Morioka in the northern part of Japan s main island, Honshu (see map). The shortest travel time from Tokyo to Hachinohe (631.9 kilometers) will be reduced by about 40 minutes to just over 2 hours 50 minutes. Passengers making the kilometer journey from Tokyo to JR East s Five-Route Shinkansen Network Joetsu Nagano Shin-Aomori Akita Shinjo Yamagata Niigata Takasaki Tokyo Omiya Hachinohe Morioka Sendai Fukushima Tohoku Shinkansen Akita Hybrid Shinkansen (Through Service from Morioka to Akita) Yamagata Hybrid Shinkansen (Through Service from Fukushima to Shinjo) Joetsu Shinkansen Nagano Shinkansen Extension to Hachinohe (December 2002) Under Construction Shares of Each Mode of Transportation in Japan According to Distances Average from Fiscal 1996 to Fiscal km km km km km Over 1000km Total Number of Passengers (millions) , , JR Passenger Companies (including JR East) Other Passenger Railways Motor Vehicles Ships Airlines Source: Ministry of Land, Infrastructure and Transport Figures are based on number of passengers 20
23 Aomori will be able to change to a limited express train on a conventional line at Hachinohe, and the shortest travel time for the trip will be cut by about 30 minutes to just under 4 hours. To coincide with the extension to Hachinohe, JR East will introduce new type of trains equipped with ITbased services (see IT-related Topic). There will also be new features designed to enhance passenger comfort, including an active suspension system to control horizontal movement of the railcars. To reduce costs, JR East also emphasized ease of maintenance in the design of the new railcars. In addition, significant portion of the railcars will be built using environment-friendly recyclable materials. Seating Services There is growing demand for commuter services via the Shinkansen network. To stimulate further growth in demand, JR East is strategically increasing capacity by introducing Max all-double-decker E4 series Shinkansen trains. > IT-related Topic New Train for Hachinohe Extension JR East will introduce a new type of trains for the opening of the Hachinohe extension on the Tohoku Shinkansen in December JR East plans to cease on-board ticket inspection by utilizing information gathered as passengers pass through the automatic fare collecting gate. LED displays in the trains will show information of the train s operations. In addition, a digital control system based on information technology will provide gentle, loss-free braking. This feature will improve passenger comfort while reducing traveling times and allowing trains to operate at closer intervals. On-Board Ticket Inspection Passenger information is transmitted directly to the conductor s portable terminal as soon as each passenger passes through the automatic fare collecting gate at stations. This minimizes disturbance to passengers in the trains and eliminates the need for manual onboard ticket inspections. Advanced E2 series Shinkansen for Hachinohe extension Trains traveling between Tokyo and Hachinohe will be changed from the eight-car trains that currently operate between Tokyo and Morioka to a 10-car format. Shinkansen commuting scene This 16-car, Max all-double-decker E4 series Shinkansen with 1,634 seats, boasts the largest capacity in the world for highspeed train services. Shinkansen On-Board Ticket Inspection System Station Reservation data On-board ticket inspection is not required for passengers who passed through the automatic fare collecting gate. No ticket check is required. Conductors portable terminal Reservation status for the train is updated soon after the train leaves each station. Reservation data distribution server 21
24 > REVIEW OF OPERATIONSTRANSPORTATION > TOKYO METROPOLITAN AREA NETWORK > OVERVIEW This network consists of 1,106.1 operating kilometers that link central Tokyo with surrounding areas. Most of these lines are within a radius of about 100 kilometers from Tokyo station. JR East claims nearly half of the Tokyo area rail transportation market, which is immense and profitable, in terms of both passenger-kilometers and operating revenues. Rush Hour on Yamanote Line The commuter rush hours on Yamanote line encircling Tokyo are well known. The Tokyo metropolitan area has a population of 33 million. Everyday, over 2.5 million passengers, commuting into Tokyo, involves a change from suburban commuter trains extended outward from the Tokyo area in five directions. During peak times, some of the JR East trains in the Tokyo metropolitan area network run at 120- second intervals. Competition with Subways and Other Major Passenger Railways Competition with subway networks and other major passenger railway systems in Tokyo is intensifying due to ongoing development of their networks and services. JR East is meeting this challenge by strengthening its network through the opening of various routes. By using existing facilities, it is able to develop new routes without large-scale capital outlays. JR East has never raised fares since its inception in 1987, except to reflect the introduction and revision of the consumption tax. On the other hand, faced with sizable investments needed to boost capacity, most of the other major passenger railways have been compelled to raise fares repeatedly on most of their lines during the same period. Thus JR East s price competitiveness has risen. Upgrading commuter services is a primary objective in this sector. JR East is taking many steps to increase capacity and relieve congestion, as well as to raise train speeds and increase passenger comfort for example by operating commuter trains that provide guaranteed-seat service. > OPERATIONAL HIGHLIGHTS > IT-related Topic Suica JR East launched the IC card Suica automatic fare collecting system in November This convenient new system enables smooth passage through the automatic fare collecting gate merely by touching it with the Suica card, without the need to remove it from its case. As of June 2002, the service was available at 470 stations, including 9 Tokyo Monorail stations, throughout most of the Tokyo metropolitan area network. Opening of New Routes In December 2001, JR East opened the new Shonan-Shinjuku line, which traverses central Tokyo through Shinjuku station and directly links the southern and northern suburbs of the metropolis. In December 2002, JR East will introduce through services between its Rush hour on Yamanote line Automatic ticket vending machine that adds stored value to Suica IC cards. 22
25 Saikyo line and Rinkai line. Rinkai line is operated by Tokyo Waterfront Area Rapid Transit Corporation and serves Tokyo s waterfront district. In addition, work will begin on the development of another new direct service, which will also link southern and northern Tokyo, but through Tokyo station. These new routes will reduce travel times, eliminate the need to change trains and alleviate congestion on parallel sections of Yamanote line. Tokyo Monorail In February 2002, JR East acquired Tokyo Monorail, which provides access to Tokyo s Haneda International Airport. Haneda is the closest airport to central Tokyo. It is already used by 50 million people a year, and there are proposed plans for the future construction of a new runway. Around 90% of Tokyo Monorail passengers transfer from lines run by JR East. In December 2002, work will begin on the construction of escalators and other facilities to facilitate transfers and provide barrier-free access to the Monorail terminal at Hamamatsucho station. This acquisition will strengthen JR East s network and stimulate new demand. Chuo Liner In December 2001, JR East introduced the Chuo Liner on its Chuo line. The purpose of the new service was to improve seating services on Tokyo s crowded trains by running trains with all reserved seats. When a passenger buys a Liner ticket at a ticket machine in a station, the information is immediately transmitted to the conductor s terminal. The conductor then only needs to inspect the tickets of passengers sitting in unsold seats. Chuo Liner Enhanced Tokyo Metropolitan Area Network Omiya Akabane Ikebukuro Ueno Takao Hachioji Shinjuku Tokyo Shin-Kiba Hamamatsucho Osaki Tokyo Teleport Haneda Airport Yokohama Shonan-Shinjuku line (Through service via Shinjuku) Chuo Liner (Guaranteed-seat service) Tokyo Monorail Through service between Saikyo line and Rinkai line [December 2002 planned] Tohoku through line [Fiscal 2010 planned] (Through service via Tokyo) Note: Rinkai line is operated by Tokyo Waterfront Area Rapid Transit Corporation. 23
26 > REVIEW OF OPERATIONSTRANSPORTATION > INTERCITY AND REGIONAL NETWORKS > OVERVIEW Made up of 5,475.7 operating kilometers, intercity and regional networks represent over 70% of JR East s total network. They provide non-shinkansen intercity services and regional services not included in the Tokyo metropolitan area network. The main services of the intercity network are the limited express trains. JR East continues to upgrade services with new rolling stock, more frequent departures and more convenient connections to Shinkansen lines. On the regional network, the Company is striving to raise efficiency. This primarily involves efforts to keep schedules closely in line with demand and the use of railway cars that require only a single operator. Competition with Automobiles Automobiles have an advantage in regional services outside of the Tokyo metropolitan area network because of their ability to provide door-to-door services. JR East is responding to this challenge by developing diversified services aiming at coexistence with automobiles, such as offering of bus or car-rental services. > OPERATIONAL HIGHLIGHTS Park and Ride Parking lots at stations are being developed, especially in regional cities, to meet the needs of passengers who drive to their local station and then travel by train to their destinations. By the end of March 2002, parking lots with a total capacity for around 59,000 vehicles had been established at about 520 stations. These figures include both parking lots set up by JR East and large-scale free-parking facilities set up by local governments. Rail and Rent-a-Car JR East offers an innovative approach to travel. Passengers can combine the comfort of rail travel to their destination station, with the freedom of a rental car after they arrive. The Rail and Rent-a-car service, introduced a new service in April 1995, which allows passengers to rent cars at about one-half of the normal rate. As a result, in fiscal 2002, the number of passengers using the Rail and Rent-a-car service was about 148,000, which is nearly double the total for fiscal Introduction of New Types of Limited Express Trains JR East introduced new types of trains for limited express services, Azusa and Kaiji on Chuo line, which connect the Tokyo area and Kofu and Matsumoto, in December Because Chuo line runs through a section with rigid geographical features, the comfort of this new type of train has been improved by lowering the center of balance and controlling the entire train by computers. Larger windows are fitted for the enjoyment of the magnificent landscapes along the lines to enhance the attractiveness of train travel for passengers. Park and ride New types of limited express train E257 series for Azusa and Kaiji on Chuo line 24


27 > TRAVEL AGENCY SERVICES > OVERVIEW JR East conducts sales of travel packages mainly in the View Plaza chain (travel agency), which has outlets at stations. In particular, JR East will implement customer-friendly measures on the basis of market research and planning of packages attractive to target customers by using its railway network. JR East also distributes information regarding attractive travel packages using railways by utilizing various media such as mass media and the Internet. > OPERATIONAL HIGHLIGHTS Travel products sold by JR East are carefully designed to match customer preferences. The current line-up includes the following products. Nombiri Komachi The Nombiri Komachi, or refreshing tours for young women, brand was launched in February The products are targeted toward working women in their twenties and thirties, who form a large population group in Japan and are strongly motivated toward travel. In fiscal 2002, packages were booked by almost 28,000 people. Otona no Kyujitsu The Otona no Kyujitsu, or holiday for seniors, brand first went on sale in July The products are designed to meet the travel needs of senior citizens in the 60-plus age group, in response to Japan s rapidly graying society. Watashi no Kazoku The Watashi no Kazoku, or tours for families, brand was launched in March In April 2002, full two-day weekends were introduced at all Japanese elementary schools and junior high schools. These family-oriented products were developed in response to the growing popularity of family weekend activities. > IT-related Topic eki-net Travel In April 2001, JR East established a web site ( where consumers can book all of their ticketing requirements, including not only JR line tickets, but also air tickets, rental cars and hotels. World eki-net There is also a web site ( where passengers can book JR line tickets, including Shinkansen and Narita Express (which connects Narita International Airport with central Tokyo) tickets, in English. Current line-ups of travel packages From left, Nombiri Komachi, Otona no Kyujitsu and Watashi no Kazoku 25

28
29 > REVIEW OF OPERATIONSNON-TRANSPORTATION > STATION RENAISSANCECREATING NEW STATION ENVIRONMENTS FOR THE 21ST CENTURY Creating Synergies between Railway Operations and Non-Transportation Businesses JR East stations, which are used by 16 million people everyday, are the Group s biggest business resource. JR East is dynamically implementing the Station Renaissance program to take full advantage of the potential of this resource. JR East is promoting an in-depth review of station spaces and creating synergies between railway operations and non-transportation businesses. Station Space Utilization Operating Revenues Operating Income Sunflower Plan Launched in fiscal 1998, the Sunflower Plan mainly targets stations with passenger numbers generally in excess of 30,000. Activities include partial reviews of operational facilities at and around stations and short construction schedules with minimal investment to develop stores. In fiscal 2002, the Sunflower Plan initiatives added and improved a total of 20,000 square meters of space in stations, and 80 new restaurants and stores were opened. Cosmos Plan This new plan was launched in December It involves comprehensive reviews of existing operational facilities at stations where passenger numbers are in excess of 200,000, and major terminal stations in prefectural capitals. In addition, substantial new station spaces are being created 14% 8% Operating Revenues (Millions of Yen) Operating Income ,553 26, ,994 27,104 Shopping Centers & Office Buildings Operating Revenues Operating Income through various means, including the construction of artificial ground. 7% 12% (Millions of Yen) Operating Revenues Operating Income ,276 38, ,818 34,619 Stations are the largest business resources of JR East, which are used by about 16 million customers per day. Customers viewpoints The viewpoint of increasing the Group value SUNFLOWER PLAN Partial review of layout of facilities at stations Speedy development with small investment Other Services Operating Revenues Operating Income Designing the most appropriate layout of facilities at each station from scratch Giving full play to the comprehensive power of the Group by using stations as stages Enhancement of attraction of stations Effecting a structural change into higher revenues COSMOS PLAN Designing new ways of using space and time Full-scale review of layout of facilities and existing stores at stations Creation of space by constructing artificial grounds, etc. 9% 5% Operating Revenues (Millions of Yen) Operating Income ,950 16, ,859 18,092 Notes: 1. Percentage is a ratio of fiscal Operating revenues mean operating revenues from outside customers. 27
30 > REVIEW OF OPERATIONSNON-TRANSPORTATION > STATION SPACE UTILIZATION > OVERVIEW Each day, 16 million passengers pass through JR East stations. Space in those stations is utilized for a variety of businesses, including retail outlets, convenience stores and restaurants. The list includes 1,100 kiosks selling newspapers, snacks and other items, as well as 300 convenience stores. Regarding these stores, JR East makes strong efforts to vitalize them by carrying attractive merchandise and enhancing services, as well as by actively renewing the stores. Moreover, JR East is developing new types of businesses by introducing the know-how of companies outside the Group. > OPERATIONAL HIGHLIGHTS Development of New Business Formats JR East is working to meet the increasingly diverse needs of customers by forming partnerships outside of its own corporate group with companies that have strong brand names. These partnerships allow JR East to apply the knowledge and other resources of non-group companies to the development of products and menus that are suitable for station sites. To date, partnerships have been formed with Ryohin Keikaku Co., Ltd., which sells products under the Muji brand, Fast Retailing Co., Ltd., the casual apparel chain operator, and Yoshinoya D&C Co., Ltd., which operates over 1,000 gyudon (beef bowl) restaurants. Tokyo Shokudo Central Mikuni s was opened in Tokyo station in October 2001 in partnership with Kiyomi Mikuni, a noted international chef specializing in French cuisine. The restaurant offers an extensive menu of reasonably priced Japanese, Western and Chinese food, ranging from light snacks to full-course meals. Fusion of Railway Operations and Non-transportation Businesses JR East has begun to develop stores that combine a variety of services, including retailing, food and beverages and sales of travel packages. In May 2001, it established Becks Coffee and Mujirushiryohin.COM KIOSK outlets in the ticket office and View Plaza travel agency of Hachioji station (Tokyo). In March 2002, fusion stores with café facilities were opened in the View Plaza of Kichijoji station (Tokyo), Tokyo station and Shin-Urayasu station (Chiba). O-bento In July 2001 JR East introduced a new frozen O-bento (lunch-box) made entirely from organic natural ingredients. These revolutionary products set a new standard for safe, healthy, high-quality lunches. JR East estab- Tokyo Shokudo Central Mikuni s Shopping complex in Hachioji station O-bento 28

31 lished a local subsidiary and food manufacturing plant in California. Food is processed there and then imported into Japan for sale as frozen lunch-boxes. Restructuring of Retailing and Restaurant Operations The JR East Group is also restructuring its retailing and restaurant operations. In April 2001, a subsidiary which operated restaurants merged with another subsidiary which operated fast food stores. By combining knowledge of both the restaurant and fast food fields, this new organization will be able to manage outlets with enhanced efficiency. In October 2001, JR East restructured its convenience store operations and launched a new format called NEWDAYS. The merchandise procurement and distribution and computer systems of these stores are being integrated to improve operating efficiency. a specified station on the following day. Goods can be picked up at 288 outlets in 188 stations, mainly in the Tokyo metropolitan area (figures are as of May 31, 2002). IT is helping to boost the sales performance of the entire JR East Group. For example, by using the Internet, it is possible to offer a wide range of goods, even in the limited space available in stations. Shopping mall eki-net Shopping > IT-related Topic eki-net Shopping Stations are used everyday by large numbers of commuters, making them the ideal distribution points for IT-based service. Since April 2000, customers have been able to pick up books, CDs and other merchandise ordered over the Internet shopping mall, eki-net Shopping, at convenience stores and certain restaurants in stations. From September 2001, shoppers can order books and pick them up at NEWDAYS New format of JR East s convenience store 29
32 > REVIEW OF OPERATIONSNON-TRANSPORTATION > SHOPPING CENTERS & OFFICE BUILDINGS > OVERVIEW Stations and nearby land are highly profitable assets of JR East. Shopping centers on station land raise the value of existing assets while offering passengers the convenience of being able to do their shopping at stations. As of March 31, 2002, JR East was operating 110 shopping centers and 13 office buildings. When developing these facilities, JR East is concentrating on creating a mix of tenants that reflects customers needs, the nature of the site and the characteristics of the local market. > OPERATIONAL HIGHLIGHTS New Buildings at Terminal Stations At terminal stations, JR East is constructing large-scale buildings using the space above tracks and land adjacent to stations. In April 2002, a new building was opened at Meguro station on Yamanote line. In the spring of 2004, a new office building will be completed at Shinagawa station. There are also plans for a large-scale development at Tokyo station. J-kids Lumine Kitasenju Nursery School Mitaka Lonlon Kitasenju Ueno Mitaka Tokyo JR Tokyu Meguro Building Meguro Shinagawa JR Tokyu Meguro Building In April 2002, JR East and Tokyu Corporation jointly opened the JR Tokyu Meguro Building. The new building includes a complex consisting of a station, office space and retail outlets above the tracks at Meguro station, which is served by a total of four railway lines, including JR East s Yamanote line and Tokyu s Meguro line, providing direct access to many locations in central Tokyo. This location is ideal for both office and retail facilities. JR East owns approximately 24,000 m 2 out of total floor area of approximately 52,000 m 2. Large-Scale Development Plan at Tokyo Station On the Yaesu (eastern) side of Tokyo station, JR East plans to build twin high-rise towers with an aggregate planned floor space of approximately 340,000 m 2, for use mainly as offices and shopping centers. Construction will be completed in fiscal 2008 for the first phase and in fiscal 2011 for the second phase. In addition, the historic station building on the Marunouchi (western) side of Tokyo station will be restored to its original form as completed in That project will be completed in fiscal There are also plans for the redevelopment of the stationfront community squares on each side of Tokyo station. Construction will be finished in fiscal JR Tokyu Meguro Building Large-scale development plan at Tokyo station (conceptional drawing) Mitaka Lonlon Mitaka Lonlon is an example of a suburban station building with a focus on the essentials of daily life. J-Kids Lumine Kitasenju Nursery School In August 2001, J-Kids Lumine Kitasenju Nursery School opened in Kitasenju in northeastern Tokyo as the fourth tenant of this type. Stations provide extremely convenient locations for such facilities, and more are expected to appear in the years ahead. 30

33 Focus on Everyday Living At suburban stations, JR East operates smaller shopping centers at stations. The main tenants are retailers with a focus on the essentials of daily life, such as fresh food stores, drug stores, bookstores, CD shops and restaurants. These outlets are popular with customers in the communities around the stations. > IT-related Topic Ekipara Ekipara is a portal site established to provide integrated access to all information, mainly about JR East Group shopping centers at stations. Users can retrieve information by location or type of business or shop, including data about almost 110 shopping centers and 9,000 shops. Other services include an magazine and message board pages for members. > OTHER SERVICES Ekipara ADVERTISING AND PUBLICITY > OVERVIEW Spaces in stations and trains of JR East, whose network is used by 16 million passengers daily, are ideal for a broad range of advertisements. JR East is promoting advertising services by utilizing such spaces. For example, a single 11-car Yamanote line train has space for more than 1,500 individual ads, all benefiting from high readership. Efforts continue to target the development of new advertising techniques in a manner that addresses the needs of customers and bolsters advertising revenues. > OPERATIONAL HIGHLIGHTS Advertising on Train Car Bodies Prohibition of advertising on the outside of trains by the Tokyo Metropolitan Government for aesthetic reasons has now been lifted, and in February 2002, JR East began to sell advertising space on its train car bodies. There is strong interest in advertising on Yamanote line cars, which has particularly high impact because of the large number of passengers that use the line. > IT-related Topic In-Train Video Advertising The E231 series Yamanote line cars, which were introduced in April 2002, have two 15- inch display monitors above each door. These are used to display video advertising, as well as train operating information and other information. Advertising on train car bodies In-train video advertising 31
34 > REVIEW OF OPERATIONSNON-TRANSPORTATION HOTEL OPERATIONS > OVERVIEW Hotels are a powerful vehicle for generating income from real estate holdings and have synergies with railway operations and travel agency operations. JR East has established several types of hotels, including city hotels, business hotels and long-term-stay hotels, under separate brands. Since April 1998 JR East Hotel Chain, which is centralizing management of these brands to better enable hotel operations to benefit from JR East s network and generate economies of scale. Among specific actions are stronger chain management, as well as joint advertising and procurement activities. > OPERATIONAL HIGHLIGHTS The HOTEL METS Chain HOTEL METS specializes mainly in accommodation services. It offers comfortable, reasonably priced rooms with facilities similar to those found in city hotels. As of June 2002, there are 12 HOTEL METS, mostly located in the Tokyo area. A new one will open in Hachinohe to coincide with the extension of the Tohoku Shinkansen line in December The quality of the HOTEL METS chain is being improved through service standardization, including the development of know-how based on the ISO 9001 quality management system, for which JR East has acquired certification. HOTEL METS Shibuya was opened at Shibuya station in November There is fierce competition among business hotels in the Shibuya district, but the new hotel is strongly differentiated by its direct access to the station and by an array of tenant retailers specializing in goods and services that appeal to working women, including a health supplement store and a relaxation salon. This is the 11th HOTEL METS, and with 186 rooms it is the largest. The Hotel Metropolitan Chain The JR East Group has developed 10 full-service, city hotel-type Metropolitan Hotels. These are located mainly in Tokyo, prefectural capitals and at Shinkansen stations. The Hotel Edmont is a city hotel located in the Iidabashi district of central Tokyo. To meet the strong demand for accommodation, a 220-room annex will be opened on currently under-utilized land near the hotel in March Metropolitan Hotels HOTEL METS YAYOI Kaikan Long-term stay Hotels Nagano Niigata Akita Shinjo Yamagata Nagaoka Takasaki Tokyo Kitakami Omiya Morioka Sendai Fukushima HOTEL METS Shibuya Hotel Edmont Annex (conceptional drawing) Urawa Tabata Ikebukuro Hotel Edmont Kokubunji Shinjuku Tokyo Shibuya HOTEL METS Shibuya Shinagawa Musashi Mizonokuchi Kawasaki 32
35 CARD BUSINESS > OVERVIEW JR East s credit card, View Card, has a growing number of cardholders, mainly people who patronize JR East stations, shopping centers and hotels. As of the end of June 2002, the number of View Card members is approximately 2.2 million based on the number of applications. Beginning in April 2000, View Card is honored at the approximately 22 million VISA member merchants all over the world, making the card substantially more convenient to use. JR East plans to continue aggressive expansion of its credit card business. Growth will enable JR East to raise the level of service to customers by responding to Japan s rising demand for cashless purchasing, as well as to generate valuable cardholder data on purchasing patterns that can be incorporated in marketing programs. Another key strategy calls for the future integration of View Card with Suica. > OPERATIONAL HIGHLIGHTS > IT-related Topic View Card with Suica Functions In fiscal 2004, JR East will combine its Group credit card, View Card, with its Suica contactless IC card, allowing Suica cardholders to use their Suica cards as credit cards. VIEW ALTTE ATM In October 2001 JR East launched its new VIEW ALTTE ATM network. Under this system, cashing services provided by other credit card companies can be used. By the end of June 2002, 85 terminals had been installed in 49 stations. More Cards Accepted for Over-the-Counter Ticket Purchases Until recently the only credit card accepted for over-the-counter ticket purchases in almost all stations of JR East was View Card. Since October 2001, customers have also been able to use JCB, Visa, MasterCard, American Express and Diners Club credit cards. VIEW ALTTE ATM 33
36 > ADVANCED TECHNOLOGY DEVELOPMENT > OVERVIEW The business environment in which JR East operates is changing rapidly because of the diversification and increasing sophistication of customer needs, the aging of the population, Japan s low birth rate and deregulation. As part of its adaptation to this environment, the JR East Group established the Research and Development Center of JR East Group in December The Center will serve as an integrated organization for the Group s R&D activities, which were previously dispersed. Through this center, JR East carries out technological development to further enhance safety, reduce costs and undertake other timely objectives. The R&D focus for the JR East Group is the e@train concept. We refer to the newest and best form of what the railway of the future should be as e@train. It integrates the technological advancements and human imagination of the times and is subject to constant improvement as we harness ongoing technological developments and new ideas. The aim of this concept is to develop a safe, punctual, comfortable and easy-to-use railway system that is capable of meeting the diverse needs of customers. We will realize this goal by applying our accumulated technical knowledge and advanced technology to the creation of new value. The letter e stands for various meanings, including enjoyment, environmental friendliness, entertainment and economy. > TOPIC Principal e@train Research Themes With the aim of realizing its e@train railway concept, each of the four R&D facilities of the Research and Development Center of JR East Group currently carries out the following research. Research & Development Center of JR East Group R&D Center Frontier Service Development Laboratory Advanced Railway System Development Center Safety Research Laboratory Technical Center Research and Development Center of JR East Group Opened in December 2001, the new Research and Development Center is located in Saitama City, about 30 minutes by train from central Tokyo. New Railway Concept e@train Anytime Anywhere Anyone Home, Office, etc. Ticket Office Seamless access to trains Providing information to meet diversified customers demand Station Check Gate On-board Customized on-board services Ticketless, cashless (PDA function + Ticket function Control + Money function) Shinkansen as No. 1 Reliable & cost-effective facilities Inheriting railway technologies Control system with IT Destination Infrastructure Station Environment-friendly railway system People-friendly stations Easy Enjoyable Economical 34
37 FRONTIER SERVICE DEVELOPMENT LABORATORY Marketing This facility carries out innovative primary research in marketing, for example by conducting surveys to predict future trends. Because the Company s services in the past tended to be biased toward those centered on hardware, personnel have been recruited from outside of the JR East Group. Services Using IT JR East is conducting research and development related to a variety of high-tech service enhancements based on advanced information technology. This includes realization of ticketless and cashless transactions by the further development of Suica, development of a security system geared to railway stations and the development of ticket sales terminals with voice recognition capabilities. ADVANCED RAILWAY SYSTEM DEVELOPMENT CENTER Advanced Commuter (AC) Train The AC Train is a next-generation commuter train designed to meet passenger needs in the 21st century. Track trials commenced in February The World s Best High-Speed Rail System (Shinkansen) With the aim to make its Shinkansen system the world s best high-speed rail system, JR East continues to develop improved trains and infrastructure for its Shinkansen. JR East is developing faster, more comfortable and more environment-friendly Shinkansen. Renovation of Control System Advances Previously, train location was detected by using track circuits. In the new IT-based train control system ATACS, a train detects its location by itself. By introducing ATACS, we will continue to reduce costs by efficiently allocating the ground and on-board equipment, to further improve safety and to improve transportation efficiency by using IT to the full. SAFETY RESEARCH LABORATORY Preventing Major Accidents The Safety Research Laboratory leads R&D activities relating to the elimination or reduction of the four types of risk affecting safety: collisions, level crossing accidents, natural disasters and derailments. TECHNICAL CENTER Maintenance Cost Reduction The Technical Center carries out a variety of development activities relating to the reduction of maintenance costs. Project areas include labor-saving equipment and mechanization systems. The AC Train A train which addresses the needs of the 21st century, such as cost reduction, improved transport reliability, improved passenger services, improved transportation accessibility and environment-friendly operation. East-i This next-generation integrated electrical testing vehicle operates on Shinkansen tracks. It handles tasks that previously had to be performed manually, such as track inspections and testing of contact wires. TC type low-maintenance track This track was designed to minimize labor requirements for maintenance tasks. 35
38 > ENVIRONMENT PRESERVATION AND SOCIAL CONTRIBUTION ENVIRONMENT PRESERVATION > OVERVIEW Railways are the most energy efficient means of mass transportation. Railways account for approximately 30% of passenger transportation in Japan but only 7% of energy consumption. In addition, emissions of carbon dioxide, which is blamed to be the cause for global warming, are low in proportion to the unit transportation volume. Through its railway operations, JR East plays an important role in preserving the environment. > TOPIC Environmental Targets JR East established its Ecology Promotion Committee in In 1996, it set environmental targets that included a 20% reduction of carbon dioxide emissions compared with levels in fiscal This emphasis on environmental activity guidelines continued during the formulation of New Frontier 21, which includes environmental targets to be achieved by fiscal Environmental Management In February 1999, JR East s Niitsu Rolling Stock Plant became the first Japanese Railway facility to obtain certification of ISO 14001, an international standard for environmental management systems. JR East has emphasized its environmental management system through various measures, including publicly announcing its environmental accounting, starting from September Specific environmental initiatives include the introduction of the E231 series rolling stock, which require only one-half of energy required by conventional rolling stock. Measures such as this have slashed CO2 emissions resulting from JR East operations in fiscal 2002 by 17% compared with the level recorded in fiscal JR East is an active recycler. Trash is sorted at stations or on trains for recycling. For example, old newspapers are recycled to make copy paper for use at JR East s offices. Efforts such as this have raised the general waste recycling rate for JR East s stations and trains to 36%. Barrier-Free Access JR East continues to promote the construction of comfortable railways that can easily be used by not only physically disabled people, but also passengers that are not accustomed to using railways, in line with the trends of an aging society and international society at large. CO2 Emission Volumes in Proportion to the Unit Transportation Volume of Each Means of Transportation in Japan (g-co2/passenger-km) JR East Railways Buses Private autos Airplanes Note: Prepared by JR East based on the Survey on Transportation-Related Energy Consumption, 2000 edition (results of the year ended March 31,1999) Entry/exit steps for passengers in wheelchairs The AC Train, a next-generation commuter train system, has specially designed steps to facilitate wheelchair accessibility. 1,200 1, Trend of the Number of Stations with Elevators and Escalators Units Number of Stations Environmental Report The full Environmental Report is available for download at english/index.html Escalators Stations with escalators Elevators Stations with elevators
39 SOCIAL CONTRIBUTION > OVERVIEW JR East contributes to the enrichment of regional culture through its involvement in a variety of cultural activities. The Group s cultural initiatives are mainly conducted through the East Japan Railway Culture Foundation. JR East also contributes to the international community by sharing of railway technology and corporate culture through Union Internationale des Chemins de fer (UIC). Replica of the original Shimbashi station (conceptional drawing) JR East is building a replica of the original Shimbashi Station, from which Japan s first train departed in1872. The building will be completed in the spring of It will be used as a public museum with displays detailing railway history and culture. > TOPIC East Japan Railway Culture Foundation JR East established the East Japan Railway Culture Foundation in March It has continuously supported the Group s social contribution activities such as promotion of regional culture, railway-related surveys and research and international cultural exchanges. Union Internationale des Chemins de Fer (UIC) JR East is a full member of the UIC, an organization dedicated to international cooperation among the world s railway companies. The JR East Group contributes to the international community through its railway technology, including participation in technological cooperation, and the acceptance of trainees. UIC crew seminar JR East Chairman Masatake Matsuda is serving as Vice Chairman of the UIC and Chairman of the World Executive Council, which is the decision-making institution of UIC. 37
40 > FACTS ABOUT KEY ISSUES Complete Private-Sector Ownership JR East has 4 million shares of common stock issued and outstanding. When the Company s shares were listed on domestic stock exchanges in October 1993, 2.5 million shares were sold to the public. Subsequently, 1 million shares were sold to the public in August The remaining 500 thousand shares which had been held by the JNR Settlement Headquarters of Japan Railway Construction Public Corporation (JRCC) were sold to the public in June 2002, and JR East finally achieved full privatization to become an entirely private-sector enterprise 15 years after its inception. Prior to this achievement of full privatization, the amendment law, which generally excluded the three JR Companies in Honshu (the Company, Central Japan Railway Company and West Japan Railway Company), from the Law Concerning Passenger Railway Companies and the Japan Freight Railway Company (the JR Law) took effect in December Previously, under the JR Law, approval of the Minister of Land, Infrastructure and Transport was required for a number of actions. Among them were issuing new stock and bonds; taking out loans with a repayment period of more than one year; appointments and dismissals of representative directors and corporate auditors; annual business plans; the transfer of major property; and the appropriation of earnings. The Company is no longer subject to these approvals. Under the authority of the amended JR Law, the Minister of Land, Infrastructure and Transport has issued guidelines relating to the matters needing consideration for the time being in cases where the three companies in Honshu including the companies which, if any, will be involved in management of the railway business by splitting, etc., (the Three Companies and their successors) carry out business in order to secure passengers convenience, etc., in consideration of the purpose of the JNR restructuring. The amended JR Law also provides that the Minister of Land, Infrastructure and Transport may guide and advise the Three Companies and their successors in cases where business operation that takes these guidelines into account is needed to be secured, and warns and directs them further in case where business operation contrary to the guidelines is carried out without any justifiable reason. Matters provided in the guidelines are as follows: Matters relating to security of tie-up and cooperation between the companies such as appropriate set-up of passenger fares and charges between JR companies, smooth use of railway facilities and other factors of the railway businesses. Matters relating to appropriate maintenance of the routes currently in operation and security of users convenience at the time of preparation of the stations and other railway facilities considering change in the trend of transport demand and other factors after the implementation of the JNR restructuring. Matters relating to consideration given to small- and medium-sized companies in order to avoid inappropriate interference in business activities of such companies or inappropriate violation of their benefits. JR East has been taking note of the matters provided in its guidelines while carrying out its business operations and intends to continue to do so as a matter of course in the future. Therefore, JR East does not think the existence of these guidelines will hinder its management. Although the Company is no longer subject generally to the amended JR Law, all bonds issued by the Company prior to December 1, 2001, the effective date of the amendment to the JR Law, are and will continue to be general mortgage bonds as required under the JR Law which are entitled to a statutory preferential right over the claims of unsecured creditors of the Company. Any bonds issued on or after December 1,2001 are unsecured bonds without general mortgage preferential rights. The Company issued its first unsecured bonds in March
41 Disposition of Long-Term Liabilities of Former Japanese National Railways (JNR) When JNR was restructured in April 1987, responsibility for its long-term liabilities was clearly divided between the national government and the JR Companies. The process leading to this division included debate in the Diet. At the time of the restructuring, JNR s liabilities totaled 37.1 trillion, including costs that will be incurred in the future. The JR Companies were allocated 14.5 trillion of this amount, and Japanese National Railways Settlement Corporation (JNRSC) assumed responsibility for the remaining 22.7 trillion. It was decided at this time that JNRSC would repay as much of this amount as possible using funds generated by the sale of land left by JNR and JR Company stock held by JNRSC. Any remaining liabilities were to be assumed and disposed of by the national government. However, sales of land by JNRSC were temporarily halted by the October 1987 Guidelines for Urgent Measures to Deal with Land that were determined by the Cabinet. Japan s economy subsequently fell into a recession in the early 1990s, further preventing JNRSC from selling land. Furthermore, a delay in the sale of stock in JR companies and other factors meant that liabilities could not be decreased; on the contrary, interest payments caused them to increase. As of April 1987, liabilities held by JNRSC were 25.5 trillion, the combination of the above-mentioned 22.7 trillion and 2.9 trillion. The 2.9 trillion was one portion of the Shinkansen usage fees paid by the three Honshu-based JR passenger railway companies, and was to be used to repay JNRSC s debt. Due to the above factors, these liabilities had grown to 28.3 trillion by the dissolution of JNRSC in October In October 1998, the Law for Disposal of Debts and Liabilities of the Japanese National Railways Settlement Corporation was passed and enforced. It included the following provisions concerning the disposal of JNRSC s liabilities: JNRSC s interest-bearing liabilities would be assumed by the national government s general account and JNRSC would be absolved of its non-interest bearing liabilities to the government. The land, JR Company stock and other assets held by JNRSC would be transferred to JRCC, which would pay for pension and other obligations. With regard to the amount to be transferred from the Japan Railways Group Mutual Aid Association to the Welfare Pension, a portion of the liabilities legally assigned to JNRSC would become additional obligations of the JR Companies. Discussing the possibility of imposing further additional liabilities on the JR Companies, the Prime Minister stated during the debate in the Diet prior to passage of this law: Regarding those debts and pension liabilities of JNRSC that have not been designated for assumption by JR Companies, the Government is of the view that such obligations must not be imposed on JR Companies in the future. Construction and Operation of Seibi Shinkansen Lines The Seibi Shinkansen is a network of proposed Shinkansen lines pursuant to the Nationwide Shinkansen Railway Development Law. The basic plan for these new lines was decided in Currently, work is under way on five sectors of three lines. Within JR East s service area, JRCC is now involved in building full-scale Shinkansen lines on the Hokuriku Shinkansen line s one sector (Nagano Joetsu) and on the Tohoku Shinkansen line s one sector (Hachinohe Shin-Aomori). Service on the Hokuriku Shinkansen line s sector from Takasaki to Nagano already commenced in October 1997 (operationally named Nagano Shinkansen). The operation of the Tohoku Shinkansen line s sector from Morioka to Hachinohe will start on December 1,
42 > FACTS ABOUT KEY ISSUES JR East has reached the following agreement with the government. (1) JR East will pay only usage fees after the Company has started operations on the new lines. The usage fees will not exceed the corresponding benefits of the applicable line. JR East will incur no financial burden other than these usage fees. (2) JR East will separate itself from conventional lines running parallel to the new Shinkansen lines. JR East agreed to the construction of the two lines mentioned above in its service area based on its judgment that these new lines would not adversely affect the Company s results. In December 1996, the Japanese government and ruling parties agreed that all future decisions regarding the order for starting construction on Seibi Shinkansen lines should be based on the assent of the local governments and relevant JR company in respect of the profitability of each sector of the lines and management separation of the parallel conventional lines, etc., and that the financial burden of each JR company should be limited to usage fees and advance payments that do not exceed the corresponding benefits of the applicable line in each company s service area. In May 1997, an amendment to the Nationwide Shinkansen Railway Development Law was passed. This amendment clarifies the division of responsibilities for funding new Shinkansen lines between the national and prefectural governments. Under this system, the national government funds two-thirds of construction costs and prefectures fund the remainder. JR East confirmed the basic principles of the Seibi Shinkansen lines in respect of the sectors between Hachinohe and Shin-Aomori of the Tohoku Shinkansen line and between Nagano and Joetsu of the Hokuriku Shinkansen line within the JR East s service area and has agreed to construct them. The construction of these two sectors commenced in March The construction of these two sectors is estimated to complete 12 years later and a little more than 12 years later, respectively, from the date of amended license of construction dated April JR East s Yamagata and Akita hybrid Shinkansen are not covered by the Nationwide Shinkansen Railway Development Law. JR East has constructed these two lines independently, with the cooperation of the national and local governments in the form of interest-free loans and other support. Deregulation In December 1996, the Ministry of Transport (predecessor of the Ministry of Land, Infrastructure and Transport) decided on a policy of abolishing most of its restrictions, originally imposed to maintain the supply-demand balance, on the entry of companies in the public transportation sector. After much internal and public debate at the Council for Transport Policy and other organizations, an Amendment Bill to the Railway Business Law was passed in May 1999 and enforced in March It includes the following provisions: Review of regulations on entry and withdrawal Previously, railway companies needed a license from the Minister of Transport (predecessor of the Minister of Land, Infrastructure and Transport) to operate. The amended law requires only the Minister s permission. Operators wishing to cease providing a service now need to submit notification one year in advance, without having to seek permission as was previously required. Revisions of regulations on fares and charges The amended law clearly states that approval is required for upper limits on ordinary fares and Shinkansen 40
43 charges, a level below which companies can set and revise fares on their own after submitting prior notification of such action. Further, the amended law requires prior notification for revisions to limited express charges, which previously required approval for revisions, making revisions the same as those for Green Car (first class car) and Sleeper Car charges. Revision of regulations on technology Procedures for obtaining approval for construction, a process that was extremely complex, have been simplified for railway companies certified by the national government as having a certain level of technical skills. JR East has adopted the following positions regarding these changes. Entry and withdrawal: Even though demand and supply restrictions have been lifted, the huge initial investment required by railways and extremely long period needed to recover those investments make it highly unlikely that a new competitor would have any impact on the Company s results. Regarding withdrawal, JR East welcomes the establishment of a clear withdrawal method to replace the previously vague standards. However, the Company has no concrete plan at this time to cease service on any particular line, and regards this as a matter for future consideration. Revisions of fares and charges: Regarding the approval of the Minister of Land, Infrastructure and Transport for upper limits on fares and charges, examinations must be conducted to ensure fares and charges do not exceed the sum of reasonable costs and profits following submission of an application for the approval of a fare and charge increase by a railway company. This calculation method is called the total-cost method. The Company believes that this method has a number of major drawbacks. Among them are (1) higher costs can be translated into higher fares and charges, so there is no incentive for companies to implement effective management practices, and (2) the process of determining applicable expenses entails considerable time and labor expenses; government authorities thus become involved in how railways are managed. Due to these problems, JR East has strongly urged that the total-cost method be replaced with the pricecap method. Under this method, railway companies would be free to adjust fares by submitting notification within a prescribed range, such as one based on the consumer price index. This method is already being applied to utilities in the United Kingdom, the United States and other countries. The government will continue to study the price-cap method and other ways to improve the system for determining railway fares. Unfortunately, a plan does not exist at the present time for the immediate adoption of the price-cap method. Unless there is a significant change in the operating environment, JR East intends to retain its policy of avoiding fare increases. That means JR East will not be subjected to the total-cost method system for the time being. On the other hand, the decision of whether or not to adopt the price-cap method will not have an immediate effect on JR East s operations, although JR East will continue to strongly urge adoption of this method in order to establish an independent base for the Company s management. Technology: For the new system for certifying railway companies, JR East obtained certification in December 2000 for the first time as a railway company. 41
44 > FACTS ABOUT KEY ISSUES Changes in Accounting Standards In Japan, the accounting standards are presently being revised significantly in line with the trend of adoption of the international accounting standards, which enable more accurate understanding and analysis of the operating results and the financial position of the whole corporate group. Following are the revised matters already applicable from the year ended March 31, Shift in emphasis from nonconsolidated to consolidated financial statements Scope of consolidation to be decided on the basis of the effective control and influencing standards Presentation of statements of cash flows Adoption of tax effect accounting Following are the revised matters applicable from the year ended March 31, Presentation of interim consolidated financial statements (applicable from the interim period ended September 30, 2000). Adoption of Accounting Standards for Retirement Benefits (recognition of obligations for severance and retirement benefits, etc.)* Adoption of Accounting Standards for Financial Instruments (market values of financial instruments, etc.)* In April 2002, Japan s Business Accounting Council issued draft accounting standards calling for the adoption of asset impairment accounting. Under the proposed accounting standard for long-lived assets, companies would be required to recognize an impairment loss in their income statements if certain indicators of asset impairment exist and the book value of an asset exceeds the undiscounted sum of future cash flows of the asset. The impairment loss would be measured as the excess of the book value over the higher of (I) the fair market value of the asset net of disposition cost and (II) the present value of future cash flows arising from ongoing utilization of the asset and from disposal after asset use. The standards cover land, factories, buildings and other forms of property, plant and equipment. Assets would be grouped at the lowest level for which there are identifiable cash flows that are independent of the cash flows of other groups of assets. Restoration of previously recognized impairment losses would be prohibited. The draft calls for a two-year phase-in period beginning with the year ending March 31, 2004 during which companies may voluntarily adopt the new standards and mandatory adoption of the standards by the year ending March 31, The Business Accounting Council plans to issue a final set of standards in the summer of 2002 at the earliest, after evaluating comments received on the draft standards. Until the final set of standards is announced and its application to railway companies is determined, JR East cannot predict the future effect of the new accounting standards on its results of operations. *For further details, see Notes to consolidated financial statements. 42
45 FINANCIAL SECTION > CONTENTS Year Summary Consolidated Financial Review Consolidated Balance Sheets Consolidated Statements of Income Consolidated Statements of Shareholders Equity Consolidated Statements of Cash Flows Notes to Consolidated Financial Statements Report of Independent Public Accountants Consolidated Subsidiaries and Equity Method Affiliated Companies 43
46 > 10-YEAR SUMMARY East Japan Railway Company and subsidiaries Years ended March 31 Operating results Operating revenues Operating expenses Operating income Net income Segment information (*1) Operating revenues from outside customers Transportation Station space utilization Shopping centers & office buildings Other services Total Segment information (*2) Operating revenues from outside customers Transportation Merchandise sales Real estate leasing Other services Total Financial Position Total assets Long-term debt (including current portion) Railway facilities purchase liabilities (including current portion) (*3) Total long-term debt (sum of two items above) Total shareholders equity Cash flows (*4) Cash flows from operating activities Cash flows from investing activities Cash flows from financing activities Per share data Net income Shareholders equity Cash dividends Ratios Net income as a percentage of revenues Return on average equity (ROE) Ratio of operating income to average assets (ROA) Equity ratio Debt-to-equity ratio Other data Depreciation Capital expenditures (*5) Interest expense Number of consolidated subsidiaries (As of March 31) Number of employees (*6) ,338,772 1,875, ,466 56,776 1,868, , ,817 2,338,772 7,032,943 2,295,382 3,021,739 5,317, , ,940 (331,195) (169,002) 14, ,597 5, % 10.7% 6.6% 7.8% 1,176.3% 280, , ,343,346 1,902, ,881 56,688 1,861, , ,698 2,343,346 7,054,909 2,232,203 2,969,802 5,202, , ,146 (314,868) (142,502) 14, ,679 5, % 10.0% 6.3% 8.3% 1,100.9% 269, , *1 The segmentation was changed to four new segments beginning with the year ended March 31, The information for the year ended March 31,2001 is reclassified according to the new business segmentation. (see note 16 to consolidated financial statements) *2 Real estate leasing was separated from other services beginning with the year ended March 31, *3 Long-term liabilities incurred for purchase of the Tohoku and Joetsu Shinkansen Facilities, the Akita hybrid Shinkansen facilities and the Tokyo Monorail facilities *4 Owing to a change in accounting standards, statements of cash flows after the year ended March 31, 2000 use presentation methods different to those of previous years. *5 These figures exclude expenditures funded by third parties, mainly governments and their agencies, which will benefit from the resulting facilities. *6 Beginning with the year ended March 31, 2000, number of employees excludes employees assigned to other companies and temporary employees. *7 Upon the merger of Japan Railways Group Mutual Aid Associations into the Welfare Pension, the Company shared the shortage of the assets to be transferred amounting to 77,566 million. This was paid in a lump sum and was accounted for as a long-term prepaid expense included in the other item of other assets on the balance sheets and was charged to income from the year ended March 31, 1998 to the year ended March 31, 2002 on a straight-line basis. (see note 2 to consolidated financial statements) ,447,955 2,034, ,409 65,545 1,837, , ,191 2,447,955 7,291,152 2,255,471 2,912,176 5,167, , ,935 (351,321) (54,251) 16, ,323 5, % 10.9% 5.8% 8.5% 1,070.3% 288, , ,520 44
47 Millions of Yen (except for per share data) ,473,200 2,059, ,816 68,431 2,513,790 2,097, ,402 70,661 2,514,808 2,146, ,699 66,235 2,483,594 2,149, ,472 21,929 2,502,909 2,160, ,957 66,963 2,546,041 2,222, ,751 69,174 2,543,378 2,227, ,340 47,551 1,801, , , ,859 2,546,041 1,789, , , ,950 2,543,378 1,839, , ,507 2,473,200 1,855, , , ,466 2,513,790 1,836, , , ,702 2,514,808 1,808, , , ,894 2,483,594 1,799, , , ,213 2,502,909 1,805, , , ,907 2,546,041 7,345,760 2,247,931 2,851,373 5,099, ,291 7,384,463 2,223,163 2,812,547 5,035, ,510 7,381,794 2,285,063 2,713,737 4,998, ,424 7,287,033 2,320,246 2,610,966 4,931, ,880 7,308,391 2,319,664 2,499,023 4,818, ,401 7,247,089 2,307,483 2,392,241 4,699, ,568 7,022,271 2,060,838 2,318,997 4,379, , ,761 (342,507) (99,288) 497,242 (419,923) (77,240) 410,662 (379,156) (52,674) 365,296 (282,082) (72,298) 474,715 (292,438) (168,133) 455,470 (266,319) (161,109) 455,045 (105,645) (433,589) 17, ,323 5,000 17, ,878 5,000 16, ,356 5,000 5, ,720 5,000 16, ,100 5,000 17, ,892 5,000 11, ,687 5, % 10.6% 5.7% 9.1% 994.6% 2.8% 10.2% 5.7% 9.7% 923.4% 2.6% 8.9% 5.0% 10.4% 861.3% 0.9% 2.9% 4.6% 10.5% 846.9% 2.7% 8.3% 4.7% 11.7% 750.4% 2.7% 7.8% 4.4% 12.7% 681.5% 1.9% 5.1% 4.4% 13.3% 650.7% 275, , , , , , , , , , , , , , , , , , , , , , , , , , , ,200 *8 Net income decreased significantly in the year ended March 31, 1999, mainly because cash charges for additional obligation related to transfer to Welfare Pension was accounted for in other expenses. This additional obligation of 70,475 million, including the interest portion, was paid in accordance with the enactment of the Law for Disposal of Debts and Liabilities of the Japanese National Railway Settlement Corporation. (see Facts about Key Issues Disposition of Long-Term Liabilities of Former Japanese National Railways ) *9 Beginning with the year ended March 31,1999, the declining balance method has generally been applied with respect to depreciation for structures related to Shinkansen railway fixtures. The straight-line method had been applied prior to the year ended March 31,1999. *10 Accounting Standards for Financial Instruments were adopted beginning with the year ended March 31, (see notes 2 and 7 to consolidated financial statements) *11 Tax effect accounting was adopted beginning with the year ended March 31,2000. (see notes 2 and 12 to consolidated financial statements) *12 Accounting Standards for Retirement Benefits were adopted beginning with the year ended March 31, (see notes 2 and 13 to consolidated financial statements) 45
48 > CONSOLIDATED FINANCIAL REVIEW 5,000 4,000 3,000 2,000 1,000 1, Total Long-Term Debt (Billions of Yen) Long-Term Liabilities Incurred for Purchase of Railway Facilities Long-Term Debt Total Long- Term Debt- Shareholders Equity (Billions of Yen) Overview and Basic Financial Policy During the year ended March 31, 2002 (fiscal 2002), the Japanese economy reentered a period of weakness due to stagnation of production activities, exacerbated by reduction of exports due to the slowdown of the economy overseas. In addition, in September 2001 terrorist attacks occurred in the USA, which increased future uncertainties even further. Although exports and production appeared to stop declining towards the end of the fiscal year, the economy remained in the doldrums in general with weak personal consumption due to continuing severe employment conditions and lower capital expenditures. JR East with its consolidated subsidiaries continued to make efforts to expand revenues by maximizing the use of operational resources such as railway networks of the Shinkansen lines and stations in order to overcome such severe situations and implemented measures to increase the efficiency of business operations by carrying out a comprehensive review of overall expenses. As a result, operating revenues decreased 0.1% to 2,543.4 billion ($19,123 million), while operating income decreased 2.3% to billion ($2,378 million). Net income decreased 31.3% to 47.6 billion ($358 million), affected by the increase in other expenses due to revaluation of part of securities held and loss on sales of fixed assets, despite lower interest expenses and gain on sales of investment in securities as a result of a partial sale of its Japan Telecom shares. The shareholders equity ratio rose to 13.3% at the end of fiscal 2002 from 12.7% at the end of fiscal For fiscal 2002, 102 subsidiaries were consolidated in the consolidated statement of income. Six subsidiaries were newly consolidated in fiscal 2002, because of investments and split-off. Liquidation of a subsidiary was completed in fiscal Furthermore, one subsidiary was deconsolidated in fiscal 2002, because of its merger with another subsidiary. As a result, the number of subsidiaries included in the consolidated balance sheet as of March 31, 2002 was 101. For fiscal 2002, four affiliated companies were accounted for by the equity method. One affiliated company was newly accounted for by the equity method in fiscal 2002, and a second affiliated company was newly included in the consolidated balance sheet as of March 31, 2002, due to their increased significance in the aggregate. Two other affiliated companies were accounted for by the equity method until the interim period ended September 30, 2001, but ceased to be accounted for by the equity method because of sales of shares by JR East. As a result, the number of equity method affiliated companies included in the consolidated balance sheet as of March 31, 2002 was two. The basic financial policy is to maximize free cash flows. Reducing total longterm debt remains the most important issue for the time being, with the recognition that strengthening financial position is still necessary. To ensure a suffi- Note: In this discussion, total long-term debt is the aggregate of long-term debt and long-term liabilities incurred for purchase of railway facilities, including the current portion. 46
49 Operating Revenues (Billions of Yen) cient level of funds to achieve debt reductions and meet other requirements, capital expenditures will basically continue to be conducted in an efficient manner so as not to exceed depreciation. Total long-term debt at year end was reduced by billion, resulting in total long-term debt of 4,379.8 billion ($32,931 million) on March 31, ,500 2,000 1,500 1, Transportation Station Space Utilization Shopping Centers & Office Buildings Other Services Operating Revenues Operating Income (Billions of Yen) Fiscal 2002 Results Operating revenues decreased 0.1% to 2,543.4 billion ($19,123 million) and operating income decreased 2.3% to billion ($2,378 million). The ratio of operating income to operating revenues was 12.4%. Transportation Operating income from transportation decreased 3.7% to billion ($1,771 million). The decrease arose primarily from a 0.7% decline in transportation operating revenues from outside customers due to a decrease in revenues from railway passenger ticket sales. Transportation operating expenses decreased only 0.1%. Revenues from railway passenger tickets, which constituted 93.2% of revenues from transportation from outside customers in fiscal 2002, reflect sales of ordinary tickets and commuter passes. Revenues from railway passenger tickets decreased 0.8% to 1,667.6 billion ($12,538 million) due primarily to decreases in ordinary ticket revenues from ordinary railway lines and Shinkansen lines offset in part by an increase in revenues from Shinkansen commuter passes. Passenger kilometers recorded for Shinkansen network increased 0.4%. Shinkansen revenues decreased 1.0% to billion ($3,447 million) despite the increase in passenger kilometers, due primarily to an increased proportion of passenger kilometers attributable to discount travel packages. Revenues from Shinkansen commuter passes increased 5.1% to 21.3 billion ($161 million), and ordinary Shinkansen ticket revenues decreased 1.3% to billion ($3,286 million). In fiscal 2002, passenger kilometers for the Tokyo metropolitan area network decreased 0.3%. Revenues from the Tokyo metropolitan area network remained generally unchanged, decreasing 0.3% to billion ($6,327 million). Revenues from commuter passes decreased 0.7% to billion ($2,602 million). Ordinary ticket revenues remained generally unchanged at billion ($3,725 million). Passenger kilometers for intercity and regional networks decreased 0.7 %. Revenues from intercity and regional networks decreased 1.5% to billion ($2,764 million). Commuter pass revenues decreased 0.2% to billion ($901 million). Revenues from ordinary tickets decreased 2.0% to billion ($1,863 million). 47
50 Operating Results and Financial Position Summary For the Year: Operating Revenues... Operating Income... Net Income... Depreciation... Net Income and Depreciation... Net Income per Share of Common Stock (yen)... Net Income and Depreciation per Share of Common Stock (yen)... At Year-End: Total Assets... Long-Term Debt... Long-Term Liabilities Incurred for Purchase of Railway Facilities *... Total Long-Term Debt **... Total Shareholders Equity... Millions of Yen (except for per share data) ,514, ,699 66, , ,946 16,559 87,487 7,381,794 2,285,063 2,713,737 4,998, ,424 2,483, ,472 21, , ,616 5,482 85,404 7,287,033 2,320,246 2,610,966 4,931, ,880 2,502, ,957 66, , ,546 16,741 99,137 7,308,391 2,319,664 2,499,023 4,818, ,401 2,546, ,751 69, , ,825 17,294 99,706 7,247,089 2,307,483 2,392,241 4,699, ,568 2,543, ,340 47, , ,546 11,888 92,387 7,022,271 2,060,838 2,318,997 4,379, ,746 Notes: 1. There were 80 consolidated subsidiaries as of March 31, 1998, 81 in 1999, 96 in 2000, 96 in 2001, and 101 in Net income decreased significantly in fiscal 1999, mainly because cash charges for additional obligation related to transfer to Welfare Pension was accounted for in other expenses. This additional obligation of 70,475 million, including the interest portion, was paid in accordance with the enactment of the Law for Disposal of Debts and Liabilities of the Japanese National Railway Settlement Corporation. (see page 39) 3. Tax effect accounting was adopted beginning with fiscal Accounting Standards for Retirement Benefits were adopted beginning with fiscal Capital expenditures funded by JR East were 268,425 million in fiscal 1998, 258,080 million in fiscal 1999, 288,106 million in fiscal 2000, 296,957 million in fiscal 2001 and 301,781 million ($2,269 million) in fiscal * Long-term liabilities incurred for purchase of the Tohoku and Joetsu Shinkansen facilities, the Akita hybrid Shinkansen facilities and the Tokyo Monorail facilities ** The weighted average interest rate on total long-term debt was 4.79% at the end of fiscal 1998, 4.55% at the end of fiscal 1999, 4.40% at the end of fiscal 2000, 4.18% at the end of fiscal 2001 and 4.09% at the end of fiscal Station Space Utilization Operating income from station space utilization decreased 1.1% to 26.8 billion ($202 million). Station space utilization revenues from outside customers increased 5.6% due primarily to additional revenues arising from the effective transfer to JR East of the operation of 148 retail outlets and restaurants in the Omiya area, which were previously operated by a third-party lessee, and additional revenues from outlets and restaurants opened through the implementation of the Cosmos and Sunflower Plans. However, operating expenses increased 5.9% due to increased cost of sales in retail outlets related to improvements in the quality of meals sold, the less efficient cost structure of the retail outlets and restaurants in the Omiya area and start-up costs related to certain new restaurants. 48
51 Net Income (Billions of Yen) Shopping Centers & Office Buildings Operating income from shopping centers & office buildings increased 11.2% to 38.5 billion ($289 million). The increase was due mainly to increases in revenues from the variable portions of retail tenant leases. These increases were offset by a reduction in operating revenues arising from a change in the contract terms of certain station building tenant leases as a result of which JR East ceased to record the gross revenues of the tenant as lease revenue. This reduction had no negative effect on operating income because of corresponding reductions in operating expenses. As a result primarily of the foregoing factors, operating expenses in this segment decreased 4.1 billion, while operating revenues from outside customers decreased only 0.5 billion Other Services Operating income from other services for fiscal 2002 decreased 11.1% to 16.1 billion ($121 million). The decrease was due mainly to small declines in operating income from JR East s housing development and sales, and advertising and publicity operations offset in part by an increase in credit card operations. Operating income from hotel operations was substantially unchanged. Other Income (Expenses) Total interest expenses decreased 8.6% to billion ($1,411 million). The weighted average interest rate on total long-term debt was 4.09% at the end of fiscal 2002, compared with 4.18% at the end of fiscal Interest expense on short-and long-term debt, excluding long-term liabilities incurred for purchase of railway facilities, decreased 14.4% to 61.3 billion ($461 million) as a result of the ongoing reduction in long-term debt and the refinancing of debt at lower rates, reflecting continued low interest rates in Japan. Interest expense incurred for purchase of railway facilities decreased 5.4% to billion ($950 million) due to the inherent increase in the proportion of principal within each installment amount, since the payment in respect of the purchase price is made in equal semiannual installments, as well as a further decrease in the proportion of interest within such installments resulting from declining variable interest rates applicable to a substantial portion of long-term liabilities incurred for purchase of railway facilities (see page 64). Devaluation losses on investment in securities of 89.2 billion ($671 million) were incurred as a result of decreases in market value of a number of financial institution stocks owned by JR East. In addition, JR East incurred 33.4 billion ($251 million) in loss on sales of fixed assets related primarily to the sale of real estate used for employee housing. These increases in other expenses were offset 49
52 in part by a gain on sales of investment in securities of billion ($784 million) related to the sale of Japan Telecom shares. Other, net was income of 1.6 billion ($15 million) compared with income of 5.9 billion in fiscal The decrease was due mainly to an increase in devaluation losses on real estate for sale to 9.0 billion ($68 million). Income Before Income Taxes and Net Income Due to these factors, income before income taxes decreased 6.3% to billion ($876 million). Net income decreased 31.3% to 47.6 billion ($358 million). Cash Flows Net cash provided by operating activities decreased by 0.4 billion to billion ($3,421 million), affected by a decline of income before income taxes, despite a decrease of payments of interest. Net cash used in investing activities decreased by billion to billion ($794 million), helped by part sale of the Japan Telecom shares, despite capital expenditures for measures to ensure safe and stable transportation, improvement in transportation capacity and development of shopping centers and hotels. Note that the payments for purchases of fixed assets includes purchases made using proceeds from construction grants (see Capital Expenditures below) and the net change in payables involving the purchase of fixed assets. Net cash used in financing activities increased by billion to billion ($3,260 million) due to a reduction of billion in total long-term debt and dividend payments. As a result, the balance of cash and cash equivalents decreased by 84.2 billion. After inclusion of an increase of 0.4 billion ($3 million) due to the addition of newly consolidated subsidiaries, cash and cash equivalents at the end of fiscal 2002 amounted to billion ($1,504 million). The balance of the total long-term debt at the end of fiscal 2002 amounted to 4,379.8 billion ($32,931 million). Capital Expenditures JR East carefully evaluate the benefits of each proposed capital expenditure to concentrate resources on strategic areas and maximize the benefits of the capital budget. Payments for purchases of fixed assets totaled billion ($2,574 million) in fiscal This figure includes expenditures partially funded by third parties, mainly governments and their agencies, which will benefit from the resulting facilities. One example is elevated railway lines built to eliminate grade 50
53 Net Income and Depreciation (Billions of Yen) crossings. Capital expenditures funded by JR East were billion ($2,269 million). Depreciation was billion ($2,421 million). Expenditures for transportation were billion ($1,625 million), consisting primarily of investments to ensure safety, to enhance customer services and to upgrade transportation services, such as introduction of the Automatic Train Stop-Pattern (ATS-P) devices, improvements at stations and introducing new rolling stock. Expenditures for station space utilization were 11.9 billion ($89 million), consisting of developments of new stores at or near stations, improvements of existing stores and other items. Expenditures for shopping centers & office buildings were 24.2 billion ($182 million), consisting of construction and renewal of shopping centers and other items. Expenditures for other services were 49.6 billion ($373 million), consisting of construction of new hotels, developments and improvements of information systems and other items Depreciation Net Income Bond Issues and Ratings New issues of bonds and borrowings of long-term loans are required annually to refinance a large amount of maturing total long-term debt. In March 2002, JR East conducted a 40.0 billion ($301 million) bond issue with a 2012 maturity and a 1.71% coupon, and another issue of 20.0 billion ($150 million) with a 2022 maturity and a 2.36% coupon. These two were issued in Japan and were rated AAA by the Rating Investment Information Center, Inc., a Japanese rating agency. As of June 2002, credit monitoring is carried out. The terms of JR East s bond issues appropriately reflect the JR East s credit ratings, degree of recognition among investors and many other factors. Accordingly, both issues were well received by the investment community. Bond issues in Japan and overseas will continue to be a vital source of funds for JR East. JR East s long-term ratings from Standard & Poor s and Moody s are AA- and Aa2, respectively, as of June
54 > CONSOLIDATED BALANCE SHEETS EAST JAPAN RAILWAY COMPANY AND SUBSIDIARIES March 31, 2001 and 2002 Assets Current Assets: Cash and cash equivalents (Note 3) ,817 Millions of Yen Millions of U.S. Dollars (Note 2) ,022 $ 1,504 Receivables: Accounts receivable trade... Unconsolidated subsidiaries and affiliated companies... Other... Allowance for doubtful accounts (Note 2) ,492 8,477 13,514 (954) 159, ,353 8,344 20,418 (1,220) 175,895 1, (9) 1,323 Inventories (Notes 2 and 4)... 25,371 28, Real estate for sale (Notes 2 and 5)... 32,381 18, Deferred income taxes (Note 12)... 28,753 38, Other current assets... Total current assets... 31, ,779 31, , ,709 Investments: Unconsolidated subsidiaries and affiliated companies (Notes 2 and 6)... Other (Notes 2 and 7) , , ,164 40, , , ,249 Property, Plant and Equipment (Note 2): Buildings... Fixtures... Machinery, rolling stock and vehicles... Land... Construction in progress... Other... Less accumulated depreciation... Net property, plant and equipment... 1,734,697 4,725,670 2,107,491 2,257, , ,861 11,053,801 4,869,958 6,183,843 1,785,366 4,820,087 2,129,183 2,203, , ,382 11,211,213 5,070,961 6,140,252 13,424 36,241 16,009 16,566 1, ,295 38,128 46,167 Other Assets: Long-term deferred income taxes (Note 12)... Consolidation difference (Note 2)... Other... See accompanying notes. 64, , ,303 7,247,089 83,507 5, , ,520 7,022, ,007 1,674 $ 52,799 52
55 Liabilities and Shareholders Equity Current Liabilities: Short-term bank loans (Note 9)... Current portion of long-term debt (Note 9)... Current portion of long-term liabilities incurred for purchase of railway facilities (Note 10)... Prepaid railway fares received , , , ,078 Millions of Yen Millions of U.S. Dollars (Note 2) , , , ,231 $ 76 2, Payables: Accounts payable trade... Unconsolidated subsidiaries and affiliated companies... Other... Accrued expenses... Accrued consumption tax (Note 11)... Accrued income taxes (Note 12)... Other current liabilities... Total current liabilities... 62,666 28, , , ,317 14,741 56,126 43,907 1,151,446 67,755 40, , , ,434 20,859 64,069 44,877 1,297, ,782 3, ,752 Long-Term Debt (Note 9)... 2,069,411 1,730,091 13,008 Long-Term Liabilities Incurred for Purchase of Railway Facilities (Note 10)... 2,282,183 2,187,322 16,446 Accrued Severance and Retirement Benefits (Notes 2 and 13) , ,745 4,021 Deposits Received for Guarantees , ,909 1,729 Long-Term Deferred Tax Liabilities (Note 12)... 2,681 8, Other Long-Term Liabilities... 58,891 69, Consolidation Difference (Note 2) Minority Interests... 29,023 34, Contingent Liabilities (Note 14) Shareholders Equity (Notes 15 and 19): Common stock: Authorized 16,000,000 shares; Issued and outstanding 4,000,000 shares... Additional paid-in capital... Retained earnings... Net unrealized holding gains on securities... Total shareholders equity ,000 96, , ,568 7,247, ,000 96, ,376 26, ,746 7,022,271 1, , ,998 $52,799 53
56 > CONSOLIDATED STATEMENTS OF INCOME EAST JAPAN RAILWAY COMPANY AND SUBSIDIARIES Years ended March 31, 2000, 2001 and Operating Revenues (Note 16)... 2,502,909 Millions of Yen ,546,041 Millions of U.S. Dollars (Note 2) ,543,378 $19,123 Operating Expenses (Note 16): Transportation, other services and cost of sales... Selling, general and administrative expenses... Operating Income (Note 16)... 1,718, ,078 2,160, ,957 1,722, ,546 2,222, ,751 1,712, ,714 2,227, ,340 12,875 3,870 16,745 2,378 Other Income (Expenses): Interest expense on short- and long-term debt... Interest expense incurred for purchase of railway facilities... Devaluation losses on investment in securities... Loss on sales of fixed assets... Interest and dividend income... Equity in net income of affiliated companies... Gain on sales of investment in securities... Other, net... Income Before Income Taxes... (79,806) (140,615) (631) (2,514) 1,680 2,922 1,227 (2,601) (220,338) 121,619 (71,585) (133,570) (3,861) (2,693) 2,596 2,598 1,066 5,933 (199,516) 124,235 (61,272) (126,329) (89,218) (33,365) 1,518 2, ,330 1,625 (199,895) 116,445 (461) (950) (671) (251) (1,502) 876 Income Taxes (Note 12): Current... Deferred... 79,103 (25,313) 95,446 (42,570) 108,403 (41,989) 815 (316) Minority Interests in Net Income of Consolidated Subsidiaries... (866) (2,185) (2,480) (19) Net Income... 66,963 69,174 47,551 $ 358 Yen U.S. Dollars (Note 2) Net Income per Share of Common Stock (Note 2)... 16,741 17,294 11,888 $ 89 See accompanying notes. 54
57 > CONSOLIDATED STATEMENTS OF SHAREHOLDERS EQUITY EAST JAPAN RAILWAY COMPANY AND SUBSIDIARIES Years ended March 31, 2000, 2001 and 2002 Thousands Millions of Yen Number of Shares of Common Stock Common Stock Additional Paid-in Capital Retained Earnings Net Unrealized Holding Gains on Securities Balance at March 31, Cumulative effect of adopting tax effect accounting... Increase due to addition of consolidated subsidiaries... Increase due to capital increase of an equity method affiliated company... Net income... Cash dividends ( 5,000 per share)... Bonuses to directors and corporate auditors... Decrease due to addition of equity method affiliated companies... Balance at March 31, Effect of changing from an equity method affiliated company to a subsidiary... Increase due to capital increase of an equity method affiliated company... Net income... Cash dividends ( 5,000 per share)... Bonuses to directors and corporate auditors... Effect of changing from an equity method affiliated company to a subsidiary... Balance at March 31, Increase due to addition of consolidated subsidiaries, and other... Increase due to addition of equity method affiliated companies... Net income... Cash dividends ( 5,000 per share)... Bonuses to directors and corporate auditors... Decrease due to removal of equity method affiliated companies... Adoption of new accounting standard for financial instruments (Note 2)... Balance at March 31, ,000 4,000 4,000 4, , , , ,000 96,600 96,600 96,600 96, ,280 21,646 9,180 12,580 66,963 (20,000) (428) (420) 559, ,529 69,174 (20,000) (536) (941) 626, ,103 47,551 (20,000) (176) (51,080) 607,376 26,770 26,770 Millions of U.S. Dollars (Note 2) Common Stock Additional Paid-in Capital Retained Earnings Net Unrealized Holding Gains on Securities Balance at March 31, Increase due to addition of consolidated subsidiaries, and other... Increase due to addition of equity method affiliated companies... Net income... Cash dividends ($37.59 per share)... Bonuses to directors and corporate auditors... Decrease due to removal of equity method affiliated companies... Adoption of new accounting standard for financial instruments (Note 2)... Balance at March 31, $1,504 $1,504 $726 $726 $4, (150) (2) (384) $4,567 $ 201 $201 See accompanying notes. 55
58 > CONSOLIDATED STATEMENTS OF CASH FLOWS EAST JAPAN RAILWAY COMPANY AND SUBSIDIARIES Years ended March 31, 2000, 2001 and 2002 Millions of Yen Millions of U.S. Dollars (Note 2) Cash Flows from Operating Activities: Income before income taxes... Depreciation (Note 16)... Amortization of long-term prepaid expense... Increase (Decrease) in accrued severance and retirement benefits... Interest and dividend income... Interest expense... Construction grants received... Devaluation losses on investments in securities... Gain on sales of investments in securities... Loss from disposition and provision for cost reduction of fixed assets... Decrease (Increase) in major receivables... Increase (Decrease) in major payables... Other... Sub-total... Proceeds from interest and dividends... Payments of interest... Payments of income taxes... Net cash provided by operating activities , ,583 21,391 (3,013) (1,680) 220,421 (56,045) 631 (1,227) 68,929 5,209 (11,253) 17, ,389 2,091 (222,810) (16,955) 474, , ,651 19,566 43,193 (2,596) 205,155 (119,073) 3,861 (1,066) 142,424 (18,456) 18,980 17, ,015 3,288 (207,038) (103,795) 455, , ,995 19,941 48,630 (1,518) 187,601 (51,914) 89,218 (104,330) 78,421 (11,990) 10,427 40, ,793 1,957 (189,574) (101,131) 455,045 $ 876 2, (11) 1,411 (390) 671 (784) 590 (90) , (1,425) (761) 3,421 Cash Flows from Investing Activities: Payments for purchases of fixed assets... Proceeds from sales of fixed assets... Proceeds from construction grants... Payments for purchases of investments in securities... Proceeds from sales of investments in securities... Cash increased (decreased) due to purchases of shares of companies newly consolidated, net of cash acquired... Other... Net cash used in investing activities... (353,728) 19,524 67,452 (31,553) 6,599 (3,509) 2,777 (292,438) (343,510) 19,271 68,196 (23,041) 4,513 1,130 7,122 (266,319) (342,352) 25,431 61,074 (6,677) 156,664 (12,085) 12,300 (105,645) (2,574) (50) 1,178 (91) 93 (794) Cash Flows from Financing Activities: Payment for redemption of commercial paper... Proceeds from long-term loans... Payments of long-term loans... Proceeds from issuance of bonds... Payment for redemption of bonds... Payments of liabilities incurred for purchase of railway facilities... Cash dividends paid... Other... Net cash used in financing activities... (20,000) 144,922 (203,800) 60,000 (2,022) (111,943) (20,000) (15,290) (168,133) 147,945 (203,327) 90,000 (47,010) (106,781) (20,000) (21,936) (161,109) 87,438 (296,888) 60,000 (99,970) (109,970) (20,000) (54,199) (433,589) 657 (2,232) 451 (752) (827) (150) (407) (3,260) Net Increase (Decrease) in Cash and Cash Equivalents... Cash and Cash Equivalents at Beginning of Year... Increase due to Addition of Consolidated Subsidiaries, and Other... Cash and Cash Equivalents at End of Year... 14, ,860 3, ,775 28, , ,817 (84,189) 283, ,022 (633) 2,134 3 $1,504 See accompanying notes. 56
59 > NOTES TO CONSOLIDATED FINANCIAL STATEMENTS EAST JAPAN RAILWAY COMPANY AND SUBSIDIARIES March 31, 2000, 2001 and Incorporation of East Japan Railway Company In accordance with the provisions of the Law for Japanese National Railways Restructuring (the Law), the Japanese National Railways (JNR) was privatized into six passenger railway companies, one freight railway company and several other organizations (JR Group Companies), on April 1, East Japan Railway Company (the Company) is one of the six passenger railway companies and serves eastern Honshu (mainland Japan) in Japan. The Company operates 70 railway lines, 1,712 stations and 7,538 operating kilometers. In the wake of the split-up of JNR, assets owned by and liabilities incurred by JNR were transferred to JR Group Companies, Shinkansen Holding Corporation and JNR Settlement Corporation (JNRSC). Most JNR assets located in eastern Honshu, except for the land and certain railway fixtures used by the Tohoku and Joetsu Shinkansen lines, were transferred to the Company. Current liabilities and accrued severance and retirement benefits, incurred in connection with railway and other operations in the allotted area, and certain long-term debt were assumed by the Company. The transfer values were determined by the Evaluation Council, a governmental task force, in accordance with the provisions of the Law. In general, railway assets such as railway property and equipment were valued at net book value of JNR. Nonrailway assets such as investments and other operating property and equipment were valued at prices determined by the Evaluation Council. The land and railway fixtures of the Tohoku and Joetsu Shinkansen lines were owned by Shinkansen Holding Corporation until September 30, 1991, and the Company leased such land and railway fixtures at a rent determined by Shinkansen Holding Corporation in accordance with related laws and regulations. On October 1, 1991, the Company purchased such Shinkansen facilities for a total purchase price of 3,106,970 million from Shinkansen Holding Corporation (see Note 10). Subsequent to the purchase, Shinkansen Holding Corporation was dissolved. Railway Development Fund succeeded to all rights and obligations of Shinkansen Holding Corporation. In October 1997, Railway Development Fund and Maritime Credit Corporation merged to form Corporation for Advanced Transport & Technology. Prior to December 1, 2001, in accordance with the provisions of the Law for Passenger Railway Companies and Japan Freight Railway Company (the JR Law), the Company was required to obtain approval from the Minister of Land, Infrastructure and Transport as to significant management decisions, including new issues of stock or bonds, borrowing of longterm loans, election of representative directors and corporate auditors, sale of major properties, amendment of the Articles of Incorporation and distribution of retained earnings. The amendment to the JR Law took effect on December 1, 2001 (2001 Law No. 61) and the Company is no longer subject generally to the JR Law, as amended (See Note 9). 2. Significant Accounting Policies Basis of presentation of financial statements The Company and its consolidated subsidiaries maintain their books of account in accordance with the Japanese Commercial Code and accounting principles generally accepted in Japan ( Japanese GAAP ). Certain accounting principles and practices generally accepted in Japan are different from International Accounting Standards and standards in other countries in certain respects as to application and disclosure requirements. Accordingly, the accompanying consolidated financial statements are intended for use by those who are informed about Japanese accounting principles and practices. The Company s and certain consolidated subsidiaries books are also subject to the Law for Railway Business Enterprise and related regulations for a regulated company. The accompanying consolidated financial statements are translated into English from the consolidated financial statements prepared for Securities and Exchange Law of Japan purposes. Certain modifications and reclassifications, including the presentation of the Consolidated Statements of Shareholders Equity, have been made for the convenience of readers outside Japan. The consolidated financial statements are stated in Japanese yen. The translations of the Japanese yen amounts into U.S. dollars are included solely for the convenience of readers, using the prevailing exchange rate at March 31, 2002, which was 133 to U.S.$1.00. The convenience translations should not be construed as representations that the Japanese yen amounts have been, could have been, or could in the future be, converted into U.S. dollars at this or any other rate of exchange. 57
60 Consolidation The consolidated financial statements of the Company include the accounts of all significant subsidiaries (together, the Companies ). The effective-control standard is applied according to Regulations Concerning Terminology, Forms and Method of Presentation of Consolidated Financial Statements in Japan (Regulations for Consolidated Financial Statements). For the year ended March 31, 2002, 102 subsidiaries were consolidated in the consolidated statement of income. Six subsidiaries were newly consolidated in the year ended March 31, 2002 because of investment and split-off. Liquidation of a subsidiary was completed in the year ended March 31, Furthermore, one subsidiary was deconsolidated in the year ended March 31, 2002 because of its merger with another subsidiary. As a result, the number of subsidiaries included in the consolidated balance sheet as of March 31, 2002 was 101. All significant intercompany transactions and accounts have been eliminated. Cost in excess of net assets of consolidated subsidiaries purchased is analyzed and allocated to appropriate accounts so long as the reason is clear and the remaining unknown portion is accounted for as consolidation difference. Such consolidation differences are amortized over 5 years on a straight-line basis. In the elimination of investments in subsidiaries, the assets and liabilities of the subsidiaries, including the portion attributable to minority shareholders, are recorded based on the fair value at the time the Company acquired control of the respective subsidiaries. Equity method The effective-influence standard is applied according to Regulations for Consolidated Financial Statements. For the year ended March 31, 2002, four affiliated companies were accounted for by the equity method. One affiliated company was newly accounted for by the equity method in the year ended March 31, 2002, and a second affiliated company was newly included in the consolidated balance sheet as of March 31, 2002, due to their increased significance in the aggregate. Two other affiliated companies were accounted for by the equity method until the interim period ended September 30, 2001, but ceased to be accounted for by the equity method because of sales of shares by the Companies. As a result, the number of equity method affiliated companies included in the consolidated balance sheet as of March 31, 2002 was two. Investments in unconsolidated subsidiaries and other affiliated companies are stated mainly at weighted average cost since their equity earnings in the aggregate are not material in relation to the consolidated net income and retained earnings. Allowance for doubtful accounts According to the Japanese Accounting Standards for Financial Instruments, the Companies provide the allowance based on the past loan loss experience for a certain reference period in general. Furthermore, for receivables from debtors with financial difficulty which could affect their ability to perform in accordance with their obligations, the allowance is provided for estimated unrecoverable amounts on an individual basis. Inventories Inventories are stated at cost as follows: Merchandise inventories: the retail cost method or first-in, first-out method; Rails, materials and supplies: the moving average cost method; and Other: the last purchased cost method Real estate for sale Real estate for sale is stated at the identified cost, which is reduced for significant decline in value. Devaluation losses on real estate for sale included in the other, net item of other expenses on the statements of income for the years ended March 31, 2000, 2001 and 2002 were 7,684 million, 6,850 million and 9,043 million ($68 million), respectively. 58
61 Securities According to the Japanese Accounting Standards for Financial Instruments which became effective on April 1, 2000, securities are classified and stated as follows: (1) Trading securities are stated at fair market value. The Companies had no trading securities through the years ended March 31, 2001 and (2) Held-to-maturity debt securities are stated at amortized cost. (3) Equity securities issued by subsidiaries and affiliated companies which are not consolidated nor accounted for using the equity method are mainly stated at moving average cost. (4) Available-for-sale securities were mainly stated at moving average cost in the year ended March 31, According to the Japanese Accounting Standards for Financial Instruments, beginning with the year ended March 31, 2002, available-for-sale securities are stated as follows: ➀ Available-for-sale securities with market value Available-for-sale securities for which market quotations are available are stated at fair market value as of March 31, Net unrealized gains or losses on these securities are reported as a separate item in shareholders equity at an amount net of applicable income taxes and minority interests. The cost of sales of such securities is determined mainly by the moving average method. As a result, the balances of securities increased by 48,711 million ($366 million), deferred income taxes decreased by 19,819 million ($149 million), minority interest increased by 2,122 million ($16 million) and unrealized holding gains on securities of 26,770 million ($201 million) were recorded in shareholders equity. ➁ Available-for-sale securities without market value Available-for-sale securities for which market quotations are not available are mainly stated at moving average cost. If there are significant declines in the market values of held-to-maturity debt securities, equity securities issued by subsidiaries and affiliated companies which are not consolidated nor accounted for using the equity method or available-for-sale securities, the said securities are stated at market values in the balance sheet, and the difference between the market value and the original book value is recognized as a loss in the period. Such losses in the year ended March 31, 2002 amounted to 89,218 million ($671 million). Property, plant and equipment Property, plant and equipment are stated at cost or the transfer value referred to in Note 1 above. To comply with the regulations, contributions received in connection with construction of certain railway improvements are deducted from the cost of acquired assets. Depreciation is determined primarily by the declining balance method based on the estimated useful lives of the assets as prescribed by the Japanese Tax Law. Regarding the replacement method for certain fixtures, the initial acquisition costs are depreciated to 50% of the costs under the condition that subsequent replacement costs are charged to income. Certain property, plant and equipment of the consolidated subsidiaries were depreciated using the straight-line method. Buildings (excluding related fixtures) acquired from April 1, 1998 onward were depreciated using the straight-line method according to the Japanese Tax Law. The range of useful lives is mainly as follows: Buildings Fixtures Rolling stock and vehicles Machinery to 50 years 3 to 60 years 3 to 20 years 3 to 20 years Accounting for the payment for transfer to Welfare Pension At the merger of mutual aid associations of three public corporations including Japan Railways Group Mutual Aid Association (the Association) to the Welfare Pension (national pension) in accordance with the enforcement of revision of the Welfare Pension Law and the related regulations in 1996 (1996 Law No. 82), fund assets of the respective mutual aid associations were transferred to the Welfare Pension. The shortage of the assets to be transferred to the Welfare 59
62 Pension from the Association was shared by JNRSC and JR Group Companies on the basis that JNRSC would be liable for the period during which each member of the Association was employed by JNR, and the JR Group Companies for the period during which the member of the Association was in their employment. The portion shared by the Company amounting to 77,566 million was paid in a lump sum. This was accounted for as a long-term prepaid expense included in the other item of other assets on the balance sheet and was charged to income from the year ended March 31, 1998 to the year ended March 31, 2002 on a straight-line basis. As a result, there was no balance at March 31, Accounting for retirement benefits Almost all employees of the Companies are generally entitled to receive lump sum severance and retirement benefits (some subsidiaries have adopted a pension plan of their own). The amounts of the severance and retirement benefits are determined by the length of service and basic salary at the time of severance or retirement of the employees. Previously, most of the Companies accrued a liability for such obligation equal to 40% of the amount required if all eligible employees had voluntarily terminated their employment at the balance sheet date. The Japanese Accounting Standards for Retirement Benefits became effective beginning with the year ended March 31, The Companies accrue liabilities for post-employment benefits at the balance sheet date in an amount calculated based on the actuarial present value of all post-employment benefits attributed to employee services rendered prior to the fiscal-year end date and the fair value of plan assets at that date. The excess of the projected benefit obligations over the total of the fair value of plan assets as of April 1, 2000 and the liabilities for severance and retirement benefits recorded as of April 1, 2000 (the transition obligation ) was 500,401 million. The unrecognized transition obligation amounting to 497,914 million is being charged to income over 10 years from the year ended March 31, 2001 on a straight-line basis. And the rest of the transition obligation, amounting to 2,487 million, was recognized as an expense and was included in other, net item of other expenses on the statement of income for the year ended March 31, The balance of unrecognized net transition obligation as of March 31, 2002 is 398,318 million ($2,995 million). The unrecognized prior service costs are amortized by the straight-line method and charged to income over the number of years (10 years) which does not exceed the average remaining service years of employees at the time when the prior service costs incurred. Actuarial gains and losses are recognized in expenses using the straight-line basis over constant years (mainly 10 years) within the average of the estimated remaining service lives commencing with the following year. As a result of these changes, expenses for the year ended March 31, 2001 increased by 50,812 million compared with what would have been expensed under the previous accounting methods, reducing operating income by 48,325 million and income before income taxes by 50,812 million. Accounting for certain lease transactions Finance leases which do not transfer titles to lessees are accounted for in the same manner as operating leases under Japanese GAAP. Accounting for research and development costs According to the Accounting Standards for Research and Development Costs, etc., in Japan, research and development costs are recognized as they are incurred. Research and development costs included in operating expenses for the years ended March 31, 2000, 2001 and 2002 were 13,003 million, 13,507 million and 13,548 million ($102 million), respectively. Income taxes Income taxes comprise corporation, enterprise and inhabitants taxes. Deferred income taxes are recognized for temporary differences between the financial statement basis and the tax basis of assets and liabilities. 60
63 Net income per share The computation of net income per share of common stock shown in the consolidated statements of income is based on the number of shares of common stock outstanding during each year. The diluted net income per share is not shown, since there are no outstanding securities with dilutive effect on net income per share such as convertible bonds. Derivative transactions All derivative transactions of the Companies are used for hedging purposes and are accounted for in the following manner: (1) Regarding forward exchange contracts and foreign currency swap contracts, the hedged foreign currency receivable and payable are recorded using the Japanese yen amount of the contracted forward rate or swap rate, and no gains or losses on the forward exchange contracts or foreign currency swap contracts are recorded. (2) Regarding interest rate swap contracts, the net amount to be paid or received under the interest rate swap contract is added to or deducted from the interest on the assets or liabilities for which the swap contract was executed. Change in presentation Within other income (expenses) in consolidated statements of income, devaluation losses on investment in securities, loss on sales of fixed assets and gain on sales of investment in securities are stated beginning with the year ended March 31, Previously, they were included in other, net. The information for the years ended March 31, 2000 and 2001 is restated on the same basis. 3. Cash and Cash Equivalents Cash and cash equivalents include all cash balances and highly liquid investments with maturities not exceeding three months at the time of purchase. 4. Inventories Inventories consist of rails, materials, supplies, merchandise and others. 5. Real Estate for Sale Real estate for sale represents the cost, as adjusted for significant decline in value, of land acquired and related land improvements in connection with residential home site developments in eastern Honshu. 6. Investments in and Advances to Unconsolidated Subsidiaries and Affiliated Companies Investments in and advances to unconsolidated subsidiaries and affiliated companies at March 31, 2001 and 2002, consisted of the following: Millions of Millions of Yen U.S. Dollars Unconsolidated subsidiaries: Investments... Advances... Affiliated companies: Investments (including equity in earnings and capital increase of affiliated companies)... Advances... 6,072 1,341 7, , , ,217 6,078 2,735 8,813 29,707 1,483 31,190 40,003 $ $ $
64 7. Securities For held-to-maturity debt securities with market value, amount on balance sheets and market value at March 31, 2001 and 2002 were as follows: Millions of Yen Millions of U.S. Dollars Amount on Amount on Amount on Balance Market Balance Market Balance Market Sheets Value Difference Sheets Value Difference Sheets Value Difference Of which market value exceeds the amount on balance sheet: Government, Municipal bonds, etc $ 2 $ 2 $ 0 Of which market value does not exceed the amount on balance sheet: Government, Municipal bonds, etc (0) Total $ 2 $ 2 $ 0 According to the Japanese Accounting Standards for Financial Instruments, available-forsale securities with market value are stated at fair market value beginning with the year ended March 31, The unrealized gain or loss is reported, net of applicable income taxes and minority interests, as a separate component of shareholders' equity. For available-for-sale securities with market value, the amount stated on the balance sheet and market value as of March 31, 2001 were 153,701 million and 104,100 million, respectively. For available-for-sale securities with market value, acquisition cost and amount on balance sheets at March 31, 2002 were as follows: Millions of Yen Millions of U.S. Dollars March 31, 2002 Acquisition Amount on Acquisition Amount on Cost Balance Sheets Difference Cost Balance Sheets Difference Of which amount on balance sheet exceeds the acquisition cost: Equity shares... 10,185 59,927 49,742 $ 77 $451 $374 Debt securities... 2,262 2, Of which amount on balance sheet does not exceed the acquisition cost: Equity shares... 57,970 55,526 (2,444) (19) Debt securities (11) 1 1 (0) Other Total... 70, ,957 47,354 $531 $887 $356 Available-for-sale securities sold during the year ended March 31, 2002 amounted to 31,230 million ($235 million). Within other income (expenses) on the statement of income for the year ended March 31, 2002, gains on sales of available-for-sale securities amounted to 28,161 million ($212 million) and were included in the gain on sales of investment in securities, and losses on sales of available-for-sale securities amounted to 128 million ($1 million) and were included in other, net. For the year ended March 31, 2001, gain and loss on sales of available-for-sale securities were immaterial. 62
65 The major components of available-for-sale securities without market value at March 31, 2001 and 2002 were as follows: Millions of Millions of Yen U.S. Dollars Available-for-sale securities without market value: Unlisted equity securities... 4,973 6,573 $ 49 Beneficiary certificate of bond investment trust... 72, The Companies sold stock issued by Japan Telecom Co., Ltd., which in turn owned stock issued by J-Phone East Co., Ltd., in the year ended March 31, As a result, the remaining stocks issued by Japan Telecom Co., Ltd. and J-Phone East Co., Ltd. (currently known as J-Phone Co., Ltd.), which were formerly accounted for using the equity method, are classified as available-for-sale securities at March 31, The excess of market value over the acquisition cost of the shares in Japan Telecom Co., Ltd. held at March 31, 2002, which amounted to 48,117 million ($362 million), is included in other of investments on the balance sheet. Annual maturities of available-for-sale securities with maturities and held-to-maturity debt securities as of March 31, 2001 and 2002 were as follows: Millions of Yen Millions of U.S. Dollars Years 10 Years 5 Years 10 Years 5 Year 10 Years or Less or Less or Less or Less or Less or Less 1 Year But More But More 1 Year But More But More 1 Year But More But More or Less than 1 Year than 5 Years or Less than 1 Year than 5 Years or Less than 1 Year than 5 Years Debt securities , , $ 5 $ 14 $ 1 Other Total , , $ 5 $ 15 $ 1 8. Pledged Assets At March 31, 2001 and 2002, buildings and fixtures with net book value of 70,260 million and 54,907 million ($413 million) and other assets with net book value of 5,234 million and 3,112 million ($23 million), respectively, were pledged as collateral for long-term debt and other liabilities totaling 26,746 million and 14,844 million ($112 million), at the respective dates. 9. Short-Term Bank Loans and Long- Term Debt Short-term bank loans are represented by notes maturing generally within one year. The annual interest rates applicable to such loans outstanding at March 31, 2001 and 2002, principally ranged from 0.91% to 1.50% and 0.39% to 1.38%, respectively. Long-term debt at March 31, 2001 and 2002, is summarized as follows: Millions of Millions of Yen U.S. Dollars General Mortgage Bonds issued in 1995 to 2001 with interest rates ranging from 1.70% to 4.90% due 2004 to ,870 Unsecured Bonds issued in 2002 with interest rates ranging from 1.71% to 2.36% due 2012 to Secured Loans due 2002 to 2016 principally from banks and insurance companies with interest rates mainly ranging from 1.88% to 5.80%... 24,783 Unsecured Loans due 2002 to 2021 principally from banks and insurance companies with interest rates mainly ranging from 1.33% to 3.75%... 1,464, % Euro U.S. dollar bonds due ,960 2,307,483 Less current portion ,072 2,069, ,900 60,000 12,863 1,270,115 87,960 2,060, ,747 1,730,091 $ 4,736 Issue and maturity years above are expressed in calendar years (ending December 31 in the same year) , ,495 2,487 $13,008 63
66 Although the Company is no longer subject generally to the JR Law, as amended, all bonds issued by the Company prior to December 1, 2001, the effective date of the amendment to the JR Law, are and will continue to be general mortgage bonds as required under the JR Law which are entitled to a statutory preferential right over the claims of unsecured creditors of the Company. Any bonds issued on or after December 1, 2001 are unsecured bonds without general mortgage preferential rights. The 7.25% Euro U.S. dollar bonds in the amount of $800 million were issued in October These bonds have been hedged by a foreign currency swap contract with a bank. The annual maturities of long-term debt at March 31, 2002, were as follows: Millions of Millions of Year ending March 31, Yen U.S. Dollars and thereafter , , , , , ,972 $ 2,487 2, ,309 1,005 7, Long-Term Liabilities Incurred for Purchase of Railway Facilities In October 1991, the Company purchased the Tohoku and Joetsu Shinkansen facilities from Shinkansen Holding Corporation for a total purchase price of 3,106,970 million payable in equal semiannual installments consisting of principal and interest payments in three tranches: 2,101,898 million and 638,506 million in principal amounts payable through March 2017; and 366,566 million payable through September In March 1997, the liability of 27,946 million payable in equal semiannual installments through March 2022 to Japan Railway Construction Public Corporation was incurred with respect to the acquisition of the Akita hybrid Shinkansen facilities. In February 2002, the Company acquired a majority interest in Tokyo Monorail Co., Ltd. As a result, the accompanying consolidated balance sheet as of March 31, 2002 includes liabilities of Tokyo Monorail Co., Ltd. amounting to 36,726 million ($276 million) payable to Japan Railway Construction Public Corporation in equal semiannual installments through September The long-term liabilities incurred for purchase of railway facilities outstanding at March 31, 2001 and 2002, were as follows: Millions of Millions of Yen U.S. Dollars The long-term liability incurred for purchase of the Tohoku and Joetsu Shinkansen facilities: Payable semiannually including interest at a rate currently approximating 4.80% through Payable semiannually including interest at 6.35% through Payable semiannually including interest at 6.55% through The long-term liability incurred for purchase of the Akita hybrid Shinkansen facilities: Payable semiannually at an average rate currently approximating 0.08% through ,502, , ,950 2,368,735 23,506 1,413, , ,989 2,259,875 22,396 $10,627 3,666 2,699 16, The long-term liability incurred for purchase of the Tokyo Monorail facilities: Payable semiannually at an average rate currently approximating 4.54% through ,392,241 Less current portion: The Tohoku and Joetsu Shinkansen purchase liability ,950 The Akita hybrid Shinkansen purchase liability... 1,108 The Tokyo Monorail purchase liability ,058 2,282,183 36,726 2,318, ,130 1,084 1, ,675 2,187, , $16,446
67 Maturity years above are expressed in calendar years (ending December 31 in the same year). The annual payments of long-term liabilities incurred for purchase of railway facilities at March 31, 2002, were as follows: Millions of Millions of Year ending March 31, Yen U.S. Dollars and thereafter , , , , ,212 1,619,218 $ 990 1,014 1,086 1,110 1,062 12, Consumption Tax The Japanese consumption tax is an indirect tax levied at the rate of 5%. Accrued consumption tax represents the difference between consumption tax collected from customers and consumption tax paid on purchases. 12. Income Taxes The major components of deferred income taxes and deferred tax liabilities at March 31, 2001 and 2002, were as follows: Deferred income taxes: Accrued severance and retirement benefits... Reserves for bonuses... Excess depreciation and amortization of fixed assets... Accrued enterprise tax... Loss carry forwards for tax purposes... Other... Less valuation allowance... Less amounts offset against deferred tax liabilities... Net deferred income taxes... Deferred tax liabilities: Tax deferment for gain on transfers of certain fixed assets... Net unrealized holding gains on securities... Valuation for assets and liabilities of consolidated subsidiaries... Other... Less amounts offset against deferred income taxes... Net deferred tax liabilities... Millions of Millions of Yen U.S. Dollars ,119 15,885 5,513 5,034 4,486 15, ,701 (5,090) (26,536) 93,075 18,470 5,380 5,367 29,217 (26,536) 2, ,335 21,678 6,384 5,668 4,133 20, ,185 (4,648) (44,817) 121,720 22,028 20,843 5,395 4,998 53,264 (44,817) 8,447 $ ,287 (35) (337) $ 915 $ (337) $ 64 Income taxes consist of corporation, enterprise and inhabitants taxes. The aggregate standard effective rate of taxes on consolidated income before income taxes was approximately 41.8% for the years ended March 31, 2000, 2001 and After applying tax effect accounting, the actual effective income tax rate was approximately 44.2%, 42.6% and 57.0% for the years ended March 31, 2000, 2001 and 2002, respectively. For the year ended March 31, 2002, the actual effective income tax rate differed from the aggregate standard effective tax rate for the following reasons: 65
68 The aggregate standard effective rate % Adjustments: Non-deductible expenses for tax purposes Non-taxable incomes (0.9) Per capita inhabitant tax Equity on net income of affiliated companies (1.0) Adjustment of gain on sale of investment in equity method affiliated company Other, net The actual effective rate after applying tax effect accounting % 13. Accrued Severance and Retirement Benefits and Severance and Retirement Benefit Expenses As mentioned in Note 2 above, beginning with the year ended March 31, 2001, the Companies adopted the Accounting Standards for Retirement Benefits, under which the liabilities and expenses for severance and retirement benefits are determined based on the amounts obtained by actuarial calculations. The liabilities for severance and retirement benefits included in the liability section of the consolidated balance sheets as of March 31, 2001 and 2002 consisted of the following: Projected benefit obligation... Plan assets... Unfunded projected benefit obligation... Unrecognized transition obligation... Unrecognized actuarial differences... Unrecognized prior service costs... Book value (net)... Prepaid pension expense... Accrued severance and retirement benefits... Millions of Millions of Yen U.S. Dollars (937,319) 7,390 (929,929) 448,123 (1,052) (482,858) (390) (483,248) (953,538) 8,621 (944,917) 398,318 1,411 10,771 (534,417) (328) (534,745) $(7,170) 65 (7,105) 2, (4,018) (3) $(4,021) Severance and retirement benefit expenses included in the consolidated statements of income for the years ended March 31, 2001 and 2002 consisted of the following: Millions of Millions of Yen U.S. Dollars Service costs... Interest cost... Expected return on plan assets... Amortization of transition obligation... Amortization of actuarial differences... Amortization of prior service costs... Severance and retirement benefit expenses... 37,300 27,999 (119) 52, ,458 37,696 28,099 (141) 49,823 (66) 1, ,608 $ (1) 375 (0) 9 $ 877 The estimated amount of all retirement benefits to be paid at the future retirement date is allocated equally to each service year using the estimated number of total service years. The discount rates used by the Companies are mainly 3.0%. The rates of expected return on pension assets used by the Companies are mainly 3.0%. 14. Contingent Liabilities The Company is contingently liable for (1) the in-substance defeasance of general mortgage bonds issued by the Company, which were assigned to certain banks under debt assumption agreements, and (2) the original debt in connection with the sale of the 6.625% Euro U.S. dollar bonds for which the Company entered into a long-term cross currency swap agreement with a bank. The outstanding amounts contingently liable under such debt assumption agreements and cross currency swap agreement at March 31, 2002 were 99,970 million ($752 million) and $600 million, respectively. 66
69 15. Shareholders Equity Under the Commercial Code of Japan, certain amounts of retained earnings equal to at least 10% of cash dividends and bonuses to directors and corporate auditors must be set aside as a legal reserve until the total of legal reserve and additional paid-in capital equals 25% of common stock. The legal reserve or additional paid-in capital may be used to reduce a deficit by a resolution of the shareholders meeting, may be capitalized by a resolution of the Board of Directors of the Company or may be reduced until the total of the legal reserve and additional paid-in capital equals 25% of common stock by a resolution of the shareholders meeting. The legal reserve is included in retained earnings in the accompanying consolidated balance sheets. The maximum amount that the Company can distribute as dividends is calculated based on the nonconsolidated financial statements of the Company and in accordance with the Commercial Code of Japan. 16. Segment Information The Companies primary business activities include (1) Transportation, (2) Station space utilization, (3) Shopping centers & office buildings and (4) Other services. Change in business segmentation The Company previously classified businesses of the Companies into four business segments, i.e., Transportation, Merchandise sales, Real estate leasing and Other services, in order to disclose its actual operational diversification concretely and appropriately in accordance with the Japanese standard industrial classification. However, from the year ended March 31, 2002, the segmentation was changed to four new segments, i.e., Transportation, Station space utilization, Shopping centers & office buildings and Other services. This change was made in order to reflect more appropriately the changes in positioning and actual situation of the Companies businesses as a whole, following a review of the operational management units based on the medium-term business plan which aimed mainly at effective use of management resources of the Companies. A summary of operating revenues and costs and expenses is shown in the following tables. The segment information by the business segments for the year ended March 31, 2000 is shown based on the previous business segmentation. The information for the year ended March 31, 2001 is reclassified according to the new business segmentation, and the information for the year ended March 31, 2002 is shown based on the new business segmentation. Millions of Yen Elimination Merchandise Real Estate Other and/or Transportation Sales Leasing Services Corporate Consolidated 2000: Operating revenues Outside customers... 1,799, , , ,213 2,502,909 Inside group... 64,925 69,050 11, ,220 (303,902) 1,863, , , ,433 (303,902) 2,502,909 Costs and expenses... 1,569, , , ,867 (303,183) 2,160,952 Operating income ,778 5,783 32,549 9,566 (719) 341,957 Identifiable assets... 5,782, , , , ,528 7,308,391 Depreciation ,451 8,552 27,090 28, ,583 Capital investments ,955 19,542 25,435 26, ,744 The main activities of each business segment are as follows: Transportation : Passenger railway, bus services; Merchandise sales : Food and drink sales, wholesale and retail sales; Real estate leasing: Lease of real estate (mainly shopping centers); and Other services : Hotel operations, advertising and publicity, truck delivery services, information processing, cleaning services and others 67
70 Millions of Yen Shopping centers Elimination Station space & office Other and/or Transportation utilization buildings services corporate Consolidated 2001: Operating revenues Outside customers... 1,801, , , ,859 2,546,041 Inside group... 50,257 10,337 7, ,424 (319,367) 1,851, , , ,283 (319,367) 2,546,041 Costs and expenses... 1,606, , , ,191 (318,672) 2,222,290 Operating income ,631 27,104 34,619 18,092 (695) 323,751 Identifiable assets... 5,651, , , , ,473 7,247,089 Depreciation ,621 6,717 27,853 32, ,651 Capital investments ,794 9,054 25,929 46, , : Operating revenues Outside customers... 1,789, , , ,950 2,543,378 Inside group... 51,417 10,161 7, ,942 (348,229) 1,841, , , ,892 (348,229) 2,543,378 Costs and expenses... 1,605, , , ,808 (347,596) 2,227,038 Operating income ,585 26,810 38,494 16,084 (633) 316,340 Identifiable assets... 5,713, , , ,150 (131,773) 7,022,271 Depreciation ,116 7,043 25,193 33, ,995 Capital investments ,178 11,890 24,176 49, ,885 Millions of U.S. Dollars Shopping centers Elimination Station Space & office Other and/or Transportation utilization buildings services corporate Consolidated 2002: Operating revenues Outside customers... $13,456 $2,771 $1,243 $1,653 $ $19,123 Inside group ,098 (2,618) 13,842 2,847 1,301 3,751 (2,618) 19,123 Costs and expenses... 12,071 2,645 1,012 3,630 (2,613) 16,745 Operating income... $ 1,771 $ 202 $ 289 $ 121 $ (5) $ 2,378 Identifiable assets... $42,962 $1,074 $5,640 $4,114 $ (991) $52,799 Depreciation... 1, ,421 Capital investments... 2, ,653 The main activities of each business segment are as follows: Transportation : Passenger transportation mainly by passenger railway; Station space utilization : Retail sales, food and convenience stores, etc., which utilize space at the stations; Shopping centers & office buildings: Operation of shopping centers other than Station space utilization business, and leasing of office buildings, etc.; and Other services : Advertising and publicity, hotel operations, wholesales, truck delivery, cleaning, information processing, housing development and sales, credit card business and other services. 68
71 Capital investments include a portion contributed mainly by national and local governments. Identifiable assets in the corporate column mainly comprise current and non-current securities held by the Company. Following is the segment information for the year ended March 31, 2001, based on the previous business segmentation. Millions of Yen Elimination Merchandise Real estate Other and/or Transportation sales leasing services corporate Consolidated 2001: Operating revenues Outside customers... 1,805, , , ,907 2,546,041 Inside group... 68,041 62,998 11, ,250 (311,405) 1,873, , , ,157 (311,405) 2,546,041 Costs and expenses... 1,609, , , ,168 (310,771) 2,222,290 Operating income ,973 8,979 35,444 15,989 (634) 323,751 Identifiable assets... 5,666, , , , ,279 7,247,089 Depreciation ,763 9,000 28,539 28, ,651 Capital investments ,794 11,056 27,271 43, ,738 As referred to in Note 2, the Accounting Standards for Retirement Benefits in Japan has been operative beginning with the year ended March 31, As a result, in the transportation segment, costs and expenses were 48,120 million more than if the previous accounting methods had been applied, reducing operating income by the same amount. In the merchandise sales segment, costs and expenses decreased by 269 million and operating income increased by the same amount. In the real estate leasing segment, costs and expenses increased by 226 million and operating income decreased by the same amount. In the other services segment, costs and expenses increased by 248 million and operating income decreased by the same amount. Geographic segment information is not shown since the Company has no overseas consolidated subsidiaries. Information for overseas sales is not shown due to there being no overseas sales. 17. Information Regarding Certain Leases Finance leases other than those which transfer ownership to lessees are accounted for in the same manner as operating leases. Under such finance leases, lease payments, which were charged to income for the years ended March 31, 2001 and 2002, amounted to 14,620 million and 14,499 million ($109 million), respectively. Lease income which was credited to income for the years ended March 31, 2001 and 2002 was 1,365 million and 2,024 million ($15 million), respectively. Future lease payments inclusive of interest were 52,188 million ($392 million), including due in one year of 14,618 million ($110 million), and future lease receipts inclusive of interest were 13,180 million ($99 million), including due in one year of 3,803 million ($29 million) at March 31, Information for Derivative Transactions The Companies deal with forward exchange, foreign currency swap and interest rate swap transactions to hedge the risks resulting from future changes in foreign exchange rates and interest rates (market risk) with regard to bonds, loans and other obligations. The Companies believe there is extremely low risk of default by derivative transaction counterparties as all such transactions are with financial institutions having sound reputations. Contracts for derivative transactions are executed only after prudent consideration by the finance section of each of the Companies and upon resolution of its Board of Directors or other appropriate internal approval process. 19. Subsequent Event At the June 2002 annual meeting, the shareholders of the Company approved (1) the payment of a year-end cash divided of 2,500 ($19) per share, aggregating 10,000 million ($75 million), and (2) the payment of bonuses to directors and corporate auditors of 166 million ($1 million). 69

72 > REPORT OF INDEPENDENT PUBLIC ACCOUNTANTS 70
34 Review of Operations. 46 To Achieve Sustainable Growth. 65 Facts and Figures. Contents
 Contents 2 Our History 3 Business Portfolio 4 Risks and Opportunities 6 Our Calling 8 Financial Highlights 10 Selected Financial Data 13 Stock Information 14 A Message from the Management 16 Interview
JR East: International and Domestic Perspectives
 Peer Group Comparisons In this section, several key performance indicators illustrate how JR East compares with selected well-known companies. In scale and profitability, JR East is not to be outdone by
TRANSPORTATION BUSINESS SUPPORTS JR EAST AS A STABLE PROFIT RESOURCE
 REVIEW OF OPERATIONS TRANSPORTATION TRANSPORTATION BUSINESS SUPPORTS JR EAST AS A STABLE PROFIT RESOURCE Through a continuous process of service innovation and efficiency improvement, JR East s transportation
JR East: Domestic and International Perspectives
 Peer Group Comparisons In this section, several key performance indicators illustrate how JR East compares with selected well-known companies. In scale and profi tability, JR East is not to be outdone
We have been pursuing initiatives in light of the Group Philosophy since 1987.
 We have been pursuing initiatives in light of the Group Philosophy since 1987. Annual Report 2017 1 Tokyo 1988 2002 We have been pursuing our Eternal Mission while broadening our Unlimited Potential. Transportation
Main Points in the Results for FY2015
 0 1 2 Main Points in the Results for FY2015 Operating profit increased to 75.4 billion yen, exceeding the goal of 75.0 billion yen for the final year of the medium-term management plan in the first year
Transportation >Tokyo Metropolitan Area Network
 REVIEW OF OPERATIONS Transportation >Tokyo Metropolitan Area Network JR East s greatest strength is having a service area that includes the Tokyo metropolitan area, which accounts for about one-third of
Station Space Utilization
 Review of operations transportation non-transportation Station Space Utilization Top 2 Stations with Large Daily Passengers Use Station Number of Passengers per Day Tachikawa Hachioji Ofuna Shinjuku Omiya
Thank you for participating in the financial results for fiscal 2014.
 Thank you for participating in the financial results for fiscal 2014. ANA HOLDINGS strongly believes that safety is the most important principle of our air transportation business. The expansion of slots
East Japan Railway Company
 ANNUAL REPORT 2008 For the year ended March 31, 2008 profile Profile operating AreA Shin-Aomori Hachinohe Sapporo JR Hokkaido Akita Morioka JR East Shinjo Tokyo JR West Osaka JR Central Nagoya Yamagata
Japan Railways Successful Financing Models
 Japan Railways Successful Financing Models March 26, 2009 Masashi Hiraishi First Secretary, Embassy of Japan in India Contents 1. Financial scheme for the construction of new line in Japan 2. Integrated
ANA HOLDINGS Financial Results for the Three Months ended June 30, 2015
 ANA HOLDINGS NEWS ANA HOLDINGS Financial Results for the Three Months ended June 30, 2015 TOKYO, July 29, 2015 ANA HOLDINGS (hereinafter ANA HD ) today reports its financial results for the three months
Tokyo-Aomori 3.0 million passengers. per year. Shin-Aomori. Aomori. Hachinohe (631.9km) Airport. Odate-Noshiro. Airport. Akita (662.
 Airport. Odate-Noshiro. Airport. Akita (662.") Shinkansen Network Review of Operations Competition with Airlines Akita Hybrid Shinkansen 3:50 16,810 15 Aircraft (Akita ) 2:53 24,110 7 Joetsu Shinkansen + Uetsu Honsen Tokyo-Niigata 4.7 million passengers
Shinkansen Network Review of Operations Competition with Airlines Akita Hybrid Shinkansen 3:50 16,810 15 Aircraft (Akita ) 2:53 24,110 7 Joetsu Shinkansen + Uetsu Honsen Tokyo-Niigata 4.7 million passengers
JAL Group Announces its FY Medium-Term Business Plan
 JAL Group Announces its FY2006-2010 Medium-Term Business Plan -Mobilize the Group s Strengths to Regain Trust - Tokyo, Thursday March 2, 2006: The JAL Group today announced its medium-term business plan
Summary of Life-Style Service Business Growth Vision (NEXT10)
") East Japan Railway Company November 7, 2017 Life-Style Service Business Growth Vision (NEXT10) Established 30 years ago, the JR East Group aims to be a corporate group that energizes regions, energizes
East Japan Railway Company November 7, 2017 Life-Style Service Business Growth Vision (NEXT10) Established 30 years ago, the JR East Group aims to be a corporate group that energizes regions, energizes
Glossary. Rolling Stock Kilometers means the number of train kilometers (as defi ned below) multiplied by the number of railcars comprising the train.
 multiplied by the number of railcars comprising the train.") Glossary C Commuter Pass refers to a credit card sized pass that is either magnetically encoded or contains an integrated circuit (IC) chip to allow travel between two stations during a period of one,
Glossary C Commuter Pass refers to a credit card sized pass that is either magnetically encoded or contains an integrated circuit (IC) chip to allow travel between two stations during a period of one,
Transportation Shinkansen Network
 REVIEW OF OPERATIONS Transportation Shinkansen Network Competition with Airlines 100% Required Fare Akita Hybrid Shinkansen 3:49 16,810 15 Aircraft (Akita ) 2:38 23,210 7 Joetsu Shinkansen + Uetsu Honsen
Creating Happiness. Business Model. Business Mission
 Business Model Creating Happiness Oriental Land Co., Ltd. (OLC) was established with a strong aspiration to create a large-scale recreational facility, right here in Japan when Maihama was still a part
ANA HOLDINGS Financial Results for the Year ended March 31, 2016
 ANA HOLDINGS NEWS ANA HOLDINGS Financial Results for the Year ended March 31, 2016 TOKYO, April 28, 2016 ANA HOLDINGS (hereafter ANA HD ) today reports its consolidated financial results for fiscal year
ANA Reports Record Profits for FY2012
 ANA HOLDINGS NEWS ANA Reports Record Profits for FY2012 TOKYO April 30, 2013 - ANA Holdings today reports consolidated financial for the fiscal year ended March, 2013. Financial and Operational Highlights
ANA Holdings Financial Results for FY2013
 ANA HOLDINGS NEWS ANA Holdings Financial Results for FY2013 TOKYO April 30, 2014 - ANA Holdings (hereafter ANA HD ) today reports its consolidated financial for fiscal year 2013 (April, 2013 March, 2014).
GLOBAL PROMINENCE 2019 Aiming for Global Growth and Advancement
 This document is an English summary translation of a statement written initially in Japanese. The original Japanese should be considered the primary version. GLOBAL PROMINENCE 2019 Aiming for Global Growth
ANA HOLDINGS Management Strategy Update
 ANA HOLDINGS NEWS ANA HOLDINGS Management Strategy Update TOKYO, April 28, 2017 - ANA HOLDINGS (hereafter ANA HD ) today provides an update to its FY2016-2020 Mid-Term Management Strategy, set out in January
ANA HOLDINGS Announces Mid-Term Corporate Strategy for FY ~Strengthening the foundations of the business and looking into the future~
 ANA HOLDINGS NEWS ANA HOLDINGS Announces Mid-Term Corporate Strategy for FY2018-2022 ~Strengthening the foundations of the business and looking into the future~ TOKYO, February 1, 2018 ANA HOLDINGS (hereinafter
ANA HOLDINGS Financial Results for the Three Months Ended June 30, 2018
 ANA HOLDINGS NEWS ANA HOLDINGS Financial Results for the Three Months Ended June 30, 2018 TOKYO, July 31, 2018 ANA HOLDINGS INC. (hereinafter ANA HD ) today reports its financial results for the three
High-Speed Rail Operations in Japan Takao NISHIYAMA
 High-Speed Rail Operations in Japan Takao NISHIYAMA Director of Japan Railways Group New York Office New York, NY, U.S.A. Introduction Transportation Planning Train Variation and Efficiency Contents Risk
High Speed Network in Asian Countries: China, Korea and Japan. Naoto YANASE UIC, Senior Advisor High Speed Paris, France
 High Speed Network in Asian Countries: China, Korea and Japan Naoto YANASE UIC, Senior Advisor High Speed Paris, France Content Chinese high speed network Korean high speed network Japanese high speed
Sales increased and income will be on a recovery track in the second half of the fiscal year.
 Sales increased and income will be on a recovery track in the second half of the fiscal year. Contents I. Results for the First Half of Fiscal Year Ending March 2019 Profit decreased mainly due to temporary
Corporate Information
 Corporate Information 086 : Domestic and International Perspectives 099 Glossary 100 Consolidated Subsidiaries and Equity-Method Affiliated Companies 102 Corporate Data 103 Stock Information 086 EAST JAPAN
ANA Holdings Financial Results for the Third Quarter of FY2013
 ANA HOLDINGS NEWS ANA Holdings Financial Results for the Third Quarter of FY2013 TOKYO January 31, 2014 - ANA Holdings (hereafter ANA HD ) today reports its consolidated financial for the third quarter
Measures Perpetuating JR East s Unlimited Growth Potential
 FEATURE Measures Perpetuating East s Potential Potential 1. Series E6 railcars Enhancement of the Shinkansen Network Operation of Shinkansen at Faster Speeds Starting March 2013, East raised the maximum
Summary of Results for the First Three Quarters FY2015/3
 Summary of Results for the First Three Quarters FY2015/3 February 10, 2015 Tokyu Corporation (9005) http://www.tokyu.co.jp/ Contents Ⅰ.Executive Summary 2 Ⅱ.Conditions in Each Business 5 Ⅲ.Details of Financial
Pursuing Our. Unlimited Potential
 Pursuing Our Unlimited Potential For the year ended March 31, 2012 JR East s Strengths 1 AN OVERWHELMINGLY SOLID AND ADVANTAGEOUS RAILWAY NETWORK JR EAST S SERVICE AREA TOKYO The railway business of the
Summary of Results for the First Quarter of FY2015/3
 Summary of for the First Quarter of FY2015/3 August 8, 2014 Tokyu Corporation (9005) http://www.tokyu.co.jp/ Contents Ⅰ.Executive Summary 2 Ⅱ.Conditions in Each Business 4 Ⅲ.Details of Financial for the
JAL Group Announces Consolidated Financial Results for Full Fiscal Year 2011
 JAL Group Announces Consolidated Financial Results for Full Fiscal Year 2011 TOKYO May 14, 2012: The JAL Group (JAL) announced today the consolidated financial results for the full fiscal year of 2011
An Interview with President Ohashi
 An Interview with President Ohashi Progress in Implementing the Medium-Term Corporate Plan Q1 Please give us an overview of the airline industry in the year ended March 31, 21, and tell us about the progress
TWENTY-SECOND MEETING OF THE ASIA/PACIFIC AIR NAVIGATION PLANNING AND IMPLEMENTATION REGIONAL GROUP (APANPIRG/22)
") INTERNATIONAL CIVIL AVIATION ORGANIZATION TWENTY-SECOND MEETING OF THE ASIA/PACIFIC AIR NAVIGATION PLANNING AND IMPLEMENTATION REGIONAL GROUP (APANPIRG/22) Bangkok, Thailand, 5-9 September 2011 Agenda
INTERNATIONAL CIVIL AVIATION ORGANIZATION TWENTY-SECOND MEETING OF THE ASIA/PACIFIC AIR NAVIGATION PLANNING AND IMPLEMENTATION REGIONAL GROUP (APANPIRG/22) Bangkok, Thailand, 5-9 September 2011 Agenda
I ll give you an overview of financial results for the first half of fiscal year 2017 and topics of each business, mainly Shopping Complex Business.
 I ll give you an overview of financial results for the first half of fiscal year 2017 and topics of each business, mainly Shopping Complex Business. Page 2 shows a summary. Let me begin with consolidated
FY2015 2nd Quarter Business Results
 FY2015 2nd Quarter Business Results Project AH A MAY products Yamaha Corporation and Yamaha Motor Co., Ltd. make products by exchanging the design divisions and their design fields, and present a joint
El Al Israel Airlines announced today its financial results for the year 2016 and the fourth quarter of the year:
 El Al Israel Airlines announced today its financial results for the year 2016 and the fourth quarter of the year: The Company's revenues in 2016 amounted to approx. USD 2,038 million, compared to approx.
Ireland. Tourism in the economy. Tourism governance and funding
 Ireland Tourism in the economy Tourism is one of Ireland s most important economic sectors and has significant potential to play a further role in Ireland s economic renewal. In 2014, spending by visitors
Feature: Priority Initiative 01 Railway Network Expansion
 Feature: Priority Initiative 01 Railway Network Expansion Following on from the March 2015 opening of the Hokuriku Shinkansen Line from Nagano to Kanazawa, March 2016 saw the opening of the Hokkaido Shinkansen
Message from Management food surroundings. Sapporo Group Net Sales (Billions of Yen) Sapporo Group New Management Framework Date of Establishment:
 Sapporo Group New Management Framework Date of Establishment:") GROUP PROFILE Message from Management Our goal is to create value in food, and offer proposals for a rich and enjoyable life. The year 2016 marks our 140th anniversary. We have formulated the Sapporo Group
GROUP PROFILE Message from Management Our goal is to create value in food, and offer proposals for a rich and enjoyable life. The year 2016 marks our 140th anniversary. We have formulated the Sapporo Group
EXECUTIVE VICE PRESIDENT. Masaki OGATA. Copyright 2010 East Japan Railway Company. All rights reserved 1
 EXECUTIVE VICE PRESIDENT Masaki OGATA Copyright 2010 East Japan Railway Company. All rights reserved 1 Company Profile of JR East Copyright 2010 East Japan Railway Company. All rights reserved 2 Company
JAL Group's Medium-term Business Plan for FY
 JAL Group's Medium-term Business Plan for FY 2005-07 (Analyst Briefing) March 10, 2005 Japan Airlines Corporation 0 JAL 2005 Contents Business Environment and Essence of the Plan Expansion into the growing
Tulsa Airports Improvement Trust Strategic Plan Update
 Tulsa Airports Improvement Trust Strategic Plan Update 2016-2026 TABLE OF CONTENTS I. Background II. III. IV. Existing Conditions and Future Requirements Mission, Vision, & Goals Strengths, Weakness, Opportunities
Balance sheets and additional ratios
 Balance sheets and additional ratios amounts in millions unless otherwise stated Consolidated balance sheets Dutch guilders USD* June 30, December 31, June 30, December 31, 1997 1996 1997 1996 Fixed assets
MIRAMAR, Fla., April 29, 2015 (GLOBE NEWSWIRE) -- Spirit Airlines, Inc. (Nasdaq:SAVE) today reported first quarter 2015 financial results.
 -- Spirit Airlines, Inc. (Nasdaq:SAVE) today reported first quarter 2015 financial results.") April 29, 2015 Spirit Airlines Announces First Quarter 2015 Results; Adjusted Net Income Increases 87.1 Percent to $70.7 Million and Pre-Tax Margin Increases 900 Basis Points to 22.7 Percent MIRAMAR, Fla.,
April 29, 2015 Spirit Airlines Announces First Quarter 2015 Results; Adjusted Net Income Increases 87.1 Percent to $70.7 Million and Pre-Tax Margin Increases 900 Basis Points to 22.7 Percent MIRAMAR, Fla.,
Tokyu Tourist Corporation to become a wholly-owned subsidiary through share exchange
 NOTICE TO SHAREHOLDERS RESIDENT IN THE UNITED STATES: This press release relates to a proposed business combination which involves the securities of a foreign company. It is subject to disclosure requirements
JR East s five-route Shinkansen network. Shin-Aomori. Hachinohe. Morioka. Akita. Shinjo. Yamagata Niigata. Sendai. Fukushima. Takasaki. Omiya.
 Review of Operations Transportation Shinkansen Bullet Train Network JR East operates a five-route Shinkansen network, comprising the Tohoku, Joetsu and Nagano Shinkansen lines and the Yamagata and Akita
ANA HOLDINGS Financial Results for FY2014
 ANA HOLDINGS NEWS ANA HOLDINGS Financial Results for FY2014 TOKYO, April 30, 2015 ANA HOLDINGS (hereafter ANA HD ) today reports its consolidated financial results for fiscal year 2014 (April-March). Highlights
Establishment of Subsidiary and Acquisition of Real Estate in the US
 December 8, 2016 Mori Trust Co., Ltd Toranomon 2-chome Tower, 2-3-17 Toranomon, Minato-ku, Tokyo 105-0001 Japan Mail: info@mori-trust.co.jp URL: http://www.mori-trust.co.jp/english/ Medium-and Long-Term
OUTLINE OF JAL GROUP MEDIUM RANGE CORPORATE PLAN FOR THE YEARS 2004 THROUGH 2006
 OUTLINE OF JAL GROUP MEDIUM RANGE CORPORATE PLAN FOR THE YEARS 2004 THROUGH 2006 Tokyo March 10, 2004: FY2003 business has been badly affected in terms of demand and on revenue by the negative impact of
Bilfinger Berger: Preliminary Report on the 2004 Financial Year
 Bilfinger Berger AG Carl-Reiss-Platz 1-5 68165 Mannheim Germany www.bilfingerberger.com Contact: Sascha Bamberger Phone: +49 6 21/4 59-24 55 Fax: +49 6 21/4 59-25 00 E-mail: sbam@bilfinger.de Date: February
East Japan Railway Company
 Consolidated Financial Results for the Three-Month Period Ended June 30, 2017 (Japanese GAAP) (Unaudited) Fiscal 2018 (Year ending March 31, 2018) First Quarter means the three months from April 1 to June
Jazz Air Income Fund. presented by Allan Rowe, Senior Vice President and Chief Financial Officer
 Jazz Air Income Fund presented by Allan Rowe, Senior Vice President and Chief Financial Officer BMO Capital Markets 2007 Income Trust Conference Toronto, November 20, 2007 Hello. 1 Forward Looking Statement
JAL Group Announces FY Medium Term Revival Plan
 JAL Group Announces FY2007-2010 Medium Term Revival Plan - Strengthening safety, focusing on customers, rebuilding the business foundation and realizing stable profits- Tokyo, February 6, 2007: The JAL
CONTACT: Investor Relations Corporate Communications
 NEWS RELEASE CONTACT: Investor Relations Corporate Communications 435.634.3200 435.634.3553 Investor.relations@skywest.com corporate.communications@skywest.com SkyWest, Inc. Announces Second Quarter 2017
Press Release. Bilfinger 2017: Stable foundation laid for the future
 Press Release February 14, 2018 Bilfinger 2017: Stable foundation laid for the future Organic growth in orders received after three years of decline Trend reversal: Output volume better than expected Growth
ANNUAL REPORT For the year ended March 31, Pursuing
 ANNUAL REPORT 2017 For the year ended March 31, 2017 Pursuing We have been pursuing initiatives in light of the Group Philosophy since 1987. Annual Report 2017 1 Tokyo 1988 2002 We have been pursuing our
ANA HOLDINGS Financial Results for the Six Months Ended September 30, 2018
 ANA HOLDINGS NEWS ANA HOLDINGS Financial Results for the Six Months Ended September 30, 2018 TOKYO, Nov. 2, 2018 ANA HOLDINGS INC. (hereinafter ANA HD ) today reports its financial results for the six
AIR CANADA REPORTS 2010 THIRD QUARTER RESULTS; Operating Income improved $259 million or 381 per cent from previous year s quarter
 AIR CANADA REPORTS 2010 THIRD QUARTER RESULTS; Operating Income improved $259 million or 381 per cent from previous year s quarter MONTRÉAL, November 4, 2010 Air Canada today reported operating income
ANA s Scenario for Future Growth
 An Interview with the President s Scenario for Future Growth In the fiscal year ended March 31, 2000, faced a challenging operating environment marked by intensifying competition among airlines. There
WestJet announces 18th consecutive quarter of profitability Airline reports third quarter net earnings of $31.4 million
 FOR IMMEDIATE RELEASE WestJet announces 18th consecutive quarter of profitability Airline reports third quarter net earnings of $31.4 million CALGARY, ALBERTA. November 4, 2009. WestJet (TSX:WJA) today
Sabre Summer Defining times. Defining company.
 Sabre Summer 2002 Defining times. Defining company. The travel industry is not recovering as we had anticipated, yet we met earnings expectations. We continue to take actions across our portfolio to bring
October 30, 2013 Oriental Land Co., Ltd.
 October 30, 2013 Oriental Land Co., Ltd. . Financial Results Consolidated Statement of Income Half Ended 9/12 Net Sales 188.3 230.0 41.6 22.1 Theme Park Segment 156.4 189.7 33.2 21.3 Hotel Business Segment
Summary o f Results for the First Half of FY2018
 Summary o f Results for the First Half of FY2018 November 9, 2018 (9005) https://www.tokyu.co.jp/ Contents Ⅰ.Executive Summary 2 Ⅱ.Conditions in Each Business 6 Ⅲ.Details of Financial Results for the 13
Interim Business Report 2017
 April 1, 2017 through September 30, 2017 November 22, 2017 Contents SECTION 1 01 Consolidated Statement of Income 02 Factors Leading to Difference in Consolidated Ordinary Income Compared With Same Period
Management s Review and Analysis of Financial Position
 Management s Review and Analysis of Financial Position Japan Airlines System Corporation and Consolidated Subsidiaries Years Ended March 31, 22 and 23 Consolidated operating revenues 2,4 1,8 1,2 6 21 22
Case Study on Station Redevelopment in Japanese Railways
 Case Study on Station Redevelopment in Japanese Railways Ryoko NAKANO Assistant Manager, Technical Headquarters Japan International Consultants for Transportation Co., Ltd. 16/03/2016 Contents 1. Overview
Spirit Airlines Reports First Quarter 2017 Results
 Spirit Airlines Reports First Quarter 2017 Results MIRAMAR, Fla., April 28, 2017 - Spirit Airlines, Inc. (NASDAQ: SAVE) today reported first quarter 2017 financial results. GAAP net income for the first
CONTACT: Investor Relations Corporate Communications
 NEWS RELEASE CONTACT: Investor Relations Corporate Communications 435.634.3200 435.634.3553 Investor.relations@skywest.com corporate.communications@skywest.com SkyWest, Inc. Announces Fourth Quarter 2017
INVESTOR PRESENTATION. May 2015
 INVESTOR PRESENTATION May 2015 Forward-looking Statements This presentation contains forward-looking statements within the meaning of the Private Securities Litigation Reform Act of 1995 that reflect the
Gerry Laderman SVP Finance, Procurement and Treasurer
 Gerry Laderman SVP Finance, Procurement and Treasurer Safe Harbor Statement Certain statements included in this release are forward-looking and thus reflect our current expectations and beliefs with respect
Development of Transportation Networks
 1 Development of Railway Networks We promote the improvement of railway networks. Some of our activities include the construction of new shinkansen lines to develop the axis of national transportation,
ABX. Holdings, Inc. BB&T Transportation Conference. February 2008
 ABX Holdings, Inc. BB&T Transportation Conference February 2008 1 Safe Harbor Statement Except for historical information contained herein, the matters discussed in this presentation contain forward-looking
Crown Corporation BUSINESS PLANS FOR THE FISCAL YEAR Trade Centre Limited. Table of Contents. Business Plan
 Crown Corporation BUSINESS PLANS FOR THE FISCAL YEAR 2014 2015 Trade Centre Limited Business Plan 2014 2015 Table of Contents Message from the CEO and the Chair... Mission... Planning Context... Strategic
IKYU Corporation. Presentation Materials
 IKYU Corporation Tokyo Stock Exchange First Section (Securities Code No. 2450) Non-Consolidated Financial Results for Fiscal 2011 (April 2011 to March 2012) Presentation Materials May 10, 2012 This is
INVESTOR PRESENTATION. Imperial Capital Global Opportunities Conference September 2015
 INVESTOR PRESENTATION Imperial Capital Global Opportunities Conference September 2015 Forward-looking Statements This presentation contains forward-looking statements within the meaning of the Private
Basic Policies on Operation of National Airports Utilizing Skills of the Private Sector
 (TRANSLATION)(for Reference Only) Basic Policies on Operation of National Airports Utilizing Skills of the Private Sector I. The Purpose and Objectives in Operating etc. National Airports etc. by Utilizing
Oct-17 Nov-17. Sep-17. Travel is expected to grow over the coming 6 months; at a slightly faster rate
 Analysis provided by TRAVEL TRENDS INDEX SEPTEMBER 2018 CTI reading of.8 in September 2018 indicates that travel to or within the U.S. grew 1.6% in September 2018 compared to September 2017. LTI predicts
FY2009 Financial Results Presentation Overcome the Recession and Go for Growth Again
 Financial Results Presentation Overcome the Recession and Go for Growth Again May 19, 2009 Keihan Electric Railway Co., Ltd. (Tokyo Stock Exchange 1st/ Osaka Securities Exchange 1st 9045 http://www.keihan.co.jp/)
Management Discussions and Analysis for the three-month period ended 31 March 2014 and Executive Summary
 Executive Summary Overview of the global economy during the first quarter of 2015 (Q1/2015) are as following; the US economy has been in recovery mode while rapidly dollar appreciation weighs on net exports
Shopping Mall Business in Japan
 Overview of Business Operations (Fiscal year ending February 20, 2011) Shopping Mall Business in Japan ÆON Mall is pressing ahead in creating shopping malls that answer customer needs and are the most
Copa Holdings Reports Net Income of $49.9 million and EPS of $1.18 for the Second Quarter of 2018
 Copa Holdings Reports Net Income of $49.9 million and EPS of $1.18 for the Second Quarter of 2018 Panama City, Panama --- Aug 8, 2018. Copa Holdings, S.A. (NYSE: CPA), today announced financial results
OPERATING AND FINANCIAL HIGHLIGHTS
 Copa Holdings Reports Net Income of US$32.0 Million and EPS of US$0.72 for the Second Quarter of 2012 Excluding special items, adjusted net income came in at $58.6 million, or EPS of $1.32 per share Panama
Concrete Visions for a Multi-Level Governance, 7-8 December Paper for the Workshop Local Governance in a Global Era In Search of
 Paper for the Workshop Local Governance in a Global Era In Search of Concrete Visions for a Multi-Level Governance, 7-8 December 2001 None of these papers should be cited without the author s permission.
Canada s Airports: Enabling Connectivity, Growth and Productivity for Canada
 Canada s Airports: Enabling Connectivity, Growth and Productivity for Canada 2018 Federal Budget Submission House of Commons Standing Committee on Finance Introduction The Canadian Airports Council is
Thor Basics: An Introduction to the Company. 1
 Thor Basics: An Introduction to the Company www.thorindustries.com 1 FORWARD LOOKING STATEMENTS This presentation includes certain statements that are forward looking statements within the meaning of the
CONTACT: Investor Relations Corporate Communications
 NEWS RELEASE CONTACT: Investor Relations Corporate Communications 435.634.3200 435.634.3553 Investor.relations@skywest.com corporate.communications@skywest.com SkyWest, Inc. Announces Second Quarter 2016
From: OECD Tourism Trends and Policies Access the complete publication at: Japan
 From: OECD Tourism Trends and Policies 2014 Access the complete publication at: http://dx.doi.org/10.1787/tour-2014-en Japan Please cite this chapter as: OECD (2014), Japan, in OECD Tourism Trends and
Education for Pedestrians at Level Crossings. Taro KITAMURA Takuji HONZAWA Transport Safety Department East Japan Railway Company
 Education for Pedestrians at Level Crossings Taro KITAMURA Takuji HONZAWA Transport Safety Department East Japan Railway Company 1 Contents 1. Outline of JR East 2. JR East Group Safety Plan 2018 (five-year
OPERATING AND FINANCIAL HIGHLIGHTS. Subsequent Events
 Copa Holdings Reports Net Income of US$113.1 Million and EPS of US$2.57 for the First Quarter of 2015 Excluding special items, adjusted net income came in at US$106.0 million, or EPS of US$2.41 per share
TRANSPORT INFRASTRUCTURE
 TRANSPORT INFRASTRUCTURE Existing Transport Infrastructure: Planned Transport Infrastructure: The framework for the construction of Tokyo s transport infrastructure began with the preparations for the
Stimulating Airports is Stimulating the Economy
 Stimulating Airports is Stimulating the Economy House of Commons Standing Committee on Finance Pre-budget 2010 Submission August 14 th, 2009 Executive Summary Atlantic Canada Airports Association s (ACAA)is
SPEECH BY WILLIE WALSH, CHIEF EXECUTIVE, INTERNATIONAL AIRLINES GROUP. Annual General Meeting, Thursday June 14, Check against delivery
 SPEECH BY WILLIE WALSH, CHIEF EXECUTIVE, INTERNATIONAL AIRLINES GROUP Annual General Meeting, Thursday June 14, 2018 Check against delivery FINANCIAL PERFORMANCE Good afternoon Ladies and Gentleman. I
Allegiant Travel Company Reports First Quarter 2009 Financial Results
 Allegiant Travel Company Reports First Quarter 2009 Financial Results --NET INCOME INCREASES 191%, OPERATING MARGIN EXCEEDS 31% LAS VEGAS, April 19, 2009 /PRNewswire-FirstCall via COMTEX News Network/
The Asian evolution of high speed rail
 University of Wollongong Research Online Faculty of Engineering and Information Sciences - Papers: Part A Faculty of Engineering and Information Sciences 2013 The Asian evolution of high speed rail Philip
OPERATING AND FINANCIAL HIGHLIGHTS SUBSEQUENT EVENTS
 Copa Holdings Reports Net Income of US$6.2 Million and EPS of US$0.14 for the Third Quarter of 2015 Excluding special items, adjusted net income came in at $37.4 million, or EPS of $0.85 per share Panama
May 15, I. Absorption-type Company Split Pursuant to the Move to a Holding Company Structure
 May 15, 2012 Corporate Name: ALL NIPPON AIRWAYS CO., LTD. President and C.E.O. Shinichiro Ito (Code Number: 9202, First Section of the Tokyo Stock Exchange and the Osaka Securities Exchange) Contact: Director,