Investor Day 27 June 2012
|
|
|
- Merilyn Campbell
- 6 years ago
- Views:
Transcription

1 Investor Day 27 June 2012
2 2012, an important year in ADP's history The reconfiguration of Paris-Charles de Gaulle hub is now completed: a major leapfrog in terms of quality of service and operational effectiveness will be reached A change of scale in retail is achieved thanks to 2 new outstanding retail areas and the deepening of a strategy that delivers sound results ADP has acquired a true international dimension with the acquisition of 38% of TAV Airports 2012 Investor Day 1 Résultats semestriels
3 Updated targets for 2015 In an uncertain economic environment, the Group is updating its targets for 2015 : The ROCE of the regulated perimeter is now expected to be between 4.5% and 5.0% (1) The Sales / pax ambition is lifted to 19 (2) The EBITDA growth is maintained: +40% vs ) 5.4% previously 2) Sales of shops in restricted area / departing passengers. Previous guidance: Investor Day 2 Résultats semestriels
4 2012, an important milestone for the hub of CDG Franck GOLDNADEL - Managing Director of CDG
5 Classement des aéroports par nombre de passagers Overview of Paris-Charles de Gaulle ' airport Major changes for the hub in Investor Day 4 Résultats semestriels
6 Classement des aéroports par nombre de passagers Paris-Charles de Gaulle is the 7 th airport in the world A key player in the industry Passenger traffic is back to pre-crisis levels but ATMs are lagging behind # Passengers (m) in / Atlanta Beijing-Capital London-Heathrow Chicago-O'hare Tokyo-Haneda Los Angeles Paris-CDG Dallas-FT Worth Frankfurt ,4% +4,7% +5,4% -3,2% -2,5% +5,1% +4,8% +1,6% +6,5% Hong Kong 53 +5,9% Amsterdam ,0% Passengers (m) ATMs (in '000) 2012 Investor Day 5 Résultats semestriels
7 43% of traffic is intercontinental North America 13.8% +5.9% French overseas territories 0.6% -10,2% France 8.6% +6.2% Europe 48.5% +6.9% Middle East 6.1% -5.6% Total traffic 2011: 61 Mpax ; +5.1% Connecting rate: 30.7% (+0.5 pt) + 2.4m pax from High Speed train (TGV) Asia / Pacific 9.2% +6.3% Latin America Africa 4.4% +8.7% 8.9% -3.2% % total traffic in / Investor Day 6 Résultats semestriels
8 A hub organized in 6 "waves" Movements 80 Departure traffic Movements 80 Arrival traffic :00 1:00 2:00 3:00 4:00 5:00 6:00 7:00 8:00 9:00 10:00 11:00 12:00 13:00 14:00 15:00 16:00 17:00 18:00 19:00 20:00 21:00 22:00 23:00 0:00 1:00 2:00 3:00 4:00 5:00 6:00 7:00 8:00 9:00 10:00 11:00 12:00 13:00 14:00 15:00 16:00 17:00 18:00 19:00 20:00 21:00 22:00 23:00 S12 schedule Max achieved Air France's depeaking plan: positive move to improve quality of service and infrastructure utilisation rate 2012 Investor Day 7 Résultats semestriels


9 Each alliance has its own identified area T1 11% T3 63% TGV Station 2B 2A 2D 2C 2F 2E S3 2G 4% Note: % of total traffic in 2011 Others (LCCs, charter, non-allianced airlines) = 22% 2012 Investor Day 8 Résultats semestriels
10 Paris-Charles de Gaulle has enough capacity to meet future traffic demand million passengers capacity in 2012 In m pax A unique system of runways with no constraint 2 independent systems of parallel runways: Current capacity of 116 ATM/h Gradually increased in the future Collaborative Decision Making offering operational and environmental efficiency: Reduced time on taxiways Reduced fuel consumption Northern runways Capacity 2B closed Traffic* Half of 2D closed Southern runways * CDG traffic as published by ADP until 2011 then as per trends disclosed in the "Public Consultation Document" (Feb 2010) CAGR : 3.5% and CAGR : 3.8% 2012 Investor Day 9 Résultats semestriels
11 Classement des aéroports par nombre de passagers Freight and mail: the other hub system 6 th biggest freight platform A virtuous cycle # In m of tons 2011 / 2010 Hong Kong 3,9-4,6% Memphis 3,9 +0,0% Shanghai 3,1-4,4% Anchorage 2,6 +1,8% Seoul-Incheon 2,6-3,4% Paris-CDG 2,3-4,1% Frankfurt 2,2-2,6% Dubaï 2,2-3,1% Louiseville 2,2 +1,0% Tokyo-Haneda 1,9 +13,0% CDG is the European hub of FEDEX Complementary roles of AF-KLM and FEDEX hubs: >50% of freight is carried by commercial flights CDG master plan is compatible with customers development strategy in aeronautical activities and in real estate Project ( CAREX ) to link freight stations to high speed train network Project to improve administrative processes thanks to E-freight 2012 Investor Day 10 Résultats semestriels
12 Classement des aéroports par nombre de passagers Overview of Paris-Charles de Gaulle airport Major changes for the hub in Investor Day 11 Résultats semestriels


13 2012 is a key milestone for the reconfiguration of CDG Major evolution of infrastructures A/C Junction Satellite 4 The single security control ( IFU ) supported by operational process excellence Improvement of internal operating systems and customer processes Optimisation of airline allocation within terminals A strategy focused on customer satisfaction and operational effectiveness 2012 Investor Day 12 Résultats semestriels


14 A major leapfrog in the quality of the infrastructures 2 major projects delivered in 2012 A/C Junction: improvement of operations A unique entry point for terminals A and C Pooling of security and Border Police checkpoints in order to improve fluidity A new retail area New lounges for airlines 2,300 sqm of shops in international areas Satellite 4: reconfiguration of the hub Easier connections Operational gains expected: effectiveness of connections, fluidity 16 wide-bodied carrier contact stands including 7 for A380 Capacity: 7.8m pax 6,000 sqm of shops in international area 2012 Investor Day 13 Résultats semestriels


15 A/C Junction 2012 Investor Day 14 Résultats semestriels

16 The 1 st level: border and security controls optimised Check-in area Border Police Controls Security Controls 2012 Investor Day 15 Résultats semestriels


17 The 2 nd level: an outstanding retail area 2012 Investor Day 16 Résultats semestriels
18 Satellite 4: the most amazing boarding lounge in Europe Capacity of 7,8m Pax 6,000 sqm of shops and B&R 16 contact stands for wide body aircrafts 120,000 sqm 3,200 sqm of lounges 2012 Investor Day 17 Résultats semestriels
 and")

19 Satellite 4 is one piece of the final extension of 2E terminal Satellite 4 is one part of the 2E complex machinery including: Baggage handling system Car parks Passenger services between the main terminal building (check-in, border, connections, ) and all the gates concourses Passenger services on arrival (border, baggage delivery, customs ) The hub is now technically completed and allows SkyTeam to gather operations at the east side of the platform 2012 Investor Day 18 Résultats semestriels


20 The single security control ("IFU") "Enabling passengers arriving from, or transiting via, the Schengen zone for connections on Int l flights to proceed directly to their departure gate zones without having to resubmit to a new security check" Schengen Schengen Schengen International International International International Schengen Security Checks Boarder controls Arrival Terminal Departure Terminal 2012 Investor Day 19 Résultats semestriels
21 The single security control ("IFU") No more additional security checks for connecting passenger coming from Schengen area Creation of dedicated transit passenger flows between: 2F and 2E (concourse K) 2F and S3 (Concourse L) Clearer, more rapid and simplified processes for airlines / passengers Rationalization of staff allocations to main check points (Border Police/Security) Passenger able to shop more Improvement of fluidity and quality of service 2012 Investor Day 20 Résultats semestriels
22 Optimisation of airline allocation: a step by step strategy 35 airlines will be concerned by the change of allocation Tailored organization to agree on schedule with all stakeholders taking into account The opening and closing dates of different facilities Specific needs of airlines and their partners Aéroports de Paris own engineering specification in respect of our partners (sub-contractors, government services, ) Any work sites The keys to success lie in the full cooperation between all partners 2012 Investor Day 21 Résultats semestriels

23 Optimisation of airline allocation: changes in 2012 Air India, MEA & KENYA from 2F to 2C 2bis All Air France flights from 2C to 2E All Air France, CSA & Air Europa flights from 2D to 2F 2F becomes all Schengen October 2012 Aeroflot from 2E to 2C 1bis 2 Air France, Air Mauritius, & Tarom Flights from 2F to 2E Satellite S4 28 June Investor Day 22 Résultats semestriels
24 Optimisation of airline allocation: snapshot at the end of 2012 T1 T3 2B 2A 2D 2C Schengen 2F 2E S3 S4 2G 2012 Investor Day 23 Résultats semestriels
25 What's next? CDG has now enough capacity to refurbish terminal 2B: Step 1 (Q to Q1 2013): 2D: Schengen / International configuration Transfer of easyjet from 2B to 2D Step 2 (Q to beginning of ERA 3): complete refurbishment in order to: Increase the quality of service Improve terminals 2B/2D efficiency and flexibility Increase retail spent 2012 Investor Day 24 Résultats semestriels


26 Optimizing Airport Retail Mathieu DAUBERT - Retail Director
27 Our ambition : To become the referent for Travel Retail in Europe While offering the Last Parisian shopping experience A unique positioning: Paris, capitale de la Creation, based on 3 key lines : Perfume & Cosmetics, ' Luxury Fashion & Accessories, Gastronomy A new and optimized retail layout, and an ambitious design While creating awareness among our passengers before their arrival at the airport While implementing an optimized business model 2012 Investor Day 26 Résultats semestriels


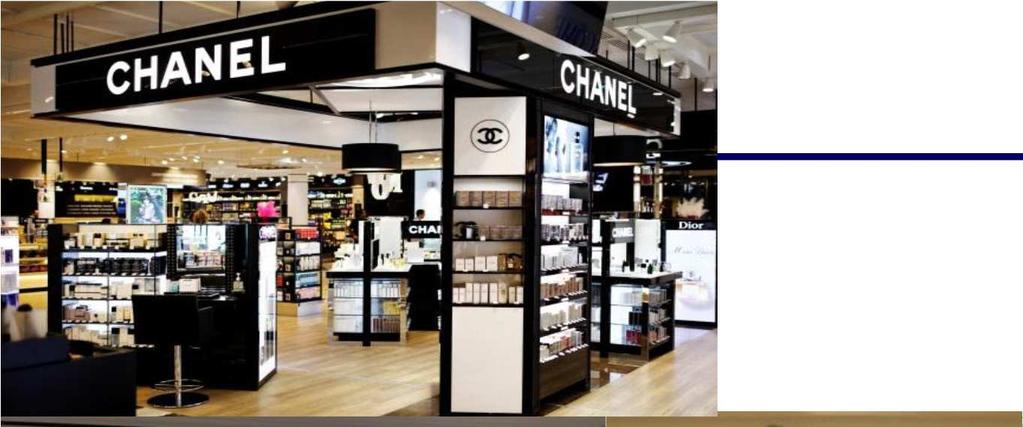
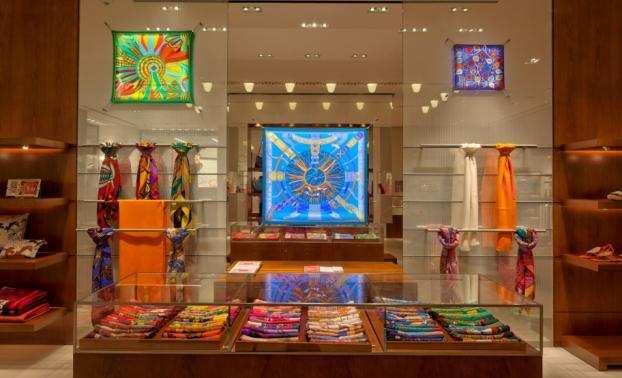
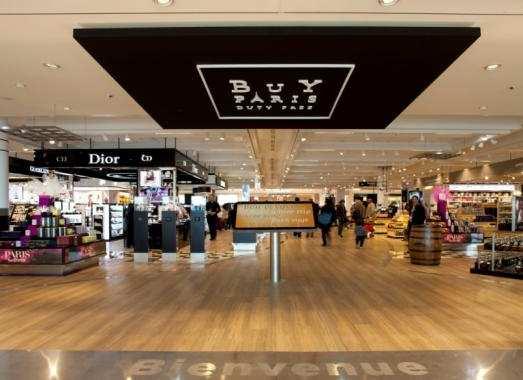
28 A unique positioning "Paris, capitale de la création" Iconic French brands on 3 product categories are our main asset Strong Focus on 3 key lines Perfume & Cosmetics Luxury Fashion & Accessories Gastronomy, wine, champagne and cognac : "l Art de vivre à la française" Iconic Brands as our main asset A conquest of all the iconic brands, in each of our 3 key product categories Development of monobrand shops, or dedicated corner in multibrand shops In addition, 3 exclusive Parisian concepts The "Buy Paris Duty Free Department store The "Buy Paris Collection" Fashion multibrand shop "Air de Paris" Souvenirs shop 2012 Investor Day 27 Résultats semestriels

, and a second store at the Satellite 4 (2,200")

29 A unique positioning "Paris, capitale de la création" "Buy Paris Duty Free": The new Parisian Department Store A partnership with SDA The concept: re-create the interior design of a Parisian department store, dedicated to Perfume & Cosmetics and French Art de Vivre. A pilot opened in March 2012 at the A/C Junction (1,300 sqm), and a second store at the Satellite 4 (2,200 sqm). Strong Focus on French Brands (Chanel, Dior, Guerlain, Lancôme, YSL, Fauchon ) Peaks of Expertise on French savoir-faire: Wine and Champagne Cellar Cheese Cellar "French Terroir" products French perfume artists 2012 Investor Day 28 Résultats semestriels


30 A unique positioning "Paris, capitale de la création" Luxury Gastronomy: An intensive development programme An intensive development of Luxury Gastronomy up to 20 shops mid-2012 An additional creation of value above multibrand Confectionary & Fine food Base 100 = Sales/pax in Confectionary & Fine Food 20 Number of Luxury Gastronomy Monobrand shops Multibrand shops Luxury monobrand shops June Investor Day 29 Résultats semestriels

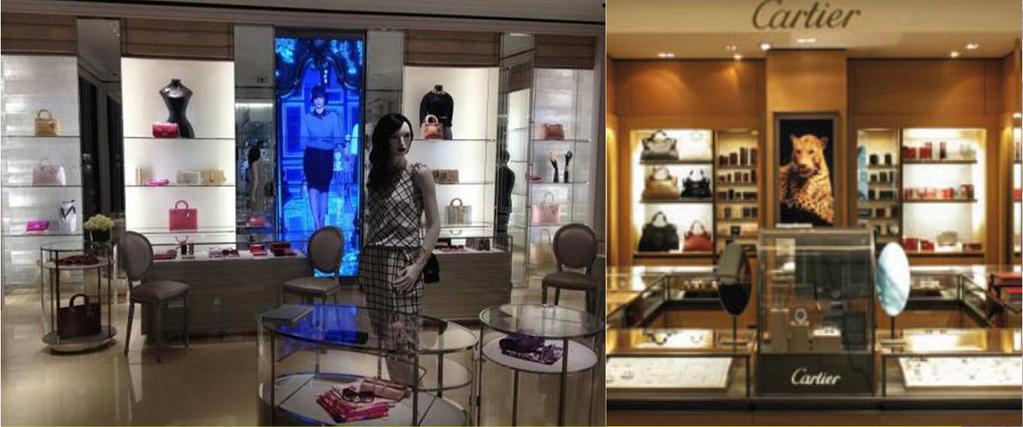
31 A unique positioning "Paris, capitale de la création" Luxury Fashion & Accessories: An enriching portfolio An enriching portfolio from 6 star brands in 2006 to 20 in 2012 An intensive development which drives the fashion sales/pax growth Number of Luxury Monobrand shops juin-12 Base 100 = Sales/pax Fashion Total 2012 Investor Day 30 Résultats semestriels


32 A unique positioning "Paris, capitale de la création" "Buy Paris Collection": A new concept of multibrand fashion A partnership with SDA A pilot opened in February 2012, and second shop at the Satellite 4 Positioning: Mix Man / Woman + Mid to high range brands Focus on top French designers : Zadig & Voltaire, Vanessa Bruno, Repetto, 2012 Investor Day 31 Résultats semestriels


33 A unique positioning "Paris, capitale de la création" "Air de Paris": A new and exclusive concept of Paris Souvenirs High potential market (90% leisure tourists bring back at least one souvenir from Paris) Few competition downtown A partnership with Relay@ADP A pilot shop opened in shops already opened in shops end of 2014 Significant additional value to our sales High average basket in Duty Free zones 2012 Investor Day 32 Résultats semestriels

 14% (2008) Part of Travel Retail sector as part of the total advertising sales 31% (2012) 2012 Investor Day 33")
34 A unique positioning Paris, capitale de la création Advertising: A new offer creating synergies with our positioning A new offer putting emphasis on digital technology and design quality A new offer creating synergies with our positioning A partnership with our new joint venture, Media Aéroports de Paris, under the brand "JC Decaux Aiport Paris" Larger and more qualitative billboards More than 400 new digital displays Design by French Designer Patrick Jouin Fast replacement of displays: 50% renewed in 6 months The combination of this new offer with our retail positioning and brand portfolio creates additional advertising revenues (+ promotes our retail offer) 14% (2008) Part of Travel Retail sector as part of the total advertising sales 31% (2012) 2012 Investor Day 33 Résultats semestriels


35 A new and optimized retail layout, and an ambitious design A new Model of Layout Security check / Border Breathing area WALKTHROUGH Beauty & Arts de vivre Department Store CENTRAL SQUARE Central space with sitting, bars & restaurants, services, and with all shops around LUXURY AREA* Last Minute Last Minute Boarding Ambition in Interior Design : To offer to our passengers The last Parisian shopping experience THE DEPARTMENT STORE THE PARISIAN SQUARE THE AVENUE * According to traffic type 2012 Investor Day 34 Résultats semestriels


36 Last openings: Orly Ouest, December 2011 The "Petite Madeleine": 5 units dedicated to Paris Art de vivre Concept : gourmet food invades the terminal, like a "Petite Madeleine" square, at the centre-piece of the terminal 5 gourmet food shops & restaurants, bringing together the most prestigious players 4 airport exclusive brands out of 5 Exceptional results : Nespresso : n 1 ADP landside unit Ladurée : n 2 ADP landside unit Concourse 2 («La Navette») Base 100 = ADP in Landside Shops & Restaurants Sales per sqm Petite Madeleine Orly Ouest ADP 2012 Investor Day 35 Résultats semestriels


37 Last openings: Orly Ouest, December 2011 The "Petite Madeleine": 5 units dedicated to Paris Art de vivre 2012 Investor Day 36 Résultats semestriels


38 Paris-Charles de Gaulle openings The A/C Junction The Satellite 4 of the Terminal 2E 2012 Investor Day 37 Résultats semestriels
39 Last openings: The A/C Junction, March 2012 General overview Opened March 2012 New building joining Terminals 2A + 2C Immigration + Security on the ground floor Retail on the first floor 2012 Investor Day 38 Résultats semestriels
 : the traditional Parisian department store dedicated to Perfume &")

40 Last openings: The A/C Junction, March 2012 Retail Layout Concept: to offer a last Parisian shopping experience through two iconic moments of the Parisian life : The Department store (1,300 sqm) : the traditional Parisian department store dedicated to Perfume & Cosmetics and French Art de Vivre To Terminal 2A Boarding gates The Avenue To Terminal 2C Boarding gates The Avenue : high end luxury street + Prunier & Caviar House seafood bars The Department Store 2,300 sqm of shops, bars & restaurants 2012 Investor Day 39 Résultats semestriels


41 Last openings: The A/C Junction, March 2012 The Department Store "Buy Paris Duty Free": 1,300 sqm as a walkthrough 2012 Investor Day 40 Résultats semestriels


42 Last openings: The A/C Junction, March 2012 The Avenue: 12 Boutiques and 2 Prunier & Caviar House Seafood Bars 2012 Investor Day 41 Résultats semestriels


43 Next opening: Satellite 4, 28 June 2012 General overview Opening 28 June M passenger capacity Dedicated to Skyteam long haul flights 2012 Investor Day 42 Résultats semestriels

44 Next opening: Satellite 4, 28 June 2012 Space planning Concept: to offer a last Parisian shopping experience through three iconic moments of the Parisian life: The Department store (2,200 sqm): the traditional Parisian department store dedicated to Perfume & Cosmetics and French Art de Vivre The parisian Square: the traditional Parisian square with its cafés and terraces, and shops all around The Avenue: high end luxury street + cultural experience The Department store The parisian Square 6,000 sqm of shops, bars & restaurants The Avenue 2012 Investor Day 43 Résultats semestriels

45 Next opening: Satellite 4, 28 June 2012 The Parisian Square: a Central Living zone 2012 Investor Day 44 Résultats semestriels


46 Next opening: Satellite 4, 28 June 2012 The Avenue: 15 Boutiques, 2 restaurants, a Spa and a Museum Espace Musées 2012 Investor Day 45 Résultats semestriels
47 A very intensive implementation since October 2010 Main achievements 101 new shops and Bars & Restaurants 33 Fashion & Accessories shops 22 Beauty and Arts de Vivre shops 13 Press & Books & Souvenirs shops 33 Bars & Restaurants 16,400 sqm of additional or refurbished space 12 new Brands in our portfolio 3 new retail concepts with our JVs A totally new advertising offer with 400 digital screens 2012 Investor Day 46 Résultats semestriels
48 Our ambition : To become the referent for Travel Retail in Europe While offering the Last Parisian shopping experience A unique positioning: Paris, capitale de la Creation, based on 3 key lines : Perfume & Cosmetics, Luxury Fashion & Accessories, Gastronomy A new and optimized retail layout, and an ambitious design While creating awareness among our passengers before their arrival at the ' airport While implementing an optimized business model 2012 Investor Day 47 Résultats semestriels


49 Retail revenues driven by high potential nationalities The importance of the BRICs, and specifically China and Russia Russia 78.0 x 5.2 USA 18.0 x 1.2 S. Korea-Japan 47.6 x 3.2 China 86.5 x 5.7 Brazil 33.6 x 2.2 Sales/pax 2011 Relation to average Sales/pax In 2011, BRIC destinations represented 4.3% of traffic 16.5% of sales * 31.4% of growth * * In restricted area 2012 Investor Day 48 Résultats semestriels
50 Retail revenues driven by high potential nationalities A unique advantage: a very strong Downtown market Paris, 1 st tourist destination worldwide, and Europe capital of shopping A hard competition between Downtown and Airport Retail Paris, by far the Top touristic destination for shopping in Europe, particularly for some key nationalities (China, Russia, Japan ) A fast growing Duty Free market downtown Paris (+26%), boosted by tourists from the BRICs: Total Duty Free* China Paris Russia 11 Japan United States 7 5 Brazil 4 London Rome Francfort The Department stores are our main competitors: Total Sales (Duty Free + Duty Paid) Base 100 = ADP ADP Printemps Haussmann 161 Galeries Lafayette Haussmann An ambition to conquer market shares vs downtown retail through a new communication strategy * Source Global Blue + ADP estimates Base 100 = Total Paris 2012 Investor Day 49 Résultats semestriels


51 A hard competition between Downtown and Airport Retail B to B and B to C communication to conquer market shares vs Downtown A tourist oriented message A commitment: "Visit Paris at your ease and do your shopping at the airport, where you will find the best that Paris has to offer at Duty-Free prices without any tax formalities" A target: create a Duty Free reflex at the airport to conquer market shares vs downtown Targeted and recurrent communication Communication targeted towards most contributive nationalities with a luxury message A message delivered throughout the journey: upstream communication in partnership with travel agencies and airlines, web site Paris Lifestyle, baggage collection, taxis, hotels 2012 Investor Day 50 Résultats semestriels
52 Our ambition : To become the referent for Travel Retail in Europe While offering the Last Parisian shopping experience A unique positioning: Paris, capitale de la Creation, based on 3 key lines : Perfume & Cosmetics, Luxury Fashion & Accessories, Gastronomy A new and optimized retail layout, and an ambitious design While creating awareness among our passengers before their arrival at the airport While implementing an optimized business ' model 2012 Investor Day 51 Résultats semestriels


53 A constant optimisation of the Business Model SHOPS AND ADVERTISING JVs on strategic activities A 50/50 JV with the best operator in the sector A joint governance + Specialized multibrand stores on activities with strong technicality The best operator downtown BARS & RESTAURANTS Competition within operators Only on leader franchises A strong incentive to deliver quality + Brands directly managed on most complex formats + Luxury brands directly managed 2012 Investor Day 52 Résultats semestriels


54 26,800 sqm managed by our Joint Ventures Advertising Media Aéroports de Paris 50/50 partnership with JC Decaux Larger and more qualitative billboards Design by Patrick Jouin Press & book, Souvenir 50/50 partnership with Lagardère Services New and renewed outlets New Souvenir activity «Air de Paris» 57 shops Core Business & Fashion SDA 50/50 partnership with Aelia (Lagardère Services) Integration of Fashion shops inside SDA beginning of shops 2012 Investor Day 53 Résultats semestriels
55 More ambitious targets for 2015 in sales / pax Increase in duty free area by 35%, in line with the 2010 forecast despite the new timing of the 2B project In 000 of sqm* ,9 22,8 5,3 3,9 17,8 56,0 22,8 58,8 24,0 4,9 4,7 5,9 6,1 22,3 24,0 +18% +35% 19,0 in 2015: a more ambitious target for sales/pax compared to 2010 guidance Sales / Pax** ( ) ,4 14,1 15,1 19,0 17,4 +53% +40% Duty Free shops Duty Paid shops Bars and restaurants Landside shops New guidance Previous guidance * All Surfaces have been restated to include pharmacies. Impact of 700 sqm in 2009 and 800 sqm in 2013 onwards ** Sales of shops in restricted areas / departing passengers 2012 Investor Day 54 Résultats semestriels


56 Aéroports de Paris Investor Day 27 June 2012 September 2011
 Real GDP Growth 12 10 8 6 4 2 0-2 -4-6 0-14 15-29 30-44 45-59 60-74 75-90+ 2nd largest country")

57 Turkey has strong economic fundamentals Turkey has a very young population Turkish Macroeconomic Indicators 25% 25% 23% 16% 8% 3% GDP per Capita ('000 USD PPP) Real GDP Growth nd largest country in Europe in terms of population: 75m (1) c. 75% of population under 45 years old Istanbul Atatürk Airport: A Natural Hub Fastest growing country in OECD Burgeoning middle-class The New Silk (air) Road (2) (1) Turkstat New emerging countries routes since 2007 (2) Source: anna.aero 56
58 Turkey Fastest Growing Aviation Market in Europe The resilient Turkish aviation market is set to continue to grow rapidly in the next few years Comments Propensity to Fly The Turkish aviation market has historically showed strong growth and resilience Penetration is still low (propensity to fly, 4.7 in USA, 2.2 in France, 1.6 in Turkey) Limited alternative transport infrastructure in a very large country Transportation junction between Europe, North Africa and Asia Young population, average age is 31 years (versus Spain 41 years, and UK 39 years) and 50% of its population is currently younger than 29 years Visa policies are currently changing with more countries having eliminated or simplified the visa process with Turkey From 2000 to 2009, Turkey was the fastest growing tourist country in the world. As a result, Turkey is now the 7th largest tourist destination in the world Turkey has a number of attractive tourist destinations, e.g. Antalya, Istanbul (largest business centre in the region), Mugla (Bodrum and Dalaman) and Izmir Traffic outlook Propensity to fly 1.5 mn USA 314 mn 5.3 bn WORLD 7 bn 118 mn TURKEY 75 mn Passenger Number Population World 4.2% pax 5.1% CAGR in RPK World 4.8% RPK World 4.7% CAGR in RPK FRANCE CHINA 143 mn mn 620 mn 1.4 bn Turkey 11% CAGR in Passengers MACEDONIA Source: CY10 ACAIS, wikipedia, anna.aero, airportwatch.org 730K 2.1 mn

59 Air Traffic 58
60


61 Image Film of TAV Group 67
62 TAV Group Structure TAV Airports Holding TAV Construction Airport Companies Atatürk Airport (100%) Esenboga Airport (100%) A Menderes Airport (100%) Service Companies ATÜ (50%) BTA (67%) HAVAŞ (65%) Qatar Doha Oman - Muscat Libya - Tripoli Gazipaşa Airport (100%) Madinah Airport (33%) Monastir & Enfidha (67%) Tbilisi & Batumi (76%) Skopje & Ohrid (100%) TAV Latvia (100%) TAV O&M (100%) TAV IT (99%) TAV Security (100%) TGS (50%) HAVAŞ Europe (67%) Turkey - Đzmir K.S.Arabia- Madinah Abu Dhabi- Midfield K.S. Arabia Jeddah (Hangar) 68
, Gazipasa Airport (100%) Georgia Tbilisi and Batumi Airports (76%) Tunisia Monastir and Enfidha Airports (67%) Macedonia Skopje and Ohrid")
 Operating in Turkey, Georgia, Tunisia, Macedonia and Latvia BTA (67%) Operating in Turkey, Georgia, Macedonia, andtunisia Operates Istanbul")
 is the F&B operator of Istanbul Deniz Otobusleri (IDO) HAVAŞ (65%) Major ground")
 share Operates in 22 airports in Turkey including Istanbul, Ankara, Izmir and Antalya TGS (%50) operates in Istanbul (AHL&SGA), Ankara, Izmir, Antalya and")
: Airport IT services TAV Security (100%): Security service provider in Istanbul, Ankara, Izmir")
63 TAV Airports Overview Airports Duty Free Food and Beverage Ground Handling Others Turkey Istanbul Ataturk Airport (100%), Ankara Esenboğa Airport (100%), Izmir Adnan Menderes Airport (100%), Gazipasa Airport (100%) Georgia Tbilisi and Batumi Airports (76%) Tunisia Monastir and Enfidha Airports (67%) Macedonia Skopje and Ohrid Airports (100%) Saudi Arabia Medinah Airport (33%) ATÜ (50%) Largest duty free operator in Turkey Partner with Unifree owned by Heinemann, leading German travel retailer (Travel Value) Operating in Turkey, Georgia, Tunisia, Macedonia and Latvia BTA (67%) Operating in Turkey, Georgia, Macedonia, andtunisia Operates Istanbul Airport Hotel (131 rooms) Total seating capacity of at 146 points Bakery & pastry factory serving in Turkey BTA Denizyollari (50%) is the F&B operator of Istanbul Deniz Otobusleri (IDO) HAVAŞ (65%) Major ground handler in Turkey with a c.65% (1) share Operates in 22 airports in Turkey including Istanbul, Ankara, Izmir and Antalya TGS (%50) operates in Istanbul (AHL&SGA), Ankara, Izmir, Antalya and Adana %67 partner of North Hub Services (HAVAS Europe), operating in Riga, Helsinki Stockholm and Germany O&M, IT and Security TAV O&M (100%): Commercial area allocations & lounges, travel agency services, TAV Passport TAV IT (99%): Airport IT services TAV Security (100%): Security service provider in Istanbul, Ankara, Izmir and Gazipasa TAV Latvia (100%): Commercial area management in Riga Airport Revenues 1Q12 (2) 123m 101m 24m 39m 15m Notes: (1) Based on number of flights for 2011 (2) Revenuss represent the proportional interest of these companies in TAV Airports (50% of ATÜ revenues) (before eliminations) 69
64 Strong Growing Presence in the Broader Region TAV is the leading airport operator in the region (41% market share (*) in Turkey) and its airports/terminals handling 53m passengers in 2011 Asset overview / catchment area No.1 Airport operator in Turkey TAV operates in Turkey s 3 largest cities Batumi 2011 PAX (in millions) Enfidha Istanbul Tbilisi Ankara Gazipaşa 37.5 Skopje Izmir 25.1 AHL Antalya Monastir Ohrid Medinah SAW Ankara Izmir TAV operates in Turkey s 3 largest cities Since IPO TAV has expanded into the broader region, winning concessions and/or BOTs in Tunisia, Macedonia, Turkey (Gazipaşa), Georgia (Batumi) and most recently Saudi Arabia (Medinah) AHL Antalya SAW Ankara Izmir Source: DHMI. * Source: DHMI. 70
65 Concession Overview Airport Type/Expire TAV Stake Scope Istanbul Ataturk Ankara Esenboga Izmir A.Menderes Gazipasa Tbilisi Batumi Monastir&Enfidha Skopje & Ohrid Medinah Lease (Jan. 2021) BOT (May 2023) BOT+Concession (Dec. 2032) Lease (May 2034) BOT (Feb. 2027) 2011 Pax(mppa) 100% Terminal 37.5 fee/pax Int'l US$ (Transfer) fee/pax dom. 100% Terminal % Terminal Volume Guarantee 3 No 0,6 M. Dom., 0,75 Int'l for 2007+%5 p.a 1.0m Int l for %3 p.a. Concession Fee Net Debt (1) $140m/yr + VAT 186m - 102m 29m starting from 2013 (6) - 100% Airport - 5 TL4 No $ VAT (5) 18m 76% Airport 1.06 US$22 US$6 No - 13m BOT (Aug. 2027) 76% Airport 0.13 US$12 US$7 No - - BOT+Concession 11-26% of 67% Airport No revenues from 362m (May 2047) 2010 to 2047 BOT+Concession (March 2030) BTO+Concession (2037) 100% Airport in Skopje, 16.2 in Ohrid - No 15% of the gross annual turnover (2) 33% Airport 3.3 SAR 80 (3) - No 54.5%(4) - 59m 1) As of 31 March ) The concession fee is going to be 15% of the gross annual turnover until the number of passengers using the two airports reaches 1 million, and when the number of passengers exceeds 1 million, this percentage shall change between 4% and 2% depending on the number of passengers 3) SAR 80 from both departing and arriving international pax. Pax charge will be increase as per cumulative CPI in Saudi Arabia every three years 4) The concession charge will be reduced to 27.3 % for the first two years that follow the completion of the construction. 5) TAV Gazipaşa shall make a yearly rent payent of US$ 50,000 + VAT as a fixed amount, until the end of the operation period; as well as a share of 65% of the net profit to the DHMI. 6) Cash Basis 71


 40.3% (1) 26.1% (6) 38% (1) 8.1% (2) 8.1% (3) 2.0% (4) 3.5% (4) 3.5% (3) 4.0% (2) 26.1% (5) 40.3% 1. Tepe Insaat Sanayi A.Ş.")

66 Aeroports de Paris acquired 38% of TAV Airports ADP acquired 38% of TAV Havalimanlari Holding: total consideration of USD 874mm (TRL 11.3 per share) Senior management team of TAV to remain in place and committed to the business post-transaction and reinforced by a new member from ADP as Deputy CEO Board structure is 3 Tepe&Akfen, 3 ADP, CEO and 4 independents. (Formerly 3 Tepe, 3 Akfen, CEO, 2 independents) Pre-Transaction Shareholder Structure Post-Transaction Shareholder Structure(*) (5) 40.3% (1) 26.1% (6) 38% (1) 8.1% (2) 8.1% (3) 2.0% (4) 3.5% (4) 3.5% (3) 4.0% (2) 26.1% (5) 40.3% 1. Tepe Insaat Sanayi A.Ş. Turkish integrated conglomerate focused on infrastructure and construction 2. Akfen Holding A.Ş. Holding company operating in the infrastructure, construction, seaport, REIT and energy sector 3. Sera Yapi Endustrisi A.Ş. Focused on construction in Turkey & MENA region 4. Other Non-floating 5. Free Float 6. Aeroports De Paris Internationally acclaimed airport operating company with global operations 72
67 TAV Traffic Performance May January-May Passengers (1) Chg % Chg % 2010 FY 2011 FY Chg % Ataturk Airport % % % International % % % Domestic % % % Esenboga Airport (2) % % % International % % % Domestic % % % Izmir Airport % % % International % % % Domestic (3) (4) % % % Tunisia % % % Georgia % % % Macedonia % % % TAV TOTAL (4) % % % International % % % Domestic % % % May January-May Air Traffic Movements (8) Chg % Chg % 2010 FY 2011 FY Chg % Ataturk Airport % % % International % % % Domestic % % % Esenboga Airport (2) % % % International % % % Domestic % % % Izmir Airport % % % International % % % Domestic (3) (4) % % % Tunisia % % % Georgia % % % Macedonia % % % TAV TOTAL (4) % % % International % % % Domestic % % % Total passengers reached 25m in 5M 2012 with 34% increase Istanbul International passengers reached 10,9m in 5M 2012 with 25% increase Like for like growth 19% in 5M Source: Turkish State Airports Authority (DHMI), Georgian Authority, TAV Tunisie, TAV Macedonia Note: DHMĐ figures for April 2012 are tentative. (1) Both departing and arriving passengers, including transfer pax (2) Commercial flights only (3) TAV started to serve domestic passengers at Izmir Airport on January 2012 (4) 2011 totals do not include Izmir domestic traffic data 73
68 Financial Overview (in mn, unless stated otherwise)* 1Q 2012 y-o-y 2011 y-o-y Revenues % % EBITDA % % EBITDA margin (%) 22.2% 2.4 ppt 29.2% 2.2 ppt EBITDAR % % Net Income 12.0 n.m % Cash flow from operations (56) n.m % Capex (5) n.m. (106) -11% Free Cash Flow (61) n.m % Shareholders Equity % 475 9% Net Debt 907-1% 792-4% Average number of employees 20,231 7% 19,838 13% Number of passengers (mn) % % - International % % - Domestic % % 74
69 Growth Rates of TAV Airports in 6 years Passenger EBITDA CAGR ( ) 18% CAGR ( ) 55% Revenue Number of Employees CAGR ( ) 17% CAGR ( ) 19%
70 New Project Wins Operations Right IZMIR Izmir Airport International Terminal, CIP, Domestic Terminal and the auxiliary structures Concession Expiry TAV Stake 100% 33% New Terminal Pax Fees Volume Guarantee Concession Rent 250mn Izmir and Medinah tenders MEDINAH Prince Mohammed Bin Abdulaziz Airport structures $1bn Start: 2012 Expected Start: H12012 Total Area Increase: sqm Total terminal capacity will to sqm Increase from 4mn to 8mn 15 per international pax and SAR 80 from international pax. 3 per domestic No volume guarantee, except for existing international terminal No volume guarantee guarantee valid until January 2015 Total concession rent for entire operating period (until 2032) 610mn (excluding VAT) Concession fee payment schedule: 2% at the signature date ( 12m) ; 3% to be paid 3 months from contract signing date ( 18mn) ; First instalment to be paid on 1 January 2013 ( 29mn) and afterwards annually on first business day of each year. Total concession rent for entire operating period (until 2037): 54.5% of total revenues will be paid. The concession charge reduced to 27.3 % for the first two years that follow the completion of the construction. BTA recent win: IDO BTA awarded F&B operations of Đstanbul Deniz Otobüsleri AS (IDO, with c50m pax) and formed a JV with TASS (operator of IDO) BTA gradually took over the current F&B sales points in since September 2011 BTA will serve at 82 outlets in 21 Terminals, 17 Vehicle Ferries and 8 Fast Ferries, comprising; 50 BTA Owned and operated Sales Points 7 International Fast Food Restaurant (Mc Donald's) 22 International Coffee Shop Chain (Nero) 3 Other Tenants 76
71 Appendix
72 Investment Highlights Attractive market with strong growth prospects Turkey is the fastest growing aviation market in Europe Passenger growth of 15% p.a. during Projected passenger growth of 11% p.a. during (1) Access to fast growing MENA region Istanbul is the most efficient hub for Europe, MENA Region (2) Leading airport operator with diversified portfolio Diversified, balanced portfolio with leading market positions #1 airport terminal operator in Turkey 12 airports operating in Turkey, Georgia, Tunisia, Macedonia, Saudi Arabia and Latvia (large catchment areas) Strong financial performance and cash flow generation Strong momentum with EBITDA posting 55% CAGR between 2006 and 2011 High earnings visibility given clear / agreed regulatory framework Proven track record of growth and profitability with attractive organic growth prospects High financial returns and cash flow generation given fixed cost base (operational leverage) and minimal ongoing capex Platform play Well-positioned to benefit from further organic and inorganic growth (1) Source: Turkey s Ministry of Transport (2) Determining Hub Efficiency in Europe, MIiddle East and North Afirca a comparative study, E. Nur Günay, Şükrü Nenem 71
73 Growth of the Turkish Aviation Market Pax, Mn CAGR ( ) 15% Domestic Intl'l total Number of Aircraft in Turkey Deregulation of the domestic market in nd largest country in Europe in terms of population: 75m (1) In 2010, foreign visitors reached 31m (2) Limited alternative transport infrastructure Aircraft number in Turkey expected to reach 750 in 2023 (3) Source: DHMI, (1)Turkstat, (2)Ministry Culture and Tourism, (3)Ministry of Transport 72


74 Tourism Tourist Arrivals increased by 10% in 2011 International Tourist Arrivals by Country + 10% Turkey # 7 Countries Chg 2009 Germany 4,8 4,4 10% 4,5 Russia 3,5 3,1 12% 2,7 UK 2,6 2,7-3% 2,4 Iran 1,9 1,9 0% 1,4 Bulgaria 1,5 1,4 4% 1,4 Georgia 1,2 1,1 14% 1,0 Netherlands 1,2 1,1 4% 1,1 France 1,1 0,9 23% 0,9 Syria 1,0 0,9 8% 0,5 U.S.A 0,8 0,6 18% 0,7 Other 12,0 10,5 14% 10,5 TOTAL 31,5 28,6 10% 27,1 Source : Ministry of Culture and Tourism Countries /09 1-France 77, ,9 80,9 79,2 76,8 76,8 0 2-USA 51,2 49, ,9 55,0 59,7 8,7 3-China 31,2 46,8 49,9 54,7 53,0 50,9 55,7 9,4 4-Spain 46,4 55, ,7 57,2 52,2 52,7 1,0 5-Italy 41,2 36,5 41,1 43,7 42,7 43,2 43,6 0,9 6-UK 23, ,7 30,9 30,1 28,2 28,1-0,2 7-Turkey 9,6 20,3 18,9 22,2 25,0 25,5 27,0 5,9 8-Germany 19 21,5 23,6 24,4 24,9 24,2 26,9 10,9 9-Malaysia 10,2 16,4 17, ,1 23,6 24,6 3,9 10-Mexico 20,6 21,9 21,4 21,4 22,6 21,5 22,4 4,4 World ,6 Source :UNWTO 73
75 TAV vs Other Airport Operators TAV Airports Counterparts SHAREHOLDER STRUCTURE No state stake No foreign ownership limit Active state participation Foreign ownership limits BUSINESS MODEL Integrated business model with service companies active in every step of the value chain Active mainly in airport/terminal management with some participation in airport services PORTFOLIO OWNERSHIP Ownership of the operational rights of the airport portfolio over a predetermined period through BOTs and concessions Mostly own the airport portfolio CAPITAL EXPENDITURE If BOT, high upfront capex with minimal or no mandatory capex throughout the operation period Regular capital expenditure with bulk investments time-to-time If lease, annual rent payment 74


76 Revenue sources Aeronautical Charges Non-aeronautical Charges Passenger Fee Ground Handling Landing Parking Fuel Duty Free F&B Car Park Istanbul X X X X X Turkey Esenboga X X X X X Izmir X X X X X Gazipasa X X X X X X X X Tunisia Georgia Macedonia Enfidha X X X X X X X X Monastir X X X X X X X X Tbilisi X X X X X X X X Batumi X X X X X X X X Skopje X X X X X X X X Ohrid X X X X X X X X Latvia Riga X X Saudi Arabia Madinah X X X X X X X X BTA started operations in Istanbul Ataturk Airport Domestic Terminal starting from July 2010 ATU will start operations in Monastir starting from July 2014 BTA will start operations in Monastir starting from
77 Earnings Visibility AERONAUTICAL NON-AERONAUTICAL Landside Agreed passenger service charge of airports / terminals depending on project Ankara and Izmir have revenue guarantees (fixed PSC and volume growth p.a.) Check-in counter, bridge Passenger & ATM growth is the main driver Duty Free Duty Free available to all international inbound and outbound passengers Increased number of shops, improved selection of products and higher penetration Airside Revenues Parking, Landing and lighting fees ATM growth is main driver Ground Handling Ramp, passenger services and traffic ATM growth and aircraft type are the main drivers Other Catering, car park, advertising, area allocation, lounge services Notes: Passenger service charges apply to departing passengers only 76
78 Revenue & EBITDA & OPEX Revenue EBITDA OPEX Duty-free Aviation Ground-handling F&B Other 16% 18% 6% 6% 22% 19% Istanbul Other Airports ATU BTA HAVAŞ Other Services 13% 12% 2% 3% 8% 7% 24% 27% Personnel Concession Rent Other Duty-free D&A Services Rendered Catering 11% 15% 9% 3% 3% 9% 7% 10% 16% 9% 24% 26% 19% 21% 33% 31% 53% 51% 34% 35%
 Combined figures, pre-eliminations.")
79 FX Exposure of Operations (2011) Revenues (1) Opex (1) (2) 56m Other; 53m Other; 5% USD; USD; 164m 6% 16% 17% 149m 349m TL; 33% 1,050m 858m EUR; 46% 481m 372m TL; 43% EUR; 33% 284m Concession Rent Expense Gross Debt 7m EUR; 5% 18m TL; 1% USD; 3% 36m 129m 1,238m USD; 95% 123m EUR; 96% 1184m (1) Combined figures, pre-eliminations. (2) Includes concession rent expenses ( 129m) and depreciation ( 65m) 78
80 Share Performance (as of June 19, 2012) Closing Price ,4 1,3 1,2 1,1 Relative Price ($) Market Cap (USD) 1.85bn Avg. DailyVol.* (USD) 4mn 1,0 0,9 0,8 0, Free Float 44% Foreign Ownership 84% 0,6 0,5 0,4 0, Effective Free Float 40% TAVHL ($) Relative to ISE-100 Share Price Performance % Weekly 1M 3M Year to Date* Since IPO TL 0% -2% 14% 2% -17% USD 3% 3% 9% 23% -14% Relative to ISE % 2% 10% 17% 13% * Jan 2012 to date 79
81 Macro Outlook Estimates Start After CAGR Georgia Real GDP Growth (%) 6,3 7,0 6,0 5,5 5,5 5,5 5,5 5, nm GDP, current prices (US $, billion) 11,6 14,3 16,0 17,3 18,5 20,2 22,3 24, ,1% GDP per capita, current prices (US $) ,8% GDP based on PPP per capita (US $) ,9% Inflation, average consumer prices 7,1 8,5 1,7 5,5 6,0 6,0 6,0 6, nm Population (million) 4,4 4,5 4,4 4,4 4,4 4,4 4,3 4, ,6% Latvia Real GDP Growth (%) -0,3 5,5 2,0 2,5 3,0 3,5 4,0 4, nm GDP, current prices (US $, billion) 24,0 28,3 27,5 28,8 30,2 31,7 33,4 35, ,0% GDP per capita, current prices (US $) ,3% GDP based on PPP per capita (US $) ,4% Inflation, average consumer prices -1,2 4,2 2,6 2,2 2,2 2,2 2,3 2, nm Population (million) 2,2 2,2 2,2 2,2 2,2 2,2 2,2 2, ,3% Macedonia Real GDP Growth (%) 1,8 3,0 2,0 3,2 4,2 4,0 4,0 4, nm GDP, current prices (US $, billion) 9,2 10,3 10,1 10,7 11,3 11,9 12,6 13, ,9% GDP per capita, current prices (US $) ,7% GDP based on PPP per capita (US $) ,4% Inflation, average consumer prices 1,5 3,9 2,0 2,0 2,0 2,0 2,0 2, nm Population (million) 2,1 2,1 2,1 2,1 2,1 2,1 2,1 2, ,2% Saudi Arabia Real GDP Growth (%) 4,6 6,8 6,0 4,1 4,4 4,3 4,3 4, nm GDP, current prices (US $, billion) 451,4 577,6 651,7 666,8 683,0 703,3 730,2 763, ,2% GDP per capita, current prices (US $) ,1% GDP based on PPP per capita (US $) ,8% Inflation, average consumer prices 5,4 5,0 4,8 4,4 4,1 4,0 4,0 4, nm Population (million) 27,6 28,2 28,8 29,4 30,0 30,6 31,3 31, ,1% Tunisia Real GDP Growth (%) 3,1-0,8 2,2 3,5 4,8 6,2 6,7 6, nm GDP, current prices (US $, billion) 44,3 46,4 46,1 47,7 50,2 53,6 57,2 61, ,7% GDP per capita, current prices (US $) ,6% GDP based on PPP per capita (US $) ,2% Inflation, average consumer prices 4,4 3,5 5,0 4,0 3,5 3,5 3,5 3, nm Population (million) 10,5 10,7 10,8 10,9 11,0 11,1 11,2 11, ,0% Turkey Real GDP Growth (%) 9,0 8,5 2,3 3,2 4,0 4,3 4,5 4, nm GDP, current prices (US $, billion) 734,6 778,1 817,3 878,0 952, , , , ,0% GDP per capita, current prices (US $) ,8% GDP based on PPP per capita (US $) ,6% Inflation, average consumer prices 8,6 6,5 10,6 7,1 5,7 5,5 5,5 5, nm Population (million) 73,0 74,0 74,9 75,8 76,7 77,6 78,5 79, ,2% Source: IMF, April


82 Contact About TAV Airports As the leading airport operator in Turkey, TAV Airports operates 12 airports: Istanbul Atatürk, Ankara Esenboga, Izmir Adnan Menderes and Antalya Gazipasa Airports in Turkey, as well as Tbilisi and Batumi Airports in Georgia, Monastir and Enfidha - Hammamet Airports in Tunisia, Skopje and Ohrid Airports Macedonia. TAV Airports also operates the duty free and commercial areas at Riga International Airport in Latvia and will also be taking over the operations of Medinah Airport, the first privatization project of Saudi Arabia in the first half of TAV Airports also operates in other areas of airport operations such as duty-free, food and beverage services, ground handling services, IT, security and operational services. The company, together with its subsidiaries, provided service to approximately 451 thousand flights and 53 million passengers in The Company s shares are listed in the Istanbul Stock Exchange since February 23, 2007, under the ticker code TAVHL IR Website ir.tav.aero ir@tav.aero Phone (x ) Twitter twitter.com/irtav Facebook facebook.com/irtav Address TAV Airports Holding Co. Istanbul Ataturk Airport International Terminal (Besides Gate A and VIP) Yesilkoy, Istanbul The Investor Relations Team Nursel İLGEN, CFA Head of Investor Relations nursel.ilgen@tav.aero Tel : / 2122 Fax : Ali Özgü CANERİ Investor Relations Assistant Manager ali.caneri@tav.aero Tel : / 2124 Fax : Besim MERİÇ Investor Relations Assistant Manager besim.meric@tav.aero Tel : / 2123 Fax :
83 Disclaimer This presentation does not constitute an offer to sell or the solicitation of an offer to buy or acquire any shares of TAV Havalimanlari Holding A.Ş. (the "Company") in any jurisdiction or an inducement to enter into investment activity. No information set out in this document or referred to in such other written or oral information will form the basis of any contract. The information used in preparing these materials was obtained from or through the Company or the Company s representatives or from public sources. No reliance may be placed for any purposes whatsoever on the information contained in this presentation or on its accuracy, completeness or fairness. The information in this presentation is subject to verification, completion and change. While the information herein has been prepared in good faith, no representation or warranty, express or implied, is or will be made and no responsibility or liability is or will be accepted by the Company or any of its group undertakings, employees or agents as to or in relation to the accuracy, completeness or fairness of the information contained in this presentation or any other written or oral information made available to any interested party or its advisers and any such liability is expressly disclaimed. This disclaimer will not exclude any liability for, or remedy in respect of fraudulent misrepresentation by the Company. This presentation contains forward-looking statements. These statements, which may contain the words anticipate, believe, intend, estimate, expect and words of similar meaning, reflect the Company s beliefs, opinions and expectations and, particularly where such statements relate to possible or assumed future financial or other performance of the Company, are subject to risks and uncertainties that may cause actual results to differ materially. These risks and uncertainties include, among other factors, changing business or other market conditions and the prospects for growth anticipated by the management of the Company. These and other factors could adversely affect the outcome and financial effects of the plans and events described herein. These forward-looking statements speak only as at the date of this presentation. The Company expressly disclaim any obligation or undertaking to disseminate any updates or revisions to any forward-looking statements contained herein to reflect any change in the Company s expectations with regard thereto or any change in events, conditions or circumstances on which any such statement is based. Past performance cannot be relied upon as a guide to future performance. As a result, you are cautioned not to place reliance on such forward-looking statements. Information in this presentation was prepared as of 22 June
TAV AIRPORTS. Management Presentation January September 2011
 1 TAV AIRPORTS Management Presentation January 2012 September 2011 2 Contents Page Operational and Financial Highlights 1 Appendix 26 TAV Airports Holding Co. 3 Airport Companies Atatürk Airport (100%)
Q REVENUE 2 MAY 2016
 Q1 2016 REVENUE 2 MAY 2016 Q1 2016 HIGHLIGHTS Traffic recovery Good performance of Bars and Restaurants Slowdown of sales/pax Passengers traffic resilience: +3.7% for Groupe ADP +1.9% for Paris Aéroport
TAV. A Global Brand in Airport Operations & Construction
 TAV A Global Brand in Airport Operations & Construction TAV: A Global Brand in Airport Operations & Construction We aim to deliver world-class airport services with the mission of creating the highest
TAV. A Global Brand in Airport Operations & Construction
 TAV A Global Brand in Airport Operations & Construction TAV: A Global Brand in Airport Operations & Construction We aim to deliver world-class airport services with the mission of creating the highest
İzmir Adnan Menderes Airport
 ADB İzmir Adnan Menderes Airport IZMIR S BACKGROUND 4.1 million people reside in Izmir and it is the 3rd most populous city in Turkey. Also referred as the Pearl of the Aegean, Izmir is a tourist destination
MONTH REVENUE
 2016 9-MONTH REVENUE 8 November 2016 HIGHLIGHTS Freezing of tariffs increase in 2016 as concluded in 2016-2020 ERA Paris Aéroport traffic: +0.9% ; Groupe ADP traffic: +1.5% Aviation Traffic in Paris-Orly:
Aéroports de Paris 9M 2012 revenue up by 4.9%
 Paris, 15 November 2012 Aéroports de Paris 9M 2012 revenue up by 4.9% Financial information as of 30 September 2012 1 Moderate traffic growth in Paris for the first 9 months of the year: +1.3% Positive
Aviation Workshop F. Goldnadel COO and Managing Director of Paris-CDG airport F. Mereyde Director of Paris-Orly airport
 Aviation Workshop 2016-2020 F. Goldnadel COO and Managing Director of Paris-CDG airport F. Mereyde Director of Paris-Orly airport A successful airport system... optimised and more competitive Investors
9-month 2015 Revenue 3 November 2015
 9-month 2015 Revenue 3 November 2015 Q3 2015 Highlights Traffic Very good trend in summer traffic and favourable base effect in Paris: +3.9% at end of September 2015 Refining of 2015 traffic growth assumption:
TAV Airports Holding Management Presentation. 12 November 2008
 TAV Airports Holding Management Presentation 12 November 2008 TAV Airports Overview Page 1 TAV Airports Operations 6 TAV Airports Financial Overview 17 Conclusion 24 TAV Airports Overview Airports Duty
Tbilisi. Airport. Batumi. Airport
 TBS BUS Tbilisi Airport Batumi Airport TBILISI & BATUMI S BACKGROUND TBS, located in the capital city Tbilisi; and BUS, located in the city of Batumi on the Black Sea coast in the south west of Georgia,
TAV Airports Holding Management Presentation. January 2009
 TAV Airports Holding Management Presentation January 2009 TAV Airports Overview Page 1 TAV Airports Operations 10 TAV Airports Financial Overview 21 Conclusion 28 TAV Airports Overview Airports Duty Free
Gazipasa - Alanya Airport
 GZP Gazipasa - Alanya Airport ALANYA S BACKGROUND Gazipasa-Alanya International Airport (GZP) is the second airport of the city of Antalya, which welcomed about 6 million foreign visitors in 2016. About
Milas - Bodrum Airport
 BJV Milas - Bodrum Airport BODRUM S BACKGROUND Milas Bodrum International Airport (BJV) serves to Bodrum and its vicinity, which is one of the most popular tourism destinations in Turkey. Bodrum welcomes
Information meeting. Third quarter results. March 2011
 Information meeting Third quarter 2010-11 results 1 March 2011 Agenda 2010-11: recovery in activity and return to profitability Current issues Air France-KLM ambitions for the next three years 2 All businesses
Parques Reunidos Corporate Presentation March 2016
 Parques Reunidos Corporate Presentation March 216 Disclaimer The information contained in this presentation (the Presentation ), including but not limited to forward-looking statements, is provided as
TAV AIRPORTS HOLDING. November 2011
 TAV AIRPORTS HOLDING November 2011 September 2011 2 Contents Page Operational and Financial Highlights 1 Appendix 20 TAV Airports Holding Co. 3 Airport Companies Atatürk Airport (100%) Esenboga Airport
GATWICK AIRPORT JOINS VINCI AIRPORTS December 2018
 GATWICK AIRPORT JOINS VINCI AIRPORTS December 2018 Asset presentation Gatwick is the 2 nd largest airport in the UK and the 8 th busiest in Europe with 46 mpax Key features 46 mpaxin FY18, in the wealthiest
TAV AIRPORTS. Management Presentation February September 2011
 1 TAV AIRPORTS Management Presentation February 2012 September 2011 2 Contents Page Operational and Financial Highlights 1 Appendix 21 TAV Airports Holding Co. 3 Airport Companies Atatürk Airport (100%)
2012 Result. Mika Vehviläinen CEO
 2012 Result Mika Vehviläinen CEO 1 Agenda Market environment in Q4 Business performance and strategy execution Outlook Financials 2 Market Environment According to IATA, Global air travel continues to
TAV Airports Holding Analyst Day
 TAV Airports Holding Analyst Day Istanbul, August 10, 2010 0 Page Overview 1 Financial Overview 19 Operations 29 Conclusion 50 1 TAV Airports Structure TAV Airports Holding Co. Airport Companies Service
Analyst Presentation Schiphol Group 2006 Interim Financial Results
 Analyst Presentation Schiphol Group 2006 Interim Financial Results 24 August 2006 Interim Results Disclaimer This release may contain certain forward-looking statements with respect to the financial condition,
TAV INVESTMENT HOLDING CO.
 TAV INVESTMENT HOLDING CO. TAV is a joint-venture company of TEPE and AKFEN Construction Established in 1997 Promoting and conducting new business in airport construction, financing, passenger terminal
FINANCIAL RELEASE. Aéroports de Paris SA 2018 first quarter consolidated revenue up by 37.3%, driven by growth in traffic and international activities
 3 May 2018 Financial information as of 31 March 2018 1,2 FINANCIAL RELEASE Aéroports de Paris SA 2018 first quarter consolidated revenue up by 37.3%, driven by growth in traffic and international activities
TAV Airports Holding Management Presentation. Istanbul, July 2007
 TAV Airports Holding Management Presentation Istanbul, July 27 TAV Airports Overview and Investment Highlights TAV Airports Operations TAV Airports Financial Overview Conclusion Istanbul Atatürk Airport
Aéroports de Paris. Strong revenue growth in full-year 2007: +10.4% 1
 Paris, 14 February 2008 Aéroports de Paris Strong revenue growth in full-year 2007: +10.4% 1 Consolidated revenues rise 10.4% to 2,292.4 million Strong revenue growth throughout the year Growth far surpasses
TAV AIRPORTS HOLDING. Financial Results of February 2012
 TAV AIRPORTS HOLDING Financial Results of 2011 24 February 2012 2 CONTENTS Page # CEO s Message 3 Highlights of 2011 3 Summary Financial and Operational Results 4 Passenger Growth 5 Comparison to 2010
Q3 FY18 Business Highlights
 Q3 FY18 RESULTS Q3 FY18 Business Highlights 1 2 3 4 5 6 7 Record passengers 7.1m, record revenues 423m Investing in growth 24% passenger growth in Q3 Disciplined cost management flat ex-fuel CASK Largest
TAV Airports Holding 9M07 Financial Results. 30 November 2007
 TAV Airports Holding 9M07 Financial Results 30 November 2007 0 TAV Airports Business Overview TAV Airports Operations TAV Airports Financial Overview Conclusion Istanbul Atatürk Airport 1 TAV Airports
TUI GROUP INVESTOR PRESENTATION
 TUI GROUP INVESTOR PRESENTATION German Investment Conference UniCredit / Kepler Munich, 26-27 September 2012 Future-related statements This presentation contains a number of statements related to the future
FINANCIAL RELEASE. 30 July 2018
 30 July 2018 FINANCIAL RELEASE Aéroports de Paris SA 2018 half-year results driven by good performance of all the activities and group's international development 2018 half-year results 1 Groupe ADP traffic's
Aéroports de Paris Consolidated revenue up 4.7% over the first 9 months of 2013
 15 November 2013 Aéroports de Paris Consolidated revenue up 4.7% over the first 9 months of 2013 Financial information as of 30 September 2013 1 Paris airports passenger traffic: +1.1% to 69 million passengers
Thank you for participating in the financial results for fiscal 2014.
 Thank you for participating in the financial results for fiscal 2014. ANA HOLDINGS strongly believes that safety is the most important principle of our air transportation business. The expansion of slots
Air China Limited Annual Results. March Under IFRS
 Air China Limited 21 Annual Results Under IFRS March 211 Agenda Part 1 Highlights Part 2 Business Overview Part 3 Financial Overview Part 4 Outlook 2 Part 1 Highlights Steady Economic Growth; Asia Pacific
Wizz Air aims to increase market share with F17 capacity growth of 20% Q3 passenger growth of 20%, Load Factor of 88% (+2.3ppt)
") Q3 F17 FINANCIAL RESULTS 1 FEBRUARY 2017 BUSINESS HIGHLIGHTS Current market conditions favour ULCCs Wizz Air aims to increase market share with F17 capacity growth of 20% Q3 passenger growth of 20%, Load
Q3 F17 FINANCIAL RESULTS 1 FEBRUARY 2017 BUSINESS HIGHLIGHTS Current market conditions favour ULCCs Wizz Air aims to increase market share with F17 capacity growth of 20% Q3 passenger growth of 20%, Load
Schiphol Group. Annual Report
 Schiphol Group Annual Report 2013 Business model Business model Schiphol Group distinguishes four core activities: Aviation, Consumer Products and Services, Real Estate, and Alliances and Participations.
ANA HOLDINGS Financial Results for the Three Months Ended June 30, 2018
 ANA HOLDINGS NEWS ANA HOLDINGS Financial Results for the Three Months Ended June 30, 2018 TOKYO, July 31, 2018 ANA HOLDINGS INC. (hereinafter ANA HD ) today reports its financial results for the three
Aéroports de Paris Q consolidated revenue up by 4.0% driven by aviation and retail activities dynamism
 Financial release 5 May 05 Aéroports de Paris Q 05 consolidated revenue up by 4.0% driven by aviation and retail activities dynamism Financial Information as of 3 March 05 : Paris airports passenger traffic:
Air Berlin PLC AGM 06 June 2013 London
 Air Berlin PLC AGM 06 June 2013 London airberlin a strong European carrier Market position as of 31 December 2012 No. 2 in core market: Germany / Austria / Switzerland No. 7 in Europe with 33.3 m guests
9M 2014 Revenue 13 November 2014
 9M 2014 Revenue 13 November 2014 9M Key Highlights 3 rd quarter Passenger traffic Retail AF pilots strike Revenue from security Good underlying traffic trend Recovery during the summer thanks to the marketing
Information meeting. 1 st September 2011
 Information meeting 1 st September 2011 Full Year 2010-11 key data April 2010-March 2011 Revenues in billions Operating result in millions 77% Passenger 18.10 +11.3% -44 +874 13% Cargo 3.16 +29.5% +69
TAV AIRPORTS HOLDING January 2011
 TAV AIRPORTS HOLDING January 2011 2 Page Overview 1 Financial Overview 23 Operations 33 Conclusion 54 3 TAV Airports Holding Co. Airport Companies Service Companies Ataturk Airport (100%) ATÜ (50%) Esenboga
Santander 22 nd Annual Latin American Conference. Cancun, January 2018
 Santander 22 nd Annual Latin American Conference Cancun, January 2018 This presentation may include forward-looking comments regarding the Company s business outlook and anticipated financial and operating
Analyst and Investor Conference Call Q Ulrik Svensson, CFO and Member of the Executive Board
 Analyst and Investor Conference Call Q2 2017 Ulrik Svensson, CFO and Member of the Executive Board Frankfurt, 2 August 2017 Disclaimer The information herein is based on publicly available information.
Investment Highlights
 Third Quarter 2014 Investment Highlights 1 Mexican airport portfolio positioned to take full advantage of global growth. 2 Diversified business model contributing to earnings resilience. 3 Well-defined
Driving global growth
 Holiday Inn, Manhattan Financial District Driving global growth Paul Edgecliffe Johnson Group CFO IHG has a consistently executed, winning strategy for high quality growth Value creation: superior shareholder
UBS 14 th Global Emerging Markets Conference. New York, November 2016
 UBS 14 th Global Emerging Markets Conference New York, November 2016 This presentation may include forward-looking comments regarding the Company s business outlook and anticipated financial and operating
Air China Limited Interim Results. August Under IFRS
 Air China Limited 21 Interim Results Under IFRS August 21 1 Agenda 21 Interim Results Overview Business Overview Financial Overview Outlook 2 2 2 21 Interim Results 3 21 Interim Results Overview 4 4 4
Investor Presentation
 Investor Presentation ICR XChange January 17, 2008 Forward-Looking Statements Some of the statements in this presentation constitute forward-looking statements. Forward-looking statements relate to expectations,
Solid performance driven by the dynamism of traffic and group's international development
 22 February 2018 Groupe ADP 2017 full year results PRESS RELEASE Aéroports de Paris SA Solid performance driven by the dynamism of traffic and group's international development Groupe ADP traffic: +7.4%
UBS Latin American New Opportunities Conference. June 11 th -12 th, 2007
 UBS Latin American New Opportunities Conference June 11 th -12 th, 2007 Company Overview OMA operates a diversified portfolio of 13 airports distributed throughout Northern and Central Mexico and is diversified
Quarterly Interim Management Statement. Three Months to June 30, 2015
 Quarterly Interim Management Statement Three Months to June 30, 2015 BUSINESS HIGHLIGHTS FOR Q1 Record Q1 profitability despite negative Easter effect Lower unit costs further increasing our cost advantage
March 4, Investor Conference
 March 4, 2014 Investor Conference Disclaimer This Investor Presentation is provided for your general information and convenience only, is current only as of its date and does not constitute an offer to
Information meeting. Jean-Cyril Spinetta Chairman and CEO
 Information meeting Jean-Cyril Spinetta Chairman and CEO Forward-looking statements The information herein contains forward-looking statements about Air France-KLM and its business. These forward-looking
Dr. Eng. Sani Şener. TAV Airports Group President & CEO
 Dr. Eng. Sani Şener TAV Airports Group President & CEO Secret Formula: How to Structure a PPP Model Traffic Passenger Aircraft Cargo Forecasts (done by independent advisor of lenders) Commercia l Per passenger
Malaysia Airports Holdings Berhad CORPORATE PRESENTATION
 Malaysia Airports Holdings Berhad CORPORATE PRESENTATION 1 2 Table of Contents MAHB A Leap Forward Airport Revenue Transformation klia2 The Game Changer klia2 Destination Curious Integrated Complex KLIA
Information meeting. 12 September 2011
 Information meeting 12 September 2011 Full Year 2010-11 key data April 2010-March 2011 Revenues in billions Operating result in millions 77% Passenger 18.10 +11.3% -44 +874 13% Cargo 3.16 +29.5% +69 +505
Management Presentation. March 2016
 Management Presentation March 2016 Forward looking statements This presentation as well as oral statements made by officers or directors of Allegiant Travel Company, its advisors and affiliates (collectively
INVESTOR PRESENTATION. Imperial Capital Global Opportunities Conference September 2015
 INVESTOR PRESENTATION Imperial Capital Global Opportunities Conference September 2015 Forward-looking Statements This presentation contains forward-looking statements within the meaning of the Private
Information meeting. September 2011
 Information meeting September 2011 Full Year 2010-11 key data April 2010-March 2011 Revenues in billions Operating result in millions 77% Passenger 18.10 +11.3% -44 +874 13% Cargo 3.16 +29.5% +69 +505
AviAlliance The Airport Management Company
 AviAlliance The Airport Management Company Q4 / 2017 Contents AviAlliance GmbH page 3 Airport portfolio page 4 14 Athens International Airport page 5 Budapest Airport page 7 Düsseldorf Airport page 9 Hamburg
Stable EBITDA in H and 2015 targets maintained
 Paris, 31 August 2012 Stable EBITDA in H1 2012 2012 and 2015 targets maintained Traffic growth of 2% 1 in H1 2012 on Parisian airports with 43 million passengers Mixed H1 results depending on segments:
Half Year F1 Results. November 4, 2015
 Half Year F1 Results November 4, 2015 F17 Q1 Results 20 JULY 2016 Q1 BUSINESS HIGHLIGHTS Passenger growth of 18% to 5.8m pax on 17% seat growth Record underlying profit of 38.6m (+14%) despite Easter effect
FIRST QUARTER
 FIRST QUARTER 2007 1 WELCOME TO REZIDOR one of the fastest growing hotel companies in the world 300 250 200 150 100 FAST TRACK GROWTH FRESH & DYNAMIC MULTI-BRAND PORTFOLIO BRAND SEGMENT HOTELS ROOMS Upscale
Slots. The benefits of strategic slot management. Richard Matthews Slot strategy & scheduling manager. 8 th March 2013
 Slots The benefits of strategic slot management Richard Matthews Slot strategy & scheduling manager 8 th March 2013 1 Strategy to drive growth and returns Leverage easyjet s cost advantage, leading market
FIRST QUARTER 2017 RESULTS. 4 May 2017
 FIRST QUARTER 2017 RESULTS 4 May 2017 A resilient start of the year, traffic up 4.2% 20.9 million passengers carried, up 5.2%, traffic (RPK) up 4.2%, capacity (ASK) up 3.3% and load factor up 0.7pts Confirmation
GATWICK AIRPORT LIMITED RESULTS FOR THE YEAR ENDED 31 MARCH 2014
 GATWICK AIRPORT LIMITED RESULTS FOR THE YEAR ENDED 31 MARCH 2014 OPERATIONAL AND FINANCIAL PERFORMANCE HIGHLIGHTS TRAFFIC GROWTH EBITDA GROWTH PROFIT FOR THE YEAR CAPITAL EXPENDITURE RAB* SENIOR NET DEBT*
INVESTOR PRESENTATION. May 2015
 INVESTOR PRESENTATION May 2015 Forward-looking Statements This presentation contains forward-looking statements within the meaning of the Private Securities Litigation Reform Act of 1995 that reflect the
IAG results presentation. Quarter One th May 2018
 IAG results presentation Quarter One 2018 4 th May 2018 Highlights Willie Walsh, Chief Executive Officer Highlights Another strong quarter performance with an operating profit of 280m (5.6% margin, +2.3pts)
Air Arabia. Investor Presentation. Sharjah, UAE: September 2013
 Air Arabia Investor Presentation Sharjah, UAE: September 2013 Disclaimer Information contained in this presentation is subject to change without notice, its accuracy is not guaranteed and it may not contain
Aéroports de Paris. Strong revenue growth in the first half of 2008: +12.3% 1
 Paris, 13 August 2008 Aéroports de Paris Strong revenue growth in the first half of 2008: +12.3% 1 Consolidated revenue rose 12.3% to 1,214 million Revenue growth far outpaced passenger traffic growth
Investor Meeting Presentation. 4 June 2014
 Investor Meeting Presentation 4 June 2014 COMPANY OVERVIEW 1Q2014 RESULTS OVERVIEW OPERATION HIGHLIGHTS Q&A 2 Founded in 1963, listed on the Singapore Exchange in 1964 Three core businesses: - Property
JAPAN OUTLOOK. 1- KANSAI deal 2-KOBE deal 4- Future projects
 JAPAN OUTLOOK 1- KANSAI deal 2-KOBE deal 4- Future projects 1. THE KANSAI DEAL Kansai Deal at a Glance Assets & Transactions Key Features Kansai Airports International - KIX Opening in 1994 and located
1 ST HALF YEAR 2017 RESULTS. 24 July h45
 1 ST HALF YEAR 2017 RESULTS 24 July 2017 17h45 AGENDA 2017 FIRST HALF YEAR HIGHLIGHTS Augustin de Romanet, Chairman and CEO 2017 FIRST HALF YEAR FINANCIAL RESULTS Philippe Pascal, CFO OUTLOOK Augustin
Investment Highlights
 Second Quarter 2014 Investment Highlights 1 Mexican airport portfolio positioned to take full advantage of global growth. 2 Diversified business model contributing to earnings resilience. 3 Well-defined
Nomura Transport conference Carolyn McCall Chief Executive
 Nomura Transport conference Carolyn McCall Chief Executive 1 06-Dec 09-Dec 12-Dec 15-Dec 18-Dec 21-Dec 24-Dec 27-Dec 30-Dec 02-Jan 05-Jan 08-Jan 11-Jan 14-Jan Challenging environment Jet price up 46% in
Parques Reunidos Expands to Australia with the Acquisition of Wet n Wild Sydney July 2018
 Parques Reunidos Expands to Australia with the Acquisition of Wet n Wild Sydney July 2018 Disclaimer This document does not constitute or form part of any purchase, sales or exchange offer, nor is it an
Copa Holdings Reports Record Earnings of US$41.8 Million for 4Q06 and US$134.2 Million for Full Year 2006
 Copa Holdings Reports Record Earnings of US$41.8 Million for 4Q06 and US$134.2 Million for Full Year 2006 Panama City, Panama --- March 7, 2007. Copa Holdings, S.A. (NYSE: CPA), parent company of Copa
Strategic Airport Management Programme April Airport Economics. presented by. Eileen Poh Assistant Director (ICAO Affairs)
") Airport Economics presented by Eileen Poh Assistant Director (ICAO Affairs) 1 Outline Regulated and non-regulated Revenues Price Cap-Regulation: Single or Dual Till Financial State of Airports Airports
Airport Economics presented by Eileen Poh Assistant Director (ICAO Affairs) 1 Outline Regulated and non-regulated Revenues Price Cap-Regulation: Single or Dual Till Financial State of Airports Airports
Heathrow (SP) Limited
 Limited") Draft v2.0 10 Feb Heathrow (SP) Limited Results for year ended 31 December 2013 24 February 2014 Strong operational and financial performance in 2013 Passenger satisfaction at record high and over 72 million
Draft v2.0 10 Feb Heathrow (SP) Limited Results for year ended 31 December 2013 24 February 2014 Strong operational and financial performance in 2013 Passenger satisfaction at record high and over 72 million
Aéroports de Paris Sound 2010 results
 Aéroports de Paris Sound 2010 results Paris, 24 February 2011 Annual results up despite a virtually stable traffic (+0.4%) over the year: Revenue up by 4.0% to 2,739 million EBITDA up by 5.0% to 927 million,
MENA HOTEL MARKET REVIEW MUSCAT OMAN 2018
 MENA HOTEL MARKET REVIEW MUSCAT OMAN 2018 www.trimideast.com 1 OMR (billion) MENA HOTEL MARKET REVIEW MUSCAT OMAN 2018 OMAN ECONOMIC OVERVIEW Oman s economy continues to be heavily reliant on hydrocarbons,
Updated December Investor Toolbox
 Updated December 2017 2017 Investor Toolbox TABLE OF CONTENTS GROUPE ADP PRESENTATION 3 GROUPE ADP BUSINESS MODEL 14 2016 FINANCIAL RESULTS 23 H1 2017 FINANCIAL RESULTS 31 9M 2017 REVENUE 40 2017 FORECASTS
ANA HOLDINGS Financial Results for the Six Months Ended September 30, 2018
 ANA HOLDINGS NEWS ANA HOLDINGS Financial Results for the Six Months Ended September 30, 2018 TOKYO, Nov. 2, 2018 ANA HOLDINGS INC. (hereinafter ANA HD ) today reports its financial results for the six
ABX. Holdings, Inc. BB&T Transportation Conference. February 2008
 ABX Holdings, Inc. BB&T Transportation Conference February 2008 1 Safe Harbor Statement Except for historical information contained herein, the matters discussed in this presentation contain forward-looking
AIRBUS H Roadshow Presentation. New York July 31 st, 2017
 AIRBUS H1 2017 Roadshow Presentation New York July 31 st, 2017 H1 2017 HIGHLIGHTS 2 Healthy commercial aircraft environment; robust backlog of 6,771 a/c supports ramp-up plans H1 financials reflect delivery
KERRIE MATHER MANAGING DIRECTOR AND CHIEF EXECUTIVE OFFICER. Macquarie Conference 4 MAY 2016
 KERRIE MATHER MANAGING DIRECTOR AND CHIEF EXECUTIVE OFFICER Macquarie Conference 4 MAY 2016 Disclaimer General securities warning This presentation has been prepared by Sydney Airport Limited (ACN 165
ANA Reports Record Profits for FY2012
 ANA HOLDINGS NEWS ANA Reports Record Profits for FY2012 TOKYO April 30, 2013 - ANA Holdings today reports consolidated financial for the fiscal year ended March, 2013. Financial and Operational Highlights
ANA HOLDINGS Financial Results for the Year ended March 31, 2016
 ANA HOLDINGS NEWS ANA HOLDINGS Financial Results for the Year ended March 31, 2016 TOKYO, April 28, 2016 ANA HOLDINGS (hereafter ANA HD ) today reports its consolidated financial results for fiscal year
QANTAS HALF YEAR 2015 FINANCIAL RESULTS 1
 QANTAS HALF YEAR 2015 FINANCIAL RESULTS 1 Key points: Underlying Profit Before Tax: $367 million Statutory Profit After Tax: $206 million Transformation benefits: $374 million Comparable unit cost reduction:
JAPAN AIRLINES Co., Ltd. Financial Results 1 st Quarter Mar/2017(FY2016) July 29, 2016
 July 29, 2016") JAPAN AIRLINES Co., Ltd. Financial Results Mar/2017(FY2016) July 29, 2016 Today s Topics P.1 P.2 P.13 From the first quarter of this fiscal year, figures for Revenue Passengers Carried, ASK, RPK and Load
JAPAN AIRLINES Co., Ltd. Financial Results Mar/2017(FY2016) July 29, 2016 Today s Topics P.1 P.2 P.13 From the first quarter of this fiscal year, figures for Revenue Passengers Carried, ASK, RPK and Load
JET AIRWAYS (I) LTD. Presentation on Financial Results Q4 FY08
 LTD. Presentation on Financial Results Q4 FY08") JET AIRWAYS (I) LTD Presentation on Financial Results Q4 FY08 June 24, 2008 1 1 1 Agenda Domestic operating environment Jet Airways performance highlights JetLite performance highlights Consolidated Jet
JET AIRWAYS (I) LTD Presentation on Financial Results Q4 FY08 June 24, 2008 1 1 1 Agenda Domestic operating environment Jet Airways performance highlights JetLite performance highlights Consolidated Jet
Management Presentation. November 2018
 Management Presentation November 2018 Forward looking statements This presentation as well as oral statements made by officers or directors of Allegiant Travel Company, its advisors and affiliates (collectively
Management Presentation. May 2013
 Management Presentation May 2013 Forward looking statements This presentation as well as oral statements made by officers or directors of Allegiant Travel Company, its advisors and affiliates (collectively
Agenda. Conclusion of Transform Key Perform 2020 initiatives. Perform 2020 financial framework. Information meeting
 Information meeting Agenda Conclusion of Transform 2015 Key Perform 2020 initiatives Perform 2020 financial framework 2 Transform 2015: first phase of group turnaround accomplished Strict capacity discipline
2007/08 Full Year Results Investor Briefing
 2007/08 Full Year Results Investor Briefing Highlights of Result Profit before tax up 46% to $1,408 million Up 36% on the reported result Margin improvement $3 billion of Sustainable Future Benefits achieved
AerCap Holdings N.V. April 11, 2015
 AerCap Holdings N.V. April 11, 2015 Disclaimer Incl. Forward Looking Statements & Safe Harbor This presentation contains certain statements, estimates and forecasts with respect to future performance and
SKP OHD SKP OHD SKOPJE ALEXANDER THE GREAT AIRPORT OHRID ST. PAUL THE APOSTLE AIRPORT
 SKP SKOPJE ALEXANDER THE GREAT AIRPORT OHD OHRID ST. PAUL THE APOSTLE AIRPORT SKP OHD SKOPJE & OHRID S BACKGROUND In 2008, TAV has been awarded with the development and operation of Macedonia s two international
Bank of America Merrill Lynch 2018 Emerging Markets Corporate Credit Conference. Miami, May 2018
 Bank of America Merrill Lynch 2018 Emerging Markets Corporate Credit Conference Miami, May 2018 This presentation may include forward-looking comments regarding the Company s business outlook and anticipated
Cebu Air, Inc. 2Q2014 Results of Operation
 Cebu Air, Inc. 2Q2014 Results of Operation 1 Disclaimer This information provided in this presentation is provided only for your reference. Such information has not been independently verified and, as