Contents EXECUTIVE SUMMARY... 4
|
|
|
- Nathan Weaver
- 6 years ago
- Views:
Transcription

1
2 Charting the Future of the Port of New Orleans Contents EXECUTIVE SUMMARY... 4 I. INTRODUCTION... 8 A. Purpose... 8 B. Location... 8 C. Governance... 8 D. Mission... 8 E. Cargo... 8 F. Economic Importance... 9 FIGURE 1. INLAND WATERWAYS MAP... 9 II. EXISTING FACILITIES A. General Layout B. Industrial Properties FIGURE 2. BOARD-OWNED FACILITIES FIGURE 3. UPTOWN RIVER COMPLEX...12 FIGURE 4. INNER HARBOR NAVIGATIONAL CANAL...13 III. STRATEGIC ISSUES A. Hurricane Katrina Damage B. Alternate Locales TABLE 1. RELOCATION COSTS FOR MRGO TERMINALS FIGURE 4. NAVIGATION CHANNELS...15 C. Regional Port Cooperation D. Commercial Riverfront Development FIGURE 5. RIVERFRONT DEVELOPMENT MAP...18 E. Industrial Property F. Intermodal Rail FIGURE 6. RAILROADS SERVING NEW ORLEANS...19 TABLE 2. CARGO TONNAGE FOR BOARD-OWNED FACILITIES...21 IV. MARKET ASSESSMENT TABLE 3. BOARD-OWNED CRUISE TERMINAL GROWTH...23 A. Marketplace Assessment BREAKBULK CARGO Steel Nonferrous Metals Natural Rubber Forest Products Refrigerated Cargo CONTAINER CARGO Growth in Global Container Trade Growth in the North American Container Trade Growth in the United States Gulf Container Trade
3 Table of Contents Container Market Trends West Coast Port Congestion TABLE 4. COMPARATIVE ANALYSIS OF CAPITAL IMPROVEMENT Plans for Competing Ports East Coast Container Terminal Capacity Expansion Competing Ports Surveys of Competing Ports East Coast Container Terminal Capacity Expansion Gulf Ports Container Terminal Capacity Expansion Container Growth Cruise Industry B. Capacity and Utilization Analysis Alabo Street Terminal Henry Clay & Nashville Avenue Terminals Louisiana Avenue, Harmony & Seventh Street Terminals First Street Terminal Perry Street Terminal Napoleon Avenue Container Terminal Jourdan Road Terminal FIGURE 7. RELOCATING COLD STORAGE FACILITIES Erato Street Cruise Terminal Julia Street Cruise Terminal Poland Avenue Cruise Terminal FIGURE 8. POLAND AVENUE CRUISE TERMINAL PLANS FIGURE 9. DOWNTOWN CRUISE MAP V. CAPITAL IMPROVEMENT PLAN TABLE 5. CAPITAL IMPROVEMENT PLAN SUMMARY FIGURE 10 NAPOLEON AVE. CONTAINER TERMINAL EXPANSION A. Short Term Projects B. Long-Term Projects C. Regional/National Projects FIGURE 11. PORT OF NEW ORLEANS CAPITAL IMPROVEMENT PROGRAM...60 FIGURE 12. IHNC CAPITAL IMPROVEMENT PROGRAM...61 FIGURE 13. RIVER FACILITIES CAPITAL IMPROVEMENT PROGRAM VI. FINANCING OPPORTUNITIES A. Current Debt B. Financing Opportunities
4 Charting the Future of the Port of New Orleans EXECUTIVE SUMMARY The 2020 Master Plan is a blueprint to guide short and long term growth for the Port of New Orleans. The document contains six chapters: Chapter I, Introduction Chapter II, Existing Facilities Chapter III, Strategic Issues Chapter IV, Market Assessment Chapter V, Capital Improvement Plan Chapter VI, Financing Opportunities The Introduction gives an overview of the governance and mission of the Board of Commissioners Port of New Orleans and summarizes the economic importance of the Port on the local, state and national levels. The Existing Facilities chapter is a snapshot of the Port describing the 22 million square feet of publicly owned cargo handling and cruise facilities at the Port of New Orleans. Strategic Issues examines the current challenges facing the Port. The most pressing issue over the next decade is recovery from the damages inflicted by Hurricane Katrina in August Port facilities located in the traditional footprint on the Mississippi River experienced heavy winds but limited damage. River terminals received no flooding and are presently fully operational. Port facilities located in eastern New Orleans on the Mississippi River Gulf Outlet (MRGO) and the Inner Harbor Navigation Canal (IHNC) bore the brunt of the hurricane. In addition to wind damage, water inundated these navigation canals and overtopped the flood protection system. Floodwaters were more than ten feet at many properties. The U. S. Army Corps of Engineers has suspended dredging of the MRGO since August This has led to a lack of deep water navigation via the MRGO, compounding the impacts of the hurricane on Port maritime facilities and accelerating plans to move facilities from the MRGO/IHNC area and the Mississippi Riverfront. Pressure and competition for limited space on the Mississippi River is increasing because of the mass relocation of Port tenants and other industries away from the MRGO and IHNC. The Port may have to look to alternative sites within its jurisdiction to accommodate new development to aid in regional economic recovery. The Strategic Issues chapter examines alternate locales for port facilities in the region and reviews initiatives taken over the last 15 years to promote economic development on the West Bank of Jefferson and Orleans parishes. Another strategic issue noted in this chapter is intermodal rail. The Port of New Orleans is a major gateway for international rail traffic to the interior of the United States. New Orleans is served by six Class I railroads, more than any other port city in the United States. Over the last several decades, intermodal rail has emerged as the preferred delivery method for customers shipping ocean containers. In the post-katrina environment, the cost of truck transportation in New Orleans has escalated to a point that intermodal rail is economically attractive. Additionally, intermodal on-dock rail will likely prove to be an essential element in the support and growth of container volumes at the Port. An intermodal rail facility is included in the list of short term, immediate projects included in Chapter V, Capital Improvement Plan. The Market Assessment is a thorough analysis of the regional and global marketplace conditions at the Port of New Orleans. Port regional strengths and weaknesses are presented in the context of worldwide trends. Factors and trends affecting the breakbulk, container and cruise business are examined in depth. Findings of the Market Assessment suggest an overall trend for future portwide 4

5 Executive Summary breakbulk cargo growth over the next years. This overall growth is likely to be in the 2-3% range with periods of occasional spikes and troughs in cargo activity. Fluctuations in cargo must be anticipated in planning capital improvements for facilities that can accommodate peaks while maintaining efficient service at regular cargo levels. P o s t - K a t r i n a, breakbulk conditions have changed dramatically. Because of damage to transit sheds and storm siltation of the MRGO, refrigerated breakbulk facilities must shift from the IHNC to the riverfront, warranting additional breakbulk capacity on the Mississippi River. A survey of competing East Coast and Gulf Coast ports in the Market Assessment supports the expectation of growth in container traffic for all coastal ranges in the United States. In addition, the following industry trends are highlighted: growth in world trade and containerized cargo as a percentage of world trade; relocation of manufacturing to Northeast Asia (China); growth in regional and intraregional demand; and the increase in container terminal capacity and related infrastructure at East Coast ports. Strategic and master planning for competing ports affirms continuing growth in the volume of containerized cargo in the North American market. A significant six percent annual growth rate is anticipated through Growth in the United States Gulf container trade can be expected to echo this trend based on increasing market share of Asian cargo and the expansion of Panama Canal capacity Port of New Orleans Photo: Donn Young The cargo handled by the Port of New Orleans generates about 160,500 jobs statewide. by Projected growth rates support the provision of expanded container terminal capacity on the East and Gulf Coast. A major factor in port selection is inland transportation costs. Rising rail costs at West Coast ports, coupled with port congestion and lengthy transit times, are causing shippers to seek cost-effective alternatives. As a result, the market share of Asian cargo has dramatically increased on the East and Gulf Coasts and ports are expanding terminal capacity and improving the inland transportation infrastructure in response. The Port of New Orleans can provide less expensive inland transportation and faster transit times to the industrial Midwest and the East Coast than Houston, which continues to experience inland congestion because of its large local market to the north and west, including Dallas and Kansas City. Labor issues that affect the reliability of West Coast ports may also help New Orleans and other Gulf Coast ports. Contracts with chief labor organizations at West Coast 5
6 Charting the Future of the Port of New Orleans ports expire in Shippers and carriers are seeking to have terminal capacity in place to hedge against possible future labor disruptions. Carriers and their affiliated terminal operating companies are investing in the development of their own terminals or jointly investing and obtaining long term leases for exclusive operation of port-owned facilities throughout the United States. These trends afford the Port of New Orleans the opportunity to work with carriers to supply needed capacity. Of particular interest would be to work with a carrier who can provide the Port with all water service to Asia. The above factors support efforts by the Port of New Orleans to expand container terminal capacity and indicate opportunities to capitalize on projected growth in container traffic. Based on a comparative analysis of capital plans contained in the Market Assessment, the Port s competitors are clearly making major investments in terminal capacity to take advantage of market growth. Planned capital improvements for competing ports total $10.3 billion, and average $858 million per port. Of the twelve ports examined, Houston and Tampa are planning the highest dollar amount for long term capital improvements, amounting to $4.6 billion and $1.6 billion, respectively. Market conditions can and do change rapidly and for the Port of New Orleans to be able to respond to opportunities as they arise, additional terminal capacity must be in place either to accommodate projected growth or provide exclusive space to a carrier seeking a reliable, cost-effective alternative and greater control over its container traffic. The Market Assessment also evaluates the global and regional trends of the cruise industry at the Port of New Orleans. The cruise industry retains the title of the fastest growing segment of the leisure market at an average of 8.1% per year. { } These trends afford the Port of New Orleans the opportunity to work with carriers to supply needed capacity. Of particular interest would be to work with a carrier who can provide the Port with all water service to Asia. The North American market comprises 155 ships, more than half of the worldwide fleet of 282 ships. Within the next three years, another 18 ships are to be delivered, 14 of these ships to those cruise lines targeted by New Orleans. The majority of those new ships will go into the Caribbean trade, which remains the number one destination for passengers. As new cruise ships are added to a line, it frees existing ships to be available for service at the Port of New Orleans. As the cruise industry matures at the Port, the potential for new ships to be assigned to New Orleans increases. The cruise industry in New Orleans is closely tied to tourism. As tourism has rebounded from Hurricane Katrina, so has the cruise industry. New Orleans cruise occupancy in 2004 was 104%, the same as the industry average. However, the per diem rates in the Caribbean in 2005/06 declined due to concerns about weather, inflation and terrorism, and the occupancies declined accordingly. After 9/11, the cruise lines returned many ships to the North American market, but now are starting to return the ships overseas where the per diems are higher. The potentially lucrative Asian market is starting to expand, and cruise companies (such as Royal Caribbean Cruise Lines) are testing the waters there. Although the industry is currently expanding its fleet, it is also expanding its territory to spread the risk of a continuing inflationary market. Planned capital improvements to the two existing cruise terminals and creation of a new third terminal in the immediate future will help the Board successfully anticipate the needs of the burgeoning cruise industry in New Orleans and assist in the regional recovery from Hurricane Katrina. The Market Assessment concludes with 6
7 Executive Summary a discussion of capacity and throughput for breakbulk, container and cruise facilities at the Port of New Orleans, how effectively each facility is being utilized, and if there is additional capacity to handle growth opportunities. The Capital Improvement Plan is based on the strategic issues and market assessment outlined in respective chapters and articulates the vision for growth that will successfully carry the Port of New Orleans into the future over the next 20 years. Goals and objectives have been formulated to define this vision for growth as follows: Nurture historic niche breakbulk cargoes such as steel, metal, plywood, and rubber, etc. Create new container terminal capacity to position the Port to capture its share of double digit growth presently occurring in the worldwide container market. Nurture recovery of cruise business and add more terminal capacity. Complete relocation from the MRGO and consolidation of deep draft terminals on the Mississippi River. Create new breakbulk cargo capacity beyond the traditional riverfront footprint of the Port. Continue the major maintenance program of all Port facilities. Continue to extract maximum revenue from industrial properties that are leased to private companies. The projects were then prioritized in order of importance and divided into two categories: short term projects and long term projects. Short term projects will answer immediate needs critical to the Port over the next five years from 2008 through Long term projects, covering 2013 through 2020, will serve to guide the future development of maritime related businesses and the replacement or repair of aging high maintenance facilities. Ten short term projects in the CIP total $574.4million. Six long term projects total $465.1 million. The grand total for all fifteen short and long term projects included in the plan is $1.04 billion. This total for the Port of New Orleans is on par with the $848 million average for capital improvement plans noted for competing ports in the Market Assessment portion of this document. The short and long term projects are summarized in a table followed by descriptions for each project listed. A third category for regional and national projects is included in the CIP chapter. These projects serve as major transportation links, are of regional and/or national interest and require federal funding. The regional and national projects are critical to the Port of New Orleans and are described in detail. The regional and national projects are not included in the cost estimates for short and long term projects. Financing Opportunities are detailed in the final chapter of this master plan, including an assessment of current debt structure and potential funding sources to implement capital improvements necessary to carry the Port of New Orleans into the future. The methodology employed in project selection for the CIP began with identification of projects that would help bring the Port s vision for the future to fruition. A feasibility study for each project was then conducted followed by a site analysis identifying potential sites available for the project within the jurisdiction of the Board. A preliminary cost estimate was developed for each project. 7
8 Charting the Future of the Port of New Orleans I. INTRODUCTION A. Purpose The purpose of the 2020 Master Plan is to provide a blueprint for long-term growth and a business strategy to address immediate needs over the next decade. This juncture is particularly critical due to the devastating impacts and abrupt changes wreaked by Hurricane Katrina last year on the Port of New Orleans, the City of New Orleans and the southeast Louisiana region. Hurricane Katrina was the most destructive and costly natural disaster to strike the United States. The storm s full impact on the Gulf Coast is yet to be realized. Preliminary postdisaster investigation indicates a death toll of at least 1,200, displacement of more than one million people, and $200 billion in property damage. by six Class I railroads. This gives port users direct and economical rail service reaching anywhere in the country. C. Governance The Board of Commissioners Port of New Orleans ( Board ) governs the Port of New Orleans. The Board sets policies and regulates traffic and commerce of the Port. The Board is made up of seven commissioners. They are unsalaried and serve five-year staggered terms. The governor of Louisiana appoints board members from a list of three nominees submitted by 19 local business, civic, labor, education and maritime groups. The seven-person board reflects the threeparish (county) jurisdiction of the Board. Four members are selected from Orleans Parish, two from Jefferson Parish and one from St. Bernard Parish. B. Location Located in southeast Louisiana near the mouth of the Mississippi River, the Port of New Orleans serves as a gateway linking America to the global market. New Orleans has been a center for international trade since it was founded by the French in Today, the Port of New Orleans is at the center of the world s busiest port complex, Louisiana s Lower Mississippi River. Proximity to the American Midwest via a 14,500 mile inland waterway system positions the Port of New Orleans as the port of choice for the movement of cargo such as steel, grain, containers and manufactured goods. In addition, the Port of New Orleans is the only deepwater port in the United States served D. Mission The Board has formulated a mission statement that summarizes its function as follows: The Board s mission is to maximize the flow of foreign and domestic waterborne commerce throughout the Port of New Orleans. E. Cargo New Orleans is one of America s leading general cargo ports. A productive and efficient private maritime industry has placed the Port of New Orleans in the top market share of the United States for imported steel, rubber, plywood and coffee. Port of New Orleans Commodity Market Share U.S. Gulf & Atlantic Ports, 2006 Imports Commodity Tonnage Market Rank (short tons) share (%) Steel 4,150, Natural Rubber 413, Coffee 209, Plywood Imports 123,
 and Asia (32.")
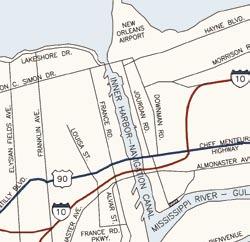
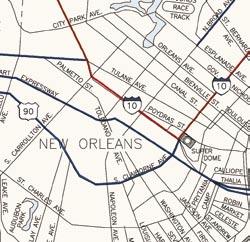
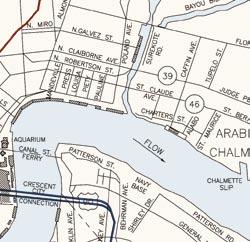
9 Introduction Figure 1 Inland Waterway Map More than 9.3 million tons of general cargo and more than 20 million tons of bulk cargo were handled at Port of New Orleans facilities in The Port of New Orleans handles cargo from trade partners all over the world. Trade routes for 2006 indicate that two-thirds of trade at the Port of New Orleans is with Europe (34.3%) and Asia (32.5%). The remaining one-third consists of trade with South America (15.4%), Central America (6.2%), Africa (6.0%), the Indian Sub-continent (2.3%), the Caribbean (2.0%), Australia/New Zealand (0.8%) and the Middle East (0.5%). F. Economic Importance The Port of New Orleans has traditionally had a dramatic impact on the national, state and local economies. Some 380,000 jobs and $47 billion in national economic output in the United States are related to cargo at the Port of New Orleans. This cargo creates $16.9 billion in annual earnings and $2.8 billion in federal tax revenue. The statewide economic impact of the Port of New Orleans is significant. The Port is responsible for 160,500 jobs, $17 billion in spending and $800 million in taxes statewide. On a regional level, the Port of New Orleans supports 52,000 jobs in the New Orleans metropolitan area and contributes $4.4 billion in earnings, $6 billion in spending and $112 million in taxes. 9

. The IHNC connects Lake Pontchartrain, the MRGO and Intracostal Waterway to the Mississippi River.")
10 Charting the Future of the Port of New Orleans II. EXISTING FACILITIES A. General Layout Existing facilities at the Port of New Orleans include 20 million square feet of cargo handling area, more than 3.1 million square feet of covered storage area and 1.7 million square feet of cruise and parking facilities located along three major navigational channels, the Mississippi River, the Inner Harbor Navigation Canal (IHNC), commonly referred to as the Industrial Canal, and the Mississippi River Gulf Outlet (MRGO). The IHNC connects Lake Pontchartrain, the MRGO and Intracostal Waterway to the Mississippi River. The MRGO is a man made channel that is designed to provide deep sea ships a shortcut access to the Gulf Intracoastal Waterway System. B. Industrial Properties The Board owns approximately 1,200 acres that make up the Inner Harbor-Navigation Canal (IHNC), better known as the Industrial Canal. The canal itself is a 400 foot wide by 5.1 mile-long and 30-foot deep waterway that connects the Mississippi River with the Intracoastal Waterway and Lake Pontchartrain. The IHNC forms the division between Gentilly and New Orleans East and the upper and lower Ninth Wards. Figure 2 Board Owned Facilities There are about 750 acres of developed land along the IHNC of which 550 acres are leased or available for lease to industrial and commercial users. The other 200 acres are marine terminals used for cargo trans-shipment. The industrial properties are leased to a variety of companies including ship repair, boat building, trucking, cement, warehousing, scrap recycling and basic material handling. The advantages to leasing on the IHNC are the ready availability of sites zoned heavy industrial with deep-water and rail access. The following figures depict the location of facilities at the Port of New Orleans by location including: Mississippi River Facilities; Cruise Terminal and Port of New Orleans Headquarters; and Industrial Canal Facilities. 10

11 Existing Facilities 11

12 Charting the Future of the Port of New Orleans Figure 3 Board Owned Facilities- Uptown River Complex 12

13 Existing Facilities Figure 4 Inner Harbor Navigation Canal 13


14 Charting the Future of the Port of New Orleans III. STRATEGIC ISSUES A. Hurricane Katrina Damage The major strategic issue over the next decade facing the Port of New Orleans and the southeast Louisiana region is recovery from the damages inflicted by Hurricane Katrina in August Port facilities located on the Mississippi River experienced heavy winds and limited damage to cargo transit sheds, wharves, container cranes and electrical equipment. Fortunately, the terminals on the Mississippi River received no flooding and are fully operational. Port facilities located in eastern New Orleans located on the MRGO and the IHNC bore the brunt of the hurricane s fury. In addition to wind damage, water inundated these navigation canals and overtopped the flood protection system. Floodwaters were more than ten feet at many properties. The France Road container berths (top) had severe damage after Hurricane Katrina. The Napoleon Avenue Container Terminal, along the Mississippi River, had moderate damage and welcomed its first container ship, the Lykes Flyer (right) less than two weeks after the city flooded. Environmental studies of the impacts of Hurricane Katrina relative to the MRGO are presently underway. De-authorization of the channel and/or the construction of barriers that would permanently close all or part of the MRGO are under consideration by federal agencies. Should total or partial closure of the MRGO occur, a number of established maritime facilities will cease to operate for deep draft vessels. Vessels will be limited to the size of the existing Inner Harbor Navigational Canal lock. The affected facilities include the Port s France Road Terminal on the west bank of the IHNC and the Jourdan Road Terminal on the east bank. The Corps of Engineers has suspended dredging of the MRGO since August of This has led to a lack of deep water navigation via the MRGO, compounding the impacts of the hurricane on port maritime facilities. This accelerates the Port s plan to move facilities from the MRGO/IHNC area to the Mississippi Riverfront. Towards that end, $333 million in relocation costs have been identified for existing port facilities dependent on the deep water access provided by the MRGO. Of this total, $150 million is estimated to relocate existing Port terminals and $183 million is estimated to relocate other private industries. Port of New Orleans Photos: Donn Young 14

15 Strategic Issues B. Alternate Locales Due to the potential mass relocation of Port tenants and other industries to Mississippi Riverfront facilities resulting from the devastation of Hurricane Katrina noted above, the Port may have to look to other areas within its existing jurisdiction for future new development to aid in the economic recovery. Space for additional facilities in the historic footprint of the Port of New Orleans on the East Bank of Orleans Parish is limited. The Board of Commissioners of the Port of New Orleans (Board) has jurisdiction in Orleans, Jefferson and St. Bernard parishes. The West Table 1. Relocation Costs for Port Terminals Using MRGO Industry France Road Terminal Jourdan Road Terminal Total Est. Relocation Cost $100 million $50 million $150 million Figure 4.Navigation Channels 15
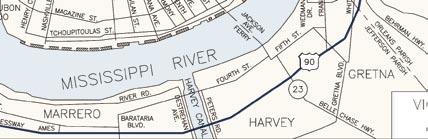
16 Charting the Future of the Port of New Orleans Bank of Orleans and Jefferson parishes has been underutilized in the past. These areas are located across the Mississippi River and south of existing facilities at the Port of New Orleans. Other parishes in the New Orleans metropolitan region may be interested in working with the Port of New Orleans in establishing new maritime facilities. The Board has considered developing facilities on the West Bank of the Mississippi River on a number of occasions. Following is a summary of initiatives taken over the last 15 years to promote economic and industrial development on the westbank of Jefferson and Orleans Parishes: The Board identifies the need for a commerce park outside of the traditional footprint. A master plan investigates the commerce park concept and potential locations. ( ) Nineteen potential sites on the West Bank of Jefferson Parish are evaluated, most of which are considered too small to be of practical maritime use. Three sites are studied further: Hydril (50 acres) in Westwego, Union Pacific (950 acres) in Westwego and Union Pacific (57 acres) in Gretna adjacent to the Perry Street Wharf. Hydril has listed the property for $2.7 million, three times the appraised value. Hydril ultimately decides it is not interested in selling. The Perry Street property is preferred over the Westwego properties because of the existing wharf and warehouse shed and potential riverfront usage conflicts at the Westwego locations. ( ) The Perry Street Wharf is purchased from Union Pacific for $2.275 million. The property includes 57 acres of land and 3,885 feet of Mississippi River frontage. The wharf includes 1,009 linear feet of wharf, 283,000 square feet of wharf area, a 160,000 square foot warehouse and direct rail access to the front apron. ( ) Seven acres and 96,000 square feet of buildings at the Ward Lumber Company located south of the Perry Street Wharf in Gretna, La., are considered for acquisition. Negotiations are unsuccessful due to the wide disparity between the asking price and the appraised values and the cost of remediating environmental conditions on the property. ( ) Funding the West Bank Corridor Improvement Study to identify potential development sites and opportunities, access and infrastructure improvements. (1998) Twenty acres of riverfront property in the South Kenner portion of Jefferson Parish associated with an airport noise abatement area is evaluated for acquisition. An airport master plan projects a need for an intermodal park adjacent to the existing airport but finds the wharf facility commercially infeasible and problematic due to flight path height limitations. Negotiations for purchase are unsuccessful because of the wide disparity between the asking price and the appraised value. (1995) A donation of 1,750 linear feet of batture property in Marrero on the West Bank of Jefferson Parish is offered to the Board. Findings from an environmental review of the property indicate a presence of asbestos throughout the site, formerly a dump of unknown content. The Board declines to take ownership of the property and the property owner declines to clean the site. (2000) The Board leases the former Todd Shipyard property located on the West Bank of Orleans Parish to a topside ship repair operation. A number of attempts are made to lease the adjacent wharf for government vessel lay berthing, without success. (2001) A 1,500 foot dock at Northrop Grumman Avondale Shipyard located on the West Bank of Jefferson Parish is evaluated for potential maritime use. It is determined that the dock is best suited for top-side ship repair, lay berthing or ship-to-barge transfer. The configuration of the dock and backup area was determined not suitable for typical cargo stevedoring and terminal operations. (2005) The West Bank of Jefferson and Orleans parishes presents a potential for location of future facilities for the Port of New Orleans as the existing historic footprint on the eastbank of Orleans Parish reaches full capacity. 16
17 Strategic Issues C. Regional Port Cooperation The Port of New Orleans has fostered partnerships with other Louisiana ports through cooperative endeavor agreements including the two ports located downriver from New Orleans. These partnerships extend the regional outlook of long-term port planning and broaden the landscape in which future port development could take place. The Port of New Orleans has signed agreements with the St. Bernard Port, Terminal and Harbor District and the Plaquemines Parish Port, Harbor and Terminal District. The Port authorities in Plaquemines, St. Bernard and New Orleans together control the first 121 miles of Mississippi river frontage, extending from the mouth of the Mississippi River to the area near Louis Armstrong International Airport. The Board of Commissioners of the Port of New Orleans supports a proposal by Plaquemines Parish officials to expand the energy port at Venice, La., to service new oil and gas exploration leases opened in the eastern Gulf of Mexico. Officials hope to improve access to Venice by dredging Baptiste Collette Bayou to a depth of 27 feet. Venice is closer than any other Gulf Coast port to the new lease area, which is set for drilling in The cooperative endeavor agreements have led to coordinated efforts in terms of marketing the ports on the Lower Mississippi River, and each agreement says that the ports will consider coordinated investments in the future. The cooperative endeavor agreements raise the possibility that the ports could work together to create new facilities along the Mississippi River. Those partnerships could extend to some of the port development projects mentioned in this plan. { } D. Commercial Riverfront Development Interest in the Mississippi Riverfront was renewed following the World s Fair held in New Orleans in Redevelopment of the World s Fair structures contributed to a mixture of maritime and commercial uses leading to redevelopment of the riverfront and the adjacent Warehouse District in the City of New Orleans. Today this area boasts of a vibrant mixture of offices (including the Port of New Orleans Administration Building), the Ernest Morial Convention Center, condominiums, hotels, restaurants, a casino, an aquarium, museums, parks, retail shopping areas and cruise terminals. The extension of existing mixed riverfront uses has been under consideration by the Board for some time. The effect of Hurricane Katrina on the New Orleans commercial, residential and tourism landscapes has brought an air of caution to the wide variety of non-maritime development initiatives long planned in the area from Jackson Avenue to the Industrial Canal. These include: Redevelopment of the World s Fair structures contributed to a mixture of maritime and commercial uses leading to redevelopment of the riverfront and the adjacent Warehouse District in the City of New Orleans. 1. The Trust for Public Land River Park 2. Tulane University Riversphere 3. Morial Convention Center Phase 4 Expansion 4. Julia Hotel, including new cruise terminal 5. Regional Transit Authority Riverfront Streetcar Extension The Convention Center expansion is under reevaluation. The Julia Hotel, The Trust s River Park, Tulane s Riversphere and 17

18 Charting the Future of the Port of New Orleans Figure 5. Riverfront Development Map the Riverfront Streetcar Extension continue to be pursued but have been slowed considerably. The Erato Street Cruise Terminal and Garage were completed in October 2006, and construction of the new Poland Avenue Cruise Terminal project could begin in the fall of 2008, given the release of State Capital Outlay funds previously committed. The Board has succeeded in executing a Riverfront Development Agreement with the City of New Orleans to facilitate nonmaritime development. The agreement provides a vehicle to ease the process of riverfront development by coordinating Board and City reviews and approvals and by laying out ground rules for locations and parameters for non-maritime development. Additionally, the New Orleans City Council has approved the City Planning Commission s Riverfront Vision 2005 as the City s official land use planning document for the riverfront. The New Orleans Building Corporation, with the assistance of the Board, has selected a consortium of architects and planners to provide a conceptual riverfront development plan which will serve as the basis for prospective developers. The dilemma faced by riverfront projects is the uncertain nature of the New Orleans post-katrina marketplace, both in terms of resident population and tourist visitation. The state of the city s tourism also affects decision-making by cruise lines on vessel deployment and thus affects the Board s cruise terminal development program. Federal and state disaster response programs may provide an opportunity to tap previously unavailable funding sources for infrastructure improvements and development of tax credits, which could 18

19 Strategic Issues make riverfront development more desirable and feasible. The number of concurrent prospective developments remains remarkable and could foreshadow a radical change in the face of the New Orleans downtown riverfront, potentially affecting not only the public s relationship to the Mississippi River but also the Board s maritime activities in the same area. The Board will continue to promote and facilitate non-maritime development and assist credible prospective developers of underutilized Board wharves, while supporting the interests of viable maritime tenants. The Board will participate with the City in drafting development plans and criteria and reviewing development proposals. E. Industrial Property An independent study is underway to determine the feasibility of the Board selling some or all of its industrial properties. Selected properties have been targeted for initial disposition investigation. There are currently three basic types of lease prospects for existing industrial properties: 1. Storm-recovery prospects. These include basic materials, building materials and construction companies. Demand from these types of prospects will most likely continue through Leases are expected to be medium term, i.e., two to eight years. The Board is currently negotiating with a number of storm recovery firms but no leases have been consummated to date. 2. Companies that see an immediate opportunity but that also have longerterm ambitions. These companies include the foregoing plus boat/ship repair, light manufacturing and warehousing businesses. A half dozen of these leases have been entered into over the last year and two more are close to being finalized. 3. The usual prospects, those companies needing industrial land and facilities including direct rail and water access. There have not been many of the usual prospects since Katrina but it is anticipated that they will resurface when/if the recovery is successful. Most of the companies listed under category 1 and 2 above have shown a keen interest in purchasing the property rather than leasing. F. Intermodal Rail The Port of New Orleans is very fortunate to be served by six Class I railroads, more than any other port city in the United States. These carriers, two to the west, two to the north and two to the east, have helped to establish the Port as a major gateway for international rail traffic to the interior of the United States. Given its location, the Port of New Orleans is more aligned with those international cargoes traveling within the United States in a north/south direction. The majority of the cargo moving through the Port is headed for or arriving from the major markets of Figure 6 Railroads Serving New Orleans 19

20 Charting the Future of the Port of New Orleans Port of New Orleans Photo: Donn Young The former location of the Stuy Docks rail yard provides space to nurture on-dock container rail transfer. The railyard, which the Port purchased, is located next to the existing Napoleon Avenue Container Terminal. Developing an on-dock service would help attract containerized cargo from other states. Memphis, Kansas City, Chicago and points in the Midwest. These locales are considered the Port s major cargo sourcing areas, as opposed to the markets on the east and west coasts. Thus the rail carriers serving these more northern areas, the Canadian National and the Kansas City Southern, are particularly well positioned to handle the preponderance of the Port s rail traffic. Over the last several decades, intermodal rail (via ocean containers carried on railcars) has emerged as the preferred delivery methodology for customers shipping containers to/from United States seaports from many inland points. Intermodal rail is usually less expensive from longer distances than the alternative of over-theroad trucking. There are a myriad of factors which determine or can affect how a container is delivered to a port. By and large, the longer the distance traveled, the more likely the container is to arrive by rail. In some major port cities, containers arriving by rail can be delivered by the rail carrier directly on to the port area. This is called on-dock rail. Typically, the port is served by one or two rail carriers. The intermodal rail yard, owned by the Port or the rail carrier, is located on Port property. Containers are unloaded from the rail cars and delivered directly to shipside. The alternative to on-dock rail is offdock rail. This is the case in New Orleans. The six Class I railroads each have their intermodal yards in areas within five miles of the Port, but not actually on Port property. The containers are unloaded from railcars at these intermodal yards and drayed (delivered by truck) to/from the Port s maritime terminals. Traditionally, up until last year, this cross -town dray from the rail yard to the Port area in New Orleans has been inexpensive, ranging from $50 to $75. The supply of willing drivers has kept this rate extremely low and has made the economics of developing an on-dock alternative cost prohibitive. 20

21 Strategic Issues Driven primarily by the aftermath of Hurricane Katrina and the shortage of drivers, the cost of this cross-town dray has risen threefold. The expenses associate with developing Port property and the corresponding intermodal rail service to the Port area is now becoming an attractive alternative. The CN Railroad, the largest volume railroad serving the Port, and the two operators of the Port s Napoleon Avenue Container Terminal have recognized this fact. These parties are close to finalizing an operating agreement between these two terminal operators that will utilize a portion of the Napoleon Avenue Container Terminal. This will effectively establish an on-dock rail service serving the Port of New Orleans. The timing, the economics and customer response all appear favorable to furthering this endeavor. As the Board continues in its master planning, it is essential that the future of the former Stuy Docks intermodal yard be completely understood and nurtured. Ondock rail will likely prove to be an essential element in the support and growth of the Port of New Orleans Photio: Donn Young New Orleans excellent rail connections provide a way to increase container volumes without increasing truck traffic. Table 2. Port of New Orleans Cargo Tonnage for Board-Owned Facilities container volumes at the Napoleon Avenue Container Terminal. Moving containers to/from port areas in the most economical, time-sensitive fashion is a key component in the importer/exporter port-of-choice decision-making process. The Port of New Orleans has much to gain in this regard with the further development of this on-dock rail asset. Year Breakbulk Container Total General Cargo ,231,049 2,831,167 7,062, ,473,312 3,050,508 6,523, ,918,106 3,165,964 8,084, ,035,504 2,565,879 6,601, ,753,085 2,344,186 8,097,271 21
 are the provision of cargo and cruise facilities.")
22 Charting the Future of the Port of New Orleans IV. MARKET ASSESSMENT The two major business activities of the Board of Commissioners Port of New Orleans (Board) are the provision of cargo and cruise facilities. The focus of Board-owned cargo facilities is the accommodation of general cargo. General cargo includes two types of cargo modes: breakbulk and container. Historically, breakbulk cargo has been the predominant cargo handled at Board facilities. In addition, a significant volume of containerized cargo is handled at Board terminals. In the five-year period between 2002 and 2006, the volume of general cargo handled at Board-owned facilities has increased from more than 7 million tons to nearly 8.1 million tons. Table 3 on the next page documents cargo volumes for Board-owned facilities over the last five years. This, however, has not been a period of steady growth. Cargo flows through the Port are characterized by significant fluctuations. A variety of economic and trade-related factors contribute to this volatility, particularly in breakbulk cargo volumes. Volatility in cargo flows and anticipated cargo growth are significant factors in port facility utilization and planning. Since 1994, the Port has experienced rapid growth in its cruise business. The following table traces cruise growth at Board facilities over the last five years by the number of cruise passengers. The passenger trend in New Orleans continued to grow between 2002 and 2005 because of the improved facilities in New Orleans and the tremendous magnetic pull of the City itself to the individual tourist who wanted to combine a trip to New Orleans with a cruise to the Caribbean. New Orleans was attracting more cruise lines, such as Princess Cruise Lines, as it continued to fill the ships already committed. Unfortunately, Hurricane Katrina stepped in and diverted the progress. The cruise industry returned to New Orleans on December 30, 2005, and the Port hosted four ships prior to Breakbulk cargo has been the predominant cargo in New Orleans, but containerized cargo (above) represents a significant volume for the Board s terminals the home- ported cruise ships returning on October 15, The cruise industry in New Orleans has a strong relationship to tourism. As the New Orleans tourist base rebuilds, the cruise passengers are returning. The recent completion of the Erato Street Cruise Terminal and plans to redevelop the Poland Avenue Wharf as a cruise terminal will enable the Board to accommodate projected growth in cruise operations. Breakbulk and cruise operations have traditionally taken place at facilities located on the East Bank of the Mississippi River in Orleans Parish. In 2001, the Board opened the Napoleon Avenue Container Terminal, its first dedicated container facility located on the Port of New Orleans Photo: Donn Young 22
23 Market Assessment Table 3. Board-Owned Cruise Terminal Growth Year Cruise Passengers , , , , ,806 Mississippi River. Prior to Hurricane Katrina, container operations were accommodated at the France Road Terminal situated on the Inner Harbor Navigation Canal (IHNC). A number of factors have emerged simultaneously that affect the Board s cargo markets as well as capacity for both breakbulk and container cargo terminal operations. These factors afford the Board with opportunities for growth and affect the future location and development of cargo facilities, which include: 1. Shifts in global commerce, including an upturn in the volume of imported steel as well as anticipated growth in other major breakbulk commodities handled at the Port and anticipated long term global growth in containerized cargo. 2. Increased competition for space on the Mississippi Riverfront from a multitude of factors: Post-Katrina siltation and the anticipated closure of the Mississippi River Gulf Outlet (MRGO), resulting in the relocation of much-needed breakbulk and container terminal capacity to the riverfront. The anticipated reduction of breakbulk capacity due to the removal of the Napoleon C and Milan Street Wharves to enable the expansion of the Napoleon Avenue Container Terminal. Further reduction in breakbulk capacity resulting from redevelopment of the Poland Avenue Wharf for needed additional cruise terminal capacity. As noted, the Board s other major business involves the provision of cruise terminals to accommodate the Port s emerging cruise industry. Although Hurricane Katrina has temporarily dampened New Orleans market capture, anticipated industry growth provides the Board with an enormous opportunity. To take advantage of potential industry growth, adequate terminal capacity must be in place. The recent completion of the Erato Street Cruise Terminal and plans to redevelop the Poland Avenue Wharf as a cruise terminal will enable the Board to accommodate projected growth in cruise operations. A. Marketplace Assessment The following sections of this plan thoroughly examine the Board s breakbulk, container and cruise business through a marketplace assessment and facility capacity and utilization analysis. This market-based approach forms the rationale for Port capital improvement recommendations for both the short and long term, which are presented in Chapter V, Capital Improvement Plan. 1. Breakbulk Cargo Worldwide breakbulk cargo volumes are projected to grow 3% to 7% annually. The Port of New Orleans is not expected to share in the upper range of growth primarily due to increased containerization of certain breakbulk cargo presently handled at the Port. Based on commodity analysis and historical trends, breakbulk cargo handled at the Port is projected to grow 2% annually through Several factors are responsible for projected growth in the breakbulk market sector, including: Global economic growth, especially the emergence of China and the resulting "bounce" of the other Asian countries. Large scale infrastructure projects in emerging economies, including the expansion of oil and gas exploration 23

24 Charting the Future of the Port of New Orleans Port of New Orleans Photo: Donn Young Volatility in the volume of breakbulk cargo, such as steel, is based on global economic trends. The Port has to make allowances for these fluctuations in planning its capacity for breakbulk cargo. ventures and plants. Worldwide restructuring of the steel industry. Recovery of the forest products sector. Better cost economies and improved service from breakbulk carriers. Typically, the Port experiences volatility in breakbulk volumes based on national and global economic trends. Fluctuations in breakbulk tonnages occurring on a yearto-year basis complicates planning for port capacity for breakbulk cargo. The availability of adequate transit shed capacity is a major consideration in accommodating growth in breakbulk cargo volumes. Given the amount of transit shed capacity currently available, the Port may not experience capacity constraints under normal conditions in the near future. However, the potential for unpredictable surges in breakbulk cargo accentuates the need for increased transit shed capacity to both capitalize on higher cargo volumes and retain existing business. Conditions impacting availability of sufficient transit shed capacity include: 1. The Port s transit shed capacity is divided among discrete, privately operated terminals. Shifting shed capacity from one private terminal to a competing operation in the event of a spike cannot be accomplished easily. 2. Capacity constraints will arise if all of Port breakbulk commodities increase simultaneously. 3. Flexible space capacity has been lost to urban development and container terminal capacity on the Mississippi River, valuable spill-over space that previously accommodated spikes in cargo activity. 24
25 Market Assessment In the long term, site and funding alternatives will be examined to assure that transit shed capacity will be available when required. In the interim, non-structural methods of increasing short-term capacity should be considered, including cargo stacking, reduced free time and demurrage. Stevedore initiatives will play an important role in dealing with spikes in cargo volumes. The primary characteristic of breakbulk cargo tonnage levels during the past decade has been a flat trend with considerable yearto-year volatility. Generally, economic trends and commodity-specific factors account for the volatile nature of breakbulk cargo performance. The Port s specific commodity mix, related competitive factors and changing business conditions significantly impact the overall trend for breakbulk cargo. Cargo-handling requirements for specific commodities also have a direct bearing on the use and types of storage space the Board must make available to assure continued growth in breakbulk cargo. Breakbulk cargoes consist primarily of construction and manufacturing-related commodities, e.g., steel, forest products, rubber and nonferrous metals. Cargo volumes tend to track national and global economic growth trends. High breakbulk cargo volumes in the mid to late 90s corresponded with exuberant national economic growth. Declining volumes between 2001 and 2003 reflected global and national economic recession. Likewise, the recent rebound in breakbulk volumes tracks recovering national and global economies. From 2000 through 2006, the level of breakbulk cargo activity at Board-owned facilities was largely stable, albeit with significant fluctuations in volumes. The lack of growth in breakbulk cargo can be partially attributed to shifts in traditional breakbulk commodities, e.g. coffee and paper products, to containers. Breakbulk cargo volume at Board wharves averaged approximately 4.5 million tons between 2002 and Volumes declined to 2.5 million tons in 2003 but rebounded to more than 3.7 million tons in 2004, a 47.9 percent increase over Hurricane Katrina curtailed operations at the Port of New Orleans for four months and adversely impacted cargo volumes in 2005 and Port operations are beginning to recover, as is the region and State. Factors relating to the accommodation and outlook of the Port s four principal breakbulk commodity groupings -- steel, non-ferrous metals, natural rubber and forest products-- are discussed below. Steel Steel imports are the Port s primary breakbulk commodity, typically accounting for more than 50 percent of the Port s total general cargo. Steel import volumes accounted for much of the growth in Port cargo in the mid to late 90s, accounting for more than 70 percent of total general cargo in Tariffs imposed on steel imports in 2002 had a significant adverse impact on the Port s cargo activity. The tariffs were most profoundly felt in Notably, in 2003, steel imports accounted for only 40.7 percent of the Port s total general cargo. Import steel volumes increased significantly with the lifting of the tariffs in December, Probably the most volatile of all the breakbulk commodities handled at the Port, steel is certainly the most important. While it will definitely continue to be the mainstay of the Port s breakbulk business, the shipping and handling of this commodity is expected to undergo some changes in the next decade, including some containerization and packaging modification. Because steel represents such a large portion of the Port s cargo, significant fluctuations in tonnage movements have a much larger impact on port capacity than similar fluctuations in other commodities. 25

26 Charting the Future of the Port of New Orleans According to the American Institute of International Steel (AIIS), steel demand in the United States is projected to rise at a rate of one percent to two percent per year for the next decade. With the apparent supply of steel averaging 118 million tons per year (with a range of 108 million tons to 133 million tons), increases in demand would equal approximately 1 million to 2.4 million more tons of steel each year. Of course, the value of the dollar, the United States economy, the economies of steel producing countries, and other trade-related factors will play a large role in affecting this volume. Over the past 10 years, imported steel has accounted for an average of 28 percent of the apparent supply of steel in the United States. Imports represented only 21 percent of apparent supply in 2003, down from a high of 33 percent in Given the recent history with tariffs, it is unlikely that imported steel will attain more than a 30 percent market share in the near future. However, domestic demand will virtually ensure that imports continue to comprise a significant portion of this market. to handle anywhere from 12 percent to 15 percent of the steel imported into the United States. The location of new automobile plants in the Southeast, the location of new steel mills, and competitive port development will all impact the Port s steel future. However, none of the steel imports moving through the Port remain in Louisiana with the exception of those bound for a steel processing plant that recently opened in Shreveport. The lack of more steel processing facilities in Louisiana eliminates the Port and the state from receiving the economic benefits of any possible vertical integration scheme. Nonferrous Metals Nonferrous metals such as cooper, zinc and aluminum are generally counter-cyclical, meaning that when the economy is good, volumes are down and vice-versa. Industries generally store product in London Metal Construction of new plants and closure of old plants will impact steel import levels. However, the types of plants built and closed will impact imports in different fashions. It is unlikely that any integrated mills will be constructed in the United States in the near future, if ever. Costing billions of dollars to build, these plants are considered too expensive for the United States marketplace. The likely alternatives will be mini-mills and finishing plants. Of the two, finishing plants would increase the likelihood of steel imports due to their reliance upon raw steel as feedstock. Perhaps even more important than the type of mill is the location of these facilities. Factories located at sites connected by the Mississippi River waterway system would greatly benefit this Port. The AIIS reports that the Port of New Orleans (portwide) has averaged 13 percent of all steel imported into the United States (including Canadian steel) over the last ten years. On average, and barring any major upheavals in the marketplace, New Orleans should expect The Port of New Orleans has more certified warehouses to handle nonferrous metals, such as copper (shown above), than any other U.S. port. Port of New Orleans Photo: Donn Young 26

27 Market Assessment Exchange (LME) Warehouses. The Port of New Orleans is unique in that it contains more certified LME warehouses than any port in the United States. This alone ensures a continuous flow of nonferrous metals to the Port. The LME warehouse distributors store nonferrous metals during slow periods and distribute from these warehouses when the market is active. LME warehouses in New Orleans serve a global market, including China. Continued growth of nonferrous metal cargo moving through the Port to manufacturing in the industrial Midwest is anticipated due to the availability of low priced aluminum from Russia. In recent years, the volume of copper handled at the Port has declined. The location of copper processing facilities in Carrollton, Ga., caused a shift of a significant volume of copper imports to Panama City, Fla., because of the lower inland costs available at that port. Natural Rubber The United States is considered a mature market in the rubber industry. It is a marketplace unlikely to produce radical changes in consumption or demand for natural rubber. In 2004, the demand for natural rubber in the United States was 1.1 million tons. According to the International Rubber Study Group, that figure is expected to increase to 1.3 million tons during the next 15 years. If these projections are accurate, the annualized growth rate would be approximately 1.7 percent per year. The United States produces no natural rubber. Thus, 100 percent of the demand for this product will be satisfied by imports. The Port of New Orleans is the number one port in the United States for natural rubber imports. Rubber imports move through the Port to tire manufacturers located in the Midwest. Port of New Orleans Photo: Donn Young New Orleans is the leading port of entry for natural rubber entering the United States. 1. Availability of liner service. 2. Superior inland rail connections. 3. Local expertise in handling rubber imports. 4. Free-time and warehousing. Natural rubber is expected to remain a major import. Currently, rubber arrives at the Port in metal baskets. However, rubber can be easily containerized which minimizes specialized handling requirements. Despite the potential for increases in the containerization, growth and retention of the Port s rubber business is expected due to the availability of excellent liner service connections. Rubber imports in the United States emanate primarily from Indonesia and Malaysia. A shift to West Coast ports is possible due to increased containerization of rubber and the possible development of a rubber distribution center in Memphis, Tenn. Rubber would be off-loaded at West Coast ports and transported by train to Memphis or other distribution points in the Midwest. Forest Products New Orleans has been the port of choice for rubber importers for four reasons: Demand for forest products is closely tied to population growth. According to the United Nations, global population is projected to grow 27

28 Charting the Future of the Port of New Orleans from 6.1 billion in 2000 to 10 billion in 2050, thereby indicating continued growth in forest product demand. Demand for both imports and exports will continue to grow due to increasing specialization and shifting production to countries with low labor costs. For these reasons, the Port anticipates continued growth in forest products. Breakbulk forest products handled at the Port have declined somewhat over the last five years. This is largely due to a shift in paper products into containers. The potential for containerization of forest products is high and increasing in all commodity types. Cargo volumes for breakbulk frozen poultry (shown above) have grown substantially in the last six years. Port of New Orleans Photo: Donn Young Plywood imports from China have recently increased at the Port. Additionally, for the first time the Port is handling wood pulp imports from South America. Further containerization of forest products is anticipated with the exception of the aforementioned wood pulp. Forest products are expected to continue to move through the Port in containers. Paper exports that arrive at the Port as breakbulk cargo are now being stuffed into containers for shipment overseas. Even as containerized cargo increases, forest products will continue to require breakbulk terminal capacity once the container is grounded and is either stripped or stuffed. Despite the fact that this cargo may not show up in cargo statistics as breakbulk, it still must be accommodated at the Port as breakbulk cargo. Refrigerated Cargo The Board s refrigerated cargo facility has experienced a boom in its international business segments over the last six years. The primary export commodity at this facility is frozen poultry. From 2000 to 2005 shipments of frozen poultry increased from 127,000 tons to more than 300,000 tons. This last volume generated revenues to the Port of more than $1.5 million dollars that year. As with virtually all breakbulk commodities, the shift into containers is a real possibility. This could have a particularly damaging impact on shipments through New Orleans, as other freezer operations are located in port cities (Houston and Charleston) with more frequent and extensive container services than New Orleans. On the positive side, however, it appears the breakbulk shipment of frozen poultry will continue at its present levels at the Port of New Orleans for the next 10 to 15 years. 2. CONTAINER CARGO After enjoying steady growth in containerized cargo tonnage and TEUs (20-foot equivalent units) between 2002 and 2004, the Port experienced a decline in the number of containers handled largely due to the adverse impacts of Hurricane Katrina in August These impacts included the near cessation of operations at the Port s dedicated container terminals for the last quarter of 2005 and the loss of container terminal capacity at France Road Terminal Berth 1. It should be noted that tonnage and TEU totals cited do not include empty containers. Empties increase TEU counts by approximately 25 percent. In 2002, the Port handled 2.8 million tons (241,854 TEUs). By 2004, container tonnage had grown to nearly 3.2 million tons (258,448 TEUs). The Port s container tonnage declined to less than 2.6 million tons (203,411 TEUs) 28
 in 2006.")
29 Market Assessment Port of New Orleans Photo: Donn Young Containerized cargo currently makes up more than 70 percent of the value of seaborne trade, according to Drewry Shipping Consultant Ltd. in 2005 and approximately 2.3 million tons (175,905 TEUs) in The continuing decline in containerized cargo experienced in 2006 reflects the loss of a container liner service that had called at France Road Terminal. Vessels belonging to this service resumed calls at the Board s Napoleon Avenue Container Terminal in late However, it remains unclear whether this service will continue to call at the Port or relocate to a competing Gulf port in the nottoo-distant future. Despite the Katrina-related short term decline in container volumes, the outlook for growth opportunities in containerized cargo is strong. This assessment is based on projected growth in the global, North American and United States Gulf container markets as well as other factors related to United States port capacity constraints and industry trends. The main factors identified as contributing to container traffic growth are: World trade growth; Growth of containerized cargo as a percentage of world trade; Manufacturing relocation to Northeast Asia (China); Regional and intraregional demand growth; and The provision of necessary container terminal capacity and related infrastructure at East Coast ports. Growth in Global Container Trade Drewry Shipping Consultant Ltd. estimates that containerized cargo currently makes up more than 70 percent of the value of seaborne trade. In 2006, that resulted in about 346,000 container shipments daily. By 2014, daily container shipments will increase by over 75 percent to 600,000 container shipments daily. Growth in world trade is closely correlated to economic growth. Between 1995 and 2005, global trade grew at almost twice the rate of the world economy and this trend is expected to continue. Growth in container shipping not only exceeds global economic growth but also is growing at a faster pace than merchandise exports. This occurs not simply because container transport is the preferred shipping option for international trade but also because of the continued conversion of breakbulk cargo to containers, a greater percentage of movement of high value cargo by container and free trade initiatives which facilitates the global sourcing of goods. Drewry/Global Insight estimates that world container traffic will grow steadily from more than 100 million TEUs (loaded containers shipped internationally) in 2005 to well over 150 million TEUs by By 2015, container traffic will exceed 230 million TEUs and, by 2020, it will surpass 300 million TEUs. Asia, specifically China, has a vast pool of 29
30 Charting the Future of the Port of New Orleans low cost labor. As China opened its economy during the past 20 years, numerous United States and international firms have relocated their manufacturing facilities to China to take advantage of low cost labor. Even manufacturing capacity that had been previously relocated to Mexico and Latin America because of their low labor costs is now relocating to Asia. As a result of this economic transformation, global trading patterns have been altered. East Asian trade is the major factor in the global container market growth. The Economist reports that worldwide global merchandise trade is growing at about 15 percent annually and exports from China at nearly twice that rate. Trade between China, India, Europe and the United States makes up 65 percent of the more than 250 million containers (including empties) moved globally a year. The China trade is anticipated to moderate in coming years, but note that the trend is toward slower growth, not decline. China is taking major steps to expand and improve its transportation infrastructure to enhance the flow of exports. China is planning and constructing port terminal capacity to accommodate 130 million TEUs by 2020, and is midway through completion of a 55,000 mile highway system linking inland and coastal regions. China has also entered to an agreement with the Burlington Northern Santa Fe Railroad to assist in improving intermodal rail service. Growth in the North American Container Trade Significant short and long term growth is also anticipated in the North American container market. Between 2005 and 2015, container volumes are expected to grow at a rate of 8.5 percent annually from 46.3 million to 85.7 million loaded TEUs. The annual growth rate is projected to decline slightly to 6.4 percent from 2015 to 2020, reaching million loaded TEUs. Trade with Asia, particularly China, is the driving force in the United States container trade. As a measure of the rapid growth of this trade between 1997 and 2003, the Journal of Commerce/PIERS reports that United States containerized imports on the Northeast Asian trade route grew by 108 percent from 3.76 million TEUs to 7.83 million TEUs. China now accounts for about 63 percent of the trans- Pacific market, accounting for some 7.4 million TEUs in Growth in the United States Gulf Container Trade Growth is also anticipated in the United States Gulf container market, although not at the rate projected for North America. This is largely due to the predominance of the Asian trade in the North American market. United States Gulf container volumes are projected to grow from 2.3 million TEUs in 2006 to 3.6 million TEUs in Container Market Trends While anticipated growth in container traffic supports the need for expanded container terminal capacity nationally, other important factors bolster expansion in specific port ranges, particularly the East Atlantic and Gulf Coast. Sustained growth in Asian trade has severely taxed both the port and inland transportation infrastructure on the West Coast. The potential for future labor problems, such as the 2002 strike by the International Longshore and Warehouse Union (ILWU) that paralyzed West Coast port operations, also cause shippers concern regarding port reliability. Both costs and cargo transit times have increased at West Coast ports, and, as a result, East and Gulf coasts have become more competitive for Asian containerized cargo being shipped to Eastern and Midwestern markets. Asian cargo has shifted as shippers focus on port reliability and the availability of adequate transportation infrastructure. This assessment is born out by the fact that although cargo volumes have continued to grow at West Coast ports, their market share of Asian cargo has declined. Furthermore, major retailers, who depend on the timely delivery of low-cost Chinese imports, have invested in significant distribution-center capacity adjacent to East 30

31 Market Assessment Coast and Gulf Coast ports along with existing or planned container terminal capacity. In response to these developments, container liner services and their affiliated terminal operating companies as well as other major port holding companies have sought to either lock up container terminal capacity or develop their own terminals to assure available capacity for their customers. A combination of advantages, including provision of container terminal capacity; deep water harbor access; significant distribution center development; adequate and low cost inland market access; and the availability of all-water liner service to Asia, has resulted in phenomenal growth in container volumes handled at major ports on the East Coast. Similar trends are starting to play out on the Gulf Coast as well. Houston, which benefits from its major population base, has provided significant container terminal capacity and has experienced expansion of container liner services and distribution center development. New players in the Gulf container market like Mobile and Tampa are emerging as well. With new container terminal capacity and all-water Asian liner service, these ports are poised to both take advantage of container market growth opportunities and threaten the Port of New Orleans existing cargo base. Another important factor affecting the rate of growth of Asian cargo in the Gulf is the planned expansion of the Panama Canal. Shippers value all-water service over land-bridge service because of its reliability and lower cost. The canal s existing dimensions prevent vessels with 5,000 TEU capacity or greater from using the facility and limit the availability of all-water service to the Gulf from Asia. The Panama Canal, part of which is showm above, is operating at 93 percent capacity and an expansion project is being planned. According to the World Shipping Council, in 1999, vessels of more than 5,000 TEUs comprised about 2% of a global fleet of 2,449 vessels providing a total capacity of 4 million TEUs. By 2006, the larger vessels represent 10 percent of the 3,641-ship fleet providing 8 million TEUs of capacity. The increased use of larger vessels allowed container carriers to double capacity even though the number of vessels only increased by 50 percent. The Council estimates that by 2011, more than 50 percent of the capacity of the global fleet will be made up of vessels that cannot transit the canal. Apart from size constraints, the Panama Canal is operating at a reported 93 percent capacity, which also serves to limit opportunities for increased container traffic. Over the past ten years, the canal completed a $1 billion improvement program that increased capacity by 20 percent. Despite these improvements, the canal will reach its maximum sustainable capacity between 2009 and Once it reaches capacity it will be unable to meet demand growth and service quality will deteriorate. The purpose of the expansion project is to assure available capacity to handle continuous Photo Courtesy of the Panama Canal Authority 31
32 Charting the Future of the Port of New Orleans growth in the number of vessel transits and vessels size. In recent years, the container ship segment has supplanted the dry bulk segment to become the canal s primary income generator and the main driving force of canal traffic growth. In 2005, this segment accounted for 98 million Panama Canal tons (a unit of measure used to establish tolls), 35 percent of the total tonnage transiting the canal. Trade between Northeast Asia and the United States East Coast accounts for 50 percent of the containerized cargo segment, and is anticipated to be the key driver of canal cargo growth. Between 1999 and 2004, the Panama Canal s share of the Northeast Asia/United States East Coast container trade grew from 11 percent to 38 percent. The canal s major competitor for this trade is the United States intermodal system. At 61 percent, the intermodal system has a higher share of the trade. It offers shorter transit times, but higher costs and variability of service dependability. Also, the intermodal system enables container carriers to take advantage of the economies of scale offered by the use of larger post-panamax vessels. Growth in the canal s share of Asian trade is attributed to a reduction in canal transit times, reduction in intermodal system reliability due to congestion problems and an increase in distribution centers for Asian imports located close to United States East Coast ports and end-consumer areas. The Suez Canal also competes for this trade and has a one percent share of cargo. Despite longer transit times, the Suez route s advantages are that it avoids West Coast congestion and allows the employment of post- Panamax vessels. Panama Canal Authority (PCA) marketing studies indicate that under the most probable demand scenario the canal s tonnage will almost double during the next 20 years, increasing at an average rate of 3 percent per year. Canal containerized cargo will grow at an average annual rate of 5.6 percent from 98 million Panama Canal tons in 2005 to nearly 296 million tons in The $5.25 billion Panama Canal expansion will create a new lane of traffic with construction of a third set of locks and other navigation improvements, and will be able to handle post- Panamax container vessels. The PCA says that the expansion project will double canal capacity to more than 600 million Panama Canal Tons, providing sufficient capacity to accommodate anticipated booming demand for the next 20 years. The project is expected to be completed by 2014 and is not anticipated to interrupt current canal operations. Although the PCA s market assessment focuses on the United States East Coast range, port authorities, terminal operators and carriers anticipate that completion of canal improvements as well as anticipated overall growth in container traffic and the other market trends discussed above provide significant opportunities for growth in container volumes for the Gulf Coast port range too. Both opportunities and threats exist regarding the ability of the Port of New Orleans to participate in container market growth. To a large extent, the past and current local market trends are irrelevant because of the rapidly evolving global marketplace. Ports in the Gulf and South Atlantic ranges that compete with New Orleans for containerized cargos are investing heavily in new container terminal and infrastructure capacity to support distribution center development and are actively courting carriers and terminal operators. A discussion of the ongoing congestion problems at West Coast ports and a survey of the development issues and actions of major competing ports follows. This survey demonstrates how container market trends are playing out in the port industry and clearly indicates that, in order to capitalize on these trends, the Port of New Orleans must aggressively respond to marketplace challenges by providing needed capacity, addressing transportation infrastructure needs and marketing for all-water Asian liner service. West Coast Port Congestion As noted earlier, the North American container market is dominated by growing trade with Asia, particularly China. 32
33 Market Assessment Approximately 97 percent of United States trade with China is containerized. West Coast ports are strategically positioned to capture the majority of Asian trade and currently account for approximately 52 percent of total United States containerized trade. The ports of Los Angeles and Long Beach handle an excess of 7.4 million TEUs annually. Despite the West Coast s geographical advantage and market dominance of this trade, opportunities may arise for the Port of New Orleans to capture some of this trade. This is particularly true for containers destined for Midwestern markets because of rising costs and transit times related to port and inland transportation congestion and capacity constraints as well as uncertain labor conditions. West Coast ports are experiencing longer container transit times and, as a result, rising costs due to terminal capacity constraints and heavily congested road and rail networks. The imbalance in trade with China means that large numbers of empty containers also clog ports. Costs per container are forecasted to increase by 11.1 percent by 2008 due to increased transit times resulting from port congestion. Despite the diminishing availability of land suitable for terminal expansion, major West Coast Ports can forestall capacity overload in the short term through improved productivity and capacity utilization. However, such improvements do not address the rising concerns of area residents with regard to congested transportation networks nor the limitations imposed by the fundamental lack of space for expansion. Notably, with the exception of the Port of Prince Rupert in Northwestern Canada, no new significant terminal capacity expansion is currently planned on the West Coast. Recent labor problems have also raised serious concerns related to the ongoing reliability of West Coast ports. In 2002, the ILWU went on strike and effectively halted the flow of goods from these ports. Following the strike, shippers, sensitive to supply chain disruptions and increasingly frustrated by congestion and rising costs, have sought alternative entry points to reduce risk and dependence on West Coast ports and cut overall transportation costs. The current labor contract with the ILWU expires in In anticipation of a repeat of the work stoppages that occurred in 2002, carriers and terminal operators are actively seeking to lock up spare terminal capacity. Northwest Pacific Coast ports, such as Oakland, Seattle, Tacoma and Vancouver, are also well positioned to serve the Asian trade and have absorbed container traffic from over-burdened southwest Pacific Coast Ports. These ports currently have sufficient existing terminal capacity and planned incremental terminal expansions to accommodate projected cargo growth for the foreseeable future. However, the continued diversion of cargo from southwest Pacific Coast ports will alter this scenario and result in terminal as well as inland transportation congestion problems. Northwest Pacific Coast ports also operate under West Coast labor agreements and are subject to potential throughput disruptions resulting from contract disputes. Although overall cargo volumes through West Coast ports continued to increase in the aftermath of the 2002 strike, their market share of containerized Chinese exports to the United States dropped by more than nine percent between 2000 and East Coast Ports were the immediate beneficiary of supply chain restructuring, experiencing an eight percent increase in containerized Chinese exports. Gulf ports market share increased from 0.8 percent to 2.2 percent during the same period. Shippers have and continue to explore a variety of port options in response to the problems experienced at West Coast ports. Shippers have found that the total cost of routing Asian cargo to East Coast ports via the Suez Canal is competitive, especially for cargo destined for eastern United States markets. Asian cargo is currently shipped to Gulf ports via the Panama Canal; however, the canal s size limits participation in the container market because it prevents transit 33
34 Charting the Future of the Port of New Orleans Table 4 Comparative Analysis of Capital Improvement Plans for Competing Ports Port Description Cost Estimate Subtotal by Port Virginia Port Authority (VPA) Savannah & Charleston 291 acre container terminal Rail corridor linking railways, raising tunnel and bridge clearances Bi-state authority 1,800 acre container terminal Harbor deepening (completed) $450,000,000 $251,000,000 $701,000,000 $500,000,000 $500,000,000 $148,000,000 $857,000,000 Charleston New container stacking equipment, cranes and other enhancements $159,000,000 Savannah 280 acre container terminal New berths, cranes and additional container capacity $550,000,000 $100,000,000 $100,000,000 Wilmington Container Terminal Expansion $143,000,000 $143,000,000 Jacksonville Capital improvements over last decade $200,000,000 $200,000,000 Port Everglades Capital improvements $572,400,000 $572,400,000 Miami Houston Gulfport Mobile Infrastructure improvements designed for post Panamax vessels Cargo enhancement, vehicle safety and mobility Long range plans for corridor development and improvements to freight rail Long range plans for hurricane recovery including mixed use development and shipping facilities New dedicated container terminal with an intermodal rail facility and distribution complex Expanded and dedicated container facility $250,000,000 $254,500,000 $655,000,000 $4,000,000,000 $4,655,000,000 $300,000,000 $300,000,000 $300,000,000 $300,000,000 $40,000,000 $1,663,700,000 Tampa Short term portwide capital improvements Phase I new container terminal & distribution warehouse center Phase 2 container terminal $362,000,000 $130,700,000 $600,000,000 Harbor deepening for phase 2 container terminal $530,000,000 Total for All Ports $10,246,600,000 34
35 Market Assessment by the larger containerships commonly used in today s trade. Expansion of the canal locks to accommodate post-panamax vessels is in the planning stages and is projected to be completed by Another possibility is routing containers through Pacific Coast Mexican ports and creating a Mexican land bridge. Mexican ports may be well-positioned to serve the Southern Californian market; however, inland transport limitations, including insufficient rail clearance and an inadequate roadway network, render this approach too costly to serve Midwestern and Eastern United States markets unless significant investments in infrastructure improvements are made. Despite the problems facing West Coast ports, they will remain the preferred option for shippers and are expected to continue to dominate the Asian container trade. These ports have significant resources that should allow them to address near-term capacity constraints through improved technology and efficiency, enabling them to handle larger volumes of cargo before they reach a complete saturation point. Nevertheless, with customer trust and expectation on the line, port reliability is one of the highest priorities for shippers and ocean carriers. The need to assure the availability of adequate port capacity, a dependable labor force and lower costs prevents shippers from putting all their eggs in one basket on the West Coast. Shippers will seek out competitively priced shipping options and secure efficient terminal capacity, where available, to ensure that alternatives are in place. East Coast Container Terminal Capacity Expansion As noted, East Coast ports have been the primary beneficiary of shifts in Asian cargo and are eager to attract more. East Coast ports are also beginning to experience landside access problems and congested terminals; however, not to the same extent as West Coast ports. Some analysts have pointed out that because the East Coast is highly developed and populated, the provision of sufficient inland transportation capacity will become increasingly problematic and costly. Expansion of container terminal capacity has become a number one priority for most East Coast ports. East Coast ports have also benefited from development of distribution centers and the availability of all-water liner service to Asia. South Atlantic ports, primarily Norfolk/ Hampton Roads, Charleston, Savannah, Jacksonville, Port Everglades and Miami are better positioned to compete for the container trade in markets that could be served by New Orleans. Competing Ports Table 4 on the preceeding page presents a comparative analysis of long and short-term capital improvements plans from twelve ports located on the East and Gulf Coasts. Of the twelve ports, Houston and Tampa are planning the highest dollar amounts in investments for capital improvements. The cost for capital improvements for all twelve ports total $10.2 billion, with the average cost being $858 million. Surveys of Competing Ports Following are surveys of the ongoing container-related development initiatives that are thoroughly examined for each port listed in the summary table on the preceeding page: EAST COAST PORTS CONTAINER TERMINAL CAPACITY EXPANSION Virginia Port Authority The Virginia Port Authority s (VPA) plans for expansion of container terminal capacity and transportation infrastructure will ensure that it continues to be a major player in both the Midwest and Eastern container markets. VPA container terminals handled 2.05 million TEUs in Virginia ports enjoy the advantage of deepwater port access enabling calls by the largest container ships. The dredging of Hampton Roads/Portsmouth s 50-foot channel 35
36 Charting the Future of the Port of New Orleans to 56-feet was completed last year. The A. P. Moller-Maersk Group (APM) is developing a $450 million, 291-acre container terminal at Hampton Roads, effectively doubling the port s container terminal capacity. The 2.1 million TEU capacity terminal is slated to open in mid-2007 and will have 3,200-feet of berthing capacity (the terminal will have 4,000 feet of berthing capacity at full build out), six new container cranes and on-dock rail service. Construction of the new terminal will also free up 70 acres of container terminal capacity at the VPA s existing Hampton Roads terminal. APM terminal development has been cited as the major factor in locating distribution facilities for Lowes, Home Depot, Wal-Mart and Target near the port. Significant distribution center development is also occurring at Front Royal, Virginia s inland port that serves the Ohio Valley and Northeastern markets. The VPA, which operates terminals at Norfolk, Newport News and Portsmouth (Hampton Roads), is expanding container terminal capacity by 50 percent at the Norfolk International Terminal. Additionally, the VPA is planning to construct a new major container terminal at a former dredge disposal site acquired from the Corps of Engineers across the Elizabeth River from Norfolk. The first phase of the Craney Island facility is expected to be completed in approximately 10 years with six cranes and two berths. When full build-out is complete in 2032, the terminal will feature 22 cranes and berthing for eight container vessels. Virginia ports will also benefit from the federal government s Heartland Corridor Project. A joint venture with the Norfolk Southern Railroad, this project will reduce rail distance to Midwestern markets by 250 miles by linking railways and raising tunnel and bridge clearances in three states (Virginia, West Virginia and Ohio) to enable double stack trains to move more quickly to the heartland. The state of Virginia is contributing $22 million toward the $251 million project, which should be completed within five years. Georgia and North Carolina Container traffic has grown phenomenally at Charleston and, especially, Savannah in recent years largely due to increased container volumes exported from India and China via the Suez and Panama Canals. Traffic at Savannah has grown by double digits during the past five years. In 2006, Savannah handled 2.2 million containers, surpassing Charleston as the East Coast s second largest container port after New York/New Jersey. Despite expansions and technological improvements, both Savannah and Charleston are expected to reach maximum capacity in about 15 years. On March 12, 2007, the governors of South Carolina and Georgia together announced creation of a bi-state authority that will develop a $500 million, 1,800-acre container terminal on property owned by the state of Georgia and located on the Savannah River in South Carolina (12 miles closer to the sea than the Port of Savannah). Officials do not anticipate that development of the new terminal will adversely impact investments in the existing ports of Savannah and Charleston because of anticipated containerized cargo growth. No date was given for completion of the proposed Jasper County Maritime Terminal. It should be noted that this project still has numerous political, legal and environmental hurdles to be overcome before it becomes a reality. Charleston The Port of Charleston handled 1.97 million TEUs of containerized cargo in Charleston has also completed or will undertake a number of projects to enhance its participation in the container market. These include: a $148 million harbor deepening and widening project providing 45-foot access to all container terminals (completed May 2004); a two-year $159 million capital improvement program that provides new container stacking equipment, container cranes and other enhancements that translate into 400,000 TEUs of additional capacity; and development of a new $550 million, three-berth, 280-acre container terminal at the former Charleston Naval Complex that will provide an additional 1.3 million TEUs of container terminal capacity. 36
. Charleston has hit some snags in the development of the new terminal.")
37 Market Assessment Photo Courtesy of the South Carolina Ports Authority Charleston recently completed a $150-million harbor deepening project and in May 2007 broke ground on a new $550-million container terminal at the former Navy Base (pictured). Charleston has hit some snags in the development of the new terminal. The final Environmental Impact Statement has been delayed due to concerns about whale breeding grounds. Separately, the State Department of Health has decided to revisit its permit for a connector road linking the proposed terminal with I-26 based on a complaint by a property developer and community concerns regarding congestion on I-26. The South Carolina Ports Authority will have great difficulty raising funds for the terminal until road issues are resolved and the road is fully funded. Opponents want the ports authority to abandon this site and focus on the Jasper County facility. The state of South Carolina has also taken action to attract more distribution center development through an international trade incentive program. The program provides a pool of $8 million for state income tax credits for companies that meet a base cargo volume requirement and increase volume by a minimum of 5 percent annually. Savannah At the Port of Savannah, 65 percent of all imports and exports are from Asia. The port s dedicated container terminal, the 1200-acre Garden City Terminal provides1.3 million square feet of covered storage. The terminal has 15 cranes (11 post-panamax and four super post-panamax) Savannah recently completed the initial phase of Container Berth 8 terminal development which provides an additional 1,100 feet of berthing and 30 acres of paved marshaling area. The container capacity at the Garden City Terminal is 2.5 million TEUs. The Georgia Ports Authority is currently implementing a $100 million capital improvements program that will add berths and cranes and enhance container terminal capacity and density improvements including the acquisition of four super post-panamax Cranes, rubber tire gantry cranes and other improvements required to accommodate a projected 9.1 percent annual growth in container volumes. The port s strategic planning calls for increasing terminal capacity to 4.37 million TEUs by 2015 and almost 6 million TEUs by 2020 to accommodate a projected 6 percent to 8 percent annual growth in containerized cargo over the next 15 years. Burgeoning trade with Asia and port infrastructure improvements have also attracted new distribution center development. The state of Georgia has also been successful using state tax credits to lure distribution center development. Target, Ikea and Pier One distribution centers are coming online with 2 million square feet of storage capacity each. 37
38 Charting the Future of the Port of New Orleans Port officials report that there is enough prime real estate in the Savannah area to support the construction of 2.5 million square feet of distribution center space each year for the next ten years. Savannah area distribution centers cover more than 14.7 million square feet and generate more than 300,000 TEUs annually. Wilmington A $143 million container terminal expansion program is underway in Wilmington, N.C., that will double the Port s handling capacity to 400,000 TEUs per year. The terminal infrastructure upgrade includes acquisition of four new container cranes. In anticipation of continued growth in container volumes during the next 10 to 15 years, the North Carolina State Port Authority has engaged an engineering design firm to manage the planning process for development of the proposed NC International Port, a 600- acre terminal site located on the west bank of the Cape Fear River. Jacksonville Jacksonville derives a major portion of its cargo from trade with Puerto Rico. It is a hub for Crowley and Horizon Lines, which are both active in the Puerto Rican trade. In recent years, the port has experienced increased trade with Asia. The port is undertaking significant improvements to capitalize on growth in the Asian trade. During the past decade, Jacksonville has expended more than $200 million on improvements to its three terminals and harbor, much of it targeted to accommodate increasing containerized cargo volumes. Container volumes have grown from 683,836 TEUs in 2002 to 768,239 TEUs in In March 2007, the Jacksonville Port Authority entered into an agreement to begin construction of the new Dames Point or Trans Pacific Container Service Corporation (TraPac) Terminal. The 130-acre terminal will have 2,400 feet of berthing capacity and six container cranes. It is slated to commence operations in late It is a single-user facility that will be used by Mitsui O.S.K. Lines (MOL) for vessels engaged in the Asian trade. The terminal will be operated by TraPac, MOL s terminal operating partner. The initial capacity of the terminal will be 250,000 TEUs, comprised mainly of Asian cargo. MOL expects throughput to reach 800,000 TEUs per year, doubling Jacksonville s annual container throughput. An additional 70 acres are available for terminal expansion. The Dames Point Terminal has proved to be an important bargaining chip in attracting distribution center development. Projects currently being developed at the terminal include a 300,000 square foot southeast regional distribution center for the craft giant Michael s Stores Inc., and a 400,000 square foot distribution center for Laney & Duke Warehouse Terminal Company. Jacksonville s other principal terminals include the 173-acre Talleyrand Terminal with a recently constructed 553,000 square foot warehouse and the 730-acre Blount Island Marine Terminal (automobiles). Jacksonville has set aside 100 acres adjacent to Talleyrand Terminal for future container terminal development. The St. Johns River deepening project increased a 14-mile stretch of the river to 40 feet. Due to increased vessel sizes, the port also plans to deepen the channel from the Dames Point Terminal to the Talleyrand Terminal to 41 feet. Port Everglades Port Everglades, Fla., is emerging as an important player in the South Atlantic Coast container market. The port ranks 12th in the U.S. in the volume of containerized cargo. Port Everglades does not publish portwide TEU data but reports that container tonnage grew from 4.09 million tons in 2000 to 5.07 million tons in Much of Port Everglades trade is with Central and South America, but it too has experienced growth in Asian cargoes. Chiquita operates a 13.1 acre container terminal and 52,000 square foot warehouse that handles approximately 30,000 containers 38
39 Market Assessment annually. In December 2004, a 39-acre container terminal at Southport was opened. The facility was leased to Mediterranean Shipping Co. and its terminal management company, Port Everglades Terminals. The terminal handles approximately one million tons of containerized cargo annually. Florida International Terminals commenced container operations at the port in July 2005 with a throughput of 70,000 TEUs. APM (Maersk) operates a 44-acre terminal that handled 90,234 TEUs in In June 2006, COSCO/Evergreen inaugurated an all water service to the Far East that is expected to generate 300,000 tons or 38,500 containers in its first year of operation. Maersk initiated its new NASA service linking the east coasts of North and South America in October It is projected to move about 26,000 TEUs through the APM terminal per year. In 2005, Port Everglades proposed a $572.4 million capital improvements program that includes $140 million in improvements for cargo facilities. Information on specific projects is currently unavailable. Miami Miami is the largest container port in Florida, handling more than 1 million TEUs in Because of its geographical position and cultural connections, Miami has always been a strong competitor for Latin American cargo. Although Latin America accounts for more than half of the cargo handled at Miami, the Far East is the fastest growing region for the Port due to increased Asian trade. Miami has just completed $250 million in infrastructure improvements, including improvements designed to accommodate post- Panamax vessels. The addition of 1,145 feet of berthing space brought the total wharf length to 6,120 feet. The port acquired two super post-panamax cranes and is refurbishing and upgrading its original 10 gantry cranes. Miami intends to purchase additional super post-panamax cranes by Phase II of the Port of Miami Harbor Dredging Project was completed in 2005 providing a channel and turning basin depth of 42 feet. Prior to completion the port had only two cargo berths for larger container vessels. The deepening project provided four additional berths capable of handling deeper draft vessels. Miami is now conducting a study with the Corps of Engineers to deepen its channel to 50 feet, enabling it to accommodate the largest container vessels. To improve landside access, the Florida Department of Transportation, Miami-Dade County, the Port of Miami and the City of Miami will undertake construction of a tunnel connecting the port with the Interstate system. The project will be procured as a public-private partnership meaning that the concessionaire will finance the project based on the expectation of earning availability payments contingent upon actual lane availability and service quality. The local partners will share 50 percent of the capital cost of the project. Selection of a bidder is anticipated in April 2007, and the tunnel could be operational by During the past 10 years, the Port of Miami Terminal Operating Company (POMTOC) reports averaging 10 percent annual growth. This growth trend is expected to continue due to the increase of Asian cargo through the Panama and Suez Canals. In March 2007, POMTOC broke ground for a new $4.5 million state-of-the-art 16-lane gate system to improve gate transactions and reduce delays. Miami s trade with Asia is also bolstered by the availability of numerous all water service to the Far East, including two new services initiated in 2006: Evergreen/COSCO s China express service (calls at Panama, Miami and Savannah), CKYH alliance (also calls at Savannah, Charleston and Norfolk). GULF PORTS CONTAINER TERMINAL CAPACITY EXPANSION Although the volume of containerized cargo from China has grown at Gulf ports, market share growth has been slight. Nevertheless, significant container cargo growth is anticipated in the Gulf. The Texas Transportation Institutes estimates container volumes in the Gulf to grow at an annual rate of 13 percent over the next 10 years. Supporting this anticipated growth, 39
40 Charting the Future of the Port of New Orleans shippers are investigating the option of calling at Gulf ports and carriers are locking down container terminal capacity. In response, Gulf ports have brought or are planning to bring new container terminal capacity online. Prior to Hurricane Katrina, the three major Gulf ports participating in the container market were Houston, New Orleans and Gulfport. Factors such as new container terminal development and expansion as well as the near term impacts of the storm may ultimately change this ranking. Houston s domination of the Gulf s container trade and container trade with Asian markets does not appear to be threatened; however, competition for containerized cargo entering the Gulf and not bound for the Houston market is intensifying. There are two new players in the Gulf container market: Mobile and Tampa. Mobile is in the process of opening up a new container terminal and offers the strongest competition for the Port. Tampa is expanding container terminal capacity and receiving increasing amounts of Asian cargo. Anticipated containerized cargo growth in the Gulf, increased competition, and opportunities to provide alternatives to a relatively congested Houston for service to inland markets necessitates that New Orleans take steps to assure the availability of adequate terminal capacity to maintain its second place ranking. Houston The Port of Houston handles about 64 percent of the Gulf s containerized cargo and approximately 80 percent of the Gulf s trade with China. Houston enjoyed continuous and sustained growth in container volumes during the past 10 years. In 2006, Houston handled 1.6 million TEUs, up from 797,000 TEUS in By 2005, the port s Fentress Bracewell Barbours Cut Container Terminal was operating at 150 percent capacity and experiencing congestion problems. In February 2006, the first phase of the Bayport Container Terminal opened with six berths (6,000 feet of continuous quay), 230 acres of container marshaling area and 12 wharf cranes. When completed in approximately 15 years, the terminal will have a total of seven container berths, a 378-acre marshaling yard and a 123-acre intermodal facility with the capacity to handle 2.3 million TEUs annually. Although additional capacity has eliminated terminal congestion problems, terminal expansion coupled with the opening of a new Wal-Mart distribution facility anticipated to bring one-quarter to one-half million TEUs to Houston annually have contributed to growing rail and roadway congestion problems. The Houston freight rail system is plagued with numerous at-grade crossings resulting in roadway and rail line congestion. Harris County, the Port of Houston Authority and the City of Houston have developed a plan including short and long range solutions involving elimination of 900 at-grade crossings and developing consolidated rail corridors to divert through train traffic. State funding totaling $655 million is being sought to implement short range plans to enhance cargo flow from the port and improve vehicle safety and mobility. An additional $4 billion will be needed to implement long range plans, including corridor development and removal of freight rail movements to the outer reaches of the metro area. Additional dollars are being sought to fund needed port access roadway improvements. Much of the container traffic entering Houston is destined for retail distribution facilities scattered throughout the metropolitan area and it is unclear whether short term planned improvements will be totally effective in eliminating congestion. Moreover, the type of improvements under discussion will take many years to develop. Inasmuch as funding is not in place for major improvements, no definite timetable for construction is available at this time. Inland transportation congestion and associated higher costs translate into an opportunity for 40
41 Market Assessment New Orleans to more efficiently serve markets outside of the Houston metro area, including Dallas and Kansas City. Gulfport Gulfport has ranked as the third busiest container port on the Gulf. Gulfport was severely impacted by Hurricane Katrina, 700,000 square feet of shed space, including a 100,000 square foot freezer facility with 3,000 square feet of blast freeze capacity, and rail connections within the port were destroyed. The port is reported to be back up to about 60 percent capacity. In March 2007, it completed construction of a 105,000 square foot warehouse with 805 feet of docking space, rail access and the capacity to store 7,000 tons of paper and other commodities. The port expects to add 60,000 square feet of storage capacity by November 2007 and another 230,000 square feet of warehouse by mid Gulfport s container activity is attributable to two niche services: Chiquita and Dole banana imports and Crowley s Ro/Ro Gulf/ Central America service. The port does not have dedicated container facilities. Dole/ Chiquita containers are loaded/discharged using ship s gear. In 2005 (2006 data is not available), Gulfport handled 187,384 TEUs of containerized cargo, down from 213,102 TEUs in As of August 2006, import tonnage was reported to be 41 percent of pre-katrina level and exports were down 18 percent. Both Dole/Chiquita and Crowley were able to resume service in the months following the storm. Banana imports are by far the largest commodity handled at Gulfport. In 2005, the port handled 642,561 tons of bananas out of some 2 millions tons of total cargo. Prior to Katrina, Chiquita had expressed the desire to relocate its service to another port. As of this date, no decision has been announced. The loss of refrigerated warehouse capacity has wiped out Gulfport s frozen poultry exports. In 2005, Gulfport handled 116,961 tons of containerized frozen cargo (down from 140,818 tons in 2004). Poultry exports had been in decline prior to Katrina largely due to outdated facilities. Since the storm, poultry exports have shifted to New Orleans, Mobile, Jacksonville and Houston. Although officials at the Mississippi State Port Authority have indicated that stateof-the-art freezer facilities will be constructed, as of this writing no plans or timeline have been provided. As noted, the container business at Gulfport is highly specialized. Nevertheless, Gulfport has enjoyed success in its niche businesses. The port s ability to participate as a major player in the container industry is constrained by both spatial and transportation-related limitations. The port s size, 184 acres with 15 acres used for casino-related purposes, and location effectively prohibits significant container terminal development. Additionally, rail and roadway capacity constraints hamper terminal operations. In the 90s, state transportation officials floated the idea of constructing an elevated interstate quality roadway linking the port and downtown Gulfport with I-10. The proposal met with significant public opposition. The roadway was to be built in two phases. The second phase, a 7,000-foot elevated road crossing the downtown area, has been postponed indefinitely. The Mississippi Department of Transportation cited the changing nature of the port and downtown Gulfport post-katrina as well as the possible relocation of the CSX railway as reasons for delaying the project. The future of Gulfport in the aftermath of Katrina remains unclear. Even before the storm there was ongoing debate about the port s direction and speculation regarding redevelopment of the port as a recreation facility or for cruise and casino operations. To date, there have been no official announcements. Port officials insist that they are not phasing out their shipping business and are in the process of preparing a long term master plan (required to get $300 million in recovery money from the federal government) that will include gaming, condominiums, a cruise terminal and shipping facilities (including new freezer capacity). In March 2007, Gulfport 41
 hired an engineering firm to conduct a market feasibility and engineering study for development of the Choctaw Point Terminal.")
42 Charting the Future of the Port of New Orleans awarded a $29.5 million contract for repairs to the hurricane-ravaged Pier One and Pier Two facilities. Mobile In 2002, the Alabama State Port Authority (ASPA) hired an engineering firm to conduct a market feasibility and engineering study for development of the Choctaw Point Terminal. The study concluded that Mobile has the potential to become a world class container port because of its deep water access, rail and interstate connections, availability of land for expansion, and strong community, state and federal support. The study also recommended development of an intermodal facility and a warehouse/distribution facility served by a dedicated roadway and overpass. The study defined Mobile s potential existing market as the area where the port had a minimal marginal advantage over competing ports. The market size was determined to be 451,000 TEUs or more than 23 percent of the total Gulf North/South market. The study projected growth in container traffic based on a fifty percent capture of all growth in container traffic where Mobile has a transportation cost advantage. Based on these findings, the study projects that Mobile will have container volumes totaling 45,811 TEUs in 2005, 290,810 TEUs in 2010, 364,140 TEUs by 2015, 613,900 by 2020 and 863,659 by 2025 (includes empties). Under this market scenario, a terminal development program is proposed in three phases to accommodate growth through The ASPA will open the initial phase of its first dedicated container terminal sometime in the second half of At full build out of the 135-acre $300 million Choctaw Point Container Terminal, which will include a separate intermodal rail facility and modern distribution complex, will have 6,000 feet of berthing space with 45-foot draft alongside berth, a 45-foot draft main channel and an 800,000 TEU capacity. The terminal will have excellent access to Interstates 10 (immediate) and 65 (three miles) and access to five Class I railroads A study commissioned for the Alabama State Port Authority recommended the development of an intermodal facility and a distribution center served by a dedicated roadway and overpass. (direct access for CSXT and CN and access via the ASPA Terminal Railroad for NS, BNSF and KCS). The first phase will occupy 95 acres and have a 350,000 TEU capacity. The ASPA entered into a concession agreement with Mobile Container Terminal LLC to develop the terminal. Mobile Container Terminal is a joint venture between APM Terminals North America (80 percent), a subsidiary of Maersk Inc. and Terminal Link S.A. (20 percent), a division of CMA CGM. APM Terminals is a major container terminal owner and operator with operations at more than 35 terminals worldwide. Maersk and CMA CGM are both leading global container shipping lines. ASPA and Mobile Container will jointly invest in terminal infrastructure with Mobile Container Terminal providing all buildings and equipment. Photo Courtesy of the Alabama State Port Authority 42

43 Market Assessment During the past decade, Alabama has experienced accelerated growth in the automobile manufacturing and supplier industry. Alabama is the home of more than 350 automotive-related manufacturers. Mercedes Benz, Honda and Hyundai have located auto assembly plants facilities in Alabama, and Toyota and International Diesel operate engine plants in the state. In 2005, more than 760,000 vehicles were produced in Alabama. Mobile will also be well-positioned to serve the new Toyota auto assembly plant being constructed in Tupelo, Miss. Serving this burgeoning industry is cited as one of the driving forces in the development of Choctaw Point. It is estimated that Hyundai alone will generate 40,000 TEUs annually for the terminal. With regard to the Asian trade, Mobile has benefited from being a port of call on Zim s Asia - Gulf Express Service (AGX). This all water biweekly service employs seven new 3,000 TEU Panamax container ships. It has a 32-day transit and also calls at Houston and Tampa. Mobile is poised to be amajor competitor with New Orleans for Gulf container cargo. Along with container terminal development, the port has the potential to develop a strong captive cargo base because of the state s significant and growing industrial base. The port estimated that the local container market (metro Tampa) consisted of more than 250,000 containers, most of which were being trucked at considerable cost to South Florida ports or Savannah. Tampa is also emerging as a major distribution center gateway for the central Florida region. Rooms-To-Go, Pepsico, Lowes, Wal-Mart and Haverty s have opened distribution centers in Tampa in recent years. In 2006, an estimated 30,000 TEUs moved through Tampa. The new container facility attracted new liner services, which accounts for the increased number of TEUs moving through the terminal. In August, 2006, Zim added Tampa to its weekly all water China Express service that also calls at Mobile and Houston. The liner handles about 500 containers a week out of Tampa. Emirates Shipping Line also offers service to Asia. Much of the containerized cargo consists of furniture imports from China. The facility was initially operated by SSA. In May 2006, Tampa entered into a long-term agreement with P&O Ports (now Ports America) to operate the terminal. The agreement included a split on future terminal expansion costs. Tampa proposed a 10-year, phased, marketdriven expansion plan for Hooker s Point which Tampa The Port of Tampa is a relatively new presence in the Gulf container market. Tampa opened its expanded and dedicated container facility, the Hooker s Point Container Terminal, in January The facility features 1,750 feet of berthing space with 43- foot water depth, three gantry cranes and 24 acres of paved storage representing a $40 million investment. Tampa s entry into the container market was based on its under-served regional market. The Port of Tampa opened an expanded and dedicated container facility in January The Hooker s Point Container Terminal features 1,750 feet of berthing space and represents a $40 million investment. Photo Courtesy of the Port of Tampa 43
44 Charting the Future of the Port of New Orleans included development of an adjacent 50 acres of port property. The port tentatively planned for $362 million in portwide capital improvements between 2007 and 2011 including container terminal infrastructure improvements. Ongoing developments in the global container market; Panama Canal expansion; steady regional population and economic growth; and the potential for Tampa to serve as a load center for the large Central Florida region caused port officials to take a much harder look at the future of the port. In 2006, the Tampa Port Authority engaged a team of consultants to conduct a $1 million plus strategic planning and master plan for the Port. The plan is expected to be completed in Initial data released shows the anticipated container growth rate for Florida at percent through 2010, declining to 9.08 percent by 2015 and leveling off at 7.8 percent in 2020 to The retail consumption container market for the central Florida region is anticipated to grow from 546,000 TEUs in 2005 to 2.9 million TEUs by Tampa asserts that it is the closest port to the Panama Canal in terms of travel time (3.89 days) and that it is well-positioned to benefit from the projected growth in container traffic moving through the canal. The study will present various alternatives for container terminal development that will substantially increase container capacity as well as other improvements, including deepening the port s channel from 42 feet to 50 feet, constructing distribution center warehouse capacity and providing intermodal rail improvements. Recommendations include the expansion of TEU capacity at the port to 600,000 TEUs in the short term and long term development of new terminal facilities with up to a 4 million TEU capacity. Cost estimates range from $130.7 million for full build-out of the Hooker s Point Terminal to maximum capacity of 800,000 TEUs to more than $600 million for a 4 million TEU capacity terminal. Harbor deepening costs range from $463 million to $530 million depending on terminal location. Container Growth The findings presented in the above survey of competing South Atlantic and Gulf ports supports the expectation of growth in container traffic for all U.S. coastal ranges and corroborates the industry trends discussed earlier. Strategic and master planning for competing ports affirms continuing growth in the volume of containerized cargo in the North American market through Although peak growth rates of 8 percent - 10 percent may only be sustained in the near term (through 2015), a significant 6 percent annual growth rate is anticipated through the first quarter of the century. Growth in the U.S. Gulf container trade can be expected to echo this trend based on increasing market share of Asian cargo and the expansion of Panama Canal capacity by Projected growth rates support the provision of expanded container terminal capacity on the East and Gulf Coast and, as reported, competing ports are responding to this increasing demand. A major factor in port selection is inland transportation costs. Rising rail costs at West Coast ports, coupled with port congestion and lengthy transit times, are causing shippers to seek cost-effective alternatives. As a result, the market share of Asian cargo has dramatically increased on the East and Gulf Coasts and ports are expanding terminal capacity and improving the inland transportation infrastructure in response. The Port of New Orleans can provide less expensive inland transportation and faster transit times than Houston, which continues to experience inland congestion because of its large local market to the north and west, including Dallas and Kansas City. Labor issues also affect the reliability of West Coast ports. The ILWU contract with West Coast ports expires in

45 Market Assessment Shippers and carriers are seeking to have terminal capacity in place to hedge against possible future labor disruptions. Carriers and their affiliated terminal operating companies are investing in the development of their own terminals or jointly investing and obtaining long term leases for exclusive operation of portowned facilities. The development of the new terminal owned and operated by APM/ Maersk at Hampton Roads, MOL/TraPac s lease of the new Dames Point Terminal at Jacksonville and Maersk/CMA CGM s joint investment and leasing of Mobile s Choctaw Point Terminal all are examples of carriers seeking to lock down terminal capacity to address future terminal capacity shortfalls and provide greater control over cargo movements. These trends afford the Port of New Orleans the opportunity to work with carriers to supply needed capacity. Of particular interest would be to work with a carrier who can provide the Port with all water service to Asia. The above factors support efforts by the Port of New Orleans to expand container terminal capacity and indicate opportunities to capitalize on projected growth in container traffic. Based on the survey, the Port s competitors are clearly making major investments in terminal capacity to take advantage of market growth. Market conditions can and do change rapidly. For the Port of New Orleans to be able to respond to opportunities as they arise, additional terminal capacity must be in place either to accommodate projected growth or provide exclusive space to a carrier seeking a reliable, cost-effective alternative and greater control over its container traffic. Port of New Orleans Photo: Donn Young Princess Lines tested the waters in New Orleans in December 2006 when the Golden Princess made several calls to the Poland Avenue Wharf. The Port has funding to convert a cargo shed at Poland Avenue into a cruise facility. 3. Cruise Industry The cruise industry retains the title of the fastest growing segment of the leisure market at an average of 7.6 percent per year. The North American market comprises 143 ships, more than half of the 282 cruise ship fleet. Within the next three years, another 26 ships are to be delivered, 20 of these ships to those cruise lines targeted by New Orleans as new partners. The majority of those new ships will go into the Caribbean trade, which remains the number one destination for passengers. Cruise passenger occupancy on ships homeported in New Orleans in 2004 was 104 percent the same as the industry average. However, the per diem rates in the Caribbean in 2005/06 declined due to concerns about weather, inflation and terrorism, and a perceived over-saturation of ships in the Caribbean caused the occupancies to decline accordingly. After 9/11, the cruise lines returned many ships to the North American market, but now theyare starting to move the ships overseas where the per diems currently are higher. Additionally, the potentially lucrative Asian market is starting to expand, and cruise companies (such as Royal Caribbean Cruise Lines) are testing the waters there. Although the industry is currently expanding its fleet, it is also expanding its territory to spread the risk of a continuing inflationary market. 45

46 Charting the Future of the Port of New Orleans Port of New Orleans Photo: Donn Young The Norwegian Sun became the first homeported cruise vessel to resume regular sailings to the Port of New Orleans after Hurricane Katrina. During its homeport visit on October 15, 2006, it was the first vessel to use the Erato Street Cruise Terminal and Parking Garage. The cruise industry in New Orleans is closely tied to tourism in the City of New Orleans. As the tourism base recovers from Hurricane Katrina, so will the cruise industry. The number of cruise passengers was growing steadily at the Port of New Orleans prior to Hurricane Katrina, and the Port is aggresively reacting to ensure that it will again share in the phenomenal growth that it once enjoyed. Of particular interest to the Port is the expansion of the cruise fleet. Despite the effects on the infrastructure and the tourism base from Hurricane Katrina, New Orleans as a cruise port experienced its busiest month ever during December Including the regular calls of the three homeported ships of Carnival, Norwegian and Royal Caribbean, the Port hosted three very successful embarkation calls for Princess Cruise Lines and port calls from four other ships. Over the month, the Port processed 21 ship calls and over 95,000 passengers. As new cruise ships are added to a line, it allows the cruise lines the ability to consider more homeports for its ships, including the Port of New Orleans. As the cruise industry matures at the Port and it expands and improves its terminal areas, the potential for new ships to be assigned to New Orleans increases. The Port is currently marketing itself to eight of the most influential cruise lines in the world. Five of these lines are either now successfully operating cruise ships in the Port or have sucessfully operated from New Orleans in the past. The criteria used to select the lines to market include: the size of the cruise line and its ability to expand into new horizons; the cruise product it produces (the length of cruise and whether it is seasonal, year round, or itinerant schedules); and its target passenger market. All of the targeted cruise lines, which collectively are adding 20 new ships by 2010, operate ships in the 4-,5-,7-, and 10-day market, utilize the same home port either seasonally or year round, and cater 46
47 Market Assessment to an upwardly mobile clientele. Port Call Market There is a potential for lucrative port call business during the middle of the week with a number of lines including P&O, Cunard, Hapag-Lloyd, Crystal, Swan Hellenic, Silver Seas and Seabourn. Traditional cruising days occur during the weekend. These ships, which may stay in port one to three days, are full of passengers that especially want to visit New Orleans as a port of call, and they spend their time and money freely while the ship is in port. The economic impact of this segment of the market to the local economy is tremendous, and it fills the cruise terminal on days not utilized by the homeported ships. Marketing Techniques The Port has developed a two-pronged attack in order to interest cruise lines and to increase public awareness of the successful cruise product from New Orleans. The first line of attack is a campaign geared to educate cruise executives on facilities available to handle cruise ships in New Orleans, including terminals, wharf space, location, parking facilities and the potential for selling New Orleans as a home port and port of call to its passenger base, utilizing the theme, Two Vacations in One. This is the original method of marketing and has proved to be effective. Since Hurricane Katrina, another facet of marketing has been added: marketing the Two Vacations in One theme directly to the traveling public and potential cruise passengers by educating travelers about the New Orleans cruise product. Few cruise terminals have the advantage of being located within walking distance of a significant historic district like the New Orleans French Quarter. A passenger survey taken in 2004 indicated that more than twice the industry average of cruise passengers enjoyed either a pre- or post-cruise stay in New Orleans, spending on average $150 per day on tourism-related products and services in the city. The tools utilized to make the cruise executives aware of the product offered at the Port of New Orleans are the tried and true methods of advertising used throughout the industry: Magazine advertising- placing ads in periodicals that are widely circulated and in association published newsletters. Industry functions- The Port attends industry functions such as the SeaTrade Convention, the American Association of Port Authorities cruise workshop, and the Florida Caribbean Cruise Association conventions and workshops, all of which are frequented by the cruise executives. Meetings- The Port engages in personal, one-on-one meetings to discuss industry concerns and their visions, and to sell the virtues and economics of homeporting a cruise ship in New Orleans. What has been added to traditional marketing is a campaign for passenger awareness that includes: Direct advertising to the sailing public through brochures developed by the Port of New Orleans and distributed to travel agents within the eight state area through the Cruise Lines International Association (CLIA), the travel agency branch of the cruise industry. Partnering with the cruise lines to create specific advertising for its product in New Orleans and distribution of that product to 25,000 cruise travel agents in North America. Partnering with the New Orleans Metropolitan Convention & Tourism Board, the State Department of Tourism (Lieutenant Governor s Office) and the New Orleans Marketing Corporation (City of New Orleans) to produce effective videos and to assist in distribution. Producing a video that highlights New Orleans as a cruise port which will include tourism information about New Orleans, information on how to embark and disembark a cruise ship at the terminals in New Orleans (a clear selling point) and the destinations available from New Orleans. 47
48 Charting the Future of the Port of New Orleans Engaging in a new venture to partner with western Caribbean islands that are ports of call on the itineraries of the ships home-ported in New Orleans to create a comprehensive marketing tool for the cruise product out of New Orleans. B. Capacity and Utilization Analysis The Market Analysis above suggests an overall growth trend for future portwide breakbulk cargo growth over the next years. This overall growth is likely to be in the 2 percent - 3 percent range with periods of occasional spikes and troughs in cargo activity. Fluctuations in cargo must be anticipated in the planning of capital improvements for adequate facilities that can accommodate peaks while maintaining service at regular cargo levels. Except at the Alabo Street Wharf, berthing space does not appear to be a constraining capacity issue. Over the last several years there has been no congestion at general cargo berths and none is expected in the foreseeable future. However, the expected growth in the number of vessels servicing the Port and the elimination of the Poland Avenue Terminal as a general cargo berth and its conversion to a third cruise terminal may eventually impact berthing capacities and will be closely monitored. Post-Katrina, breakbulk conditions have changed dramatically. Because of damage to transit sheds and storm siltation of the MRGO, refrigerated breakbulk facilities must shift from the IHNC to the riverfront, warranting additional breakbulk capacity on the Mississippi River. The redevelopment of obsolete cargo facilities in selected areas of the Mississippi Riverfront into non-maritime commercial uses also displaces breakbulk facilities at the Port. This commercial riverfront redevelopment is part of a grand master plan for the downtown New Orleans Riverfront and is detailed in the chapter on Strategic Issues. The conversion of these facilities elevates the need for additional breakbulk capacity. As indicated in the market assessment, two major commodity groups -- forest products and natural rubber -- are expected to move toward containerization. While the Port will continue to see some shift to containers, other commodity groups such as steel will continue to move as breakbulk cargo. The cruise industry at the Port of New Orleans is an emerging sector and heavily dependent on the New Orleans tourism market. The Port presently has two cruise terminals and is constructing a third facility to be completed in The following is a discussion of capacity and throughput for breakbulk, container and cruise facilities at the Port of New Orleans, how effectively each facility is being utilized, and if there is additional capacity to handle growth opportunities. Alabo Street Terminal The Alabo Street Terminal, and to a lesser extent, the Nashville Avenue Terminal, have very high transit shed utilization rates of 153% and 89%. Likewise, their marshalling yard utilization rates are well over 100%. Although at times these facilities are somewhat congested, each appears to have capacity remaining to accommodate growth. In fact, the Board is lengthening the Alabo Street Wharf by 300 feet to provide additional berthing capacity and a corresponding additional cargo throughput capacity. The Alabo Street facility is somewhat limited in handling additional volumes with only one terminal. Terminal operators at Alabo have relied on the Poland Avenue and Governor Nicholls facilities to provide flexlease or as needed space when necessary. The terminal operator at Alabo has been very successful in maintaining a high utilization rate at Poland Avenue and is optimistic about its ability to continue to do so. The terminal operator s handling of predominantly dense steel and metals contributes to their ability 48

49 Market Assessment to exceed theoretical capacity limits. Growth rate at Alabo Street has been significant over the last several years and the focus on these two markets in particular suggest that this trend should be maintained. Henry Clay & Nashville Avenue Terminals The terminal operator that occupies several of the Board s Mississippi Riverfront facilities in Henry Clay Avenue and Nashville Avenue A, B and C Terminals has the ability to accommodate breakbulk cargoes at any one of four terminals and marshalling yards. This flexibility makes its high theoretical utilization rates somewhat misleading. Oftentimes, the sheer volume of its storage capacity contributes to the fluidity in operations and its ability to handle multiple cargo types in several locations simultaneously. This is significant given the dwell times associated with rubber and forest products and its tendency to create occasional peak utilization periods. The terminal operator expects breakbulk cargo volumes to be steady and is forecasting a slight overall increase as world market conditions improve. It is significant to note the prominence of coffee imports and coffee processing at the Port of New Orleans. The Silocaf facility, located on the landside of the Nashville Avenue Terminal, is the number one coffee processing plant in the U.S offering state-ofthe-art bulk coffee processing and blending services. Silocaf commenced operations in New Orleans in 1993 as an adaptive reuse in converted silos of an 80-year-old former public grain elevator. Beginning in the 1990s, the movement of coffee imports shifted from breakbulk to containers. Silocaf played a pioneering role in the processing of bulk coffee in the United States and helped to advance the containerization of coffee imports. The availability of Silocaf, coupled with the significant number of coffee roasting facilities Port of New Orleans Photo: Donn Young located in New Orleans, has enabled the Port to retain its coffee imports and ranking as the number two coffee port in the U.S. Both Thailand and Vietnam are growing markets for Robusta coffee beans and are served by West Coast ports. New Orleans is well-positioned to service Central and South American coffee markets, and the full impact of Asian coffee on imports through the Port is yet to be determined. Louisiana Avenue, Harmony & Seventh Street Terminals The terminal operator at the Louisiana, Harmony and Seventh Street facilities has adequate capacity, both inside and outside, to sustain significant growth. First Street Terminal The terminal operator at the First Street Terminal has struggled in recent years to meet the minimum revenue guarantee specified in its lease with the Board. There is currently no expectation of a capacity constraint at First Street with the existing lessee. Perry Street Terminal For the last several years, the Perry Street Wharf has been leased as a non-cargo handling facility to two separate companies. One operation is a topside ship repair service and the other provides primarily rubber The Perry Street Wharf on the West Bank of Jefferson Parish would require rail service improvements to make it a general cargo dock. 49

50 Charting the Future of the Port of New Orleans storage and ancillary services. Both leases expired in The viability of relocating the two existing Perry Street Wharf tenants is important for creating new cargo capacity available for maritime use. The Perry Street Wharf is located in Jefferson Parish on the West Bank of the Mississippi River and south of the historic footprint of the Port of New Orleans. Rail service improvements would be required for the Perry Street Wharf to be able to accommodate general cargo. If capacity demands dictate, the Perry Street Wharf would be a viable alternative for adding breakbulk capacity and should be strongly considered as an alternative to costly new construction. Napoleon Avenue Container Terminal The Napoleon Avenue Container Terminal is one of the more technologically proficient container terminals in the world. Its relatively small size, 60 acres overall, including a 48-acre marshalling yard, is designed to handle over 360,000 twenty-foot containers annually. The Board s two tenants at the Napoleon Avenue Container Terminal enjoy excellent stevedoring productivity and utilize a state-of-the-art gatehouse processing system that can efficiently handle over 1,000 truck moves per day. The worldwide container market continues to grow at a rapid pace, and the Napoleon Avenue Container Terminal is particularly well-positioned to participate in this growth. While the aftermath of Hurricanes Katrina and Rita disrupted container volumes for a period of time in 2005 and early 2006, the Port of New Orleans quickly rebounded. Some of the Board s largest container carriers -- Mediterranean Shipping Company, Hapag- Lloyd and Maersk -- are all formulating expansion plans which will significantly increase their ship call and container throughput volumes past pre-katrina and Rita levels. The Board is in discussions with industry leaders about expanding the Napoloen Avenue Container Terminal. The expansion would add 20 acres of marshalling yard space and two ship berths. Port of New Orleans Photo: Donn Young The Board is currently in discussions with one of its major ocean carriers and terminal operators about the next phased expansion of the Napoleon Avenue Container Terminal. This expansion will add nearly 20 acres of container marshalling yard, two ship berths and three container cranes. Additionally, preliminary plans for future expansion have been developed which provide for 25 acres of container marshalling capacity at the former CNIC rail yard site behind the Milan Street Wharf. Included in this development is an intermodal container transfer facility capable of handling several intermodal unit trains daily. This capacity will connect the Napoleon Avenue Container Terminal with the six Class I railroads serving New Orleans, thereby reaching container customers throughout mid-america and into Canada. 50
. The move will help New Orleans stay competitve in the exportation of frozen poultry.")
51 Market Assessment Figure 7 Relocating Cold Storage Facilities With funding from the legislature in hand, the Port of New Orleans is planning to move its on-dock cold storage facility from the Jourdan Road Terminal to the Governor Nicholls Street Wharf (preliminary design above). The move will help New Orleans stay competitve in the exportation of frozen poultry. Jourdan Road Terminal The Port of New Orleans has recently become the leading frozen poultry export port in the United States. Tonnage at the refrigerated cargo facility located at the Jourdan Road Terminal (JRT) grew 141 percent from 127,212 tons of frozen poultry handled in 2000 to more than 310,000 tons in In 2005, the cold storage facility was responsible for a total of 1,537 jobs and $76 million in economic benefits. Hurricane Katrina caused considerable damage to the JRT, severely impacting refrigerated operations. The siltation of the MRGO due to the hurricane and suspension of dredging thereafter further exacerbated cargo movements at this facility. The resulting lack of deep water navigation requires frozen commodities to be trucked to deep draft facilities available on the Mississippi River. The annual transportation costs associated with moving product from the MRGO to the river is $1.6 million. In order to preserve frozen poultry as a major commodity at the Port, the relocation of this refrigerated facility from the MRGO to a location on the Mississippi River is urgently required. Several feasible sites for relocation of the Port s refrigerated facility are currently under consideration. The existing business has an opportunity to double its volume of cargo shipped through New Orleans if a new deepwater facility can be constructed to coincide with a new production facility slated for completion in Cost estimates for the new refrigerated facility are included in short term projects recommended in Chapter V, Capital Improvements Plan. Erato Street Cruise Terminal The Erato Street Cruise Terminal and Parking Garage opened on October 15, The $37 million project was designed to handle the largest of cruise ships -- those carrying in excess of 4,000 passengers. The design of the Erato Street Cruise Terminal was intended to accommodate the needs of larger cruise vessels including more space for passenger check-in, luggage handling, access roadways and parking. 51

52 Charting the Future of the Port of New Orleans Figure 8. Poland Avenue Cruise Terminal Plans The conversion of the Poland Avenue Wharf from a cargo facility to a cruise facility will utilize the existing cargo shed. The additional berthing spaces will provide additional weekend slots that the Port can use to lure additional cruise lines to New Orleans. To date, the design seems to have adequately addressed all three areas, with over 25,000 square feet of luggage lay down area and 40,000 square feet of passenger check-in and waiting area, two extra lanes for approach with better drop off areas, and a 1,006 vehicle parking garage within the same complex. Since its opening, the Port has successfully handled weekly ship calls at the Erato Street Terminal. Julia Street Cruise Terminal The Julia Street Cruise Terminal Complex is comprised of two terminals. The first of which was constructed in 1991, with three additions increasing its size through 2002; and the second of which was completed in The Julia Street Cruise Terminal Complex, which is located in the 1984 World s Fair International Pavilion Building, originally consisted of one terminal (Julia 1) that was sized to handle a 750-passenger vessel. To respond to the increasingly larger ships as the Port became more successful, Julia 1 was expanded three times, the last in 2002 to accommodate a 3,700-passenger vessel. In 1994, Julia II was constructed adjacent to Julia 1 to accommodate another cruise line. However, with the size of the vessels now and the berthing requirements of a ship at Erato Street, the Port is only able to berth one ship at a time, either at Julia I or Julia II but not both. This limits options, and, because of the way in which a vessel conforms to the wharf, Julia II is the terminal that is used, making Julia I obsolete. Renovations to Julia I are direly needed and outlined in Chapter V, Capital Improvement Plan. Poland Avenue Cruise Terminal The Poland Avenue Cruise Facility is currently under engineering and planning and is scheduled for completion in early The Port has recently entered into an agreement with the Maritime Administration (MARAD) to permit the transfer of ownership of this area to allow for the construction of the new terminal. 52

53 Market Assessment Figure 9. Downtown Cruise Map The process began prior to Hurricane Katrina, and most of the planning and engineering has been completed. It was anticipated that construction would be complete in time to host four homeport calls in December However, after the hurricane, the State diverted the construction funds set aside for the Poland Avenue Cruise Terminal. The Port successfully improvised with a makeshift cruise terminal consisting of a series of tents for the December 2006 sailings. In order to succeed in further expanding the cruise business in New Orleans, it is vital that the Port have an additional permanent cruise terminal to market. Cost estimates for the Poland Avenue Cruise Terminal are included in Chapter V, Capital ImprovementPlan. Presently, the Port effectively has two working cruise terminals, Erato Street and Julia Street. The Port can moor two ships at once alongside the 2,600 linear feet of dock space. seven-day product (the most popular cruise length) on the weekends to accommodate the needs of its passengers. This weekend preference translates into a capacity of four cruise ships per week. However, the introduction of the four and five day cruises into the marketplace has proved successful, and that opens up more days for homeport turnarounds, which increases the capacity to five ships per week. The cruise industry also measures capacity on how many passengers it thinks a port may attract. In pre- Katrina New Orleans, the allure of the City and its tourism appeal far outpaced the physical capacity of the Port to handle the ships, and the Port s expansion of capacity was only hindered by its lack of facilities. In post-katrina New Orleans, the recovery of tourism and the cruise industry are closely related. As tourism rebounds in the City, cruising at the Port of New Orleans increases. The Port will be proactive with the capital improvements necessary to meet demand from the cruise industry. Eventually, the tourism allure of the City of New Orleans will return, and the Port should react now in order to be ahead of the curve and be able to respond to the returning increase in demand. With improved facilities and the eventual return of tourism, the Port of New Orleans can easily handle seven cruise ships per week: Three at Erato (one 7-day, two 4/5 day) Two at Julia Street (both 7-day) and Two at Poland Avenue (both 7-day) Planned capital improvements to the two existing cruise terminals and creation of a new third terminal in the immediate future will help the Board successfully anticipate the needs of the burgeoning cruise industry in New Orleans and assist in the regional recovery from Hurricane Katrina. The cruise lines want to turn around the 53
54 Charting the Future of the Port of New Orleans Table 5. Capital Improvement Plan Summary Project Type Short Term ( ) Project Cost Estimate 2008 Dollars Napoleon Container Terminal Complex $237,580,000 Container Terminal (Phase 2) $172,425,000 Additional Container Cranes $40,155,000 Intermodal Rail Facility $25,000,000 Refrigerated Facility $30,500,000 Cruise Terminals $22,500,000 Poland Avenue Cruise Terminal $6,500,000 Cruise Terminal Enclosed Gangways $16,000,000 Breakbulk Facility $75,000,000 Hurricane Recovery Projects $149,000,000 River Terminal Improvements $34,503,000 Louisiana Terminal Paving Improvements $8,000,000 Alabo St. Terminal $7,500,000 Deep Dredge & Wharf Bracing - Nash C, & Nap A $3,200,000 Major Maintenance $15,803,000 IHNC Improvements $11,000,000 FRT Berth 1 Improvements $6,000,000 IHNC Misc. Improvements $5,000,000 Bridge Major Maintenance $5,500,000 Other Projects $8,800,000 Dredge Replacement $5,500,000 Port Security $1,500,000 Tchoupitoulas Corridor Drainage Improvements $1,800,000 Total $574,383,000 Long Term Napoleon Container Terminal Complex (Phase 3) $240,000, Future Cruise Terminal $40,000,000 River Terminal Improvements $60,400,000 New Shed to Connect Harmony & Seventh $4,000,000 Pave Henry Clay Yard $4,000,000 Conversion of Timber Fender Piles to Composite $24,000,000 Deep Dredge & Wharf Bracing - Nash B $3,400,000 Major Maintenance $25,000,000 IHNC Improvements $36,300,000 France Road Terminal $22,000,000 France Road Terminal Floodwall $4,300,000 Port Share of IHNC Lock Replacement $5,000,000 Industrial Properties $5,000,000 Bridges $54,000,000 Port Share of New Almonaster Bridge $14,000,000 Seabrook Bridge Replacement $40,000,000 Other Projects $34,400,000 Ship Repair/ Lay Berth Facility $12,000,000 Environmental Projects $10,000,000 Third St. Wharf - HPD Berth $7,500,000 CHT Roadway & Drainage Improvements $1,200,000 Port of New Orleans Place Roadway Improvements $200,000 Portwide Monitored Fire Alarm System $1,500,000 Third St. Wharf Bank Stabilization $2,000,000 Total $465,100, Grand Total $1,039,483,000
 contained in this chapter is based on the strategic issues and market assessment presented in preceding chapters.")
55 Capital Improvement Plan V. CAPITAL IMPROVEMENT PLAN The Capital Improvement Plan (CIP) contained in this chapter is based on the strategic issues and market assessment presented in preceding chapters. The CIP articulates a vision for growth that will successfully carry the Port of New Orleans into the future over the next twelve years. Goals and objectives have been formulated to define this vision for growth as follows: Nurture historic niche breakbulk cargoes such as steel, metal, plywood, and rubber, etc. Create new container terminal capacity to position the Port to capture its share of doubledigit growth presently occurring in the worldwide container market. Nurture recovery of cruise business and add more terminal capacity. Complete relocation from the MRGO and consolidation of deep draft terminals on the Mississippi River. Create new breakbulk cargo capacity beyond the traditional riverfront footprint of the Port. Continue the major maintenance program of all Port facilities. Continue to extract maximum revenue from industrial properties that are leased to private companies. The methodology employed in project selection for the CIP began with identification of projects that would help bring the Port s vision for the future to fruition. A feasibility study for each project was then conducted, folowed by a site analysis identifying potential sites available for the project within the jurisdiction of the Board. A preliminary cost estimate was developed for each project. The projects were then prioritized in order of importance and divided into two categories: shortterm and long-term projects. Short-term projects will answer immediate needs critical to the Port over the next five years from 2008 through Longterm projects, covering 2013 through 2020, will serve to guide the future development of maritime related businesses and the replacement or repair of aging high-maintenance facilities. A third level of projects of regional and national significance is also presented in this chapter. These projects serve as major intermodal transportation links and require federal funding. The regional and national projects include only the Port s estimated share of participation (self-generated funds) in the summary table of cost estimates (Table 5) and are Figure 10 Napoleon Ave. Container Terminal Expansion This color coded drawing represents the phases of development of the expansion of the Napoleon Avenue Container Terminal. 55
56 Charting the Future of the Port of New Orleans discussed at the end of the chapter. Project costs are estimated based on 2008 pricing. The short and long-term CIP projects are summarized in the Table 5. The short-term projects total $574.4 million. The long-term projects total $465.1 million. The grand total for both short and long-term projects included in the 2020 Master Plan is approximately $1 billion including all engineering, construction, project administration, and other ancillary project costs. Of the short-term projects, six have identified funding sources that require some Port funding: The Alabo Street Terminal Rehabilitation is being funded by the Louisiana Port Development and Construction Priority Program. The Dredge Replacement is being funded by the Louisiana Port Development and Construction Priority Program. The Poland Avenue Cruise Terminal is being funded by the Louisiana Capital Outlay Program. The Refrigerated Facility is being funded by the Louisiana Capital Outlay Progam The Hurricane Recovery Projects are being funded by the Federal Emergency Management Agency (FEMA) Federal Highway Administration (FHWA), insurance and other sources. The France Road Terminal Berth 1 Improvements has applied for funding from the Louisiana Port Development and Construction Priority Program. A brief description of each of the projects follows. A schematic illustrating potential sites for the CIP projects appears at the end of the chapter. A. Short Term Projects Napoleon Container Terminal Complex (Phase 2) - $237,580,000 This Phase 2 of the Napoleon Avenue Container Terminal involves three projects: One project is the creation of additional, new container handling facilities through the redevelopment of the Napoleon Avenue Wharves B and C sites and adjacent marshalling yards. Existing wharves will be demolished and new, higher capacity wharves will be built to handle container cranes. Backup areas will be developed into new marshalling yard space. This will enable the Port to have wharves with direct, linear access to the container yards. A second aspect of this project is redevelopment of a former rail yard into additional marshalling yard space. A second project is the purchase and installation of three new container cranes and related improvements to be placed at Port container facilities on the Mississippi River. A third project is the development of an intermodal rail facility to support the container operations at the Port. The proposed site is on property adjacent to the Clarence Henry Truckway and next to a former rail yard. The project will include reconfiguration of the existing rail tracks and paving to provide an efficient intermodal operation close to dock operations. Refrigerated Facility - $30,500,000 Port Share of Funding- $10,000 This project includes the construction of a new refrigerated facility with access on the Mississippi River. The new refrigerated terminal will be constructed on the Governor Nicholls Street Wharf and the Esplanade Street Wharf. The project includes demolition of two existing sheds and replacement with a new, 150,000 square foot refrigerated area with blast freezing capability, a new marshalling yard and truck parking area, and additional site improvements, utilities, and ancillary operations buildings. Louisiana Capital Outlay Program funds are allocated for this project. Cruise Terminals - $22,500,000 Cruise Terminal development includes two projects: Poland Avenue Cruise Terminal - $6,500,000 Port Share of Funding: $10,000 - The development of a new cruise terminal will take place within the confines of the Poland Avenue Wharf and Shed. Conceptual design work has been completed and a trial use of the facility with temporary structures has taken place. The new facility will use the existing upriver end of the shed with a retrofit to take place inside. Louisiana Capital Outlay Program funds are 56
57 Capital Improvement Plan allocated for this project. Cruise Terminal Enclosed Gangways - $16,000,000 - Provide enclosed gangways at the Poland Avenue and Julia Street Cruise Terminals. Louisiana Capital Outlay Program funds have been applied for in Breakbulk Facility - $75,000,000 This project is for the development of a new facility to expand breakbulk capacity outside of the traditional footprint of the Port, possibly on the West Bank of the Mississippi River. The project includes creation of a one or two deep draft wharf berths, new warehouse space, paved marshalling yards, and related infrastructure improvements. Hurricane Recovery Projects - $149,000,000 These projects are a variety of the remaining repairs and remediation of port facilities damaged by Hurricane Katrina. Work is being done as funds are made available by FEMA, FHWA, insurance, and other sources. River Terminal Improvements - $34,503,000 This is a program to make improvements at various terminals along the Mississippi River. Louisiana Terminal Paving Improvements - $8,000,000 - The marshalling yards at the Louisiana Terminal were originally designed for lighter weight operations. This project will improve the paving to allow for newer heavier loads and equipment now in operation. Alabo Street Terminal Improvements - $7,500,000 Port Share of Funding: $2,803,617 - The goal of improvements to the Alabo Street Terminal is to increase cargo-handling capability. The existing terminal operator frequently receives requests for more ship calls that can be accommodated under present conditions at the terminal. Improvements to this facility include demolition of a wharf and shed that were taken out of service in 1991, an upriver and downriver wharf extension to provide an additional 418 linear feet of berthing, rail rehabilitation, and replacement of shed siding, skylights, overhead doors, and signage. Louisiana Capital Outlay Program funds are allocated for this project. Deep Dredge & Wharf Bracing Nashville C and Napoleon A Wharves - $3,200,000 - This will allow the Port to increase design depths at these wharves. Work includes pile bracing, removal of submerged debris, and dredging to a 45- foot depth. Major Maintenance - $15,803,000 - This is a continuing program aimed at keeping port facilities efficient and providing for reliable operations including fire protection rehabilitation at Louisiana Avenue Terminal, replacing the Nashville Avenue Shed A roof, portwide roadway repairs, portwide wharf substructure coating, etc. IHNC Improvements - $11,000,000 FRT Berth 1 Improvements - $6,000,000 Improvements to Berth 1 including new high mast lighting and re-paving the marshalling yard. Louisiana Capital Outlay Program funds have been applied for in IHNC Misc. Improvements - $5,000,000 - The improvements include a variety of general projects in common areas such as roadwork, demolitions, building repairs, signalization, and grade crossings. Bridge Major Maintenance - $5,500,000 This is a continuing program to keep the four Port owned bridges reliable and operational. Work includes mechanical, electrical, and structural projects. This work will extend the life of the oldest bridges up to Other Projects - $8,800,000 Dredge Replacement - $5,500,000 Port Share of Funding: $500,000 - The existing port dredge is 33 years old. Breakdowns of the dredge have proportionately increased with age and increased with demand for the dredging of more wharves at greater depths. Maintenance has become more frequent and costly, making replacement of this dredge necessary. Funds from the Louisiana Port Development and Construction Priority Program are in place for this project. Portwide Security $1,500,000 - Security related projects include computer hardware and software to complete a wireless communication system linking the cruise terminals, the Port administration building, Harbor Police, and the facility access stations, additional fencing portwide in order to secure port facilities as needed, and other security related items. 57
58 Charting the Future of the Port of New Orleans Tchoupitoulas Corridor Drainage Improvements - $1,800,000 - This is the final phase of the Tchoupitoulas Corridor/Clarence Henry Truckway construction project started in the 1990 s completing drainage improvements for this area. The drainage improvements will complete the Port s drainage into the New Orleans Sewerage and Water Board system. B. Long-Term Projects Napoleon Container Terminal Complex (Phase 3) - $240,000,000 This final phase of construction will complete the Napoleon Avenue Container Terminal with a new wharf downriver of the Milan Street Wharf, marshalling yard, and a terminal gatehouse necessary to meet future growth in the container business. Future Cruise Terminal - $40,000,000 The project calls for the ultimate development of a fourth cruise terminal into full service. This will be necessary as the cruise business demand increases at the Port in the future. The terminals currently in operation address only the immediate needs of the Port. The combined capacity of four terminals will create a critical mass necessary to capture a portion of the growing global cruise trade. Included in the cost of the project is specific site selection. River Terminal Improvements - $60,400,000 Various projects at terminals along the Mississippi River including: New Shed to Connect Harmony and Seventh Street Sheds - $4.000,000- This will increase indoor breakbulk storage capacity at the Louisiana Terminal Complex Pave Henry Clay Yard - $4,000,000 - This yard is an older unpaved yard. Paving will increase marshalling yard capacity at this site. Conversion of Timber Fender Piles to Composite - $24,000,000 This project provides for the conversion of timber fender piles at all wharves along the Mississippi River to plastic composite piles. The composite piles are more resistant to damage and will decrease annual maintenance costs Deep Dredge and Wharf Bracing Nashville B - $3.400,000 - This will allow the Port to increase design depths at this wharf. Work includes pile bracing, removal of submerged debris, and dredging to a 45foot depth. Major Maintenance - $25,000,000 - There is a continuing need for work to be performed on various wharfs on the Mississippi River as part of a long-term major maintenance program. Work included is substructure rehabilitation, portwide roadway repairs, utility rehabilitations, and shed maintenance. IHNC Improvements - $31,300,000 France Road Terminal Improvements - $22,000,000 - France Road Terminal is in need of various improvements to continue to function as a workable shallow draft facility. Areas to be improved are paving, lighting, consolidation of sheds, gatehouses, and the wharves. France Road Terminal (FRT) Floodwall - $4,300,000 - Most of the FRT is currently outside the Lake Pontchartrain Hurricane Protection system floodwall and is thus subject to flooding from tidal and storm surges in the IHNC, Intracoastal Waterway, and the MRGO. A continuous floodwall along the eastbank of the IHNC at FRT would bring all the FRT properties within a levee providing flood protection to approximately 15 feet above sea level. The completion of the floodwall would assure that all operations at FRT will be protected from flooding from minor hurricane storm surges. Industrial Properties - $5,000,000 - Port owned industrial properties are in need of improvements including drainage, fencing, roadwork, etc. Other Projects - $34,400,000 Ship Repair/Lay Berth - $12,000,000 - The Port has a continuing need for maritime support activities such as ship repair and lay berthing facilities. These normally would include a pier and dolphins to tie up ship and barges in need of repair. Sites are available on both the east and west banks of the Mississippi River. Environmental Projects - $10,000,000 - Various environmental projects are being identified throughout the port including site surveys, environmental remediations, and improvements 58
59 Capital Improvement Plan to assist in becoming a greener operation. Third Street Wharf HPD Berth - $7,500,000 This project is to provide a new wharf to berth Harbor Police fire and patrol boats, the dredge, piledriver, and other Port owned vessels. CHT Roadway and Drainage Improvements - $1,200,000 Improvements include striping, signalization, roadway repairs, drainage along the CHT, etc. Port of New Orleans Place Roadway Improvements - $200,000 Improvements include striping and pavement repairs. Portwide Monitored Fire Alarm System - $1,500,000 Monitor those facilities not presently on a monitoring system. Third Street Wharf Bank Stabilization - $2,000,000 Permanent repairs to stabilize the bank at Third Street by Harbor Police Headquarters building. C. Regional/National Projects The last three projects discussed are of regional significance. The first two regional/national projects involve bridge replacements. The Almonaster and Seabrook bridges are two of four vehicular/rail bridges across the IH-NC owned, operated and maintained by the Board. These bridges were constructed in 1920 following construction of the IH-NC. The costs for the Almonaster Bridge Replacement and the Seabrook Bridge Replacement/ Rehabilitation are preliminary estimates. Almonaster Bridge Replacement- $70,000,000 Port Share of Funding-$14,000,000 The Almonaster Bridge is a bascule type bridge with two railroad tracks and one vehicular lane located over the IHNC. This bridge is part of a national, intermodal connector route and services several railroads. Maintenance costs for the 80-plus year-old bridge are rising and are proportionate to its age. Preliminary designs for a new bridge at this location have already been funded through a joint agreement between the Port, the Regional Planning Commission (RPC) and the City of New Orleans. The Almonaster Bridge Replacement is contained in the long-range plans of the RPC. The RPC is currently attempting to identify additional funding sources for the Almonaster Bridge Replacement. Seabrook Bridge Replacement/Rehabilitation- $40,000,000 The Seabrook Bridge is another port bridge of 80 plus years serving as a rail crossing for the Norfolk- Southern railroad. At some point in the future, the bridge will require replacement in order to meet federal railway regulations. Funding sources for the project have not been identified to date. IH-NC Lock Replacement- $764,000,000 Port Share $5,000,000 Replacement of the federal IHNC Lock was originally authorized in The new lock will provide an efficient, modern facility to handle projected marine traffic and oceangoing vessels with 36 feet of draft and includes replacement of the antiquated St. Claude Avenue Bridge, which is structurally a part of the lock. As the local sponsor of the lock replacement project, the Board has already provided about $17 million in property and facilities and will contribute additional funding for the project. In the Post-Katrina landscape, the expected closure of the MR-GO would leave the 83-year-old lock as the only route for Gulf Intercoastal Waterway (GIWW) traffic. A failure of the existing lock would cause a navigational logjam, leading to shortages of petroleum, feed stocks and jet fuel that are of national significance. Project construction began in 2000, but has been hamstrung by severely reduced levels of federal appropriations that have hampered the award of additional construction contracts. Severe reductions in federal budgets for the lock replacement and waterway projects in general over the last several years represent a serious threat to the ultimate completion of the new lock. The 2008 federal budget proposed no new spending on the project, which is stalled by a court order requiring the U. S. Army Corps of Engineers to conduct an updated environmental impact statement. Public opposition to the project continues to threaten its completion. Neighborhood residents in the vicinity of the lock, residents of the Lower Ninth Ward and St. Bernard Parish and environmental interests continue to oppose the project because of perceived adverse impacts on the neighborhood, on vehicular traffic and on the environment. 59


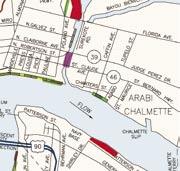
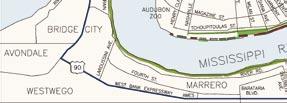

60 Charting the Future of the Port of New Orleans Figure 11. Port of New Orleans Capital Improvement Program 60

61 Capital Improvement Plan Figure 12 Capital Improvement Program- IHNC Facilities 61

62 Charting the Future of the Port of New Orleans Figure 11 Capital Improvement Program- River Facilities 62
63 Financing Opportunities VI. FINANCING OPPORTUNITIES A. Current Debt Currently the Board has outstanding fixed rate senior bonded debt of $89.2 million issued in 2001 (20 year maturity), 2002, and 2003, (both thirty year maturities). Further, bonded debt subordinate to these borrowings was issued in 2005 and the current outstanding balance on this variable rate debt is $19.4 million. Debt related to capital leases totals $6.8 million outstanding. In the aftermath of Hurricane Katrina, the Board took advantage of one federal and one state program to assist with the recovery. The first was the Federal Emergency Management Agency (FEMA) Community Disaster Loan program. This program provided governmental entities assistance with operating expenses. The amount of the loan to the Board was $7.5 million with a required payback in five to ten years. The Louisiana State program was a deferral of two years of debt service on the Board s bonded debt. The deferral was for five years, interest free, and amortization of the estimated $14.4 million begins thereafter with a payout over 15 years. The total of the above mentioned outstanding debt is $125.0 million. B. Financing Opportunities Financing opportunities for a major construction project need to be viewed in conjunction with the Board s potential for generating excess funds to support the expenditures and its ability to attract alternative funding sources. Due to Hurricane Katrina, the Board experienced a dip in revenues for fiscal year 2006 which continues into A ten-year projection of cash flows after debt service, including a minimum amount for minor capital projects, indicates cash available over this period in the total cumulative amount of $72.1 million. Therefore, the average excess annual cash available for major capital projects is $7.2 million. average excess cash available could fund up to approximately $65 million in additional debt. Based on the ten year projections and covenants on current outstanding debt, the most significant portion of the borrowings could not occur until after the fiscal year endin in At that point, again based on projections, borrowings in the range of $55 million could be accomplished with the maximum of approximately $65 million attained in Fiscal Year The potential exists for funding of major projects through public/private partnerships. There are opportunities for providing significant funding for capital projects. The Board must be willing to share a portion of future revenue with the private sector participant who provides the funding. The Board previously explored this possibility in the completion of the Erato Street Cruise Terminal and a cruise terminal at Poland Avenue. Although the private sector had significant interest in the cruise terminal development, the Board chose to finance the Erato Street project on its own and seek assistance from the State on the Poland Avenue project. However, enthusiasm for private investment in port facilities remains strong, mainly driven by trade growth outlook and capacity constraints. The Gulf of Mexico region is of particular interest to investors with the growth of South American trade and the future expansion of the Panama Canal. With this type of interest in port facilities, the Board should be able to structure transactions and financing to suit specific needs. A public/ private joint venture is a very viable option for the Board to obtain financing for major revenueproducing projects with the realization that the future revenue of the project will be shared with the private capital investor. The availability of the Gulf Opportunity Zone (GO Zone) program presents a good incentive for development. The Gulf Opportunity Zone Act of 2005 (H.R passed by Congress on Dec. 16, 2005, and signed by President Bush on Dec. 21, 2005) establishes tax incentives and bond provisions to rebuild the local and regional economies devastated by hurricanes Katrina and Rita. The excess annual cash available could be utilized to fund further bonded debt. The 63

64 Charting the Future of the Port of New Orleans: Master Plan 2020 was published in February 2008 by the Port of New Orleans. It was produced by the Port of New Orleans staff with the assistance of Jemison & Partners, Inc, port planners. Board of Commissioners of the Port of New Orleans: H. Daniel Hughes, II Chairman James Campbell Vice Chairman Captain Allen J. Gibbs Secretary-Treasurer Valerie S. Cahill Commissioner Thomas D. Westfeldt, II Commissioner John F. Fay, Jr Commissioner J. Wayne Mumphrey Commissioner Gary P. LaGrange President and CEO 2008, Port of New Orleans
Waterways Council November 10, 2017
 Waterways Council November 10, 2017 MULTI-PURPOSE LANDLORD PORT The Port of New Orleans generates its own revenues as a multipurpose landlord port. Cargo 69%; cruise 21%; real estate 10% Diversity increases
Ohio Freight Conference Great Lakes Commercial Navigation
 Ohio Freight Conference Great Lakes Commercial Navigation Roger E. Haberly Regional Economist Buffalo New York 13 September 2013 US Army Corps of Engineers Presentation Overview 1. GL Physical System Description
Aviation, Rail, & Trucking 6-1
 6-1 This chapter describes the services, facilities, and condition of air, rail, and trucking as components of the transportation system. These three intermodal areas have an impact on the factors to be
Creating Short Sea Opportunities - The Terminal s Role
 American Association of Port Authorities Creating Short Sea Opportunities - The Terminal s Role Growth Opportunities for General Cargo and Shallow Draft Ports Memphis, TN November 14, 2006 Maurice S. Owen,
PortMiami Director and CEO Juan M. Kuryla PUBLIC-PRIVATE PARTNERSHIPS (P3)
") PortMiami Director and CEO Juan M. Kuryla PUBLIC-PRIVATE PARTNERSHIPS (P3) PORTMIAMI QUICK FACTS PortMiami is located in Miami-Dade County, one of the most diverse, multilingual populations in the U.S.
PortMiami Director and CEO Juan M. Kuryla PUBLIC-PRIVATE PARTNERSHIPS (P3) PORTMIAMI QUICK FACTS PortMiami is located in Miami-Dade County, one of the most diverse, multilingual populations in the U.S.
Panama Canal Stakeholder Working Group Meeting
 Panama Canal Stakeholder Working Group Meeting POHA, Bayport Container Terminal, Houston, Texas August 27, 2012 TOTAL ECONOMIC IMPACT 9,749 Texas jobs are in some way related to the Port Of the 9,749
AIR CARGO RECOVERY DRIVERS AND ROADBLOCKS Airports Council International North America Calgary
 AIR CARGO RECOVERY DRIVERS AND ROADBLOCKS Airports Council International North America Calgary DAN MUSCATELLO Landrum & Brown September 9, 0 Metric Tons (in millions) GLOBAL AIR CARGO VOLUMES Global air
FORECASTING FUTURE ACTIVITY
 EXECUTIVE SUMMARY The Eagle County Regional Airport (EGE) is known as a gateway into the heart of the Colorado Rocky Mountains, providing access to some of the nation s top ski resort towns (Vail, Beaver
Thank you for participating in the financial results for fiscal 2014.
 Thank you for participating in the financial results for fiscal 2014. ANA HOLDINGS strongly believes that safety is the most important principle of our air transportation business. The expansion of slots
Tulsa Airports Improvement Trust Strategic Plan Update
 Tulsa Airports Improvement Trust Strategic Plan Update 2016-2026 TABLE OF CONTENTS I. Background II. III. IV. Existing Conditions and Future Requirements Mission, Vision, & Goals Strengths, Weakness, Opportunities
Westover Metropolitan Airport Master Plan Update
 Westover Metropolitan Airport Master Plan Update June 2008 INTRODUCTION Westover Metropolitan Airport (CEF) comprises the civilian portion of a joint-use facility located in Chicopee, Massachusetts. The
Port of Seattle Sea-Tac Airport Master Plan An Economic Engine for Washington State. Kurt Beckett Deputy Chief Executive Officer
 Port of Seattle Sea-Tac Airport Master Plan An Economic Engine for Washington State Kurt Beckett Deputy Chief Executive Officer WA Ports A Unique Public Agency Mission: Create Jobs through Travel, Trade
STRATEGIC ALLIANCES BETWEEN PORTMIAMI AND ITS CRUISE AND CARGO PARTNERS
 STRATEGIC ALLIANCES BETWEEN PORTMIAMI AND ITS CRUISE AND CARGO PARTNERS Richard de Villiers Assistant to the Deputy Port Director AAPA Conference, February 5-7, 2013 Merida, Mexico MIAMI-DADE COUNTY GOVERNMENT
MONTEREY REGIONAL AIRPORT MASTER PLAN TOPICAL QUESTIONS FROM THE PLANNING ADVISORY COMMITTEE AND TOPICAL RESPONSES
 MONTEREY REGIONAL AIRPORT MASTER PLAN TOPICAL QUESTIONS FROM THE PLANNING ADVISORY COMMITTEE AND TOPICAL RESPONSES Recurring topics emerged in some of the comments and questions raised by members of the
REGION OF WATERLOO INTERNATIONAL AIRPORT AIRPORT MASTER PLAN EXECUTIVE SUMMARY MARCH 2017
 REGION OF WATERLOO INTERNATIONAL AIRPORT AIRPORT MASTER PLAN EXECUTIVE SUMMARY MARCH 2017 Contact: Chris Wood, Airport General Manager cwood@regionofwaterloo.ca (519) 648-2256 ext. 8502 Airport Master
FNORTHWEST ARKANSAS WESTERN BELTWAY FEASIBILITY STUDY
 FNORTHWEST ARKANSAS WESTERN BELTWAY FEASIBILITY STUDY EXECUTIVE SUMMARY The 2030 Northwest Arkansas Regional Transportation Plan developed by the Northwest Arkansas Regional Planning Commission (NWARPC)
Air China Limited Announces 2010 Interim Results
 Air China Limited Announces 2010 Interim Results Record High First Half Results Leveraging New Opportunities to Drive Growth Hong Kong August 25, 2010 Air China Limited ( Air China or the Company, together
Opportunities in Non-Container Trade and the Expanding Cruise Industry
 Opportunities in Non-Container Trade and the Expanding Cruise Industry AAPA Commissioners Seminar Steven Cernak, Port Director Port of Galveston San Francisco, CA May 18, 2005 The Port Industry Is a highly
Port Everglades Master/Vision Plan Update
 Port Everglades Master/Vision Plan Update Environmental Stakeholder Meeting June 15, 2009 Discussion to Focus On: Updating the 2006 Port Everglades Master Plan Issues dealing with the Turning Notch Potential
The St. Joe Company. Raymond James Institutional Investors Conference March 10, 2009
 The St. Joe Company Raymond James Institutional Investors Conference March 10, 2009 Forward Looking Statements This presentation contains forward-looking statements about future events that are subject
Bigger, Deeper, Wider
 Bigger, Deeper, Wider About Port Freeport Government entity created by voters in 1925 Local sponsor for the Freeport Harbor Channel and engages with the U.S. Army Corps of Engineers Significant responsibilities
Study Design Outline. Background. Overview. Desired Study Outcomes. Study Approach. Goals (preliminary) Recession History
 Recession History") MIA BASELINE ACTIVITY FORECASTS, DERIVATIVE DATA AND FLEET MIX PROJECTIONS RESULTS SUMMARY ACCEPTANCE BRIEFING FOR THE AIRPORT AND SEAPORT COMMITTEE (ASC) JULY 15, 2010 Study Design Outline Background
MIA BASELINE ACTIVITY FORECASTS, DERIVATIVE DATA AND FLEET MIX PROJECTIONS RESULTS SUMMARY ACCEPTANCE BRIEFING FOR THE AIRPORT AND SEAPORT COMMITTEE (ASC) JULY 15, 2010 Study Design Outline Background
TOWN PLANNING SUBMISSION TO THE GREATER SYDNEY COMMISSION LANDS AT ARTARMON
 TOWN PLANNING SUBMISSION TO THE GREATER SYDNEY COMMISSION LANDS AT ARTARMON March 2017 TABLE OF CONTENTS 1.0 INTRODUCTION 3 2.0 THE SUBJECT SITE 4 3.0 STRATEGIC PLANNING CONTEXT 6 4.0 SUMMARY AND CONCLUSIONS
IATA ECONOMICS BRIEFING AIRLINE BUSINESS CONFIDENCE INDEX OCTOBER 2010 SURVEY
 IATA ECONOMICS BRIEFING AIRLINE BUSINESS CONFIDENCE INDEX OCTOBER SURVEY KEY POINTS Results from IATA s quarterly survey conducted in October show business conditions continued to improve during the third
Stimulating Airports is Stimulating the Economy
 Stimulating Airports is Stimulating the Economy House of Commons Standing Committee on Finance Pre-budget 2010 Submission August 14 th, 2009 Executive Summary Atlantic Canada Airports Association s (ACAA)is
Port Everglades 2014 Master/Vision Plan Update
 1 Port Everglades 2014 Master/Vision Plan Update Public Meeting May 28, 2014 2 Agenda Port Everglades Mission Project Background 2014 Master/Vision Plan Update Process Status of 2009 5-Year Master Plan
International Civil Aviation Organization WORLDWIDE AIR TRANSPORT CONFERENCE (ATCONF) SIXTH MEETING. Montréal, 18 to 22 March 2013
 SIXTH MEETING. Montréal, 18 to 22 March 2013") International Civil Aviation Organization WORKING PAPER 5/3/13 English only WORLDWIDE AIR TRANSPORT CONFERENCE (ATCONF) SIXTH MEETING Montréal, 18 to 22 March 2013 Agenda Item 2: Examination of key issues
International Civil Aviation Organization WORKING PAPER 5/3/13 English only WORLDWIDE AIR TRANSPORT CONFERENCE (ATCONF) SIXTH MEETING Montréal, 18 to 22 March 2013 Agenda Item 2: Examination of key issues
Port of Los Angeles CIP Shaun Shahrestani Chief Harbor Engineer Director of Construction September 27, 2018
 Port of Los Angeles CIP Shaun Shahrestani Chief Harbor Engineer Director of Construction September 27, 2018 Port of Los Angeles at a Glance Founded in 1907 Non-taxpayer supported Business port model 4,300
Delivering the Goods: Ports in the South
 Delivering the Goods: Ports in the South Sujit M. CanagaRetna The Council of State Governments Southern Legislative Conference (SLC) Atlanta, Georgia Presentation to the Southern Economic Development Council
Port Everglades Master/Vision Plan Update
 Port Everglades Master/Vision Plan Update Public Meeting June 24, 2013 Agenda Port Everglades Overview Project Background Infrastructure Needs Identified in 2009 Plan Review of Priority Projects Review
2017 STAKEHOLDER REPORT
 2017 STAKEHOLDER REPORT MESSAGE FROM THE CHAIR On behalf of the Halifax Port Authority (HPA) and its Board of Directors, we want to applaud the entire port community on making 2017 a record-breaking year
Annual Port Review. June 22, 2016
 Annual Port Review June 22, 2016 2 Port Everglades by the Numbers (FY2015 unless indicated) #1 Seaport in Florida by Revenue - $153 million #1 Container Port in Florida - (#10 in U.S.) by volume 1,060,507
JOSLIN FIELD, MAGIC VALLEY REGIONAL AIRPORT DECEMBER 2012
 1. Introduction The Federal Aviation Administration (FAA) recommends that airport master plans be updated every 5 years or as necessary to keep them current. The Master Plan for Joslin Field, Magic Valley
Press Release. Bilfinger 2017: Stable foundation laid for the future
 Press Release February 14, 2018 Bilfinger 2017: Stable foundation laid for the future Organic growth in orders received after three years of decline Trend reversal: Output volume better than expected Growth
Draft Concept Alternatives Analysis for the Inaugural Airport Program September 2005
 Section 10 Preferred Inaugural Airport Concept 10.0 Introduction The Preferred Inaugural Airport Concept for SSA was developed by adding the preferred support/ancillary facilities selected in Section 9
Air China Limited Announces 2009 Annual Results
 Air China Limited Announces 2009 Annual Results Record Operating Profit in Complex Market Environment Strengthened Position to Capture Growth Opportunities Hong Kong April 22, 2010 Air China Limited (
Land area 1.73 million km 2 Queensland population (as at 31 December 2017) Brisbane population* (preliminary estimate as at 30 June 2017)
 Brisbane population* (preliminary estimate as at 30 June 2017)") Queensland - 11 Queensland OVERVIEW Queensland is nearly five times the size of Japan, seven times the size of Great Britain, and two and a half times the size of Texas. Queensland is Australia s second
Queensland - 11 Queensland OVERVIEW Queensland is nearly five times the size of Japan, seven times the size of Great Britain, and two and a half times the size of Texas. Queensland is Australia s second
ANA HOLDINGS Announces Mid-Term Corporate Strategy for FY ~Strengthening the foundations of the business and looking into the future~
 ANA HOLDINGS NEWS ANA HOLDINGS Announces Mid-Term Corporate Strategy for FY2018-2022 ~Strengthening the foundations of the business and looking into the future~ TOKYO, February 1, 2018 ANA HOLDINGS (hereinafter
NAFTA Next Chicago, Illinois April 23 rd, 2014
 NAFTA Next Chicago, Illinois April 23 rd, 2014 IMPORTANCE OF THE PORT OF MIAMI TO FLORIDA/U.S. One of the top container seaports in Florida Second largest economic engine of Miami-Dade County Number 11
Inner Harbor Navigation Canal Lock. Victor A. Landry III Operations Manager, GIWW New Orleans District U.S. Army Corps of Engineers
 Inner Harbor Navigation Canal Lock Victor A. Landry III Operations Manager, GIWW New Orleans District U.S. Army Corps of Engineers 22 August 2008 GIWW & IHNC Lock Overview Dewatering Challenges GICA 103
Panama Canal Expansion Antecedents
 Panama Canal Expansion Antecedents May 1879: Baron Godin de Lepinay Canal Lock proposal at the International Congress for Study of an Interoceanic Canal ignored. January 1906: Report of the Consulting
Greater Orlando Aviation Authority
 Greater Orlando Aviation Authority Orlando International Airport & Orlando Executive Airport Budgets Fiscal Year 2017-2018 Greater Orlando Aviation Authority Orlando, Florida Greater Orlando Aviation Authority
Chapter 1 Introduction
 Chapter 1 Introduction Introduction and Purpose The Airport Master Planning process evaluates an airport s physical facilities, establishes a forecast for future demand, and identifies a development plan
Port Everglades Overview
 Port Everglades Overview Broward County Charter Review Infrastructure Subcommittee June 7, 2017 Steven M. Cernak, P.E., PPM Chief Executive & Port Director Jurisdictional Area Located in the cities of:
Massachusetts Port Authority Sustainable Design Standards and Guidelines. AAPA Annual Convention Galveston, TX October 28, 2009
 Massachusetts Port Authority Sustainable Design Standards and Guidelines AAPA Annual Convention Galveston, TX Overview of Massachusetts Port Authority Independent State Authority Governor appoints Board
NSW PRE-BUDGET STATEMENT FUTURE ECONOMY FUTURE JOBS
 2017-18 NSW PRE-BUDGET STATEMENT FUTURE ECONOMY FUTURE JOBS Executive Summary The 2017-18 NSW State Budget presents an opportunity for the NSW Government to future-proof the tourism and transport sectors.
IATA ECONOMIC BRIEFING FEBRUARY 2007
 IATA ECONOMIC BRIEFING FEBRUARY 27 NEW AIRCRAFT ORDERS KEY POINTS New aircraft orders remained very high in 26. The total of 1,834 new orders for Boeing and Airbus commercial planes was down slightly from
29 December Canada Transportation Act Review Secretariat 350 Albert Street Ottawa ON K1A 0N5
 29 December 2014 BHP Billition Canada Inc. 130 3rd Avenue South Saskatoon SK S7K 1L Canada Tel +1 306 385 8400 www bhpbilliton.com Canada Transportation Act Review Secretariat 350 Albert Street Ottawa
FASTER. SAFER. SMARTER.
 ASIANNORTH AMERICAN TRADE: FASTER. SAFER. SMARTER. The Lazaro CardenasKansas City Corridor refers to a trade route linking Kansas City to key AsiaPacific markets at the port of Lazaro Cardenas in the State
Chapter 2 FINDINGS & CONCLUSIONS
 Chapter 2 FINDINGS & CONCLUSIONS 2.01 GENERAL Dutchess County acquired the airport facility in 1947 by deed from the War Assets Administration. Following the acquisition, several individuals who pursued
American Institute of Marine Underwriters
 American Institute of Marine Underwriters Mr. Scott Bergeron Chief Executive Officer, Liberian Registry Commissioner, Virginia Port Authority May 8, 2013 1 Existing Lock Dimensions vs. Expanded Lock Dimensions
CONTACT: Investor Relations Corporate Communications
 NEWS RELEASE CONTACT: Investor Relations Corporate Communications 435.634.3200 435.634.3553 Investor.relations@skywest.com corporate.communications@skywest.com SkyWest, Inc. Announces Second Quarter 2016
Queensland Tourism Aviation Blueprint to 2016
 Queensland Tourism Aviation Blueprint to 2016 tq.com.au Blueprint outline The purpose of the Queensland Tourism Aviation Blueprint to 2016 is to develop the strategic framework that will guide aviation
Executive Summary. MASTER PLAN UPDATE Fort Collins-Loveland Municipal Airport
 Executive Summary MASTER PLAN UPDATE Fort Collins-Loveland Municipal Airport As a general aviation and commercial service airport, Fort Collins- Loveland Municipal Airport serves as an important niche
Draft Concept Alternatives Analysis for the Inaugural Airport Program September 2005
 Draft Concept Alternatives Analysis for the Inaugural Airport Program September 2005 Section 3 - Refinement of the Ultimate Airfield Concept Using the Base Concept identified in Section 2, IDOT re-examined
Auto Port Operational Strategy. Roy A. Schleicher Senior Director Trade Development & Global Marketing
 Auto Port Operational Strategy Roy A. Schleicher Senior Director Trade Development & Global Marketing October 2008 Strategic location of Jacksonville, Florida 10 75 95 Jacksonville Strategic location of
CHAPTER 1 EXECUTIVE SUMMARY
 CHAPTER 1 EXECUTIVE SUMMARY 1 1 EXECUTIVE SUMMARY INTRODUCTION William R. Fairchild International Airport (CLM) is located approximately three miles west of the city of Port Angeles, Washington. The airport
NATIONAL AIRSPACE POLICY OF NEW ZEALAND
 NATIONAL AIRSPACE POLICY OF NEW ZEALAND APRIL 2012 FOREWORD TO NATIONAL AIRSPACE POLICY STATEMENT When the government issued Connecting New Zealand, its policy direction for transport in August 2011, one
Airport Planning Area
 PLANNING AREA POLICIES l AIRPORT Airport Planning Area LOCATION AND CONTEXT The Airport Planning Area ( Airport area ) is a key part of Boise s economy and transportation network; it features a multi-purpose
EXHIBIT K TERMINAL PROJECT PROCEDURES PHASE I - DEVELOPMENT OF TERMINAL PROGRAM & ALTERNATIVES
 EXHIBIT K TERMINAL PROJECT PROCEDURES PHASE I - DEVELOPMENT OF TERMINAL PROGRAM & ALTERNATIVES Over the term of the Master Amendment to the Airline Use and Lease Agreement, the Kansas City Aviation Department
BUILDING THE CAPACITY FOR GREATNESS 2019 STATE OF THE PORT
 BUILDING THE CAPACITY FOR GREATNESS 2019 STATE OF THE PORT 1 WE ARE A CATALYST FOR COMMERCE WE ARE CREATING THE CAPACITY FOR GREATNESS WE ARE DRIVING PRODUCTIVITY Q & A Attracting growth, fostering development,
 Executive Summary This document contains the Master Plan for T. F. Green Airport. The goal of a master plan is to provide a framework of potential future airport development in a financially feasible manner,
Air China Limited Announces 2010 Annual Results
 Air China Limited Announces 2010 Annual Results Profit reaches record high on strong economic growth Hong Kong March 29, 2011 Air China Limited ( Air China or the Company, together with its subsidiaries,
Municipal and Regional District Tax Imposition Bylaw No and Metro Vancouver Letter of Support
 To: From: Re: City of Richmond General Purposes Committee Andrew Nazareth General Manager, Finance and Corporate Services Report to Committee Date: October 11, 2016 File: 08-4150-03-01/2016- Vol01 Municipal
ECONOMIC DEVELOPMENT INCENTIVES AND PROGRAMS. Provide Airport Encroachment Protection. Standardize Ad Valorem Tax Exemptions
 ECONOMIC MASTER PLAN Florida s airport industry indicates the following programs are needed to maximize its impact on the State s economy: AIRPORT SECURITY Develop Model Security Plan for General Aviation
Lake Erie Commerce Center Traffic Analysis
 LOCATION: East of NYS Route 5 at Bayview Road Town of Hamburg Erie County, New York PREPARED BY: Wendel Companies 140 John James Audubon Parkway Suite 200 Amherst, New York 14228 January 2012 i ii Table
MASSACHUSETTS PORT AUTHORITY REQUEST FOR LETTERS OF INTEREST DEVELOPMENT OF THE MASSPORT MARINE TERMINAL
 MASSACHUSETTS PORT AUTHORITY REQUEST FOR LETTERS OF INTEREST DEVELOPMENT OF THE MASSPORT MARINE TERMINAL The Massachusetts Port Authority ( Massport ) is seeking Letters of Interest for available development
Canada s Airports: Enabling Connectivity, Growth and Productivity for Canada
 Canada s Airports: Enabling Connectivity, Growth and Productivity for Canada 2018 Federal Budget Submission House of Commons Standing Committee on Finance Introduction The Canadian Airports Council is
Potomac River Commuter Ferry Feasibility Study & RPE Results
 1.1 Introduction The Prince William County Department of Transportation conducted a route proving exercise (RPE) and feasibility study of a proposed commuter ferry service on the Potomac River between
STUDY OVERVIEW MASTER PLAN GOALS AND OBJECTIVES
 INTRODUCTION An Airport Master Plan provides an evalua on of the airport s avia on demand and an overview of the systema c airport development that will best meet those demands. The Master Plan establishes
The Corporation of the City of Kawartha Lakes Council Report
 The Corporation of the City of Kawartha Lakes Council Report Report Number ENG2017-008 Date: September 12, 2017 Time: 2:00 p.m. Place: Council Chambers Ward Community Identifier: All Subject: Author Name
Chapter 8.0 Implementation Plan
 Chapter 8.0 Implementation Plan 8.1 Introduction This chapter is the culmination of the analytical work accomplished in the previous chapters. The result is a prioritized list of the essential projects.
U.S. HOTEL SUPPLY GROWTH STILL IN CHECK WITH DEMAND
 MAY 2015 U.S. HOTEL SUPPLY GROWTH STILL IN CHECK WITH DEMAND Susan Furbay Vice President of Business Development HVS 369 Willis Avenue, Mineola, NY 11501, USA Years of rising average daily rates and demand,
Citi Industrials Conference
 Citi Industrials Conference June 13, 2017 Andrew Levy Executive Vice President and Chief Financial Officer Safe Harbor Statement Certain statements included in this presentation are forward-looking and
Tourism Report Spring A Report Prepared by the Sonoma County Economic Development Board. Ben Stone, Director
 Tourism Report Spring A Report Prepared by the Sonoma County Economic Development Board Ben Stone, Director Though long renowned for its picturesque scenery, Sonoma County has steadily gained recognition
Airport passenger traffic reaches new heights in 2017; air freight posts heftiest gain since the recovery following the Great Recession
 Airport passenger traffic reaches new heights in 2017; air freight posts heftiest gain since the recovery following the Great Recession Montreal, 28 February 2018 Airports Council International (ACI) World
Draft Executive Summary
 Draft Executive Summary The Juneau Tourism Plan development process was undertaken by Egret Communications and ARA Consulting in April 2001, under contract with the City and Borough of Juneau, Alaska.
B GEORGIA INFRASTRUCTURE REPORT CARD AVIATION RECOMMENDATIONS DEFINITION OF THE ISSUE. Plan and Fund for the Future:
 2014 GEORGIA INFRASTRUCTURE REPORT CARD B + RECOMMENDATIONS Plan and Fund for the Future: While the system continues to enjoy excess capacity and increased accessibility it still needs continued focus
CHAPTER 4: ALTERNATIVES
 MSP Long Term Comprehensive Plan Update Metropolitan Airports Commission 4.1 INTRODUCTION CHAPTER 4: ALTERNATIVES Several alternatives were developed and evaluated based on their capability to meet the
Welcome to AVI AFRIQUE 2017
 Welcome to AVI AFRIQUE 2017 Single African sky and Functional Airspace Blocks: Improving Air Traffic Management The global ATM operational concept is fundamental framework drive ATM operational requirements,
Compustat. Data Navigator. White Paper: Lodging Industry-Specific Data
 Compustat Data Navigator White Paper: Lodging Industry-Specific Data November 2008 Data Navigator: Lodging Industry-Specific Data There are several important lodging metrics to that are unavailable on
City of Kingston Report to Council Report Number
 To: From: Resource Staff: City of Kingston Report to Council Report Number 15-423 Mayor and Members of Council Date of Meeting: November 3, 2015 Subject: Executive Summary: Cynthia Beach, Commissioner,
The Government s Aviation Strategy Transport for the North (TfN) response
 response") The Government s Aviation Strategy Transport for the North (TfN) response Transport for the North Background Good transport links are a crucial part of a strong economy supporting labour markets and delivering
The Government s Aviation Strategy Transport for the North (TfN) response Transport for the North Background Good transport links are a crucial part of a strong economy supporting labour markets and delivering
ACI EUROPE POSITION. A level playing field for European airports the need for revised guidelines on State Aid
 ACI EUROPE POSITION A level playing field for European airports the need for revised guidelines on State Aid 16 June 2010 1. INTRODUCTION Airports play a vital role in the European economy. They ensure
Bloor Street West Rezoning Application for a Temporary Use By-law Final Report
 STAFF REPORT ACTION REQUIRED 3741 3751 Bloor Street West Rezoning Application for a Temporary Use By-law Final Report Date: June 12, 2007 To: From: Wards: Reference Number: Etobicoke York Community Council
Submission to Ministry of Transport: International Air Transport Policy Review. New Zealand Air Line Pilots Association
 Submission to Ministry of Transport: International Air Transport Policy Review New Zealand Air Line Pilots Association Ministry of Transport - International Air Transport Policy 2 Objective of NZ international
WELLINGTON $422 MILLION $614 MILLION $83 MILLION 22% SPEND $1.9 BILLION
 WELLINGTON WELLINGTON $1.9 BILLION FORECAST TOTAL WELLINGTON INVESTMENT The Wellington region s transport challenges are dominated by the region s concentration of population in the metropolitan cities,
3. Proposed Midwest Regional Rail System
 3. Proposed Midwest Regional Rail System 3.1 Introduction The proposed Midwest Regional Rail System (MWRRS) will operate in nine states, encompass approximately 3,000 route miles and operate on eight corridors.
Mr. Adel Al-Banwan Deputy CEO
 The 8th Forum for Listed Companies and Analysts ALAFCO Aviation Lease and Finance Co. Mr. Adel Al-Banwan Deputy CEO (18 th April 2016) ALAFCO Aviation Lease and Finance Company K.S.C.P. ALAFCO Aviation
PO Box 257 PO Box 257 PARRAMATTA NSW 2124 PARRAMATTA NSW 2124
 31 March 2017 Sean O Toole Sheridan Dudley District Commissioner - West District Commissioner - South West Greater Sydney Commission Greater Sydney Commission PO Box 257 PO Box 257 PARRAMATTA NSW 2124
12, 14 and 16 York Street - Amendments to Section 16 Agreement and Road Closure Authorization
 REPORT FOR ACTION 12, 14 and 16 York Street - Amendments to Section 16 Agreement and Road Closure Authorization Date: April 27, 2018 To: Toronto and East York Community Council From: Senior Strategic Director,
Tourism Towards 2030
 Tourism Towards 23 Agenda Item 5a 24 th Joint Meeting of the UNWTO Commission for East Asia and the Pacific and the UNWTO Commission for South Asia 4 May 212 Chiang Mai, Thailand million Tourism 22 Vision
CONTACT: Investor Relations Corporate Communications
 NEWS RELEASE CONTACT: Investor Relations Corporate Communications 435.634.3200 435.634.3553 Investor.relations@skywest.com corporate.communications@skywest.com SkyWest, Inc. Announces Second Quarter 2017
APPENDIX B: NPIAS CANDIDATE AIRPORT ANALYSIS
 APPENDIX B: NPIAS CANDIDATE AIRPORT ANALYSIS The National Plan of Integrated Airport Systems (NPIAS) is the Federal Aviation Administration s (FAA) national airport plan. The NPIAS includes nearly 3,500
https://gsc-public-1.s3-ap-southeast-2.amazonaws.com/s3fs-public/draft-eastern-city-district-plan.pdf
 GSC Sydney East Rev Draft -references Port Botany - 30 https://gsc-public-1.s3-ap-southeast-2.amazonaws.com/s3fs-public/draft-eastern-city-district-plan.pdf Pages 6. The District s freight routes, particularly
CHAPTER 1: INTRODUCTION
 CHAPTER 1: INTRODUCTION Purpose and Scope The information presented in this report represents the study findings for the 2016 Ronan Airport Master Plan prepared for the City of Ronan and Lake County, the
THE SHIFTING LANDSCAPE for THE MAINTENANCE, REPAIR AND OVERHAUL MARKET
 MERGERS & ACQUISITIONS PRIVATE CAPITAL STRATEGIC ADVISORY THE SHIFTING LANDSCAPE for THE MAINTENANCE, REPAIR AND OVERHAUL MARKET Aerospace, Defense & Government Services Report The Shifting Landscape for
 Existing Conditions AIRPORT PROFILE Passenger Terminal Complex 57 air carrier gates 11,500 structured parking stalls Airfield Operations Area 9,000 North Runway 9L-27R 6,905 Crosswind Runway 13-31 5,276
South Jersey Port Corporation
 South Jersey Port Corporation An Agency of the State of New Jersey Rail / Port Infrastructure Enhancements Jay Jones, Deputy Executive Director South Jersey Port Corporation SJPC s enabling legislation
Waterfront Plan Working Group Meeting Maritime & Water-Dependent Uses Meeting Agenda
 Waterfront Plan Working Group Meeting Maritime & Water-Dependent Uses Meeting Agenda Overview of Port Maritime & Water-Dependent Uses Summary of Maritime Planning and Policies Q&A and Discussion of Operational