This report was prepared for the Alaska Department of Environmental Conservation in fulfillment of contract
|
|
|
- Camron Bailey
- 6 years ago
- Views:
Transcription
1
2 & P.O. Box 175 Seldovia, Alaska tel fax This report was prepared for the Alaska Department of Environmental Conservation in fulfillment of contract
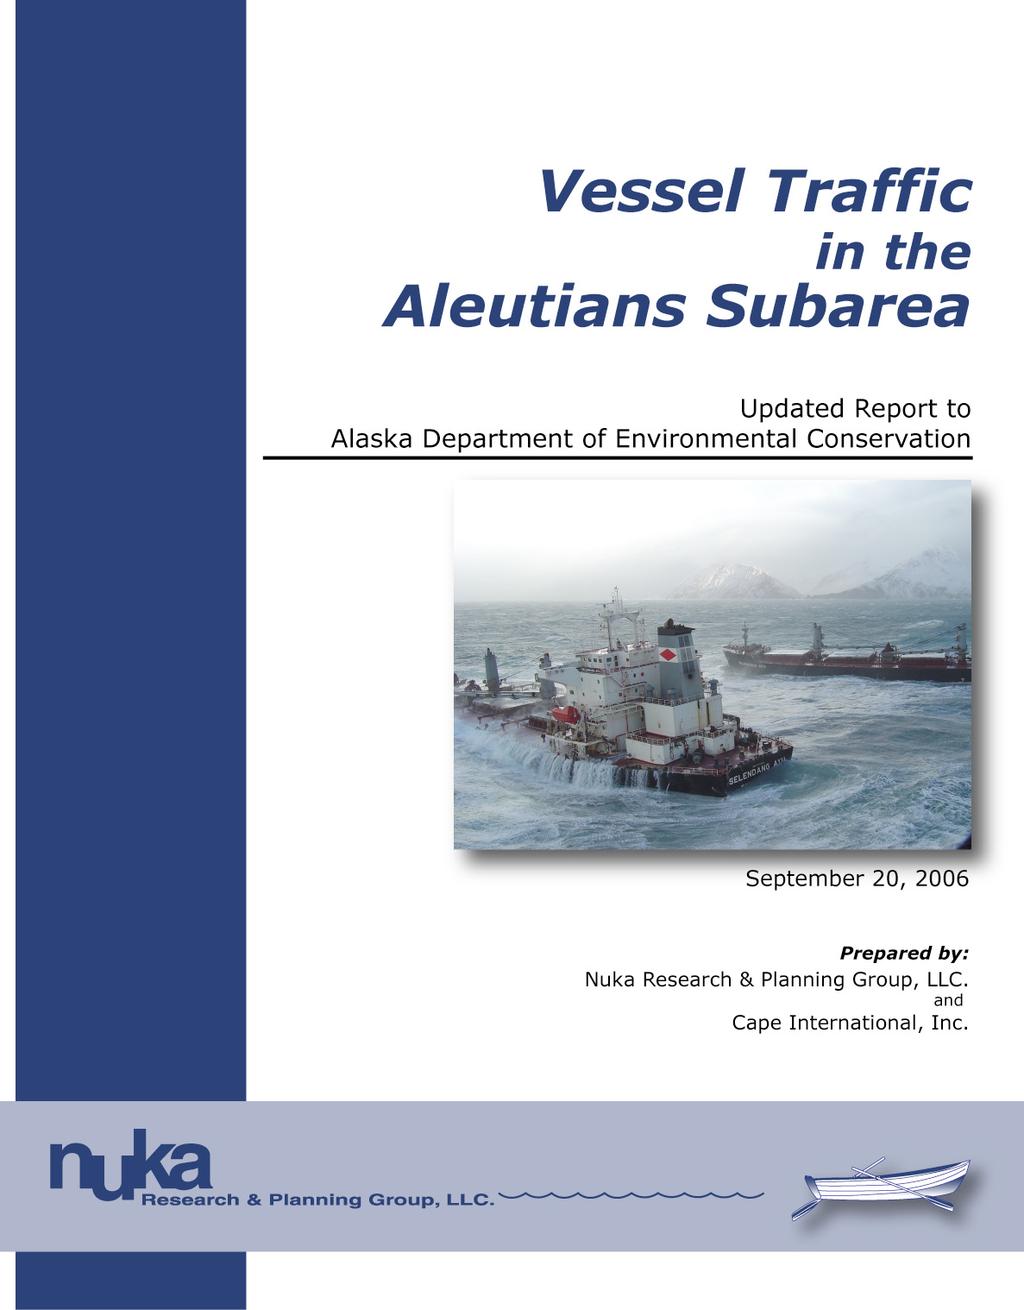
3 Executive Summary The 2004 bulk grain ship M/V Selendang Ayu oil spill at Unalaska Island in Alaska s Aleutian Islands focused attention on the oil spill risks posed by vessels transiting the North Pacific great circle route from the west coast of North America to Asia. For vessels traveling to and from northern Pacific ports, the great circle route intersects the Aleutian Islands, creating an overlap of international vessel traffic with the local traffic near this remote island chain. The Aleutians are also home to the United State s largest and most valuable commercial fishing grounds and the Alaska Maritime National Wildlife Refuge. This report considers the available data regarding vessel traffic within and through the Aleutians. In some cases, data is limited because foreign vessels transiting the area are not required to report to the U.S. Coast Guard or the State of Alaska. However, the following information was drawn from the available data: Based on automated tracking data collected from October 2005 through June 2006, about 3,100 ships per year (8-9 vessels each day) pass through the Aleutians (primarily westbound) on great circle, innocent passage, trans- Pacific voyages, including: - Approximately 1,200 container ships (39% of total) per year with a median fuel capacity of 1.6 million gallons of persistent fuel oil; - As many as 1,300 bulk and general freight ships (41% of total) per year with a median fuel capacity of approximately 470,000 gallons of mostly persistent fuel oil, - About 265 motor vehicle carriers per year (8.5% of total) per year with an estimated average fuel capacity of 500,000 gallons of persistent fuel oil; - About 110 reefer (refrigerated) cargo ships (3.5% of total) per year with a median fuel oil capacity of 317,000 gallons of mostly persistent fuel oil tankers per year (0.7%), transporting about 400 million gallons of refined oil. - The remaining 7.3% of the total is comprised of other vessel types with a variety of persistent and non-persistent fuel. About 400 port calls per year are made by freight ships to Aleutian ports which include: container ships per year with a typical fuel capacity of 1.6 million gallons of persistent fuel oil each; reefer (refrigerated) cargo ships with a typical fuel oil capacity of 317,000 gallons of primarily persistent fuel oil; - The remaining local port calls are mostly by tugs towing barges. Few passenger vessels operate or pass through the Aleutians. In 2006, four cruise ships (fuel capacity ranging from 170, ,000 gallons of persistent fuel oil) called at Dutch Harbor; two smaller passenger ships (range of 54, ,000 gallons of diesel fuel oil) made a total of seven port calls
4 at Dutch Harbor; and, the Alaska Marine Highway ferry Tustumena (67,000 gallons non-persistent fuel oil) made eleven round trips between Homer and Dutch Harbor. About 300 million gallons of non-persistent fuel oil is moved into and through the Aleutians as cargo for use by Aleutian and other Western Alaska communities and industry on about 130 voyages by tank barges and in a single tank ship; About 400 fishing vessels operate in the rich Aleutian fisheries that are valued in excess of 1.5 billion dollars. Fishing vessels typically have a fuel capacity of about 30,000 gallons and almost all carry non-persistent fuel; There are four ocean-going tugs resident in the Aleutians and over 100 tug voyages each year that transit the area with barges in tow; Forty-eight (48) casualties affecting seaworthiness of foreign vessels were reported in the Aleutians from 1991 through July These reports included 17 loss of maneuverability incidents. We believe that foreign vessel casualties are under reported; Four hundred and eighty-six (486) casualties on US vessels which affected vessel seaworthiness were reported in the Aleutians from 1990 through July US vessels reporting casualties were usually smaller than foreign vessels and primarily fishing vessels; and While most of the 400 vessels calling at Aleutian ports and the larger fishing vessels hold State oil spill contingency plans and certificates of financial responsibility, the great majority of the 3,100 annual great circle trans-pacific transits through the Aleutians are by vessels that have no State oil spill contingency plans and no State certificate of financial responsibility, because they are on innocent passage. Data sources we reviewed recorded 43 oil spills of note from vessels during a period from 1981 through July These spills totaled almost one million gallons. Sixty-two percent of the amount spilled was non-persistent oil and 38 percent was persistent oil. Twelve percent of the non-persistent spills were larger than 34,000 gallons, but these spills accounted for 66 percent of the volume of non-persistent oil spilled. Only 7 percent of the persistent oil spills were greater than 34,000 gallons, but these spills accounted for 99 percent of the volume of oil spilled. The information presented in this report shows that a wide variety and large number of vessels transit the Aleutians. A major trans-oceanic shipping route passes through North American s largest fishing grounds in an area notorious for adverse marine weather. 4
5 Table of Contents Executive Summary...3 Introduction...7 The northern great circle route of the North Pacific Ocean...8 Analysis of Vessel Traffic in the Aleutians Subarea...8 Vessel Type and Fuel Oil Capacity...10 Trans-Pacific Vessel Traffic Passing through the Aleutians Subarea...12 Vessel Traffic Calling in the Aleutians Subarea Tanker and Tank Barge Vessel Traffic in the Aleutians Subarea.. 18 Fishing Vessel Traffic in the Aleutians Subarea Passenger Vessel Traffic in the Aleutians Subarea Tug Traffic in the Aleutians Subarea...26 Vessel Accidents and Casualties in the Aleutians Subarea Shipwrecks...28 US Flag Vessel Casualties...28 Foreign Flag Vessel Casualties...30 Spills and Potential Spills...32 Summary...33 Recommendations for Additional Study...36 References...38 Appendices...40 Appendix A Fact sheets on the major fisheries in the Aleutians Subarea...42 Appendix B Shipwrecks on or near Islands of the Alaska Maritime National Wildlife Refuge...50 Appendix C Information on selected casualties in the Aleutians Subarea
6 List of Figures Figure 1. Figure 2. Figure 3. Figure 4. North Pacific great circle route drawn on a gnomonic map projection where a great circle is a straight line Mercator projection map showing the northern and southern great circle routes across the North Pacific Range and median fuel capacity of various types of vessels that may call at Aleutian ports or transit Aleutians on trans-pacific voyages Primary traffic routes of vessels on the Northern Pacific great circle route traveling through the Aleutians Subarea Figure 5. Trans-Pacific vessel traffic through Unimak Pass by vessel type Figure 6. A snapshot of vessel traffic detected by the AIS receiver at Unimak Pass Figure 7. Primary traffic routes of vessels calling at ports in the Aleutians Subarea Figure 8. Port calls to Unalaska/Dutch Harbor by vessel type and month in Figure 9. Primary traffic routes of non-persistent oil deliveries in the Aleutians Subarea 19 Figure 10. Primary fishing grounds in the Aleutians Subarea Figure 11. Estimated fishing vessel effort in the Aleutians Subarea by month in Figure 12. Cruise ship and ferry routes in the Aleutians Subarea Figure 13. Tug boat routes in the Aleutians Subarea Figure 14. Foreign vessel casualties in the Aleutians Subarea Figure 15. Actual or potential vessel spills in the Aleutians Subarea Figure 16. Combined vessel information for the Aleutians Subarea List of Tables Table 1. Nontank Vessel profile by type, gross tonnage, and fuel capacity Table 2. Vessels on trans-pacific voyages using Unimak Pass Table 3. Vessel port calls in Unalaska/Dutch Harbor by type and month in Table 4. Table 5. Estimated non-persistent fuel oil transfers and delivery transits to selected subareas Vessel information from the 2004 Aleutians/Bering Sea groundfish fishing fleet Table 6. Passenger Vessels intending to operate in the Aleutians Subarea in Table 7. Table 8. Table 9. Known tug traffic in the Aleutians Subarea by vessel, port, number of trips per year and horsepower Number and types of US vessel casualties affecting seaworthiness reported in the Aleutians Subarea between June 22, 1990 and August 1, Foreign Vessel Casualties affecting seaworthiness reported to the US Coast Guard between September 12, 1991 and August 1,
7 Vessel Traffic in the Aleutians Subarea Updated Report to Alaska Department of Environmental Conservation 1 September 20, 2006 Introduction Several recent incidents involving freight vessels in transit near the Aleutian Islands have focused attention on the oil spill risk posed by vessels operating within the productive fishing grounds and sensitive wildlife habitats of Alaska s Aleutian chain. In December 2004, the M/V Selendang Ayu lost power, drifted aground, and broke apart near Unalaska Island, spilling an estimated 335,000 gallons of intermediate fuel oil and marine diesel oil. Approximately seven years earlier, another freighter, the M/V Kuroshima, ran aground at Unalaska Island and spilled approximately 40,000 gallons of Bunker C fuel oil. In July 2006, the car carrier M/V Cougar Ace capsized while transferring ballast approximately 200 nautical miles southwest of the Aleutians and was ultimately towed to an anchorage on Unalaska Island. While the Cougar Ace incident did not result in a significant spill, it was the third major freight vessel casualty in the vicinity of the Aleutian Islands in less than a decade. After the Kuroshima incident, the State of Alaska passed a law requiring nontank vessels greater than 400 gross tons that call on Alaska ports to file oil spill contingency plans with the state. The federal government has recently followed suit with a law requiring oil spill contingency plans for nontank vessels calling at US ports. 3 However, the Selendang Ayu was engaged in innocent passage through Alaska waters, while transiting the North Pacific great circle route from Seattle to China. The Cougar Ace was in international waters transiting the southern great circle route, well south of the Aleutians. 5 These vessels were therefore exempt from State and federal oil spill planning requirements. 6 1 This report was originally completed in April This revision (Updated Report, September 2006) updates the original report with new vessel traffic data. The 2005 version (Version 1) estimated trans-pacific vessel traffic passing through the Aleutians indirectly. Version 2 uses direct data from the automated identification system (AIS) receiver established at Unimak Pass in October In addition, the non-tank vessel profiles (Table 1) has been improved by increasing the number of vessels analyzed from 433 to See AS There are exceptions; for example public vessels are not required to carry a contingency plan. 3 Section 701(c) of the Coast Guard and Marine Transportation Act of 2004 (Pub. L ) (2004 Act) requires nontank vessel response plans for ships operating in US waters be prepared and submitted to the Coast Guard no later than one year after the date of enactment of the act (i.e., by August 8, 2005). Coast Guard regulations governing the content of the nontank vessel c-plans are still pending. 4 The Third United Nations Convention on Law of the Sea (UNCLOS III, also called simply the Law of the Sea or LOS) set the limit of territorial waters to 12 nautical miles ( km), in which area the controlling nation-state is free to set laws, regulate any use, and use any resource. Non-military vessels were given the right of innocent passage through any territorial waters. Innocent passage is the right of all ships to engage in continuous and expeditious surface passage through the territorial sea and archipelagic waters of foreign coastal states in a manner not prejudicial to its peace, good order, or security. Passage includes stopping and anchoring, but only if incidental to ordinary navigation or necessary by force majeure or distress, or for the purpose of rendering assistance to persons, ships, or aircraft in danger. 5 When the Cougar Ace did enter US/Alaska water, it did so as a distressed vessel, but voluntarily applied for and received a Nontank Vessel contingency plan from the State of Alaska. 6 The M/V Selendang Ayu, whose last port-of-call was Seattle, did have a US Certificate of Financial Responsibility (COFR) and a spill contingency plan for Puget Sound. Because the Selendang Ayu was adrift for approximately 40 hours before eventually grounding on Unalaska Island, the incident has raised questions regarding whether enhanced response capability is needed to rescue vessels in distress as they travel in the vicinity of the Aleutian Islands. However, a detailed discussion of rescue tugs and other options are beyond the scope of this report. 7
8 At the time of the Selendang Ayu casualty, it was known that vessels passed through the Aleutians on trans-pacific voyages between East Asia and North America ports. The number and type of vessels using this trade route was not known. This report characterizes the type and amount of vessel traffic moving to, from, within and through the Aleutians Subarea. 7 This includes available data regarding: The number, size, and type of vessels that transit the great circle route between the coastal ports of North America and East Asia ports, and the general type and quantity of fuel oil capacity. The number, type, and size of vessels calling at Aleutian ports. Type and quantity of oil transported as cargo to and through the Aleutians Subarea. Current tugboat traffic in the Aleutians, particularly with regard to tugs that may be able to come to the aid of a stricken vessel. The northern great circle route of the North Pacific Ocean A great circle is the shortest distance between two points on a sphere. Vessels transiting an ocean between two continents may follow a great circle route because it is the shortest distance, or they may deviate from the great circle route where favorable weather and sea states allow for faster travel. On many map projections a great circle route is not a straight line. Figure 1 shows a gnomonic map projection of the North Pacific where the great circle route is a straight line. As seen on this map, a great circle route from Yokohama, Japan to Seattle passes through Unimak Pass and the Aleutian Islands. Figure 2 shows this same route on a Mercator projection where, because the map is flat and the earth is curved, the route appears as a great circle, or more accurately, a semi-circle. Analysis of Vessel Traffic in the Aleutians Subarea For the purpose of this analysis, information on vessel traffic in the Aleutians Subarea was considered to identify the annual numbers of vessels carrying persistent and non-persistent oils as fuel or bunkers and to estimate the quantities of oil onboard. No single data set contains all information needed to develop a precise picture of the number, type, size, and fuel capacity for vessels transiting the Aleutians. Vessels transiting the area in innocent passage are not required to report to the U.S. Coast Guard or the State of Alaska. Information gathered from the sources used in this report is presented in various forms that are not always comparable. For example, the U.S. Coast Guard and State of Alaska use dissimilar vessel 7 Throughout this study, the geographic definition of the Aleutians Subarea will apply to any references to the Aleutian Islands. The Aleutians Subarea as defined by the Alaska Federal/State Preparedness Plan for Response to Oil & Hazardous Substance Discharges/Releases (Unified Plan) is the area encompassed by the boundaries of the Aleutians East Borough, the Aleutians West Coastal Resource Service Area, and the Pribilof Islands, including adjacent shorelines and state waters. Generally south of N and west of longitude 156 W. 8

 receiver recently established at Scotch Cap, Unimak Pass; Calculating tanker cargo capacity for AIS reports and")
9 Figure 1. North Pacific great circle route drawn on a gnomonic map projection where a great circle is a straight line. Source: Adapted from FAA Chart: North Pacific Route Chart/Northeast Area. classification schemes. In developing this analysis, we compared, combined, and extrapolated information from similar, but not exact, datasets to provide the best possible estimates. These methods included: Using the Alaska Department of Environmental Conservation (ADEC) nontank vessel contingency plan database to characterize types of vessels for size and fuel capacity; Using 9 months 8 of vessel tracking data from the ship automated identification system (AIS) receiver recently established at Scotch Cap, Unimak Pass; Calculating tanker cargo capacity for AIS reports and records available on Lloyd s Register; Figure 2. Mercator projection map showing the northern and southern great circle routes across the North Pacific. Source: U.S. Coast Guard, Maritime Domain Awareness Center. 8 October 2005 through June

10 Correlating the National Marine Fisheries Service groundfish fishery observer s database with the Alaska Commercial Fisheries Entry Commission s vessel database to estimate the size and fuel capacity of this fleet. Vessel Type and Fuel Oil Capacity With regard to vessel type and fuel oil capacity, the largest database is contained within the applications for nontank vessel (NTV) certificates of financial responsibility required for vessels at and over 400 gross tons operating in Alaska state waters. 9 Although many of the vessels on innocent passage through Unimak Pass do not have spill plans filed with the Alaska Department of Environmental Conservation (ADEC), the 1608-vessel ADEC database, summarized in Table 1 and Figure 3, provides the best available profile of vessels by type. 10 Information from this database is applied to subsequent analysis and discussion of vessel traffic. Information regarding the type and quantity of fuel oil used by each vessel type is summarized in Table 1. For the purpose of this discussion, persistent fuel oils are heavy or intermediate fuel oils with specific gravities near 1.0. Nonpersistent fuel oils are less dense and include marine diesel and #2 fuel oil. Figure 3. Range and median fuel capacity of various types of vessels that may call at Aleutian ports or transit the Aleutians on trans-pacific voyages. Source: Alaska Department of Environmental Conservation, Nontank Vessel Database. NOTE: See Table 1 for additional detail. 9 Alaska State waters generally extend 3 miles from the outermost shorelines and headlands. 10 It should be noted that many of the 1608 vessels in the ADEC database have never sailed in Alaska waters but apply for certificates of financial responsibility with ADEC in case the need should arise. 10
11 Table 1. Nontank Vessel profile by type, gross tonnage, and fuel capacity. 11 Vessel Type (number) Gross Tonnage* Median (Range) Fuel Capacity Gallons** IFO and Diesel Median (Range) Comments All Vessels (1608) Cargo-Bulk Carrier (967) 19,900 (683-92,570) 467,300 (27,000 1,836,700) Nearly all use persistent fuel oil. Cargo-Container (100) 34,230 (455-65,792) 1,574,750 (113,000 2,736,600) Nearly all use persistent fuel oil. Cargo-Freight (85) 25,930 (496-38,749) 593,000 (39, ,500) Most use persistent fuel oil. Cargo-LNG/LPG (78) 25,300 ( ,174) 911,550 (275,180 1,511,160) Nearly all use persistent fuel oil. Cargo-Reefer (172) 5,300 (487-13,876) 317,080 (20,370 1,784,200) Most use persistent fuel oil. Fishing-Catcher (46) 652 (441-5,190) 63,590 (26, ,514) Virtually all use persistent fuel oil. Fishing-Factory Trawler (23) 1,593 (496 7,765) 173,880 (60, ,310) All but one use nonpersistent fuel oil. Fishing-General (25) 497 (405 1,823) 61,320 (25, ,680) Non-persistent fuel oil. Fishing-Processor (27) 2,200 (499-17,845) 152,712 (35,154-1,008,000) All but one use nonpersistent fuel oil. Cable Layer (12) 10,540 (5,750-13,201) 727,270 (96,012 1,050,700) Most use nonpersistent fuel oil. Seismic Research (3) 3,586 (926 3,779) 276,650 (179, ,370) Non-persistent fuel. Tug-Barge Combo (18) 680 (454 4,391) 95,280 (54, ,440) Non-persistent fuel. Ferry-AMHS (8) 2,978 (1,280-12,635) 94,731 (13, ,416) Non-persistent fuel. Passenger vessels (6) 4,709 ( ) 87,150 (7, ,236) Non-persistent fuel. Cruise Ships (38) 65,595.5 (13, ,875) 887,313 (256,872-1,195,446) Persistent fuel oil. * Gross Tonnage or Gross Register Tonnage is the internal volume of a vessel plus the space on exposed cargo decks (with some exceptions, depending on the assessing body). ** Conversions used for this report include: One tonne (metric) crude oil = 7.30 barrels = gallons; One tonne (metric) diesel = 7.29 barrels = 306 gallons; One tonne (metric) intermediate fuel oil (IFO) = 6.60 barrels = 277 gallons 11 Includes vessels that have applied for a State of Alaska Certificate of Financial Responsibility as of July 30, Only a portion of the vessels that have applied for an Alaska COFR have called at Alaska ports. Vessels providing incomplete information of fuel oil capacity were deleted from this data set. This data does not include 54 COFRs that listed vessel type as misc. 11
12 Trans-Pacific Vessel Traffic Passing through the Aleutians Subarea Figure 4 shows the primary traffic routes of vessels on the Northern Pacific great circle route traveling through the Aleutians Subarea. Vessels on this route pass through the Aleutian Island chain twice once at Unimak Pass 12 and once at a point west of Tanaga Island. 13 Analysis of nine months of data (October 1, 2005 through June 30, 2006) from the recently installed automated identification system (AIS) at Scotch Cap, Unimak Pass 14 reveals that 2,336 vessels, or on average, eight or nine deep draft vessels a day (or an estimated 3,100 vessels per year) used Unimak Pass for trans-north Pacific voyages. 15 AIS data information for each vessel detected provided the vessel name, vessel type, next and last port and call-sign. Therefore, we were able to characterize the type of shipping along this trans-pacific route. This characterization is presented in Table 2 and Figure 5. Table 2. Vessels on trans-pacific voyages using Unimak Pass. 16 Vessels on trans-pacific Voyages Using Unimak Pass Actual Data October 2005 to June 2006* Annual Estimated Passages** Barge Carrier 1 1 Bulk Carriers 825 1,100 Chemical Tanker Container Ships 916 1,221 Crude Oil Tankers 5 7 Fishing Vessels General Cargo Ships LNG Tanker Motor Vehicle Carrier NH3 Carrier 5 7 OBO 1 1 Passenger Ship 3 4 Product Tanker Reefer Cargo Ships RORO Towing Vessels 6 8 Wood Chip Carrier Other Consolidated/Grouped 2,336 3,115 Oil, Chemical, Gas, Product Carriers Container Ships 916 1,221 Motor Vehicle Carrier/RORO Reefer Cargo Ships Bulk Carriers 853 1,137 General Cargo Ships All Other ,336 3,115 NOTES: * Data source Scotch Cap (Unimak Pass) AIS receiver, provided by Marine Exchange of Alaska. ** Annual estimates were computed by expanding the 9 months of actual data to 12 months. This was done by dividing the actual number by 0.75 and rounding to the nearest whole number. 12 The mid-way point of Unimak Pass is approximately 70 nautical miles (by vessel) northeast of Dutch Harbor at latitude N, longitude W 13 West of longitude W. 14 First operational in October 2005, the automated identification system (AIS) receiver installed at Scotch Cap provided raw data on vessels passing through or near Unimak Pass from October 2005 through June This data has been analyzed and summarized for this report. 15 Assuming that the nine months of AIS data is accurate for the entire year. The current AIS data query for Unimak Pass only counts the most recent vessel transit if the vessel transits Unimak Pass twice or more within a 15-day period. Thus, AIS may underestimate the number of vessels trading between Alaska and Asia. We have attempted to correct this by reviewing actual Alaska port calls and revising ship-specific Unimak Pass transits accordingly. 16 Assuming that the nine months of AIS data is accurate for the entire year. The current AIS data query for Unimak Pass only counts the most recent vessel transit if the vessel transits Unimak Pass twice or more within a 15-day period. Thus, AIS may underestimate the number of vessels trading between Alaska and Asia. We have attempted to correct this by reviewing actual Alaska port calls and revising ship-specific Unimak Pass transits accordingly. 12

13 Figure 4. Primary traffic routes of vessels on the Northern Pacific great circle route traveling through the Aleutians Subarea. 13
.")

14 Figure 5. Trans-Pacific vessel traffic through Unimak Pass by vessel type. AIS data also reveals that the North Pacific great circle route through Unimak Pass is used primarily by vessels traveling west from North America to ports on the East Asia coast (See Figure 6). Moreover, vessels departing from southwest ports in North America often use Unimak Pass. AIS data shows that 17% of the vessels transiting Unimak Pass were sailing from California. Figure 6: A snapshot of vessel traffic detected by the AIS receiver at Unimak Pass. Note that most vessels are heading west. There is also a more southern great circle route across the North Pacific, as seen in Figure 2. This route passes south of the Aleutians and is generally used for voyages from East Asia to North America. Thus, deep draft commercial ships on trans-pacific voyages generally follow a counterclockwise trade route from North America through the Aleutians to Asia, then back to North America along routes south of the Aleutians. These trade routes take advantage of the counterclockwise ocean currents in the North Pacific. As a note of interest, the Selendang Ayu had just cleared Unimak Pass enroute to Dalian, China from Seattle when it lost power, eventually blowing aground and breaking up. The Cougar Ace was enroute to Vancouver from Tokyo on the southern great circle route outside of US/Alaska waters when the motor vehicle carrier suffered a catastrophic loss of stability. 14
15 The data obtained from AIS does not provide the fuel capacity of the vessels transiting Unimak Pass, nor does Lloyd s Register. We believe the best indicator of fuel capacity by vessel type can be estimated from the ADEC database of 1608 vessels that have received an Alaska Certificate of Financial Responsibility (See Table 1). Using the AIS data from Unimak Pass collected over nine months and the information on fuel oil capacity by ship type from the ADEC database, the profile for 92% of the ocean-going vessels on international trade passing through the Aleutians on great circle voyages can be characterized as follows: Approximately 1,200 container ships (39% of total) per year with a median fuel capacity of 1.6 million gallons of persistent fuel oil; As many as 1,300 bulk and general freight ships (41% of total) with a median fuel capacity of approximately 470,000 gallons of mostly persistent fuel oil, About 265 motor vehicle carriers per year (8.5% of total) with an estimated average fuel capacity of 500,000 gallons of persistent fuel oil 17 ; About 110 reefer (refrigerated) cargo ships (3.5% of total) with a median fuel oil capacity of 317,000 gallons of mostly persistent fuel oil. Given the fuel consumption required to reach the Aleutians from an East Asia or North America port, vessels traveling through the Aleutians will carry at least 100,000 to 200,000 gallons less fuel than maximum capacity. 18 The remaining 8% of the vessels transiting Unimak Pass consist of tank vessels, passenger ships, towing vessels, and other miscellaneous ships. These vessels include 20 to 22 tankers per year, transporting about 400 million gallons of oil. The North Pacific great circle route intersects the Aleutian archipelago at both Unimak Pass and the western Aleutians. 19 This trade route crosses the transit lanes and fishing grounds of the largest fisheries in North America, which are valued in excess of 1.5 billion dollars. 20 The North Pacific great circle route also passes through the Alaska Maritime National Wildlife Refuge, which is home to 40 million seabirds and numerous marine mammals The ADEC database does not list motor vehicle carriers as a ship type. We assume these vessels have a fuel oil capacity within the range of bulk and freight carriers. As a point of interest, the motor vehicle carrier Cougar Ace was reported to be carrying 34,000 gallons of diesel and 120,000 gallons of heavy fuel oil (154,000 gallons total) at the time of its casualty south of the Aleutians on July 23, An earlier analysis conducted in 2005 before the Unimak Pass AIS was installed estimated trans-pacific transits through the Aleutians indirectly using data provided by the Puget Sound Marine Exchange that indicated the number, type and last port call of ships entering Washington. That analysis has been removed from this updated report. However, the Puget Sound Marine Exchange provided information regarding the quantity of fuel or bunkers received. On average, a vessel loaded 490,000 gallons of heavy, persistent fuel oil which we believe is an indication of fuel consumption on trans-pacific voyages. 19 Generally, ships pass through the Aleutian Chain at Unimak Pass and at a point west of longitude W and Tanaga Island. 20 The 2003 groundfish catch alone after primary processing was approximately $1.5 billion (F.O.B. Alaska). This does not include the value of the crab catch
16 Vessel Traffic Calling in the Aleutians Subarea Figure 7 shows the primary traffic routes of vessels calling at ports in the Aleutians Subarea. Unalaska/Dutch Harbor is by far the largest port in the area; most port calls occur there. Other locations where port activities occur include: - Adak, - Gusty Bay, Tanaga Island, - Saint George, - Akutan, - King Cove, - Saint Paul, - Atka, - Kiska, - Sand Point, and - Beaver Inlet, Unalaska Island, - Makushin Bay, Unalaska Island, - Tanaga. The U.S. Coast Guard maintains records of vessels calling at Unalaska/Dutch Harbor. Table 3 contains port calls to Unalaska/Dutch Harbor by vessel type and month in The vast majority (94%) of port calls (not counting fishing trawlers, catchers and processors) were made by three vessel types: container ships (38%), reefers (29%), and tug/barges (27%). Figure 8 shows the distribution of the Unalaska/Dutch Harbor port calls by month and vessel type. During both 2004 and 2005, calls peaked in July with 47 vessels calling at the port. The month with the least number of port calls was December, when only 17 vessels called at the port (Table 3). 22 Table 3. Vessel port calls in Unalaska/Dutch Harbor by type and month in Month Container Ship Reefer/ Bulk Tug & Tow Vessel Type Research Vessel Cruise Ship Tank Ship Total Jan Feb Mar Apr May Jun Jul Aug Sep Oct Nov Dec Total Data on vessel calls to the other Aleutian ports was not readily available, but some general information is known. No other port in the Aleutians receives container ships, so most of the calls to these ports are fishing trampers (reefer) and tug/barges. Fishing trampers and tug/barges that call at the other Aleutian ports usually call at Unalaska/Dutch Harbor too, so the 376 voyages shown in Table 3 represent almost all of the vessel traffic calling in the Aleutians Subarea. 22 While updating this report in July 2006 we examined all US Coast Guard notice of arrival information for Dutch Harbor and Unalaska from January 1, 2005 to July 15, 2006 and found port calls to be consistent with
17 Figure 7. Primary traffic routes of vessels calling at ports in the Aleutians Subarea. 17

18 Figure 8. Port calls to Unalaska/Dutch Harbor by vessel type and month in Source: U.S. Coast Guard SANS database. NOTE: Port call information does not include fishing vessels. The highest risks for environmental damage from oil spills are from vessels carrying persistent fuel. 23 Most vessels over 400 gross tons that call in Alaska are required to have a State contingency plan and a COFR. Table 1 and Figure 3 summarize information about vessels registered to trade in Alaska. Using this information, the estimate of fuel capacity for large vessels calling at Aleutian ports in 2004, 2005 and the first half of 2006 is: 130 container ships per year with a typical fuel capacity of 1.6 million gallons of persistent fuel oil each, and 108 reefer (refrigerated) cargo ships with a typical fuel oil capacity of 317,000 gallons of mostly persistent fuel oil. The only other ships that may use persistent fuel are the cruise ships and tank ships. These ships make few calls in the Aleutians Subarea but carry relatively large volumes of persistent oil. Tanker and Tank Barge Vessel Traffic in the Aleutians Subarea Tankers and tank barges towed by tugs do transit the Aleutians Subarea. Tugs and tank barges transport non-persistent oil into the subarea for fuel and heating oil. Non-persistent oil and persistent oil are transported through the subarea to other destinations. Non-persistent Oil Transported by Tank Vessels with State Contingency Plans Figure 9 shows the routes by which fuel and heating oil is delivered to the communities of the Aleutian Islands and western Alaska by tank barges pulled by ocean-going tugs. The tugs and barges transit from refineries at 23 Fuels such as #6 bunker oil, bunker C, and IFO 380 have low dissipation and evaporation rates. They will remain on the surface of marine waters or along shorelines much longer than non-persistent fuel such as diesel, gasoline and aviation fuel. For example, up to 90% of a diesel spill will evaporate or disperse into the water column within several hours to several days. By contrast, 70% of bunker C fuel oil will persist as floating or beached oil for a week or longer. Source: NOAA/Hazardous Materials and Response Assessment Division. 18
19 Figure 9. Primary traffic routes of non-persistent oil deliveries in the Aleutians Subarea. 19
20 Nikiski in Cook Inlet, Valdez in Prince William Sound, and Puget Sound to the various bulk fuel facilities throughout the Aleutians Subarea. Most deliveries to bulk fuel facilities in the Bristol Bay, Western Alaska, Northwest Arctic, and North Slope subareas also transit the Aleutians Subarea. Figure 9 also shows the route of the tanker that delivers fuel and heating oil to Adak and Dutch Harbor from Russia. Two documents provide information on the volume of oil delivered to or transported through the Aleutians Subarea: Study of Noncrude Tank Vessels and Barges completed in July 1991 by Arthur D. Little (A. D. Little) for the ADEC, and Agreement for Compliance for Tank Barge Transport of Nonpersistent Oil in Alaska revised in 2003 by the Alaska Petroleum Distributors and Transporters (APDT). The A. D. Little Study indicates that about 385 million gallons of nonpersistent oil either stays in the region or passes through to other Alaskan destinations. However, the report does not provide any data on the number of voyages. The APDT Agreement also has information on the amount of non-persistent oil transported into and through the Aleutians Subarea. Table 4 summarizes the oil transfers and transits by subarea. Interpreting this table is difficult because of the ranges, but using the median of the ranges yields an estimate of 300 million gallons of non-persistent oil per year delivered in 135 voyages to all of the subareas. Looking at just the Aleutians Subarea, the estimate is 150 million gallons of non-persistent oil delivered in 40 voyages. Table 4. Estimated non-persistent fuel oil transfers and delivery transits to selected subareas. Subarea Million Gallons Transferred Transits Aleutians 100 to Bristol Bay 50 to Western Alaska < Northwest Arctic < North Slope < 50 5 Interviews with the two largest tank barge companies providing nonpersistent oil products provide another source of information. 24 The companies were asked about the size of their tank barges and the average number of trips that they make into the Aleutians Subarea each year. Together they estimated that they transport 36 to 43 barge loads of nonpersistent oil through the subarea. Taking the median of the ranges would yield an estimate of 147 million gallons of non-persistent oil per year moved in about 41 voyages. 24 Nuka Research, February Personal communications with Royal Harris, Crowley Marine Services, and Louis Audette, Seacoast Towing. 20
21 The port call data provided in Table 3 also indicates that four tanker calls were made to Dutch Harbor by a tank vessel in Coast Guard records for January 2005 through July 15, 2006 show this tanker making seven calls at Dutch Harbor. The T/V Renda is a 1.6 million gallon capacity tanker that is known to bring non-persistent oil to Adak and Dutch Harbor from the Sakhalin Islands in Russia. Other smaller tank vessels also have approved contingency plans for the Aleutians Subarea and may trade there in the future. 25 About 150 million gallons per year of non-persistent oil moves into the Aleutians Subarea for fuel and heating oil in about 40 to 50 voyages and another 150 to 200 million gallons per year of non-persistent oil moves through the Aleutians Subarea to provide fuel for other western Alaskan destinations. All of these oil movements are covered under State Oil Discharge Prevention and Contingency Plans. Oil Transported through the Aleutians Subarea by Tank Vessels without State Contingency Plans The US Department of Commerce oil export permit regulations prohibit tankers delivering and returning from delivery of Alaska North Slope Crude Oil from transiting the Aleutians Subarea. 26 However, oil imported or exported from Cook Inlet is not banned from the North Pacific great circle route. Tesoro Alaska indicated that they discourage their chartered tank vessels from using the North Pacific great circle route, but they do not prohibit it. 27 In fact, the AIS receiver at Unimak Pass detected no tank ships coming from Cook Inlet. From October 2005 through June 2006 the Unimak Pass AIS receiver detected five tankers (classified as crude oil carriers) and eight product tanker transits. All but one were proceeding west from North America. At least one of the crude oil tankers was in ballast and thus did not have oil cargo aboard. We assume that the crude oil tankers, based on destination and origin, were carrying heavy residual refined product and that the product tankers were carrying lighter refined products. If this traffic pattern is typical for the entire year, then approximately 15 refined product tankers pass through the Aleutians on great circle voyages annually, transporting about 180 million gallons of non-persistent oil products. Also there are approximately 7 crude oil tankers passing through the Aleutians on great circle voyages annually, transporting about 225 million gallons of persistent oil products. However, this analysis does not take into consideration that some of the tankers may be in ballast. Fishing Vessel Traffic in the Aleutians Subarea Figure 10 shows the primary fishing grounds in the Aleutians Subarea. 25 Nuka Research. February Personal communication with Bob Flint, ADEC, SPAR, IPP, Marine Vessels Section CFR 754.2(j). 27 Nuka Research. February Personal communication with Bob Flint, ADEC, SPAR, IPP, Marine Vessels Section. 21

22 Figure 10. Primary fishing grounds in the Aleutians Subarea. 22
23 There are three categories of fisheries in the Aleutians Subarea: groundfish (pollock, cod, halibut, rockfish, Atka mackerel, and other flatfish), crab (king, tanner, snow) and finfish (salmon and herring). While salmon and herring are important fisheries in the Bristol Bay Subarea, they are a minor component of the Aleutians Subarea fisheries and are not considered for the purpose of this report. The groundfish and crab fisheries of the Aleutians Subarea are the biggest in North America in terms of value and poundage. The groundfish fishery occurs in two fishing areas: the Bering Sea/Aleutians (BSA) area and the Gulf of Alaska (GOA) area. The major crab fisheries occur in the BSA area. Appendix A contains fact sheets on most of the major fisheries in the Aleutians Subarea. In order to determine the number, size, and fuel capacity of vessels participating in the groundfish fisheries, data was acquired from the 2004 NMFS groundfish observer database and the Commercial Fisheries Entry Commission s vessel database. Each entry in the groundfish observer database is an observer week; the observer was aboard a specific vessel in a particular fishery for at least a portion of a given week. All of the large vessels (>125 feet) participating in a groundfish fishery are observed. Thirty percent of the small vessels (60 to 125 feet) participating in a groundfish fishery are observed. No vessels less than 60 feet are observed. Two hundred seventy-seven (277) different vessels participated in the fisheries in the BSA/GOA districts in Over 3,000 vessel weeks of effort were observed during the year. Given that many of the vessels are only observed 30% of the time, the actual effort is in excess of 6,000 vessel weeks. The effort data indicate that: 50% of the effort goes toward the Pacific cod fisheries, 30% of the effort goes toward pollock fisheries, and 20% of the effort goes to all other groundfish fisheries combined. The total value of the pollock and cod fisheries is about 1.5 billion dollars annually. 28 Table 5 gives information on the groundfish fishing fleet by length, tonnage and median fuel capacity. The median fuel capacity for the groundfish fleet is 30,000 gallons. All but one of these vessels uses non-persistent fuel. A query of vessel tonnage in the database revealed 61 (22%) of the groundfish fleet are greater than 400 gross tons and are required to hold a Nontank Vessel Oil Discharge Prevention and Contingency Plan with the ADEC Hiatt, T. et. al Gross tonnage data was not available for 15 of the vessels in the database. 23
 Number of Vessels Average Gross Tonnage Median Fuel Capacity (gallons) Fuel Type <75 38 70 5,000 Diesel 75-124 149 189 20,000 Diesel 125-174 52 400 55,000 Diesel 175-224 19 943")
24 Table 5. Vessel information from the 2004 Aleutians/Bering Sea groundfish fishing fleet. Length Category (feet) Number of Vessels Average Gross Tonnage Median Fuel Capacity (gallons) Fuel Type < ,000 Diesel ,000 Diesel ,000 Diesel ,000 Diesel , ,000 Diesel , ,000 Diesel , ,341 Diesel >375 1 unknown 100,000 IFO Total 277 Source: National Marine Fisheries Service observer database and the State Limited Entry Commission fishing vessel database. In addition to the groundfish fishing fleet, the crab fishing fleet includes approximately 120 additional fishing vessels. Specific information on these vessels was not available at the time of this report, but they are known to use diesel fuel exclusively. These vessels typically range in length from 75 to 174 feet. Figure 11 uses information from the NMFS groundfish observers database and the ADFG crab vessel registration database to estimate the fishing effort by month during This figure reveals that fishing efforts peak with about 650 vessel weeks in February during the peak of the pollock A and Pacific cod seasons. Another peak of about 550 vessel weeks occurs during October when the King Crab fishery coincides with the pollock B season. Figure 11. Estimated fishing vessel effort in the Aleutians Subarea by month in Source: National Marine Fisheries Service groundfish fishing vessel observer data and Alaska Department of Fish and Game crab vessel registration and season data. Passenger Vessel Traffic in the Aleutians Subarea Figure 12 shows the routes of cruise ships and the Alaska Marine Highway ferry in the Aleutians Subarea. Table 6 shows which passenger vessels operated in the Aleutians Subarea in
25 Figure 12. Cruise ship and ferry routes in the Aleutians Subarea. 25
26 Table 6. Passenger Vessels intending to operate in the Aleutians Subarea in Vessel Name # of Transits Fuel Capacity Clipper Odyssey 2 101,700 gal. non-persistent fuel capacity, Crystal Harmony 1 722,700 gal. persistent fuel capacity, Sapphire Princess 1 1,172,800 gal. persistent fuel capacity, Seven Seas Mariner 1 508,300 gal. persistent fuel capacity, Spirit of Oceanus 4 54,000 gal. non-persistent fuel capacity,* Tustumena 11 67,000 gal. non-persistent fuel capacity.** *Northwest Cruise Ship Association. **Alaska Marine Highway System. In 2005 and 2006, four large cruise ships called at Dutch Harbor during their positioning voyages 30 each year. The small cruise ship Clipper Odyssey made one cruise to the Aleutians and the Spirit of Oceanus made six Aleutian voyages in The cruise industry does not anticipate significant growth in the Aleutian market. The Tustumena is an Alaska Marine Highway vessel that makes voyages from Homer to Dutch Harbor each year from May through September. In 2006, during these months, the Tustumena made eleven round trips through the Eastern Aleutians stopping at Dutch Harbor, Akutan, Cold Bay, False Pass, King Cove, Sand Point, Chignik, Port Lions, and Kodiak. Overall, passenger vessels are a minor component of the vessel traffic in the Aleutians Subarea. Only 3 to 4 large cruise ships will make one port call each in the Aleutians Subarea but, as noted, they carry relatively large volumes of persistent fuel oil. Tug Traffic in the Aleutians Subarea Table 1 indicates that the typical fuel capacity of an ocean-going tug is about 100,000 gallons of non-persistent oil. Table 3 shows that 102 port calls were made at Dutch Harbor/Unalaska in Figure 13 shows the known locations and routes of tugs in the Aleutians Subarea. Dutch Harbor is the only location in the Aleutians Subarea where tugs are resident. Other tugs transit the subarea in trade with freight or tank barges. The major tug and barge operators in the Aleutians Subarea were contacted for this study. Table 7 contains a listing of tugs that were found to trade in the Aleutians Subarea. There are four resident tugs in the region with sufficient horsepower and sea-keeping ability to potentially respond as a rescue/assist tug for a ship in distress. Additionally, there are about 200 voyages of other tugs through the region each year by tugs in trade. These transient tugs range from 1,200 to 7,000 horsepower. Many of the tug operators we interviewed stressed that tugs in trade usually have a barge in tow, which hampers their ability to respond to calls for emergency assistance. 30 A positioning voyage moves a cruise ship from one seasonal operating area to another. 26

27 Figure 13. Tug boat routes in the Aleutians Subarea. 27
28 Table 7. Known tug traffic in the Aleutians Subarea by vessel, port, number of trips per year and horsepower. Vessel Name Resident/Transient Estimated trips per year Length (ft) Horsepower Fidalgo1 (Seacoast) R Based in Unalaska Gyrfalcon (Olympic T&B) R Unalaska James Dunlap (Dunlap) R Unalaska Saratoga2 (Dunlap) R Unalaska Noatak (Delta Western, managed by SeaCoast) R - Unalaska Drew Foss (Samson) T Gale Wind1 (Contracted to Northland by Anderson Tug and Barge) T Hercules (Northland) T Invader Class (Crowley) T Jene Dunlap (Contracted to Northland by Dunlap) T Pacific Raven (Seacoast) T Manfred (Contracted to Northland by Dunlap) Mike O Leary (Contracted to Northland by Dunlap) T T 8 ~ Paragon (Seacoast) T Polar Ranger (Contracted to Northland by Dunlap) T 12 ~ Redoubt (Cook Inlet Marine) T Samson Mariner (Samson) T Sea Viking (Contracted to Northland by Crowley) T 8 ~ Seneca (Crowley) T Sidney Foss (Samson) T Snohomish (Contracted to Northland by Dunlap) T Victory Class (Crowley) T by contract Source: Nuka Research personal interviews, Notes: 1 These tugs are home ported in Dutch Harbor but trade throughout the subarea. 2 These tugs are limited to ship-assist duties in Unalaska Bay. Vessel Accidents/Casualties and Oil Spills in the Aleutians Subarea CFR Shipwrecks Appendix B contains information gathered by the US Fish and Wildlife Service on locations of most of the known shipwrecks along the Aleutian chain since US Flag Vessel Casualties A vessel casualty must be reported to the US Coast Guard if it occurs upon the navigable waters of the US, its territories or possessions; or whenever and wherever a casualty involves a US vessel. Public vessels and recreational vessels are exempt from these reporting requirements. 31 Casualties include: groundings; loss of main propulsion; primary steering or reduction in maneuverability; 28
29 occurrences that reduce seaworthiness (fire, flooding, damage to or loss of fire extinguishing, lifesaving or bilge pumping systems); loss of life; injuries requiring professional medical treatment; vessel damage exceeding $25,000; and spills of oil and hazardous material. Typically, accidents, fatalities, injuries and other casualties are reported on Coast Guard standard form CG-2692 and entered into the Marine Information for Safety and Law Enforcement (MISLE) database. Approximately 14,700 accident and spill reports from US vessels operating in or near Alaska territorial waters were entered into the Coast Guard MISLE database, between June 22, 1990 and August 1, For this study, we focused only on casualties affecting the seaworthiness of the vessel. Casualties were grouped by first event. For example, if a vessel lost steering, resulting in grounding, flooding, and damage to the environment by oil spill, the casualty was classed as a loss of maneuverability. We excluded first-event oil spills and personnel casualties that did not affect the overall safe navigation of the vessel, and thus reduced total number of applicable reports to 5,922. Table 8 summarizes 486 of those casualties (8.2% of the total Alaska reports) which occurred in the Aleutians Subarea. 32 About 90% of the US vessel casualties in the Aleutians were commercial fishing vessels. Table 8. Number and types of US vessel casualties affecting seaworthiness reported in the Aleutians Subarea between June 22, 1990 and August 1, Accident or Event in Aleutians Subarea Number Abandonment 5 Allision (collision with fixed structure) 11 Capsizing 2 Fishing vessels Comments One vessel sustained 2 million dollars damage. Collision between vessels 31 Two involved oil barges under tow. Explosion 2 Fishing vessels Fire 72 Fire and spill from F/V All Alaskan resulted in 25 million dollars damage. 35 fires involved damage in excess of $25,000 with 6 of those in excess of 5 million dollars. Flooding resulted in more than $25,000 damage. Grounding resulted in more than $25,000 damage. Loss of Electric Power 22 Loss of Stability 1 Material Failure resulted in more than $25,000 damage. Sinking 22 Two vessels presumed lost. Loss of Maneuverability resulted in more than $25,000 damage. Total, Aleutians Subarea 486 Total, Alaska waters 5,922 Source: U.S. Coast Guard, Marine Information for Safety and Law Enforcement (MISLE) database. 32 These investigations were not recorded by subarea, but by latitude and longitude. 29
30 Foreign Flag Vessel Casualties Foreign vessel casualties are of interest because they generally involve larger ships with the potential for significant environmental or economic damage. Between September 12, 1991 and August 1, 2006, the US Coast Guard MISLE database contained 381 investigations of foreign vessel casualties 33 in Alaska. As with US flag vessels, we focused only on casualties affecting the seaworthiness of the vessel. Casualties were again grouped by first event. We excluded first-event spills and personnel casualties that did not affect the overall safe navigation of the vessel, and reduced total number of applicable Alaska reports to 209. The incidents were separated into seven casualty groups: Fire Grounding Flooding, sinking Material Failure (subsequent structural damage to hull or through-hull fittings) Collision Allision (Collision with a fixed object: dock, pier, dolphin, etc.) Loss of Maneuverability Of the 209 casualties affecting seaworthiness of foreign vessels while operating in Alaskan waters, Table 9 summarizes the 48 casualties reported in the Aleutians 34 (23% of the 209 total Alaska foreign vessel casualty reports). The spatial distribution of these casualties are presented in Figure 14 and detailed in Appendix C. Table 9. Foreign Vessel Casualties Affecting Seaworthiness Reported to the US Coast Guard between September 12, 1991 and August 1, Initial Event Allisions (collision with fixed structure) Number of Vessels Collisions between vessels 9 Fire 3 Flooding 1 Grounding 9 Loss of Maneuverability 17 Material Failure 3 Total, Aleutians Subarea 48 Total, Alaska waters Secondary Events Source: U.S. Coast Guard, Marine Safety Information System database. One vessel experienced subsequent flooding and material failure Two vessels had subsequent spills. One vessel reported subsequent material failure Two groundings resulted in an oil spill. One grounding reported flooding and an oil spill. One reported an allision due to loss of steering, One vessel (Kuroshima) suffered subsequent grounding, fatality, oil spill. This data does not capture the loss of the M/V Selendang Ayu in December 2004 or the M/V Cougar Ace in One vessel sank and spilled oil, likely due to hull failure or deterioration of through-hull fittings 33 There were 480 vessel casualty records created. Ninety entries involved additional investigations of one of the 381 incidents reported (ex. spill, loss of maneuverability, and grounding for one casualty). 34 These investigations were not recorded by subarea, but by latitude and longitude, generally south of 57 o 20 N and west of longitude 156 o W. 30
31 Figure 14. Foreign vessel casualties in the Aleutians Subarea. 31
32 Loss of maneuverability was the first-event in 17 (35%) of the 48 foreign vessel casualties reported in the Aleutians Subarea. The data in Table 9 certainly under-reports the actual number of foreign vessel casualties for the waters of the Aleutians Subarea. Foreign vessel casualties are not required to be reported to the Coast Guard unless the vessel is in the territorial waters of the US. Most vessels report casualties to their flag-state 35 and classification society. 36 However, this information is difficult to obtain for incidents outside of US territorial waters. Finally, loss of maneuverability, due to short-duration mechanical or electrical problems on vessels, is likely not reported to any outside agency. Loss of maneuverability is of interest in this study. Both the Kuroshima and Selendang Ayu groundings were caused by loss of maneuverability. Spills and Potential Spills Oil spills into Alaska waters must be reported to the US Coast Guard and the ADEC. ADEC s spills database goes back to 1995 and includes information about the potential spill size as well as the amount actually released. The NOAA Scientific Support Coordinator for the Alaska Region compiled a dataset of spills in the Aleutians going back to These data sources were used to produce Figure 15, which contains a map and list of marine vessel spills or potential spills that exceeded 1,000 gallons. Forty-three spill events were identified and plotted. The actual amount of oil reported spilled from marine vessels was 972,343 gallons, of which 371,852 gallons was persistent oil (38%) and 600,491 was non-persistent oil (62%). Fifty percent of non-persistent oil spills were less than 3,000 gallons, yet these spills accounted for less than one percent of the total volume of non-persistent oil spilled. Twelve percent of the non-persistent spills were larger than 34,000 gallons, but these spills accounted for 66 percent of the volume of non-persistent oil spilled. Ninety-three percent of the persistent oil spills were less than 3,000 gallons, but these spills accounted for only one percent of the total persistent oil spilled. Only 7 percent of the persistent oil spills were greater than 34,000 gallons, but these spills accounted for 99 percent of the volume of persistent oil spilled. 37 The potential oil that might have been spilled from the 43 spill events was 5.7 million gallons, of which 2.3 million was persistent and 3.4 million was nonpersistent. 35 Flag-state is the country in which the vessel is registered, commonly referred to as the home port. In International Maritime Organization (IMO) Conventions, the flag State is sometimes referred to as the Administration. When a Government accepts an IMO Convention for safety, security or environmental protection, it agrees to make it part of its own national law and to enforce it just like any other law. 36 All ships must be surveyed in order to be issued certificates which establish their seaworthiness, This is the responsibility of the flag State of the vessel. However, the Flag State ( Administration ) may entrust the inspections and surveys either to surveyors nominated for the purpose or to organizations recognized by it (SOLAS Chapter 1, regulation 6). In practice these recognized organizations are often the classification societies. 37 The 34,000 gallon cut-point was chosen arbitrarily, based on the distribution of the spill sizes. 32
33 Summary Vessel tracking data provided by the automated identification system (AIS) receiver at Scotch Cap, Unimak Pass has allowed us to significantly revise and improve the original Aleutians Vessel Traffic Study published in April In addition we have increased our confidence in vessel profiles by type (container, bulk cargo, etc.) by expanding the number of vessels used to develop this profile. However, this is not an exact vessel traffic study and our estimations have some limitations. No single data set contains all the current information needed regarding number, type, size, and fuel capacity or casualty history for vessels transiting the Aleutians Subarea. Information gathered from the many sources used in this report is presented in various forms that are not always comparable. For example, the U.S. Coast Guard and State of Alaska use dissimilar vessel classification schemes. In some cases, similar, but not exact, datasets were compared or combined in order to provide the best possible estimates. Despite these limitations, it is possible to make some summary statements about Aleutian vessel traffic. Figure 16 shows a combination of many vessel traffic elements presented in the other figures. Clearly, a wide variety and large number of vessels transit the Aleutians Subarea. We estimate that over 3,100 ships pass through the Aleutians each year on trans-pacific voyages. Over a third of these transits are by container ships with a typical fuel capacity of 1.6 million gallons of fuel oil. Over 40% are bulk and general freight ships with a median fuel capacity of 470,000 gallons or a capacity similar to the amount of fuel carried by the Selendang Ayu when it broke apart in December The predominant fuel type in these large vessels is persistent fuel oil, which represents a significant environmental threat if spilled. Few tank ships sail through the area, about 20 voyages a year, and some are in ballast. About 400 Aleutian port calls are made by ships. About 130 of these port calls are container ships with a typical fuel capacity of 1.6 million gallons of persistent fuel oil. About 110 port calls are made by refrigerated (reefer) ships with a typical fuel capacity of about 320,000 gallons of mostly persistent fuel oil. The remaining port calls are mostly tugs towing barges. Passenger vessels represent a very small component of the Aleutian vessel traffic. About 300 million gallons of non-persistent fuel oil is moved into and through the Aleutians as cargo for use in Alaska in about 130 voyages onboard tank barges and in a single tank ship. About 400 fishing vessels operate in the rich Aleutian fisheries that are valued in excess of 1.5 billion dollars. Fishing vessels typically have a fuel capacity about 30,000 gallons and almost all carry non-persistent fuel. There are four ocean-going tugs resident in the Aleutians and almost 200 tug voyages each year that transit the area with barges in tow. 33

34 Figure 15. Actual or portential vessel spills in the Aleutians Subarea. 34

35 Figure 16. Combined vessel information for the Aleutians Subarea. 09/20/05 35
36 Four hundred and eighty-six (486) casualties affecting seaworthiness of US vessels were reported in the Aleutians from 1990 through July US vessels reporting casualties were usually smaller than foreign vessels and primarily fishing vessels. Forty-eight (48) casualties affecting seaworthiness of foreign vessels were reported in the Aleutians from 1991 through July These reports included 17 loss of maneuverability incidents. We believe that foreign vessel casualties are under reported. Data was assembled from 43 oil spill events that occurred between 1981 and These spills totaled almost one million gallons. Sixty-two percent of the amount spilled was non-persistent oil and 38 percent was persistent oil. Most of the 400 vessels calling at Aleutians ports and many of the larger fishing vessels hold State oil spill contingency plans and certificates of financial responsibility. However, the great majority of the 3,100 vessels transiting the Aleutians have no State oil spill contingency plans and no State certificate of financial responsibility, because they are traveling in innocent passage. Most of these unregulated vessels carry persistent fuel oil, which unlike diesel fuel, will persist as floating or beached oil for days to months. Recommendations for Additional Study After reviewing the information available on marine vessels transiting the Aleutians, we have the following recommendations for additional investigation: Conduct a more detailed review of Coast Guard casualty reports, particularly foreign vessel reports, to determine the underlying root-cause of accidents; particular attention should be given to incidents involving loss of maneuverability and whether timely communication and intervention could prevent vessel groundings; Categorize the fishing vessels operating in the Aleutians by relative risk. For example, fish processors are typically large, relatively under-powered, and operate for long periods close to shorelines. 36
37 This page left intentionally blank. 37
38 References A.D. Little. July Study of Noncrude Tank Vessels and Barges, report prepared for Alaska Department of Environmental Conservation. Alaska Commercial Fisheries Entry Commission Commercial Vessel Database. < Alaska Department of Environmental Conservation, Division of Spill Prevention and Response, Industry Preparedness Program Certificate of Financial Responsibility (COFR) Database. Alaska Department of Environmental Conservation, Division of Spill Prevention and Response, Industry Preparedness Program Nontank Vessel Database. Alaska Petroleum Distributors and Transporters, Industry Preparedness and Planning Work Group. Revised Agreement for Compliance for Tank Barge Transport of Non-persistent Oil in Alaska. Alaska Regional Response Team Alaska Federal/State Preparedness Plan for Response to Oil & Hazardous Substance Discharges/Releases (Unified Plan). Alaska Regional Response Team Aleutians Subarea Contingency Plan for Oil & Hazardous Substance Discharges/Releases, A Subarea Plan of the Unified Plan for the State of Alaska. Hiatt, T. et. al Stock Assessment and Fishery Evaluation Report for the Groundfish Fisheries of the Gulf of Alaska and Bering Sea/Aleutian Island Area: Economic Status of Groundfish Fisheries Off Alaska, Economic and Social Sciences Research Program Resource Ecology and Fisheries Management Division Alaska Fisheries Science Center National Marine Fisheries Service National Oceanic and Atmospheric Administration 7600 Sand Point Way N.E. Seattle, Washington < Nuka Research and Planning Group An Overview of the Major Commercial Fisheries in the Unalaska Area that may be Impacted by the M/V Selendang Ayu Oil Spill Report to Fisheries Work Group. Report for Alaska Department of Environmental Conservation. Pacific States/British Columbia Oil Spill Task Force. July Final Project Report and Recommendations - West Coast Offshore Vessel Traffic Risk Management Project. < Task Force on Motorized Oil Transport. December 15, Final Report to Alaska Department of Environmental Conservation. < 38
39 US Coast Guard Marine Information for Safety and Law Enforcement (MISLE) Database. US Coast Guard, National Vessel Movement Center Ship Arrival Notification System (SANS) Database. US Department of Commerce, National Marine Fisheries Service Bering Sea/Aleutians Groundfish Vessel Observer Database. Whitney, J. The Aleutian Islands and Lower Alaska Peninsula: Oceanographic Conditions and NOAA s Oil Spill Response History during HAZMAT Report September
40 Appendices Appendix A Fact sheets on the major fisheries in the Aleutians Subarea. Appendix B - Shipwrecks on or near Islands of the Alaska Maritime National Wildlife Refuge. Appendix C Information on selected foreign vessel casualties in the Aleutians. 40
41 This page left intentionally blank. 41
42 Appendix A Fact sheets on the major fisheries in the Aleutians Subarea. Source: Nuka Research and Planning Group An Overview of the Major Commercial Fisheries in the Unalaska Area that may be Impacted by the M/V Selendang Ayu Oil Spill Report to Fisheries Work Group 42
43 This page left intentionally blank. 43

44 Fishery Fact Sheet #1 Makushin Tanner Crab Makushin Tanner Crab Fishery Fish Species Tanner Crab {Chionoecetes bairdi} Location of Fishery Harvest Level Quota 171,453 lbs Number of Vessels Registration 12/27/04 Sea water Deadline Circulation Open Date January 15, Noon Management Agency Close date Quota was reached Gear Type 3/31/05 Processors Shore-based only - Dutch Transit Route Harbor/Unalaska Makushin ADFG statistical area , , (final) Yes sea water is continuously circulated through live tanks Alaska Department of Fish and Game (ADFG) Crab pots Nearshore transit northeast around Unalaska Island to Unalaska Bay For more information contact ADFG Commercial Fisheries Area Management Biologist, Forrest Bowers (907) Rev. 9/20/2006 Page 1 of 1
45 Fishery Fact Sheet #2 Unalaska Bay Tanner Crab Unalaska Tanner Crab Fishery Fish Species Tanner Crab {Chionoecetes bairdi} Location of Fishery Unalaska Bay ADFG statistical area , Harvest Level Quota 35,304 lbs Number of Vessels 55 (includes Makushin area Tanner Crab fishery) Registration Deadline 12/27/04 Sea water Circulation Live hold tanks in most vessels. A few use dry holds because of proximity to processors. Open Date January 15, Noon Management Agency Alaska Department of Fish and Game (ADFG) Close date Quota was reached Gear Type Crab pots 1/18/05 Processors Shore-based only - Dutch Harbor/Unalaska Transit Route All of Unalaska Bay may be transited. Other Vessel size limited 58 feet (from Cape Cheerful to Priest Rock). For more information contact ADFG Commercial Fisheries Area Management Biologist, Forrest Bowers (907) Rev. 9/20/2006 Page 1 of 1
 Gear Type Crab pots")
46 Fishery Fact Sheet #3 Bering Sea Snow Crab Bering Sea Snow Crab Fishery Fish Species Chionoecetes opilio Location of Fishery Bering Sea District west of 166 W longitude Harvest Level 20.9 million pounds Number of 171 Vessels Registration 12/27/04 Sea water Yes, live hold Circulation Open Date 1/15/05 Management ADFG Agency Close date 1/20/05 (quota met) Gear Type Crab pots Shore-Based Processors Unalaska, Akutan, King Cove, Kodiak & St. Paul At-sea Processors Catcher-processors and at-sea processors; some anchor in Unalaska bay. For more information contact ADFG Commercial Fisheries Area Management Biologist, Forrest Bowers (907) Rev. 9/20/2006 Page 1 of 1
 Federal permit required http://www.fakr.noaa.gov/r am/ffpfpp.")
47 Fishery Fact Sheet #4 BS/AI Pacific Cod Pot Bering Sea/Aleutians Pacific Cod Fishery Pot Gear Fish Species Gadus macrocephalus Location of Fishery Harvest Level Registration Open Date Close date Processors 2005 TAC is 206,000 mt (quota is shared with trawl fleet) Federal permit required am/ffpfpp.htm 1/1/05 but fishing doesn t usually start in earnest until close of snow crab Closed in phases from 2/12/05 3/10/05 based on gear/vessel specifications Dutch Harbor, Akutan and at-sea Number of Vessels Sea water Circulation Management Agency Gear Type Transit Route Bering Sea/Aleutian Islands, including Bogoslof exemption area RSW. Some boats use ice in hold instead of seawater. NMFS Pot, hook & line, trawl Dutch Harbor east to fishing grounds. For more information contact NMFS Alaska Groundfish Management - Andy Smoker, (907) or Rance Morrison (907) Rev. 9/20/2006 Page 1 of 1

48 Fishery Fact Sheet #5 EBS/AI Pollock Bering Sea/Aleutian Islands Pollock Fishery A Season Fish Species Theragra chalcogramma Location of Fishery Harvest Level Registration EBS -1,478,500 mt AI 19,000 mt Bogoslof 10 mt Quota split between A & B seasons Federal permit required am/ffpfpp.htm Number of Vessels Sea water Circulation Open Date 1/20/05 Management NMFS Agency Close date 3/25/05 Gear Type Trawl Shore-based Processors Other Dutch Harbor, King Cove, Akutan, Beaver Inlet; shore-based fleet comes ashore every 2 days or so At-sea or catcherprocessors EBS & AI. Fishing is concentrated north & west of Unimak Island Approx. 60 catcher vessels, 20 factory vessels & 3 mother ships; quota is divided 50% catcher, 40% catcher/processor & 10% mothership Refrigerated Sea Water (RSW), no live hold Catcher-processors, floating processors & mother ships Sea Lion conservation areas (SCA) affect catch limits in some areas. For more information contact NMFS Alaska Groundfish Management - Andy Smoker, (907) or Rance Morrison (907) Rev. 9/20/2006 Page 1 of 1
 Registration Federal permit required http://www.fakr.noaa.gov/r am/ffpfpp.")
49 Fishery Fact Sheet # 6 BS/AI Pacific Cod Trawl Bering Sea/Aleutian Islands Pacific Cod Fishery - Trawl Fish Species Gadus macrocephalus Location of Fishery Harvest Level 2005 TAC is 206,000 mt (quota is shared with pot/line fishery) Registration Federal permit required am/ffpfpp.htm Open Date A Season - 1/20/05 B Seasion 9/1/2005 Close date A Season closed 3/13, then re-opened 3/29 with 2,400 mt remaining in quota for first seasonal allowance Processors Number of Vessels Sea water Circulation Management Agency Gear Type Primarily at-sea, catcher-processors Bering Sea/Aleutian Islands fishery concentrated east of Unalaska RSW NMFS trawl For more information contact NMFS Alaska Groundfish Management - Andy Smoker, (907) or Rance Morrison (907) Rev. 9/20/2006 Page 1 of 1
2012 Transits. of UNIMAK PASS. Brief to the Aleutian Islands Risk Assessment Advisory Panel and Management Team. September 2014 version 1
 Prepared by: Nuka Research & Planning Group, LLC. Brief to the Aleutian Islands Risk Assessment Advisory Panel and Management Team September 2014 version 1 2012 Transits of UNIMAK PASS 2012 Transits of
U.S. Coast Guard - American Waterways Operators Annual Safety Report
 American Waterways Operators U.S. Coast Guard - American Waterways Operators Annual Safety Report National Quality Steering Committee Meeting December 12, 2017 Established Safety Metrics For 17 years,
Vessel Traffic Risk Assessment Ed Page Executive Director Marine Exchange of Alaska
 Vessel Traffic Risk Assessment Ed Page Executive Director Marine Exchange of Alaska Marine Exchange of Alaska A non-profit maritime organization established to provide the Alaska maritime community information,
U.S. Coast Guard - American Waterways Operators Annual Safety Report
 American Waterways Operators U.S. Coast Guard - American Waterways Operators Annual Safety Report National Quality Steering Committee Meeting August 3, 216 Established Safety Metrics For 16 years, the
Marine Protection Rules Part 141 Ship Design, Construction, Equipment and Operation Noxious Liquid Substances in Bulk
 Marine Protection Rules Part 141 Ship Design, Construction, Equipment and Operation Noxious Liquid Substances in Bulk ISBN 978-0-947527-48-8 Published by Maritime New Zealand, PO Box 25620, Wellington
DEVELOPMENT OF A MANDATORY POLAR CODE UPDATE ON PROGRESS
 DEVELOPMENT OF A MANDATORY POLAR CODE UPDATE ON PROGRESS Dr. H. Deggim IMO, Marine Technology Section Presentation topics IMO and ships operating in polar waters Existing regulatory framework for ice-covered
Section 3.8: Casualty Data Survey. TERMPOL Surveys and Studies
 TERMPOL Surveys and Studies ENBRIDGE NORTHERN GATEWAY PROJECT FINAL - REV. 0 Prepared for: Northern Gateway Pipelines Inc. April 30, 2010 Table of Contents Table of Contents 1 Introduction... 1-1 1.1
U.S. Coast Guard - American Waterways Operators Safety Report National Quality Steering Committee
 Am erican Waterways Operators August 05, 2015 Established Safety Metrics U.S. Coast Guard - American Waterways Operators Safety Report National Quality Steering Committee Towing Industry Safety Statistics
Report on shipping accidents in the Baltic Sea area during 2010
 HELSINKI COMMISSION Baltic Marine Environment Protection Commission Report on shipping accidents in the Baltic Sea area during 2010 Photo by Maritime office in Gdynia Table of contents 1 Introduction...
ALASKA RRT. Arctic & Western Alaska Area Committee Brief March 5, 2019
 ALASKA RRT Arctic & Western Alaska Area Committee Brief March 5, 2019 AREA COMMITTEE UPDATE Notable Events within Area Committee: 5 Subcommittees met and began work on OSC tasking Workgroups formed underneath
Port Dues and Charges of the Freeport of Riga
 Approved by Decree No 38, 16.06.2000 of Board of the Freeport With amendments of: 22.09.2000 22.12.2000 27.04.2001 08.06.2001 19.10.2001 17.12.2001 18.12.2002 Port Dues and Charges of the Freeport of Riga
EMERGENCY TOWING CAPABILITIES IN LITHUANIA. Igor Kuzmenko Lietuvos maritime academy
 EMERGENCY TOWING CAPABILITIES IN LITHUANIA Igor Kuzmenko Lietuvos maritime academy Introductory words It is axiomatic that lifesaving takes precedence over salvage but saving the ship may also be the best
Validity: indefinitely
 1 (36) Date of issue: 20 June 2017 Entry into force: 1 July 2017 Validity: indefinitely Legal basis: Act on the Technical Safety and Safe Operation of Ships (1686/2009), sections 43(4), 46(2), 47(2), 48(3),
TARIFF OF HARBOUR DUES
 PORT OF GDYNIA AUTHORITY S.A. JOINT-STOCK COMPANY TARIFF OF HARBOUR DUES Valid from 1 July 2007 The Tariff established by the Port of Gdynia Authority, S.A. under Resolution no. 168/II/2004 of 18 August
ROUTEING OF SHIPS, SHIPS REPORTING AND REPATED MATTERS. Establishment of Five Areas To Be Avoided In The Region of the Aleutian Island Archipelago
 ROUTEING OF SHIPS, SHIPS REPORTING AND REPATED MATTERS Establishment of Five Areas To Be Avoided In The Region of the Aleutian Island Archipelago Submitted by the United States SUMMARY Executive summary:
MARITIME AND PORT AUTHORITY OF SINGAPORE SHIPPING CIRCULAR NO. 3 OF 2014
 MARITIME AND PORT AUTHORITY OF SINGAPORE SHIPPING CIRCULAR NO. 3 OF 2014 MPA Shipping Division 460 Alexandra Road 21 st Storey PSA Building Singapore 119963 Fax: 63756231 http://www.mpa.gov.sg 21 January
Order on the discharge of oil from ships in the exclusive economic zone around Greenland
 Translation: Only the Danish document has legal validity. Order no. 589 of 22 May 2017 issued by the Ministry of Environment and Food of Denmark Order on the discharge of oil from ships in the exclusive
Serving the Tampa Bay Maritime Community Since Celebrating over 125 Years of Service
 Serving the Tampa Bay Maritime Community Since 1886 Celebrating over 125 Years of Service Tampa Bay Pilots Association Piloting is an essential service of such paramount importance that its continued existence
European Maritime Safety Agency MARINE CASUALTIES AND INCIDENTS
 MARINE CASUALTIES AND INCIDENTS SUMMARY OVERVIEW 2011-2015 TAKING A BROADER VIEW IN ACCIDENT INVESTIGATION It is with great pleasure that I introduce this new publication based on EMSA s activities in
To the Members May Alaska Alternative Planning Criteria (APC)
") To the Members May 2012 Alaska Alternative Planning Criteria (APC) As from 14 May 2012, the US Coast Guard (USCG) will require compliance with new Alternative Planning Criteria (APC) for certain vessels
To the Members May 2012 Alaska Alternative Planning Criteria (APC) As from 14 May 2012, the US Coast Guard (USCG) will require compliance with new Alternative Planning Criteria (APC) for certain vessels
The Risk Management of Vessel Traffic
 Western Washington University Western CEDAR Salish Sea Ecosystem Conference 2014 Salish Sea Ecosystem Conference (Seattle, Wash.) May 1st, 3:30 PM - 5:00 PM The Risk Management of Vessel Traffic Follow
7 REGIONAL OVERVIEW 2
 7 REGIONAL OVERVIEW 2 Alaska s Marine Highway: Kodiak And The Aleutians Segment Corridor Plan 9 2 REGIONAL OVERVIEW This segment of Alaska s Marine Highway extends from the western portion of the Prince
Commercial Shipping in the Arctic. Marine Board Workshop Safe Navigation in the Arctic October 15-16, 2012
 Commercial Shipping in the Arctic Marine Board Workshop Safe Navigation in the Arctic October 15-16, 2012 Agenda 1. The Shortest Distance Between Two Points 2. Northern Sea Route 3. Commercial Arctic Shipping
Cooperation Agreements for SAR Service and COSPAS-SARSAT SEARCH AND RESCUE AGREEMENTS: OVERVIEW. (Presented by United States)
") SAR/NAM/CAR/SAM IP/16 International Civil Aviation Organization 12/05/09 Search and Rescue (SAR) Meeting for the North American, Caribbean and South American Regions (SAR/NAM/CAR/SAM) (Puntarenas, Costa
SAR/NAM/CAR/SAM IP/16 International Civil Aviation Organization 12/05/09 Search and Rescue (SAR) Meeting for the North American, Caribbean and South American Regions (SAR/NAM/CAR/SAM) (Puntarenas, Costa
Places of Refuge February 2017
 SR & G SHIPPING REGULATIONS & GUIDANCE Places of Refuge February 2017 Contents Introduction... 2 Case Studies... 3 International Guidance... 4 Guidelines by Country... 4 Summary... 5 Checklist for Action
Report on shipping accidents in the Baltic Sea area during Introduction
 HELSINKI COMMISSION Baltic Marine Environment Protection Commission Report on shipping accidents in the Baltic Sea area during 2009 Introduction Reports on shipping accidents in the Baltic Sea area have
July 2012 Passenger and Cargo Traffic Statistics Reno-Tahoe International Airport
 July 2012 Passenger and Cargo Traffic Statistics Reno-Tahoe International Airport August 31, 2012 U.S. DOMESTIC INDUSTRY OVERVIEW FOR JULY 2012 All RNO Carriers Systemwide year over year comparison Average
Port dues and charges Free port of Ventspils
 Port dues and charges Free port of Ventspils Adopted by the Ventspils Freeport Board s Decision No.3/11 of 22.02.2008 Board s Decision No.7/8 of 19.06.2009 Board s Decision No.15/24 of 20.11.2009 Board
PROGRESS TOWARDS THE DEVELOPMENT OF AN INTERNATIONAL POLAR CODE
 PROGRESS TOWARDS THE DEVELOPMENT OF AN INTERNATIONAL POLAR CODE AGM RINA London Branch 25 April 2013 Dr. H. Deggim IMO, Marine Technology Section Presentation topics IMO and ships operating in polar waters
State of the Waterway 2017
 State of the Waterway 2017 Steven W. Nerheim Director VTS Houston/Galveston Lone Star Harbor Safety Committee 2 FEBRUARY 2018 U.S. Port Rankings 2015 1 South Louisiana, LA, Port of 259.1-3.07% 15 Texas
Ice Navigation MIWB Wibbo Hofman MIWB 28/09/2017
 Ice Navigation MIWB 2017 Wibbo Hofman MIWB 28/09/2017 Training for ships sailing in polar waters at the MIWB Terschelling. Foto Biglift Training Requirements 2017 International legislation STCW 2010 Solas/Marpol
March 2014 Passenger and Cargo Traffic Statistics Reno-Tahoe International Airport
 March 2014 Passenger and Cargo Traffic Statistics Reno-Tahoe International Airport April 25, 2014 U.S. DOMESTIC INDUSTRY OVERVIEW FOR MARCH 2014 All RNO Carriers Domestic Systemwide year over year comparison
BOARD OF TRUSTEES OF THE GALVESTON WHARVES Tariff Circular No. 6
 15 th Revised Page 25 ISSUED: NOVEMBER 27, 2017 EFFECTIVE: JANUARY 1, 2018 DOCKAGE (I) (C)(GS) 410 Except as otherwise provided herein, or as otherwise specified in Leases, Operating and Berthing Agreements
Alaska Aviation Emissions Inventory
 Alaska Aviation Emissions Inventory Prepared by Sierra Research, Inc. CH2M HILL April 27, 2005 Purpose WRAP Emissions Forum is responsible for compiling emission inventories for use in meeting regional
Statistics of Air, Water, and Land Transport Statistics of Air, Water, and Land. Transport Released Date: August 2015
 Statistics of Air, Water, and Land Transport 2014 2013 1 Released Date: August 2015 Table of Contents Introduction... 4 Key Points... 5 1. Air Transport... 6 1.1 Aircraft movements... 6 1.2 Number of passengers...
SHIPBUILDING INDUSTRY
 0 SHIPBUILDING INDUSTRY Turkey is surrounded by sea on three sides, is a natural bridge between Asia and Europe. Turkey borders the Black Sea, the Mediterranean, the Aegean and the Sea of Marmara. The
WÄRTSILÄ CORPORATION
 WÄRTSILÄ CORPORATION INTERIM REPORT JANUARY-SEPTEMBER 21 OLE JOHANSSON, PRESIDENT & CEO 2 OCTOBER 21 1 Wärtsilä Q3/1 Highlights Order intake EUR 1,4 million (+38%) Net sales EUR 1,39 million (-11%) Operating
AK DOT/PF Overview. 11/4/2016 Alaska DOT&PF
 Alaska AK DOT/PF Overview 11/4/2016 Alaska DOT&PF 2 Alaska AKDOT/PF Overview Our mission is to "Keep Alaska Moving through service and infrastructure." 11/4/2016 Alaska DOT&PF 3 Organization REGIONAL STATISTICS
GLOBAL SHIP RECYCLING MARKET OVERVIEW & June 30, rd Asia Ship Recycling & SNP Summit, China
 GLOBAL SHIP RECYCLING MARKET OVERVIEW & OUTLOOK 2011 1 SHIP RECYCLING 1. Commercial influences on scrapping decision 2. The Global Ship Recycling Industry: Where it s done 3. Issues: Supply, Capacity and
2012 RESULT PRESENTATION
 212 RESULT PRESENTATION BJÖRN ROSENGREN, PRESIDENT & CEO 25 JANUARY 213 Wärtsilä Net sales back to growth with stable profitability 212 development Order intake EUR 4,94 million, +9% Net sales EUR 4,725
GENERAL TARIFF PROVISIONS :
 GENERAL TARIFF PROVISIONS : a) Overtime working hours are considered from 22.00 hrs to 06.00 hrs of the next day, and from 22.00 hrs on Friday to 06.00 on Monday as well as during holidays. b) Service
INTERIM REPORT JANUARY-JUNE 2012 BJÖRN ROSENGREN, PRESIDENT & CEO 18 JULY 2012
 INTERIM REPORT JANUARY-JUNE 212 BJÖRN ROSENGREN, PRESIDENT & CEO 18 JULY 212 Highlights Q2/212 Order intake EUR 1,198 million, +2% Net sales EUR 1,99 million, +6% Book-to-bill 1.9 (1.13) EBIT EUR 113 million,
May 2011 Passenger and Cargo Traffic Statistics Reno-Tahoe International Airport
 May 2011 Passenger and Cargo Traffic Statistics Reno-Tahoe International Airport July 5, 2011 U.S. DOMESTIC INDUSTRY OVERVIEW FOR MAY 2011 All RNO Carriers Systemwide year over year comparison Average
Agenda: SASP SAC Meeting 3
 Agenda: SASP SAC Meeting 3 Date: 04/12/18 Public Involvement Plan Update Defining the System Recommended Classifications Discussion Break Review current system Outreach what we heard Proposed changes Classification
Trends and Opportunities in the Alaska Maritime Industrial Support Sector
 Trends and Opportunities in the Alaska Maritime Industrial Support Sector Prepared for: Alaska Department of Commerce, Community & Economic Development Division of Economic Development Prepared by: Juneau
TRAFFIC COMMERCIAL AIR CARRIERS
 INTERNATIONAL CIVIL AVIATION ORGANIZATION AIR TRANSPORT REPORTING FORM (01/00) Page of Contact person for inquiries: Organization: Tel.: Fax: E-mail: State: Air carrier: Month(s): Year: 20 TOTAL ALL SERVICES
1.2 Some of the figures included in this publication may be provisional and revised in later issues.
 FOREWORD 1 CONTENT 1.1 "UK Airlines - Operating and Traffic Statistics" is published by the Civil Aviation Authority with the co-operation of the United Kingdom airline operators. 1.2 Some of the figures
BOARD OF TRUSTEES OF THE GALVESTON WHARVES Tariff Circular No. 6
 16th Revised Page 25 ISSUED: MAY 22, 2018 EFFECTIVE: JULY 1, 2018 DOCKAGE (I)(GS) 410 Except as otherwise provided herein, or as otherwise specified in Leases, Operating and Berthing Agreements or Terminal
September 2013 Passenger and Cargo Traffic Statistics Reno-Tahoe International Airport
 September 2013 Passenger and Cargo Traffic Statistics Reno-Tahoe International Airport October 31, 2013 U.S. DOMESTIC INDUSTRY OVERVIEW FOR SEPTEMBER 2013 All RNO Carriers Systemwide year over year comparison
Passenger and Cargo Statistics Report
 Passenger and Cargo Statistics Report RenoTahoe International Airport August 2015 U.S. DOMESTIC INDUSTRY OVERVIEW FOR AUGUST 2015 All RNO Carriers Domestic Systemwide year over year comparison Average
WÄRTSILÄ CORPORATION
 WÄRTSILÄ CORPORATION UBS PAN EUROPEAN SMALL & MIDCAP CONFERENCE RAIMO LIND, EVP & CFO 19 MAY 211 1 Wärtsilä Q1/11 Highlights Net sales EUR 1,83 million, +18% Order intake EUR 979 million, +11% Operating
August 2014 Passenger and Cargo Traffic Statistics Reno-Tahoe International Airport
 August 2014 Passenger and Cargo Traffic Statistics Reno-Tahoe International Airport October 8, 2014 U.S. DOMESTIC INDUSTRY OVERVIEW FOR AUGUST 2014 All RNO Carriers Domestic Systemwide year over year comparison
TED STEVENS ANCHORAGE INTERNATIONAL AIRPORT: ECONOMIC SIGNIFICANCE 2007
 TED STEVENS ANCHORAGE INTERNATIONAL AIRPORT: ECONOMIC SIGNIFICANCE 2007 by Scott Goldsmith Mary Killorin Prepared for Ted Stevens Anchorage International Airport September 2007 Institute of Social and
b) Cargo ships, including high-speed craft, of 500 GT and above; and c) Mobile offshore units, including mobile offshore drilling units
 Cargo ships, including high-speed craft, of 500 GT and above; and c) Mobile offshore units, including mobile offshore drilling units") MARITIME AND PORT AUTHORITY OF SINGAPORE PORT MARINE CIRCULAR No 10 of 2016 23 Jun 2016 Shipping Community REVISION TO THE PRE-ARRIVAL NOTIFICATION (PAN) 1 The Maritime and Port Authority of Singapore
MARITIME AND PORT AUTHORITY OF SINGAPORE PORT MARINE CIRCULAR No 10 of 2016 23 Jun 2016 Shipping Community REVISION TO THE PRE-ARRIVAL NOTIFICATION (PAN) 1 The Maritime and Port Authority of Singapore
BHP Billiton Scope 3 emissions
 BHP Billiton Scope 3 emissions The scope 3 emissions associated with BHP Billiton s operations and activities have been calculated using methodologies consistent with the WRI Greenhouse Gas Protocol Corporate
REVISION TO THE PRE-ARRIVAL NOTIFICATION OF SECURITY (PANS)
") PORT MARINE CIRCULAR NO. 05 OF 2013 21 Jun 2013 Shipping Community REVISION TO THE PRE-ARRIVAL NOTIFICATION OF SECURITY (PANS) The Maritime and Port Authority of Singapore would like to inform the shipping
PORT MARINE CIRCULAR NO. 05 OF 2013 21 Jun 2013 Shipping Community REVISION TO THE PRE-ARRIVAL NOTIFICATION OF SECURITY (PANS) The Maritime and Port Authority of Singapore would like to inform the shipping
The explanations of other terms used throughout the tables are contained in the section on Definitions immediately following the tables.
 FOREWORD 1 CONTENT 1.1 UK Airports - Annual Statements of Movements, Passengers and Cargo is prepared by the Civil Aviation Authority with the co-operation of the United Kingdom airport operators. The
Retrofitting PureBallast Water Treatment Systems. onboard Two Car Carriers
 Retrofitting PureBallast Water Treatment Systems onboard Two Car Carriers Per Warg 1. Background First installed in 2003, the Alfa Laval PureBallast treatment system was installed as a retrofit and tested
NOTICE B-1. Harbour Fees Tariff
 NOTICE B-1 Harbour Fees Tariff Effective Date: July 1, 2015 This Notice is issued pursuant to section 49 of Part I of the Canada Marine Act, Chapter 10, 46-47 Elizabeth II, 1997-98. NOTICE B-1 Harbour
Maritime Rules Part 46: Surveys, Certification and Maintenance
 Maritime Rules Part 46: Surveys, Certification and Maintenance ISBN 978-0-947527-42-6 Published by Maritime New Zealand, PO Box 25620, Wellington 6146, New Zealand Maritime New Zealand Copyright 2016 Part
MINISTRY OF INFRASTRUCTURES AND TRANSPORT HARBOUR MASTER S OFFICE OF RAVENNA ORDER NO. 97/2017
 MINISTRY OF INFRASTRUCTURES AND TRANSPORT HARBOUR MASTER S OFFICE OF RAVENNA ORDER NO. 97/2017 The Head of the Maritime Compartment and Harbour Master of the Port of Ravenna: the Regulation for the towing
Dalian VTS Guide for Users
 Dalian VTS Guide for Users 3 rd Edition DALIAN MARITIME SAFETY ADMINISTRATION OF P.R.CHINA DALIAN VESSEL TRAFFIC SERVICE CENTER Introduction The aim of this Guide is to provide vessel traffic service users
Baltic Marine Environment Protection Commission
 Baltic Marine Environment Protection Commission Group of Experts on Safety of Navigation Copenhagen, Denmark, 7 September 218 SAFE NAV 9-218 Document title Draft Annual HELCOM report on shipping accidents
Pacific Project. CPWG/8 - WP/6 Appendix A
 Pacific Project CPWG/8 - WP/6 Pacific Project Objective This project aims to substantially improve operational efficiency and environmental outcomes on the major air traffic flow between North America
Your Global Emergency Response Partner
 Your Global Emergency Response Partner Today s Agenda Resolve Introduction How can we help the gas industry? Case Study (Wreck Removal) LPG Carrier OBERON Case Study 2 (Em. Response) M/V CHESHIRE RESOLVE
Appendix B Ultimate Airport Capacity and Delay Simulation Modeling Analysis
 Appendix B ULTIMATE AIRPORT CAPACITY & DELAY SIMULATION MODELING ANALYSIS B TABLE OF CONTENTS EXHIBITS TABLES B.1 Introduction... 1 B.2 Simulation Modeling Assumption and Methodology... 4 B.2.1 Runway
Greening of the Straits of Malacca
 Greening of the Straits of Malacca 9 th Cooperation Forum Co-operative Mechanism on Safety of Navigation and Environmental Protection in the Straits of Malacca and Singapore Yogyakarta 26 27 September
Civil Aircraft System Safety and Electromagnetic Compatibility
 Civil Aircraft System Safety and Electromagnetic Compatibility Presented to the National Research Council Electronic Vehicle Controls and Unintended Acceleration Study David B. Walen Chief Scientific and
UNITED STATES OF AMERICA DEPARTMENT OF TRANSPORTATION OFFICE OF THE SECRETARY WASHINGTON, D.C.
 Order: 2014-9-16 Served: September 24, 2014 UNITED STATES OF AMERICA DEPARTMENT OF TRANSPORTATION OFFICE OF THE SECRETARY WASHINGTON, D.C. Issued by the Department of Transportation on the 24 th day of
VINTERSJÖFARTSFORSKNING
 STYRELSEN FÖR VINTERSJÖFARTSFORSKNING WINTER NAVIGATION RESEARCH BOARD Research Report No 84 Leena Vedenpää OBSERV OBSERVATIONS OF SHIP ICE PERFORMANCE IN THE BALTIC Winter 2012 Finnish Transport Safety
Marine Exchange of Alaska Port of Juneau Navigation Study
 Safe, Secure, Efficient and Environmentally Responsible Maritime Operations 1000 Harbor Way, Juneau, Alaska 99801 Ph: (907) 463-2607 December 10, 2008 Mr. John Stone Port Director City of Juneau 155 S.
Technical Report. Aircraft Overflight and Noise Analysis. Brisbane, California. December Prepared by:
 Aircraft Noise Abatement Office Technical Report Aircraft Overflight and Noise Analysis Brisbane, California Prepared by: P.O. Box 8097 San Francisco, California 94128 (650) 821-5100 Introduction In response
AGENDA. 09/15/2015 Integrity Excellence Respect
 AGENDA Fiscal Year 2015 Accomplishments & Events Traffic Report Revenue Report & Historical Comparisons Fleet Update Terminal Update Budgetary Constraints Fiscal Year 2016 Operating Plan Fiscal Year 2017
2017/2018 Q3 Performance Measures Report. Revised March 22, 2018 Average Daily Boardings Comparison Chart, Page 11 Q3 Boardings figures revised
 2017/2018 Q3 Performance Measures Report Revised March 22, 2018 Average Daily Boardings Comparison Chart, Page 11 Q3 Boardings figures revised Contents Ridership & Revenue... 1 Historical Revenue & Ridership...
FIXED ROUTE DASHBOARD JULY 2018
 FIXED ROUTE DASHBOARD JULY 2018 Safety Max Target Goal Preventable Collisions per 100k Miles Non-Preventable Collisions per 100k Miles Total Incidents per 10,000 Boardings 1.6 1.3 0.8 2.63 2.1 2.0 1.60
December 2013 Passenger and Cargo Traffic Statistics Reno-Tahoe International Airport
 December 2013 Passenger and Cargo Traffic Statistics Reno-Tahoe International Airport January 24, 2014 U.S. DOMESTIC INDUSTRY OVERVIEW FOR DECEMBER 2013 All RNO Carriers Domestic Systemwide year over year
Lecture 11. Container Ships
 Lecture 11 Container Ships CONTAINER SHIPS LECTURE STRUCTURE Section 1 Section 2 Section 3 Section 4 Construction Stability Classification Ships Carrying Containers CONSTRUCTION SHIP YARDS CONSTRUCTION
Passenger and Cargo Statistics Report
 Passenger and Cargo Statistics Report RenoTahoe International Airport September 2015 U.S. DOMESTIC INDUSTRY OVERVIEW FOR SEPTEMBER 2015 All RNO Carriers Domestic Systemwide year over year comparison Average
AUGUST 2008 MONTHLY PASSENGER AND CARGO STATISTICS
 Inter-Office Memo Reno-Tahoe Airport Authority Date: October 2, 2008 To: Statistics Recipients From: Tom Medland, Director Air Service Business Development Subject: RENO-TAHOE INTERNATIONAL AIRPORT PASSENGER
PERFORMANCE REPORT DECEMBER Performance Management Office
 PERFORMANCE REPORT DECEMBER 2018 Performance Management Office INTRODUCTION/BACKGROUND Performance Management Office FIXED ROUTE DASHBOARD FY 2019 Safety Max Target Goal Preventable Collisions per 100k
December 2012 Passenger and Cargo Traffic Statistics Reno-Tahoe International Airport
 December 2012 Passenger and Cargo Traffic Statistics Reno-Tahoe International Airport January 29, 2013 U.S. DOMESTIC INDUSTRY OVERVIEW FOR DECEMBER 2012 All RNO Carriers Systemwide year over year comparison
ALL SHIPOWNERS, OPERATORS, MASTERS AND OFFICERS OF MERCHANT SHIPS, AND RECOGNIZED ORGANIZATIONS
 REPUBLIC OF Marine Notice THE MARSHALL ISLANDS No. 7-041-6 OFFICE OF THE MARITIME ADMINISTRATOR Rev. 3/14 TO: SUBJECT: ALL SHIPOWNERS, OPERATORS, MASTERS AND OFFICERS OF MERCHANT SHIPS, AND RECOGNIZED
2017/ Q1 Performance Measures Report
 2017/2018 - Q1 Performance Measures Report Contents Ridership & Revenue... 1 Historical Revenue & Ridership... 1 Revenue Actual vs. Planned... 3 Mean Distance Between Failures... 5 Maintenance Cost Quarter
AVIATION RULES OF THE KYRGYZ REPUBLIC APKR-6 "OPERATION OF AIRCRAFT" Annex 6 Flight time limitations and flight duty time 01-Sep-2016
 AVIATION RULES OF THE KYRGYZ REPUBLIC APKR-6 "OPERATION OF AIRCRAFT" Annex 6 Flight time limitations and flight duty time 01-Sep-2016 Contents Contents... 2 1 Definitions... 3 2 Purpose and scope... 3
PERFORMANCE REPORT NOVEMBER 2017
 PERFORMANCE REPORT NOVEMBER 2017 Note: New FY2018 Goal/Target/Min or Max incorporated in the Fixed Route and Connection Dashboards. Keith A. Clinkscale Performance Manager INTRODUCTION/BACKGROUND In June
Passenger and Cargo Statistics Report
 Passenger and Cargo Statistics Report Reno-Tahoe International Airport December 2014 U.S. DOMESTIC INDUSTRY OVERVIEW FOR DECEMBER 2014 All RNO Carriers Domestic Systemwide year over year comparison Average
Ties that Bind The Enduring Economic Impact of Alaska on the Puget Sound Region
 Ties that Bind The Enduring Economic Impact of Alaska on the Puget Sound Region McDowell Group, Inc. Seattle Propeller Club March 18, 2015 McDowell Group Research and consulting since 1973 15 professional
December 2011 Passenger and Cargo Traffic Statistics Reno-Tahoe International Airport
 December 2011 Passenger and Cargo Traffic Statistics Reno-Tahoe International Airport January 27, 2012 U.S. DOMESTIC INDUSTRY OVERVIEW FOR DECEMBER 2011 All RNO Carriers Systemwide year over year comparison
Heavy Fuel Oil use by Cruise Ships in the IMO Polar Code Arctic, 2015
 Briefing 4 Heavy Fuel Oil use by Cruise Ships in the IMO Polar Code Arctic, 2015 Prepared For: European Climate Foundation Prepared By: Bryan Comer, PhD February, 2018 Table of Contents Introduction...
KEN ELLAM PARTNER, MASTER MARINER EMPLOYMENT HISTORY. Master Mariner STCW 95 A II/2
 KEN ELLAM PARTNER, MASTER MARINER Master Mariner STCW 95 A II/2 k.ellam@solis-marine.com T: +65 6221 8568 M: +65 9012 4644 Solis Marine Consultants Pte. Ltd, 20 McCallum Street, #19-01 Tokio Marine Centre,
January 2014 Passenger and Cargo Traffic Statistics Reno-Tahoe International Airport
 January 2014 Passenger and Cargo Traffic Statistics Reno-Tahoe International Airport March 12, 2014 U.S. DOMESTIC INDUSTRY OVERVIEW FOR DECEMBER 2013 All RNO Carriers Domestic Systemwide year over year
European Maritime Safety Agency ANNUAL OVERVIEW OF MARINE CASUALTIES AND INCIDENTS 2018
 European Maritime Safety Agency ANNUAL OVERVIEW OF MARINE CASUALTIES AND INCIDENTS 2018 ANNUAL OVERVIEW OF MARINE CASUALTIES AND INCIDENTS 2018 Annual Overview of Marine Casualties and Incidents 2018
CAPTAIN NICHOLAS J. LEWIS Marine Expert
 PROFESSIONAL EXPERIENCE 2009 to Robson Forensic, Inc. present Associate Provide technical investigations, analysis, reports, and testimony towards the resolution of commercial and personal injury litigation
January 2018 Air Traffic Activity Summary
 January 2018 Air Traffic Activity Summary Jan-2018 Jan-2017 CY-2018 CY-2017 Passengers 528,947 505,421 4.7% 528,947 505,421 4.7% Passengers 537,332 515,787 4.2% 537,332 515,787 4.2% Passengers 1,066,279
Republic of Turkey - Ministry of Economy,
 Republic of Turkey - Ministry of Economy, 2012 0 SHIPBUILDING INDUSTRY Turkey is surrounded by sea on three sides, is a natural bridge between Asia and Europe. Turkey borders the Black Sea, the Mediterranean,
PROGRESS REPORT ON PROJECT 1 Removal of Wrecks in the Traffic Separation Scheme in the SOMS
 PROGRESS REPORT ON PROJECT 1 Removal of Wrecks in the Traffic Separation Scheme in the SOMS CONTENT 1. Introduction; 2. Objective; 3. Scope; 4. An Updates @ Achievement; Hydrographic Survey Risk Assessment
Reporting Instructions FILING REQUIREMENTS
 FORM D FLEET AND PERSONNEL COMMERCIAL AIR CARRIERS Reporting Instructions General FILING REQUIREMENTS This form is to be used by ICAO Member States to report aircraft fleet and personnel statistics for
TAG Farnborough Airport
 TAG Farnborough Airport Farnborough Aerodrome Consultative Committee TAG Information Report - March 2012 1. Aircraft Movements 1.1 Following the acceptance of the TAG appeal on the 11 th February 2011,
Maritime Areas Act, 1983 (1)(Act No. 15 of 19 May 1983)
(Act No. 15 of 19 May 1983)") Page 1 Maritime Areas Act, 1983 (1)(Act No. 15 of 19 May 1983) An act to declare the Maritime Areas and for matters incidental thereto and connected therewith. 1. This Act may be cited as the Maritime
Page 1 Maritime Areas Act, 1983 (1)(Act No. 15 of 19 May 1983) An act to declare the Maritime Areas and for matters incidental thereto and connected therewith. 1. This Act may be cited as the Maritime
For Immediate Release September 3, CONSTRUCTION BEGINS ON NEW CABLE FERRY Special steel cutting ceremony held at shipyard
 For Immediate Release 14-033 September 3, 2014 CONSTRUCTION BEGINS ON NEW CABLE FERRY Special steel cutting ceremony held at shipyard VICTORIA BC Ferries and Seaspan s Vancouver Shipyards announced that