City of Edmonton Graffiti Vandalism Audit 2014
|
|
|
- Amos French
- 5 years ago
- Views:
Transcription


1 City of Edmonton Graffiti Vandalism Audit 2014 Prepared by: MGM Management April 2015 EXECUTIVE
2 Table of Contents Acknowledgements... 3 Executive Summary... 4 Table ES-1 Summary... 5 Figure ES-1 Locations & Tag Summary... 5 Introduction & Background... 8 Audit Methodology City Graffiti Vandalism Observations Choosing Neighbourhoods for Auditing Selecting Hot Spot & Random Sample Areas Results of the Edmonton Audit Neighbourhood Graffiti Index & Rankings Size & Descriptor of Graffiti Target Properties & Categories Location Intensity Rating (LIR) Conclusions APPENDIX A Overview Audit Sample Locations APPENDIX B - Graffiti Observation Locations (Examples) APPENDIX C Glossary of Terms Figure 1 City Graffiti Observations ( ) Figure 2 Hot Spot & Random Sample Areas Figure 3 Locations & Tag Count Summary Figure 4 Combined Graffiti Index Results - by Neighbourhood
3 Table 1 Area of Hot Spots & Random Sample (Hectares) Table 2 Neighbourhood Graffiti Index Results Table 3 Combined Neighbourhood Graffiti Index Results Table 4 Graffiti Occurrence by Neighbourhood Sampled Table 5 Comparison of Graffiti 2014 vs Neighbourhoods Table 6 Graffiti Observed in 2014 is Mainly Small Table 7 Summary of Graffiti Vandalism Observed in Table 8 Graffiti Categories Table 9 Graffiti Targets & Category Results Table 10 Location Intensity Rating Analysis ( ) Table 11 Location Intensity Index Top 50 Sites
4 Acknowledgements Community Relations, Community Standards, Community Services Don Belanger, Acting Director, Community Relations, Community Standards Branch Sharon Chapman, Senior Program Planner, Community Relations, Community Standards Branch Diana Kim, Research and Report Writer, Community Relations, Community Standards Branch Complaints & Investigations, Community Standards, Community Services Tiffany Sustrik, Supervisor, Complaints & Investigations, Community Standards Mandi Friesen, Municipal Enforcement Officer, Complaints & Investigations, Community Standards Dan Bak, Municipal Enforcement Officer, Complaints & Investigations, Community Standards Amanda Lau, Municipal Enforcement Officer, Complaints & Investigations, Community Standards Ryan Podgurney, Municipal Enforcement Officer, Complaints & Investigations, Community Standards Chris Samy, Municipal Enforcement Officer, Complaints & Investigations, Community Standards Capital City Clean Up Operations Committee Chris Fowler, Waste Management & Utility Services Branch Tim O Donnell, Neighbourhood Parks and Community Recreation Branch Don Turene, Transportation Operations Branch Troy Courtoreille, Complaints and Investigations, Community Standards Branch Trevor Dennehy, Edmonton Transit Bruce Kobialko, Project Management and Maintenance Services Grant Blaines, Community Peace Officers, Community Standards Branch Information Technology Tim Beauchamp, BSS Coordinator POSSE/PeopleSoft Enhance, Corporate Services, Information Technology 3
5 Executive Summary The City of Edmonton engaged MGM Management, a British Columbia consulting firm, to design and conduct a graffiti vandalism audit in selected neighbourhoods within the City. The first graffiti vandalism audit occurred in November of 2010, with repeat audits in 2011, October 2012, October 2013 and October This report presents the results for observations made in October 2014, during the fifth graffiti vandalism audit conducted in Edmonton. MGM Management specializes in environmental auditing, and has conducted seven litter audits (2007, 2009, 2010, 2011, 2012, 2013 and 2014) and four previous graffiti vandalism audits for the City of Edmonton, as well as 26 environmental audits for other clients in Canada and the USA. Graffiti vandalism is a public nuisance offense that causes damage to public and private property. Graffiti is different from litter as it is both a bylaw infraction and criminal act (mischief under the Criminal Code of Canada). During each of Edmonton's graffiti audits the consultant examined graffiti vandalism in the most active neighbourhoods where graffiti is documented in Edmonton. Edmonton has 367 designated neighbourhoods. It would be cost and time prohibitive to audit all 367 of them, therefore a sample of neighbourhoods was used for audit purposes. Graffiti auditing for 2014 has been done in the same 20 Edmonton neighbourhoods which have been audited since The neighbourhoods represent those with the highest incidents of graffiti complaints from citizens. In 2012, five neighbourhoods were added to increase the sample size of the audit. These five neighbourhoods were selected on the basis of greatest change in complaints from 2012 compared to 2011 incident reports in the City s POSSE database. In 2013, these neighbourhoods were not sampled as it was recognized after the 2012 audit that these locations had insignificant levels of graffiti present. In each of the chosen target neighbourhoods, a hot spot sample area and a random sample area were selected. Hot spot areas were those where significant reports of graffiti vandalism had been recorded in the City s data system. For each sample area the consultant selected an area of 4 city blocks by 4 city blocks representing a size of approximately hectares. For comparison a random area, the same approximate size as the hot spot was selected in each of the 20 neighbourhoods being audited. These random areas were selected from areas within the neighbourhood where there had been fewer or no reports of graffiti. During the 2014 graffiti audit, the audit crew observed graffiti vandalism at 352 locations where graffiti vandalism was present, a reduction from 395 locations in 2013, representing an 11% decrease in locations compared to In these locations, 1,071 graffiti tags were observed in the current audit, compared to 1,413 tags in 2013, a decrease of 24% over the previous year. 4
6 Table ES-1 Summary Locations Total Locations where graffiti observed Change from previous year -10.9% -9.8% -19.3% -15.9% Change from % Change from % Change from % Graffiti Tags Graffiti tags observed in 20 neighbourhoods 1,071 1,413 1,116 1,133 1,978 Change from previous year -24.2% 26.6% -1.5% -42.7% Change from % Change from % Change from % During the 2014 audit there were 11% fewer locations observed with graffiti present and 24% fewer tags observed, within the 20 original neighbourhoods examined, compared to the Figure ES-1 Locations & Tag Summary % decrease in tags in 2014 compared to TAGS LOCATIONS % reduction in locations since
7 A significant observation of the current graffiti audit is that, in the Downtown neighbourhood, graffiti decreased from 325 tags in 2013 to 225 in 2014, a 31% decrease. There was also a significant decrease in the Strathcona neighbourhood where graffiti tags decreased from 203 tags in 2013 to 135 in 2014, a 33% decrease. Tags in Garneau also diminished from 120 tags in 2013 to 72 in 2014, a 40% decrease. In 2013 the largest contributors of tags came from those three neighbourhoods, which combined represented 46% of all graffiti observed. The largest contributors of tags observed during the 2014 audit were from the Downtown, Strathcona and Boyle Street neighbourhoods, a result of the decrease in graffiti found in Garneau and an increase in the Boyle Street neighbourhood. Graffiti observed in these three neighbourhoods accounts for 42.8% of the total tags found in the 2014 audit with Downtown, Strathcona and Boyle Street representing 21%, 12.6% and 9.2% respectively. The greatest increase in observed graffiti tags occurred in Beverly Heights (400% increase from 2 tags to 10); Ritchie with a 359% increase (from 17 to 78 tags) and in Queen Mary neighbourhood with a 96% increase (from 24 to 47 tags). During the 2014 audit, the audit team traveled over 560 kilometres within Edmonton s 20 sample neighbourhoods, on streets, in alleys and in laneways recording graffiti observations. During the course of this audit over 1,200 photographs were taken recording the graffiti observed. A comprehensive database was created to archive and analyse the data collected. Paper records, electronic data records and digital photographic records were archived to preserve the data gathered. The method used by the City of Edmonton, as developed by the consultant for this audit provides a repeatable and unbiased way of auditing neighbourhoods for graffiti vandalism. The neighbourhoods examined in this audit can be examined in the future to determine whether the amount of graffiti vandalism is increasing or decreasing. During the 2014 graffiti vandalism audit the consultant calculated a Location Intensity Rating (LIR) to examine the amount and intensity of graffiti at each of the 352 locations. For comparison purposes these intensities (LIR) of graffiti are plotted on neighbourhood maps in Appendix B showing graffiti locations and LIRs for 2014 and Consistent with observing fewer graffiti tags in 2014, was the behavior of the graffiti index in 2014 compared to previous years. The graffiti index is a measure of the amount of graffiti observed per geographic area (hectares). This index decreased in 2014 from a combined index of in 2013 to in During the 2014 field work, auditors were accompanied by a City of Edmonton Municipal Enforcement Officer, from the Complaints and Investigations Section of the Community Standards Branch. The identification of taggers has been enhanced by having city staff participating in the audit, due to their skills as Municipal Enforcement Officers in reading tagger names. 6
8 During the 2014 audit the number of taggers observed was 400, compared to 424 taggers in 2013, 305 graffiti taggers in 2012 and 379 in Most graffiti tags are small in size covering less than sq.m (2 sq.ft.). In the current audit there were proportionately more small tags than in 2013 audit. In the 2014 audit 83% of the tags were small tags compared to 73% A similar proportion of medium sized tags (>2sq.ft. <9 sq.ft.) was seen in 2014 (11% in 2014 and 13% in 2013). The graffiti observed in 2014 was predominantly marker / plain graffiti (92% in 2014 and 93% in 2013). This is graffiti that is textual or stylized in nature, and is in no way artistic in its design. The removal of postal boxes by Canada Post Edmonton streets continues to provide a reduction of graffiti throughout the City. The consultant noted that the proportion of total graffiti on city assets (signs, ETS, park furniture etc.) has increased slightly in 2014, which may be a result of the removal of postal boxes. Commercial waste bins, parking lot barricades, signs and posts continue to be common targets for taggers. Private residential and multi-family residential properties are often targets of graffiti vandals, especially on fences and garages in back alleys and laneways. In the 2014 audit the consultant observed that murals, throughout the City, were not generally defaced by graffiti tags. This reinforces previous observations that in general graffiti vandals avoid tagging murals. 7
9 Introduction & Background Graffiti vandalism is a property vandalism crime that places a financial burden on public and private property owners. Graffiti vandalism defaces property, resulting in significant cleanup efforts and remediation costs in a large municipality like Edmonton. The City of Edmonton s Capital City Clean Up (CCCU) program operates an active Graffiti Management Program (GMP). The Capital City Clean Up program provides support to property owners in understanding graffiti vandalism, removing graffiti, and engages the community in sharing the responsibility for graffiti vandalism prevention and removal. Due to increased public concern and awareness, Community Standards Bylaw 14600, section 9, was amended effective April 1, 2008, requiring owners to remove graffiti vandalism from their properties upon notification. Community Standards bylaw enforcement allows for the issuing of a $250 ticket in the event of non-compliance. The City can also cause a forced cleaning to be implemented under the Municipal Government Act, with municipal assets conducting the cleanup. These costs are transferred back to the property owner by adding the cost to the tax roll for the specific property. In 2008, in order to increase enforcement and removal, CCCU proactively created an inventory of graffiti vandalism in the City. In this inventory it was not possible to collect detailed information on the graffiti vandalism at each location. The inventory served as a starting point for graffiti enforcement in the spring of Subsequently, a second inventory was completed by City of Edmonton graffiti removal staff from November 1, 2009 to April 1, Since 2008, information regarding graffiti has been gathered by the City through complaints and documentation from bylaw officers. This information has been entered into the City s POSSE data management system for investigation and follow-up. Staff determined that some graffiti data was inaccurate or incomplete causing difficulties in follow-up activities for bylaw officers to conduct enforcement. Data entered into the City s POSSE data management system formed the basis of designing the first graffiti audit in 2010, and has been used, as the source of data, in choosing which neighbourhoods would be sampled in graffiti vandalism audits. Information assembled on taggers and locations of graffiti is shared with the Edmonton Police Service to assist police in their investigations and to improve the success of charges laid for graffiti offences. In October 2010, the City and MGM Management developed and implemented a method for auditing the graffiti vandalism in selected neighbourhoods in Edmonton. Using audit techniques the City is now able to compare the occurrence of graffiti offences in given neighbourhoods and has a new tool to compare graffiti vandalism intensity from one year to the next. City bylaw enforcement staff have issued clean up notices to property owners based on the information gathered from the 2010, 2011, 2012 and 2013 Graffiti Vandalism Audits. This process has proven to be effective in identifying and reducing graffiti occurrences in Edmonton. 8
10 Commencing in mid-october 2014, the City conducted its fourth Graffiti Vandalism Audit. The original 20 neighbourhoods, examined in 2010, 2011 and 2013 were audited again in By conducting graffiti audits Edmonton has developed a method for evaluating the occurrence and the intensity of graffiti vandalism in selected neighbourhoods. The results provide unbiased information about the street names (tagger names) of graffiti vandals while examining the types and size of graffiti vandalism and target properties where graffiti is placed. This report describes how the 2014 graffiti audit was conducted and provides results based upon field audit observations. The debate on graffiti street art versus graffiti vandalism has long been a contentious issue for Edmontonians. The City of Edmonton is committed to promoting safer, cleaner communities by reducing and preventing graffiti vandalism, while at the same time recognizing the artistic and cultural value street art can add when done tastefully, with permission and so that it does not contravene the Community Standards bylaw. 9
11 Audit Methodology Before the 2010 audit was conducted, the City of Edmonton (COE) searched existing literature sources to determine what services were available to conduct graffiti vandalism audits. It became evident that methods for auditing graffiti vandalism were not readily available in Canada or elsewhere. City of Edmonton staff in cooperation with MGM Management, a B.C. based environmental consulting firm, designed a method for auditing graffiti vandalism. The baseline audit was carried out in early November Subsequently a repeat graffiti vandalism audit was done in late October/early November in 2011 and 2012, and again in October 2013 and 2014 to determine changes in graffiti behaviour as compared to the baseline work. MGM Management has extensive experience designing and conducting environmental audits. MGM Management has completed over 30 environmental audits for municipal and provincial clients since Edmonton's use of a standardized method of observing graffiti, as a periodic audit of portions of the city, has become a reliable way of examining whether the occurrence of graffiti vandalism is changing over time. This method was recently adopted by the City of Hamilton in Ontario, who after consultation with the City of Edmonton, chose to use the same methodology for auditing graffiti vandalism in that municipality. In addition to this graffiti study, this firm has completed seven litter audits for the City of Edmonton, in 2007, 2009, 2010, 2011, 2012, 2013 and

12 City Graffiti Vandalism Observations Graffiti vandalism occurrence data was plotted on a map to indicate where, in the city, complaints were observed over the period The map below was then created to show where graffiti complaints and observations by City staff were documented. This data analysis ranked the number of complaints or observations of graffiti vandalism, by neighbourhood, resulting in neighbourhoods of interest. Figure 1 City Graffiti Observations ( ) 11
13 Choosing Neighbourhoods for Auditing The City of Edmonton's graffiti data was used in 2010 to select the 20 original neighbourhoods that had the most significant reports of graffiti occurrences. The same neighbourhoods were audited in 2010, 2011, 2012, 2013 and for this audit in Figure 2 Hot Spot & Random Sample Areas 12
14 Selecting Hot Spot & Random Sample Areas Upon considering reported graffiti vandalism data, the locations of complaints and bylaw enforcement observations were examined based upon available municipal addresses within neighbourhoods of interest. From this assessment, the consultant identified an area within each target neighbourhood as a hot spot, meaning an area within each neighbourhood that historically had the largest occurrences of graffiti vandalism for that neighbourhood. For control purposes a second sample area within each neighbourhood was selected and termed a random sample area. These random areas were chosen to act as a control during the audit, regardless of whether or not there were documented graffiti vandalism activities in that part of the neighbourhood. In order to keep neighbourhood sample size manageable, the consultant selected areas that were approximately 4 city blocks by 4 city blocks in size. This approximate size of 16 square city blocks was used for both hot spot and random sample areas. Using geospatial software techniques the exact geographical areas of each hot spot and random area were calculated, in hectares as presented in Table 1, below. Table 1 Area of Hot Spots & Random Sample (Hectares) Type Neighbourhood Area (Hectare) Area - (Sq. Kilometre) Type Neighbour hood Area (Hectare) Area - (Sq. Kilometre) Hot Spot Alberta Avenue Hot Spot Inglewood Random Alberta Avenue Random Inglewood Hot Spot Beacon Heights Hot Spot Killarney Random Beacon Heights Random Killarney Hot Spot Belvedere Hot Spot McCauley Random Belvedere Random McCauley Hot Spot Beverley Heights Hot Spot Oliver Random Beverley Heights Random Oliver Hot Spot Boyle Street Hot Spot Parkdale Random Boyle Street Random Parkdale Hot Spot Central McDougall Hot Spot Queen Alexandra Random Central McDougall Random Queen Alexandra Hot Spot CPR West/Strathcona Junction Hot Spot Queen Mary Park Random CPR West/Strathcona Junction Random Queen Mary Park Hot Spot Downtown Hot Spot Ritchie Random Downtown Random Ritchie Hot Spot Eastwood Hot Spot Strathcona Random Eastwood Random Strathcona Hot Spot Garneau Hot Spot Westmount Random Garneau Random Westmount Average area Sample size Hectare Sq. Km Sample areas were about 29 hectares (or just under 1/3 of a square kilometre in size) and proved to be a manageable size for field audit personnel. Due to the presence of alleys and laneways in some neighbourhoods and the shapes of some neighbourhoods, not all sample areas were square configurations. 13
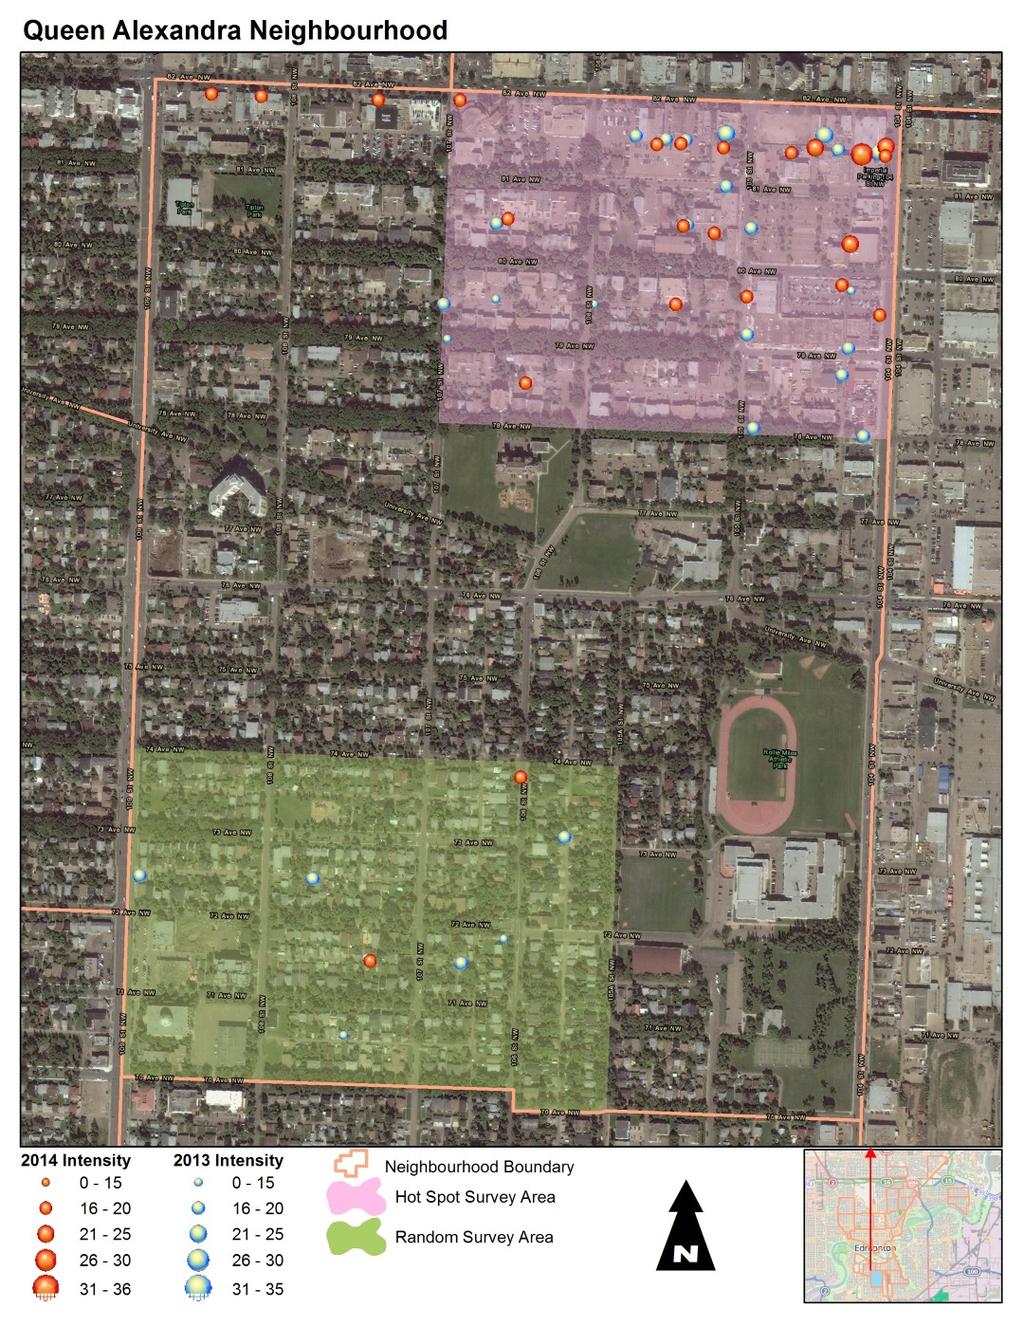
15 Appendix A provides an overview map of the 20 neighbourhoods and the graffiti audit areas examined within those neighbourhoods. Appendix B provides a sample of maps of graffiti observation locations in three of the original 20 neighbourhoods examined during the 2014 audit, and compared graffiti intensity to 2013 results. 14
16 Results of the Edmonton Audit During the 2014 graffiti audit, the audit crew observed graffiti vandalism at 352 locations compared to 395 locations in 2013 and 438 locations in The audit found an 11% decrease between the number of locations found in 2014 compared to those in At these locations, 1,071 tags were observed compared to 1,413 tags documented in 2013, showing a decrease of 24% compared to In the same neighbourhoods in 2012 there were 1,116 tags, 1,133 in 2011 and 1,978 in Figure 3 Locations & Tag Count Summary % decrease in tags in 2014 compared to TAGS LOCATIONS % reduction in locations since
17 Neighbourhood Graffiti Index & Rankings A graffiti index was determined for each overall neighbourhood examined and for each individual hot spot and random sample area. Table 7 presents the graffiti index for each sample area. Table 2 Neighbourhood Graffiti Index Results 2014 Graffiti in Hot Spot 2014 Area Hot (Ha) Index Hot Spot 2014 Index Hot Spot 2013 Index Hot Spot 2012 Index Hot Spot 2011 Index Hot Spot 2010 Graffiti in Random 2014 Area Random (Ha) Index Random 2014 Index Random 2013 Index Random 2012 Index Random 2011 Index Random 2010 Alberta Ave Beacon Heights Belvedere Beverly Heights Boyle Street Central McDougall CPR West/Strathcona Junction Downtown Eastwood Garneau Inglewood Killarney McCauley Oliver Parkdale Queen Alexandra Queen Mary Park Ritchie Strathcona Westmount Total 764 Average Average Comparison - Original 20 neighbourhoods The graffiti index is a way of examining the observations of graffiti in an indexed numerical comparison. Above in Table 7, we present the graffiti indexes for the "hot spot" and the "random areas." In Table 8, on the next page, the combined graffiti index for each neighbourhood is presented. For the hot spot areas within each neighbourhood, the average graffiti index was slightly higher in 2014 at compared to in However, for the random sample areas the average graffiti index dropped significantly from in 2013 to 0.46 in 2014, indicating significantly less graffiti activity in these sample areas during the current year. 16
18 Table 3 Combined Neighbourhood Graffiti Index Results 2014 Total Graffiti in Neigh Total Area 2014 Combined Index 2013 Combined Index 2012 Combined index 2011 Combined Index 2010 Combined Index Ha Alberta Ave Beacon Heights Belvedere Beverly Heights Boyle Street Central McDougall CPR West/Strathcona Junction Downtown Eastwood Garneau Inglewood Killarney McCauley Oliver Parkdale Queen Alexandra Queen Mary Park Ritchie Strathcona Westmount 1, Total 1,071 1, Average Comparison - Original 20 neighbourhoods In examining Table 7 and Table 8 it is clear where the decreases in graffiti vandalism were observed in the 2014 audit. Significant reductions were noted in the Downtown neighbourhood, as well as reductions in 2014 in the Strathcona and Garneau neighbourhoods. This is significant as these three neighbourhoods have historically been the largest contributors to graffiti vandalism in the city. Two neighbourhoods also of note are Ritchie and the Boyle Street neighbourhood where the graffiti index increased in 2014 reversing a previous downward trends in graffiti observed since When the graffiti index results for both the hot spots and the random sample areas are combined for all 20 neighbourhoods, the average combined graffiti index dropped from in 2013 to the current audit index of This indicates a 25% decrease in the combined graffiti index in 2014 compared to 2013, matching observations of 24% fewer tags observed in the current audit and confirming that the graffiti index method works well to compare graffiti data. 17
19 Figure 4 Combined Graffiti Index Results - by Neighbourhood Combined Graffiti Index
20 Table 4 Graffiti Occurrence by Neighbourhood Sampled Neighbourhood Graffiti Locations Observed % of total observed Neighbourhood Locations Graffiti Observed % of total observed Neighbourhood Graffiti % of total Observed observed Downtown % Downtown % Downtown % Strathcona % Strathcona % Stratchcona % Boyle Street % Garneau % Garneau % Queen Alexandra % Queen Alexandra % Central McDougall % Ritchie % 58% Eastwood % 62% Queen Mary Park % Garneau % Boyle Street % Boyle Street % CPR/Strathcona Junction % McCauley % Westmount % Belvedere % CPR/Strathcona Junction % Alberta Ave % Queen Mary % Belvedere % McCauley % McCauley % Parkdale % Eastwood % Alberta Avenue % Oliver % Killarney % Eastwood % Central McDougall % Belvedere % Westmount % Alberta Avenue % Ritchie % Killarney % Killarney % Oliver % Central McDougall % Queen Mary % Inglewood % Beverly Heights % Westmount % Parkdale % Oliver % Ritchie % CPR West/ Strathcona Junction % Parkdale % Beacon Heights % Queen Alexandra % Inglewood % Inglewood % Beverly Heights 7 0.6% Beacon Heights % Beverly Heights % Beacon Heights 5 0.4% 0.0% 352 1, % 395 1, % Tags in 20 neighbourhoods 1, % Change since % -24% In 2014, the Downtown and the Strathcona neighbourhoods once again exhibited the most intensely tagged areas audited. This has been a consistent finding in all the graffiti audits conducted in Edmonton. Boyle Street was a significant source of graffiti in 2014, re-entering the list of top five most tagged neighbourhoods. The Queen Alexandra neighbourhood remained in the top five most tagged neighbourhoods once again in the current audit. The Ritchie neighbourhood exhibited a 359% increase in observed graffiti compared to 2013 and entered the top five neighbourhoods tagged in The last time Ritchie was found in the top five most tagged neighbourhoods was These significant observations are: Downtown; graffiti decreased from 325 tags in 2013 to 225 in 2014, a 31% decrease. Strathcona; graffiti decreased from 203 tags in 2013 to 135 in 2014, a 33% decrease. Boyle Street; graffiti increased from 72 tags in 2013 to 99 in 2014, a 38% increase. Queen Alexandra; graffiti decreased from 120 tags in 2013 to 79 in 2014, a 34% decrease. Ritchie; graffiti increased from 17 tags in 2013 to 78 in 2014, a 359% increase. Beverly Heights; graffiti increase from 17 in 2013 to 78 in 2014, a 400% increase Garneau; graffiti decreased from 120 tags in 2013 to 72 in 2014, a 40% decrease. 19
21 Table 5 Comparison of Graffiti 2014 vs Neighbourhoods Neighbourhood Graffiti Tags 2014 Change from 2013 Graffiti Tags 2013 Beverly Heights % 2 Ritchie % 17 Queen Mary 47 96% 24 Westmount 27 42% 19 Boyle Street 99 38% 72 CPR/Strathcona Junction 66 10% 60 Killarney 26 0% 26 Alberta Avenue 33-15% 39 Belvedere 47-16% 56 Inglewood 7-30% 10 McCauley 43-31% 62 Downtown % 325 Strathcona % 203 Queen Alexandra 79-34% 120 Garneau 72-40% 120 Central McDougall 23-47% 43 Eastwood 33-69% 106 Oliver 10-78% 45 Parkdale 9-82% 51 Beacon Heights 2-85% 13 1,071-24% 1,413 In Table 10, above, we note changes in observed graffiti activity. As mentioned earlier, graffiti in the Ritchie neighbourhood, increased significantly from the current audit to the previous year, an increase of 359%. Perhaps more notable were those neighbourhoods where graffiti activities decreased. Graffiti vandalism in the Downtown and Strathcona neighbourhoods were observed to have decreased by over 30% in 2014 compared to 2013 (-31% and -33% respectively), while the Garneau area saw a 40% decrease in observed tags in the current audit. The Eastwood neighbourhood had 69% fewer tags and the Oliver area was observed to have 78% fewer tags in in 2014 compared to the previous year. In each of the graffiti vandalism audits unidentifiable (unknown) taggers are the largest single tagger group identified. When identifiable tags are examined, a relatively small number of individual taggers account for a significant amount of the graffiti in Edmonton. In 2014, 271 tags (25.3%) were unidentifiable (unknown) taggers, with 74.7% of tags being observed with readable tag names. 20


22 The number of taggers in the current audit was 400, compared to 424 taggers in 2013, 305 in 2012 and 379 in Figure 5 Seven Most Active Neighbourhoods Seven Neighbourhoods Equal 70% of Tags Garneau 7% CPR/Strathcona Junction 6% Ritchie 7% Downtown 21% Queen Alexandra 7% Boyle Street 9% Strathcona 13% Seven Neighbourhoods Account for 71% of Graffiti Eastwood 7% Boyle 5% McCauley 4% Downtown 23% Queen Alexandra 8% Garneau 8% Strathcona 14% 21
. A relatively small number of large graffiti pieces (2%) were observed during the 2014 audit.")
23 Size & Descriptor of Graffiti In the 2014 audit the proportion of small tags increased to 83% compared to the 2013 audit where small tags represented 73%. Medium sized tags stayed proportionally similar in 2014 (11% compared to 13% in 2013). A relatively small number of large graffiti pieces (2%) were observed during the 2014 audit. Table 6 Graffiti Observed in 2014 is Mainly Small Imperial Metric Count % of Total Count % of Total Small (>1sq.ft < 2 sq. ft.) >0.9 sq.m. <0.185 sq.m % 1,036 73% Med (>2sq.ft. <9 sq.ft.) >0.185 sq.m<0.836 sq.m % % x-small (<1 sq.ft.) <.009 sq. M 35 3% 119 8% Large (>9 sq.ft.<20 sq.ft.) >0.836 sq.m < sq.m 22 2% 63 4% x-large (> 20 sq.ft) > sq.m 3 0.3% 5 0% 1, % 1, % Figure 6 Sizes of Graffiti Observed 2014 Graffiti Size Analysis x-small (<.009 sq. M) 3% Medium (>0.185 sq.m<0.836 sq.m) 11% Large (>0.836 sq.m < sq.m) 2% x-large (> sq.m) 0.3% Small (>0.9 sq.m. <0.185 sq.m) 83% 22
24 In regards to the artistic nature of graffiti vandalism observed throughout the 2014 audit, it was repeatedly observed that graffiti appeared to be scrawled quickly onto property, in a stylized design as free hand text and not completed with artistic merit. Of the 1,071 observations made in 2014 fully 93.9% was text only, which is consistent with the observation made in Table 7 Summary of Graffiti Vandalism Observed in 2014 Descriptor of Graffiti Observed Count % of Total Text only (1.) 1, % 93.0% Picture % 2.8% Stencil (2.) 7 0.7% 1.6% Splash/Slash (3.) 3 0.3% 1.3% Vulgar Text % 1.2% Vulgar Picture 1 0.1% 0.1% Political 0 0.0% 0.0% Hate motif 1 0.1% 0.0% Racist 0 0.0% 0.0% 1, % 100% 1. Text only refers to no drawing, piece is stylized design or text only 2. Stencils are made with cut-outs & medium 3. Splash/ Slash is an undefined graffiti piece, or paint thrown onto property 23

25 The consultant found that over 90% of all graffiti is what is termed as marker or plain in nature, as compared to outline bubble-type graffiti or artistic drawings, a trend that has been observed in previous graffiti audits in Edmonton. Marker or plain graffiti tagging is textual in nature rather than being a picture or a drawing. Table 8 Graffiti Categories Graffiti Category Marker / Plain Graffiti % 93.3% Artistic Tag % 4.0% Outline Bubble Tag - No Fill % 1.0% Outline Bubble Tag - One Color 9 0.8% 1.0% Outline Bubble Tag - Two Colors 7 0.7% 0.5% Outline Bubble - Multiple Colors 2 0.2% 0.2% Etching 1 0.1% 0.0% % 100.0% Figure 7 Observed Graffiti is Not Artistic Less Than 5% of Tags are Artistic Outline Bubble Tag - No Fill 2% Artistic Tag 4% Outline Bubble Tag - One Color Outline Bubble Tag 1% - Two Colors 1% Marker / Plain Graffiti 92% 24
26 Target Properties & Categories The audit team determined whether each item of graffiti was placed on City, non-municipal government or private property. In 2014, the same proportion of graffiti was observed on private property as was noted in Both audits show 84% of graffiti vandalism tags on private property. Graffiti on City assets increased from 9% (124 tags in 2013), to 12% (129 tags in 2014). The number of tags on government (Provincial and Federal) property continued to follow a decreasing trend first noted in 2013, moving from 7% of total tags (104 tags) in 2013, to just 4% of total graffiti tags (43 tags) in The consultants noted that, in the past, the majority of tags on government property were mainly on Canada Post (grey) boxes. A large number of these boxes have now been phased out of service, by this agency and removed from city streets. This is likely the main contributing factor for the continued decreasing trend in the number of tags on government property noted over the past two years. The proportion of graffiti tags on private waste management bins increased in 2014, from 21% (295 tags) in 2013, to 27% (289 tags) in City disposal and recycling bins were observed to have fewer tags than private waste bins. Figure 8 Graffiti Tags by Property Ownership Eighty-Four Percent Graffiti is on Private Property City assets 12% Government assets 4% Private property 84% 25
27 Table 9 Graffiti Targets & Category Results # of Observations Property Owner City of Edmonton 129 Waste Mangement Branch % Transportation Dept Proportion of all graffiti % Public Works 8 5 Proportion of all graffiti % Other Street assets 7 4 Proportion of all graffiti % ETS Proportion of all graffiti % Parks 2 13 Other Sub-total # of Observations Property Owner Other Government Property 47 Canada Post % Gov't building 3 Proportion of all graffiti % Hospital 2 Proportion of all graffiti % Schools 9 4 Proportion of all graffiti % Proportion of all graffiti % Sub-total # of Observations Property Owner 2013 Private Property % Commercial - Parking barricades Proportion % - other commercial items 5 5 Proportion % - Disposl bin, small 2 Proportion % - Doors 5 15 Proportion % - Equipment 0 - Fence 5 - Lights 0 - Garage doors 4 - Poles / posts/ parking Signs Utility boxes Ventilation Walls Sea Can / Storage Windows 3 - Community League Vehicles/ Rolling Stock 6 Church - Barricades/Other Walls 1 - Doors 0 26
28 Private Property # of Observations Property Owner EPCOR - Poles & Light Standards Utility box Other EPCOR asset 5 1 TELUS - Pole 0 - Utility box Booth & Other Asset 13 7 Shaw - Utility box 1 Multi Family Dwelling - Barricades Balcony/ or Other Door Fence 1 - Garage - Garage Door - Post / Pole 3 - Shed/ Garbage container Signs Ventilation 2 - Walls Window Newspaper - Boxes Private Waste Company-BFI (waste) Private Waste Comp.-BFI (recycle) 0 Private Waste Company-WMI Private Waste Company-TriLine Private Waste - Super Save Private Waste Company-310 Dump 5 4 Private Waste Company-Think Pink 3 11 Private Waste - Derrick 1 Private Waste - A & A 1 Private Waste - Other 6 Residence - Barricades - Door - Fence Garage walls Garage door Garbage enclosure Sheds/ Storage Cntr Walls 1 - Other 1 Retail - Barricades Door Fence Garage Door Garbage enclosure/shed Gas meter 1 - Other Parking lot 0 - Post / Pole Signs Storage can Vehicles /Rolling Stock Ventilation Walls Windows 13 Graffiti (20 original neighbourhoods) 1,071 1,413 27
29 Location Intensity Rating (LIR) Location Intensity Rating (LIR) is calculated as a method to indicate the relative intensity of a location within a neighbourhood. The LIR differs from the graffiti index in that the graffiti index measures the intensity of the amount of graffiti in the entire neighbourhood or hot/random area. The LIR measures the intensity of the graffiti observed at each individual location. It also includes factors other than just the amount of graffiti. The factors that form the LIR are described below. The consultant added the LIR to the observations obtained in the 2011 to 2014 graffiti vandalism audits. The LIR is a rating based on observations of each location where these features make the graffiti more or less noticeable to both trained and untrained observers. It is based upon: Size Score 1 for extra small, score 5 for extra large Colour Score 1 for low colour, score 5 for vibrant colour Complexity Score 1 marker plain text, score 5 for Outline Bubble multiple colours Artistic Score 1 not drawn / splash / slash, score 5 artistic execution Visibility Score 1 barely noticeable, score 5 could not miss it Longevity Score 1 old, faded, nearly not visible, score 5 recent, not removed Access Score 1 easy access, no likelihood of being caught, score 5 dangerous location Surface Score 1 bad surface, does not take paint easily, score 5 ideal graffiti surface Reoccurrence Score 1 none apparent, score 5 heavy reoccurrence The maximum LIR possible at any location is a score of 45 (9 factors x 5 points = 45) 28
30 The consultant was requested to conduct a standard deviation analysis on the collected graffiti data. Standard deviation measures how widely values in a set of data are dispersed from the average (mean) value of the data set. Standard deviation was calculated for the 2014 LIR data which yields The average (mean) LIR was calculated as Using standard statistical analysis principles, 68% of the LIR ratings fall within 1 standard deviation of the average LIR, which is a range from LIR ratings of 15 to 22, a finding similar to that found in Statistical analysis theory also determines that 95% of LIR ratings are therefore between 2 standard deviations, or between LIRs of 11 and 25. In Table 18 below, this analysis shows that the average Location Intensity Rating is slightly lower in 2014, at compared to in 2013, but significantly lower than 2012 which averaged It also reveals median intensity rating (middle of the data) has remained at 17 for the past two years compared to 21 in 2012, and 20 in Table 10 Location Intensity Rating Analysis ( ) 2014 Std Deviation Analysis Average of all LIR (mean) 68% of all LIR fall within 1 ST DEV Std deviation to 21.7 Median 17 95% within 2 ST DEV 11.4 to Std Deviation Analysis Average of all LIR (mean) 68% of all LIR fall within 1 ST DEV of 18.3 Std deviation to 21.5 Median 17 95% within 2 ST DEV 11.8 to Std Deviation Analysis Average of all LIR (mean) 68% of all LIR fall within 1 ST DEV of 18.3 Std deviation to 23.9 Median 21 95% within 2 ST DEV 15.9 to Std Deviation Analysis Average of all LIR (mean) 68% of all LIR fall within 1 ST DEV of 18.3 Std deviation to 22.6 Median 20 95% within 2 ST DEV 14.9 to
31 Table 11 Location Intensity Index Top 50 Sites The top 50 Location Intensity Ratings listed below: Neighbourhood Name Latitude Longitude Intensity Score Street Num Street Name 1 Strathcona N W Ave 2 Strathcona N W Ave 3 Boyle Street N W Jasper Ave 4 CPR West / Strathcona Junction N W St 5 Queen Alexandra N W Ave 6 Alberta Avenue N W Ave 7 CPR West / Strathcona Junction N W Ave 8 Ritchie N W Ave 9 Strathcona N W St 10 Downtown N W Jasper 11 Downtown N W St 12 Belvedere N W St 13 Strathcona N W Ave 14 CPR West / Strathcona Junction N W St 15 Ritchie N W Ave 16 Ritchie N W Ave 17 Strathcona N W Ave 18 Garneau N W St 19 Killarney N W St 20 CPR West / Strathcona Junction N W Ave 21 Strathcona N W Ave 22 Strathcona N W Ave 23 Downtown N W St 24 Eastwood N W Ave 25 Eastwood N W Ave 26 Queen Alexandra N W Ave104 St 27 CPR West / Strathcona Junction N W Ave 28 Boyle Street N W St 29 Central McDougall N W St 30 Queen Mary Park N W St 31 Alberta Avenue N W Ave 32 Alberta Avenue N W Ave 33 Eastwood N W Ave 34 Eastwood N W Strathcona N W Ave 36 Downtown N W Downtown N W Jasper Ave 38 Oliver N W St 39 Downtown N W Boyle Street N W St 41 Westmount N W St 42 Belvedere N W Queen Alexandra N W St 44 Ritchie N W Ave 45 Ritchie N W Ave 46 Boyle Street N W Ave 47 Downtown N W St 48 Queen Mary Park N W St 49 Westmount N W St 50 Eastwood N W Ave 30
32 Conclusions The City of Edmonton s graffiti vandalism audit is an unbiased method of sampling graffiti vandalism in the City. Re-auditing the same neighbourhoods enables the City to document changes in the amount of graffiti observed in those areas. During the 2014 graffiti audit, the audit crew observed graffiti at 352 locations where graffiti vandalism was present, a reduction from 395 in 2013 and 438 locations in In these locations, 1,071 graffiti tags were observed, a 24% decrease from 1,413 graffiti tags in 2013 and 1,116 in The 2014 audit observed 11% fewer locations observed with graffiti, within the 20 original neighbourhoods examined than in Downtown neighbourhood graffiti decreased from 325 tags in 2013 to 225 in 2014, a 31% decrease. There was also a decrease in the Strathcona neighbourhood where graffiti tags decreased from 203 tags in 2013 to 135 in 2014, a 33% decrease. Tags in Garneau also diminished from 120 tags in 2013 to 72 in 2014, a 40% decrease. In 2013 the largest contributors of tags came from those three neighbourhoods, which combined represented 46% of all graffiti observed. The largest contributors of tags observed during the 2014 audit were from the Downtown, Strathcona and Boyle Street neighbourhoods, a result of the decrease in graffiti found in Garneau and an increase in the Boyle Street neighbourhood. Graffiti observed in these three neighbourhoods accounts for 42.8% of the total tags found in the 2014 audit with Downtown, Strathcona and Boyle Street representing 21%, 12.6% and 9.2% respectively. The greatest increase in observed graffiti tags occurred in Beverly Heights (400% increase from 2 tags to 10); Ritchie with a 359% increase (from 17 to 78 tags) and in Queen Mary neighbourhood with a 96% increase (from 24 to 47 tags). During the 2014 audit, the audit team traveled over 560 kilometres within Edmonton s 20 sample neighbourhoods, on streets, in alleys and in laneways recording graffiti observations. During the course of this audit over 1,200 photographs were taken recording the graffiti observed. A comprehensive database was created to archive and analyse the data collected. Paper records, electronic data records and digital photographic records were filed to preserve the data collected. The consultant calculated a Location Intensity Rating (LIR) to examine the amount and intensity of graffiti at each of the 352 locations observed in For comparison purposes these intensities (LIR) of graffiti are plotted on neighbourhood maps in Appendix B showing graffiti locations and LIRs for 2014 and Consistent with observing fewer graffiti tags in 2014, was the behavior of the graffiti index in 2014 compared to previous years. The graffiti index is a measure of the amount of graffiti observed per geographic area (Hectares). This index decreased from a combined index of in 2013 to in
33 During the 2014 field work, auditors were accompanied by a City of Edmonton Municipal Enforcement Officer from the Complaints and Investigations Section of the Community Standards Branch. The identification of taggers has been enhanced by having these staff participate in the audit due to their ability to read tagger names. During the 2014 audit the number of taggers observed was 400, compared to 424 taggers 2013, and 305 graffiti taggers Most graffiti tags are small in size covering less than sq.m (2 sq.ft.). In the current audit there were proportionately more small tags in 2014 than in 2013; at 83% small tags in the current year compared to 73 % of the graffiti observed as small tags in A similar proportion of medium sized tags (>2sq.ft. <9 sq.ft.) were seen in 2014 (11% in 2014 and 13% in 2013). 92% of graffiti observed in 2014 was marker / plain graffiti (93% in 2013). This predominate style of graffiti found during the audit is textual or stylized in nature, and is in no way artistic in its design. Commercial waste bins, parking lot barricades, signs and posts continue to be common targets for taggers. Private residential and multi-family residential properties are often targets of graffiti vandals, especially fences and garages in back alleys and laneways. In the 2014 audit the consultant observed that murals, throughout the City, were not generally defaced by graffiti tags. This reinforces previous observations that graffiti vandals appear to avoid tagging murals. 32

34 APPENDIX A Overview Audit Sample Locations 33

35 APPENDIX B - Graffiti Observation Locations (Examples) 34
36 35

37 36
City of Edmonton Graffiti Vandalism Audit (2017)
") City of Edmonton Graffiti Vandalism Audit (2017) Prepared by: MGM Management April 6, 2018 FINAL REPORT Table of Contents Acknowledgements 2 Executive Summary 3 Table ES-1 Summary 4 Figure ES1 - Locations
City of Edmonton Graffiti Vandalism Audit (2017) Prepared by: MGM Management April 6, 2018 FINAL REPORT Table of Contents Acknowledgements 2 Executive Summary 3 Table ES-1 Summary 4 Figure ES1 - Locations
2006 Residential Property Taxes and Utility Charges Survey
 2006 Residential Property Taxes and Utility Charges Survey Prepared by: Jong Huang Chief Economist January 2007 TABLE OF CONTENTS Acknowledgements Introduction... 1 Summary... 2 Part 1: Major Canadian
2009 Muskoka Airport Economic Impact Study
 2009 Muskoka Airport Economic Impact Study November 4, 2009 Prepared by The District of Muskoka Planning and Economic Development Department BACKGROUND The Muskoka Airport is situated at the north end
Date to Committee: January 13, 2014 Date to Council: January 27, 2014
 Page 1 of Report PB-01-14 TO: FROM: Development and Infrastructure Committee Planning and Building SUBJECT: Update on Graffiti Prevention and Abatement Report Number: PB-01-14 Wards Affected: All File
2014 VACo Achievement Awards
 Application Form All applications must include the following information. Separate applications must be submitted for each eligible program. Deadline: June 2, 2014. Program Information Locality Program
Heritage Character Area Zoning - Edmonton s Approach to Preserving(?) Community Character
 Community Character") Heritage Character Area Zoning - Edmonton s Approach to Preserving(?) Community Character Federation of Calgary Communities Community Planning Exchange November 4, 2017 City of Edmonton CITY
Heritage Character Area Zoning - Edmonton s Approach to Preserving(?) Community Character Federation of Calgary Communities Community Planning Exchange November 4, 2017 City of Edmonton CITY
Massey Hall. 178 Victoria St, Toronto, ON M5B 1T7. CAP Index, Inc. REPORT CONTENTS. About CAP Index, Inc. 3-Mile Methodology. 3 Tract Map.
 REPORT CONTENTS 178 Victoria St, Toronto, ON M5B 1T7 About 3-Mile Methodology 2 Summary 3 Tract Map 4 Contour Map 5 Scores 6-Mile Methodology 6 Summary. 7 Tract Map 8 Contour Map 9 Scores 10 Proximity
RAY YENKANA Willowbrook Cr, Dawson Creek BC Canada $2,847,000
 1716 Willowbrook Cr, Dawson Creek BC Canada For SALE $2,847,000 This is a rare find, 32 townhomes in Dawson Creek, BC. Excellent investment in a single title multi family complex. Vendor has upgraded this
Photopoint Monitoring in the Adirondack Alpine Zone
 Photopoint Monitoring in the Adirondack Alpine Zone Julia Goren (PI) and Seth Jones Adirondack High Peaks Summit Steward Program Adirondack Mountain Club summit@adk.org PO Box 867, Lake Placid, NY 12946
2017 Asheville and Buncombe County Real Estate Market Analysis
 2017 Asheville and Buncombe County Real Estate Market Analysis Summary This report examines the Asheville and Buncombe County residential real estate market for 2017 and compares the current real estate
BUSINESS BAROMETER December 2018
 Credit: Chris Orange BUSINESS BAROMETER December Credit: Nigel Moore 1 Contents Summary of findings 3 Annual monthly performance: visitor attractions..4 Visit Herts Team update 5 National context.8 Visitor
With the first portion of this process complete, we anticipate the general timeline for the remainder of the process to be:
 THE CITY OF FIRE RESCUE E D M O N T O N FIRE RESCUE SERVICES 10351 96 Street Edmonton, Alberta T5H 2H5 April 19, 2013 Dear Rossdale residents: As many of you know, Fire Rescue Services is currently in
Good Neighbour Guide A guide to being a good neighbour in Peachland
 District of Peachland Good Neighbour Guide A guide to being a good neighbour in Peachland 1 Introduction to the Guide Good neighbours make great neighbourhoods. We each play a role in enhancing our neighbourhoods
Appendix B Ultimate Airport Capacity and Delay Simulation Modeling Analysis
 Appendix B ULTIMATE AIRPORT CAPACITY & DELAY SIMULATION MODELING ANALYSIS B TABLE OF CONTENTS EXHIBITS TABLES B.1 Introduction... 1 B.2 Simulation Modeling Assumption and Methodology... 4 B.2.1 Runway
This report was prepared by the Lake Zurich Police Department Traffic Safety Division. Intersection location and RLR camera approaches identified:
 POLICE DEPARTMENT 200 Mohawk Trail Lake Zurich, Illinois 60047 (847) 719-1690 LakeZurich.org April 1, 2018 This report is being submitted regarding the red-light cameras. According to the Red Light Running
IATOS 2003 Outdoor Enthusiast Survey CTC Market Research March, 2003
 IATOS 2003 Outdoor Enthusiast Survey CTC Market Research March, 2003 The IATOS Expo (International Adventure Travel and Outdoor Sports Show, Chicago, February 2003) provided the CTC s Outdoor Product Development
POST-IMPLEMENTATION COMMUNITY IMPACT REVIEW
 POST-IMPLEMENTATION COMMUNITY IMPACT REVIEW RNAV STAR updates and RNP AR approaches at Edmonton International Airport NAV CANADA 77 Metcalfe Street Ottawa, Ontario K1P 5L6 January 2018 The information
Tourism in Alberta. A Summary of 2011 Visitor Numbers and Characteristics. June 2013
 Tourism in Alberta 2011 A Summary of 2011 Visitor Numbers and Characteristics June 2013 Due to methodological changes to the 2011 Travel Survey of Residents of Canada, there is a historical break in the
Cooper-Hewitt, National Design Museum Visitors Summer 2008 Summary of Findings
 Introduction Cooper-Hewitt, National Design Museum Visitors Summer 2008 Summary of Findings Office of Policy & Analysis Smithsonian Institution July 2008 In June 2008, the Office of Policy and Analysis
HOW TO IMPROVE HIGH-FREQUENCY BUS SERVICE RELIABILITY THROUGH SCHEDULING
 HOW TO IMPROVE HIGH-FREQUENCY BUS SERVICE RELIABILITY THROUGH SCHEDULING Ms. Grace Fattouche Abstract This paper outlines a scheduling process for improving high-frequency bus service reliability based
MEDIUM SIZE STADIUM STRATEGY
 MEDIUM SIZE STADIUM STRATEGY Approved by City Council on March 12, 2014 This plan is available online at www.edmonton.ca I. Executive Summary... 4 II. Medium Size Stadium Strategy... 5 1. Background...
Unruly and Disruptive Passengers
 Unruly and Disruptive Passengers Almost 4billion passengers will travel safely by air in 2017. In the course of the next 24hours over 100,000 flights will take place. The vast majority of these pass without
Predicting Flight Delays Using Data Mining Techniques
 Todd Keech CSC 600 Project Report Background Predicting Flight Delays Using Data Mining Techniques According to the FAA, air carriers operating in the US in 2012 carried 837.2 million passengers and the
FINAL REPORT OF THE USOAP CMA AUDIT OF THE CIVIL AVIATION SYSTEM OF THE KINGDOM OF NORWAY
 ICAO UNIVERSAL SAFETY OVERSIGHT AUDIT PROGRAMME (USOAP) Continuous Monitoring Approach (CMA) FINAL REPORT OF THE USOAP CMA AUDIT OF THE CIVIL AVIATION SYSTEM OF THE KINGDOM OF NORWAY (16 to 20 November
HEATHROW COMMUNITY NOISE FORUM. Sunninghill flight path analysis report February 2016
 HEATHROW COMMUNITY NOISE FORUM Sunninghill flight path analysis report February 2016 1 Contents 1. Executive summary 2. Introduction 3. Evolution of traffic from 2005 to 2015 4. Easterly departures 5.
HEATHROW COMMUNITY NOISE FORUM
 HEATHROW COMMUNITY NOISE FORUM 3Villages flight path analysis report January 216 1 Contents 1. Executive summary 2. Introduction 3. Evolution of traffic from 25 to 215 4. Easterly departures 5. Westerly
I I EXECUTIVE SUMMARY. A. Introduction
 EXECUTIVE SUMMARY EXECUTIVE SUMMARY A. Introduction I I 1 The Pinellas County Metropolitan Planning Organization (MPO) is planning extensions for the Pinellas Trail, a pedestrian and bicycle facility that
City of Surrey PLANNING & DEVELOPMENT REPORT File:
 City of Surrey PLANNING & DEVELOPMENT REPORT File: 7917-0297-00 Planning Report Date: September 11, 2017 PROPOSAL: Amend CD By-law No. 18795 (based on RH-G). to allow for an increased house size on thirteen
Bloor Street West Rezoning Application for a Temporary Use By-law Final Report
 STAFF REPORT ACTION REQUIRED 3741 3751 Bloor Street West Rezoning Application for a Temporary Use By-law Final Report Date: June 12, 2007 To: From: Wards: Reference Number: Etobicoke York Community Council
Economic Impact of Tourism in Hillsborough County September 2016
 Economic Impact of Tourism in Hillsborough County - 2015 September 2016 Key findings for 2015 Almost 22 million people visited Hillsborough County in 2015. Visits to Hillsborough County increased 4.5%
POST-IMPLEMENTATION COMMUNITY IMPACT REVIEW
 POST-IMPLEMENTATION COMMUNITY IMPACT REVIEW RNAV STAR updates and RNP AR approaches at Halifax Stanfield International Airport NAV CANADA 77 Metcalfe Street Ottawa, Ontario K1P 5L6 November 2017 The information
Clear Alley Program (CAP) IDA Application
 IDA Application") IDA Application Transforming Seattle s Downtown Environment Pre-CAP Implementation Post-CAP Implementation Program Public Policy Objectives Cleaner, safer business districts and communities Reducing the
IDA Application Transforming Seattle s Downtown Environment Pre-CAP Implementation Post-CAP Implementation Program Public Policy Objectives Cleaner, safer business districts and communities Reducing the
Tourism in Alberta. A Summary Of Visitor Numbers, Revenue & Characteristics Research Resolutions & Consulting Ltd.
 Tourism in Alberta A Summary Of Visitor Numbers, Revenue & Characteristics 2001 Alberta North Canadian Rockies Edmonton & Area Alberta Central Calgary & Area Policy & Economic Analysis Alberta South March
Quantitative Analysis of the Adapted Physical Education Employment Market in Higher Education
 Quantitative Analysis of the Adapted Physical Education Employment Market in Higher Education by Jiabei Zhang, Western Michigan University Abstract The purpose of this study was to analyze the employment
CITY OF HAMILTON PUBLIC WORKS DEPARTMENT Roads & Traffic Division and HEALTHY AND SAFE COMMUNITIES DEPARTMENT Recreation Division
 TO: COMMITTEE DATE: May 3, 2018 SUBJECT/REPORT NO: WARD(S) AFFECTED: Ward 5 CITY OF HAMILTON PUBLIC WORKS DEPARTMENT Roads & Traffic Division and HEALTHY AND SAFE COMMUNITIES DEPARTMENT Recreation Division
FIXED-SITE AMUSEMENT RIDE INJURY SURVEY, 2013 UPDATE. Prepared for International Association of Amusement Parks and Attractions Alexandria, VA
 FIXED-SITE AMUSEMENT RIDE INJURY SURVEY, 2013 UPDATE Prepared for International Association of Amusement Parks and Attractions Alexandria, VA by National Safety Council Research and Statistical Services
COMMUNITY BASED TOURISM DEVELOPMENT (A Case Study of Sikkim)
") COMMUNITY BASED TOURISM DEVELOPMENT (A Case Study of Sikkim) SUMMARY BY RINZING LAMA UNDER THE SUPERVISION OF PROFESSOR MANJULA CHAUDHARY DEPARTMENT OF TOURISM AND HOTEL MANAGEMENT KURUKSHETRA UNIVERSITY,
COMMUNITY BASED TOURISM DEVELOPMENT (A Case Study of Sikkim) SUMMARY BY RINZING LAMA UNDER THE SUPERVISION OF PROFESSOR MANJULA CHAUDHARY DEPARTMENT OF TOURISM AND HOTEL MANAGEMENT KURUKSHETRA UNIVERSITY,
Cuadrilla Elswick Ltd
 Cuadrilla Elswick Ltd Tewmporary Shale Gas Exploration Description Roseacre Wood, Lancashire Planning Inspectorate Reference APP/Q2371/W/15/3134385 Local Authority Reference: LCC/2014/0101 CE 1/3 Summary
ETS Park & Ride Report Spring 2017
 Sustainable Development City Planning 8th Floor, Edmonton Tower 10111-104 Avenue NW Edmonton, AB T5J 0J4 Tel.: 780.496.6086 Email: varjinder.chane@edmonton,ca by Monitoring & Geospatial Services May, 2017
Making Barrow a Graffiti Free Zone
 Title: Making Barrow a Graffiti Free Zone Category: Crime Reduction Force: Cumbria Constabulary Chief Officer: Richard Crompton ACC Contact: PC 159 John Irving Cumbria Constabulary, Market Street, Barrow-in-Furness
Official Journal of the European Union L 7/3
 12.1.2010 Official Journal of the European Union L 7/3 COMMISSION REGULATION (EU) No 18/2010 of 8 January 2010 amending Regulation (EC) No 300/2008 of the European Parliament and of the Council as far
LATENCY OF TOURISM PERMITS IN THE GREAT BARRIER REEF MARINE PARK AUDIT FOR THE YEAR 2000
 LATENCY OF TOURISM PERMITS IN THE GREAT BARRIER REEF MARINE PARK AUDIT FOR THE YEAR 2 Tourism and Recreation Group December 2 DISCLAIMER The information provided in this Audit is for information and discussion
1 st and 2 nd Quarters 2018 Asheville and Buncombe County Real Estate Market Analysis
 1 st and 2 nd Quarters 2018 Asheville and Buncombe County Real Estate Market Analysis Summary The housing market in Asheville and Buncombe County had fewer home sales in the 2 nd quarter of 2018 compared
Changing Lanes. Click to edit Master title style. Community Consultation Meeting #1. Second level Third level. Fourth level.
 Changing Lanes The Click City of to Toronto edit Master Review text of styles Laneway Suites Community Consultation Meeting #1 November 30, 2017 Agenda 6:30 Introductions Councillor Ana Bailão (Ward 18)
Criteria Based System for MPRB Regional Park and Trail Capital Project Scheduling
 Criteria Based System for MPRB Regional Park and Trail Capital Project Scheduling July 19, 2017 Background Beginning with the 2017-2022 Capital Improvement Program (CIP), MPRB used equity-driven metrics
PREFACE. Service frequency; Hours of service; Service coverage; Passenger loading; Reliability, and Transit vs. auto travel time.
 PREFACE The Florida Department of Transportation (FDOT) has embarked upon a statewide evaluation of transit system performance. The outcome of this evaluation is a benchmark of transit performance that
ETS Park & Ride Report Summer 2017
 Urban Form And Corporate Strategic Development City Planning 8th Floor, Edmonton Tower 10111-104 Avenue NW Edmonton, AB T5J 0J4 Tel.: 780.496.6086 Email: varjinder.chane@edmonton,ca ETS Park & Ride Report
Nova Southeastern University Joint-Use Library Agreement: Review of Public Usage
 Exhibit 1 Nova Southeastern University Joint-Use Library Agreement: Robert Melton, CPA, CIA, CFE, CIG County Auditor Audit Conducted by: Gerard Boucaud, CISA, Audit Manager Dirk Hansen, CPA, Audit Supervisor
1.0 BACKGROUND NEW VETERANS CHARTER EVALUATION OBJECTIVES STUDY APPROACH EVALUATION LIMITATIONS... 7
 New Veterans Charter Evaluation Plan TABLE CONTENTS Page 1.0 BACKGROUND... 1 2.0 NEW VETERANS CHARTER EVALUATION OBJECTIVES... 2 3.0 STUDY APPROACH... 3 4.0 EVALUATION LIMITATIONS... 7 5.0 FUTURE PROJECTS...
ERA Monthly Market Analysis
 ERA Monthly Market Analysis May 2016 Introduction For the production of these statistics in the following report, ERA has teamed up with partners Seabury and Innovata to provide a comprehensive analysis
Tourism in Alberta. A Summary of 2012 Visitor Numbers and Characteristics. June 2014
 Tourism in Alberta 2012 A Summary of 2012 Visitor Numbers and Characteristics June 2014 Introduction Whether to see their friends and relatives, for business, or for pleasure, 33.1 million total visits
Section II. Planning & Public Process Planning for the Baker/Carver Regional Trail began in 2010 as a City of Minnetrista initiative.
 Section II Planning & Public Process Planning for the began in 2010 as a City of initiative. city staff began discussions with the Park District on the possibility of a north/south regional trail connection
Tourism in Alberta. A Summary Of Visitor Numbers, Revenue & Characteristics 2004
 Tourism in Alberta A Summary Of Visitor Numbers, Revenue & Characteristics 2004 Alberta North Based on the 2004 Canadian & International Travel Surveys (Statistics Canada) Canadian Rockies Edmonton & Area
COMMUNITY APPEARANCE INDEX (Formerly: Litter Index) CITY OF ATLANTA 2014
 CITY OF ATLANTA 2014") COMMUNITY APPEARANCE INDEX (Formerly: Litter Index) CITY OF ATLANTA 2014 Keep Atlanta Beautiful has completed its ninth Litter Index and fourth Community Appearance Index, an expansion of the Litter Index,
COMMUNITY APPEARANCE INDEX (Formerly: Litter Index) CITY OF ATLANTA 2014 Keep Atlanta Beautiful has completed its ninth Litter Index and fourth Community Appearance Index, an expansion of the Litter Index,
WildSafeBC Annual Report 2015 Pacific Rim. Prepared by: John Platenius Pacific Rim Community Coordinator October 29 th, 2015
 WildSafeBC Annual Report 2015 Pacific Rim Prepared by: John Platenius Pacific Rim Community Coordinator October 29 th, 2015 Executive Summary The WildSafeBC program is managed by the British Columbia Conservation
Proof of Concept Study for a National Database of Air Passenger Survey Data
 NATIONAL CENTER OF EXCELLENCE FOR AVIATION OPERATIONS RESEARCH University of California at Berkeley Development of a National Database of Air Passenger Survey Data Research Report Proof of Concept Study
The performance of Scotland s high growth companies
 The performance of Scotland s high growth companies Viktoria Bachtler Fraser of Allander Institute Abstract The process of establishing and growing a strong business base is an important hallmark of any
ARRIVAL CHARACTERISTICS OF PASSENGERS INTENDING TO USE PUBLIC TRANSPORT
 ARRIVAL CHARACTERISTICS OF PASSENGERS INTENDING TO USE PUBLIC TRANSPORT Tiffany Lester, Darren Walton Opus International Consultants, Central Laboratories, Lower Hutt, New Zealand ABSTRACT A public transport
Air Operator Certification
 Civil Aviation Rules Part 119, Amendment 15 Docket 8/CAR/1 Contents Rule objective... 4 Extent of consultation Safety Management project... 4 Summary of submissions... 5 Extent of consultation Maintenance
Chapter 1 Introduction and Project Overview
 EPHRATA MUNICIPAL AIRPORT Chapter 1 Introduction and Project Overview The Port of Ephrata in cooperation with the Federal Aviation Administration (FAA) is updating the Airport Master Plan for Ephrata Municipal
The explanations of other terms used throughout the tables are contained in the section on Definitions immediately following the tables.
 FOREWORD 1 CONTENT 1.1 UK Airports - Annual Statements of Movements, Passengers and Cargo is prepared by the Civil Aviation Authority with the co-operation of the United Kingdom airport operators. The
OFFICIAL. Date 27 November 2018 Rutherglen Town Hall, Rutherglen
 Agenda Item 18 Meeting Date Location Rutherglen Town Hall, Rutherglen Title of Paper Reference B 10.2018/89 Presented By DCC Fiona Taylor, Police Scotland Recommendation to Members For Discussion Appendix
TRAIL MAPPING AND MARKING POLICY SANTA FE TRAIL ASSOCIATION Adopted by the Santa Fe Trail Association Board of Directors, April 13, 2002
 TRAIL MAPPING AND MARKING POLICY SANTA FE TRAIL ASSOCIATION Adopted by the Santa Fe Trail Association Board of Directors, April 13, 2002 INTRODUCTION There are three principle aspects to the marking of
Chair and Members, The Etobicoke York Community Council. Mark Sraga, Director and Deputy Chief Building Official
 STAFF REPORT ACTION REQUIRED Sign Variance Report - Revised 29 Algie Avenue Date: January 11, 2010 To: From: Chair and Members, The Etobicoke York Community Council Mark Sraga, Director and Deputy Chief
Figure 1.1 St. John s Location. 2.0 Overview/Structure
 St. John s Region 1.0 Introduction Newfoundland and Labrador s most dominant service centre, St. John s (population = 100,645) is also the province s capital and largest community (Government of Newfoundland
Interim Growth Management Policies City of Brampton Council
 Interim Growth Management Policies City of Brampton Council October 24, 2007 Agenda City of Brampton 2006 Official Plan Brampton s Growth Management Initiatives Provincial Growth Plan Brampton s Growth
Northeast Stoney Trail In Calgary, Alberta
 aci Acoustical Consultants Inc. 5031 210 Street Edmonton, Alberta, Canada T6M 0A8 Phone: (780) 414-6373, Fax: (780) 414-6376 www.aciacoustical.com Environmental Noise Computer Modelling For Northeast Stoney
Context Briefing 3 Changes over time in the provision of amenities and facilities
 Context Briefing 3 Changes over time in the provision of amenities and facilities Anne Ellaway Scott Macdonald Laura Macdonald Natalie Nicholls March 2014 GoWell is a collaborative partnership between
Grade Crossing Regulations
 Grade Crossing Regulations An Overview of Municipal Roles and Responsibilities at Federally Legislated Grade Crossings March 21, 2017 presentation to Alberta Municipal Supervisor Association, Edmonton,
A. CONCLUSIONS OF THE FGEIS
 Chapter 11: Traffic and Parking A. CONCLUSIONS OF THE FGEIS The FGEIS found that the Approved Plan will generate a substantial volume of vehicular and pedestrian activity, including an estimated 1,300
Overview of Crowsnest Conservation Society`s Bear-Resistant Garbage Bin Program February 2015
 Overview of Crowsnest Conservation Society`s Bear-Resistant Garbage Bin Program February 2015 Prepared by: Elizabeth Anderson Crowsnest Conservation BearSmart Coordinator p : (403) 563-0058 e: e.anderson@telus.net
Table of Contents TABLE OF CONTENTS. HOW THIS BY-LAW WORKS... i PART 1 - ADMINISTRATION, INTERPRETATION, ENFORCEMENT, AND DEFINITIONS
 TABLE OF CONTENTS Page Number HOW THIS BY-LAW WORKS... i PART 1 - ADMINISTRATION, INTERPRETATION, ENFORCEMENT, AND DEFINITIONS 1.1 ADMINISTRATION, INTERPRETATION AND ENFORCEMENT... 1.1 ~ 1 to 6 1.1.1 Within
Saighton Camp, Chester. Technical Note: Impact of Boughton Heath S278 Works upon the operation of the Local Highway Network
 Technical Note: Impact of Boughton Heath S278 Works July 2013 SAIGHTON CAMP CHESTER COMMERCIAL ESTATES GROUP TECHNICAL NOTE: IMPACT OF BOUGHTON HEATH S278 WORKS UPON THE OPERATION OF THE LOCAL HIGHWAY
Estimates of the Economic Importance of Tourism
 Estimates of the Economic Importance of Tourism 2008-2013 Coverage: UK Date: 03 December 2014 Geographical Area: UK Theme: People and Places Theme: Economy Theme: Travel and Transport Key Points This article
CHAPTER ONE LITERATURE REVIEW
 CHAPTER ONE LITERATURE REVIEW LITERATURE REVIEW This chapter summarizes the most recently published community impact studies and articles that relate to multiuse trails. The review focuses on publications
RESEARCH AND PLANNING FORT STEELE HERITAGE TOWN VISITOR STUDY 2007 RESULTS. May 2008
 RESEARCH AND PLANNING FORT STEELE HERITAGE TOWN VISITOR STUDY 2007 RESULTS May 2008 Research and Planning Tourism British Columbia 300-1803 Douglas St. Box 9830 Stn. Prov. Gov t. Victoria, BC V8W 9W5 Web:
CAMPER CHARACTERISTICS DIFFER AT PUBLIC AND COMMERCIAL CAMPGROUNDS IN NEW ENGLAND
 CAMPER CHARACTERISTICS DIFFER AT PUBLIC AND COMMERCIAL CAMPGROUNDS IN NEW ENGLAND Ahact. Early findings from a 5-year panel survey of New England campers' changing leisure habits are reported. A significant
The Next Phase: A Five-year Strategy for Aboriginal Cultural Tourism in British Columbia DRAFT
 The Next Phase: 2012-2017 A Five-year Strategy for Aboriginal Cultural Tourism in British Columbia DRAFT Contents Message from the Chief Executive Officer 3 Executive Summary 5 Recognized as a World Leader
2012 In-Market Research Report. Kootenay Rockies
 2012 In-Market Research Report Kootenay Rockies Executive Summary This report summarizes key highlights for the Kootenay Rockies (KR) region taken from the British Columbia In-Market study conducted in
STAFF REPORT FOR ACTION
 Insert TTC logo here STAFF REPORT FOR ACTION Hillcrest Complex Property Study Date: November 30, 2016 To: From: TTC Board Chief Executive Officer Summary This report outlines a plan for staff to proceed
Short Term Monitoring Program NSW, Carlingford Report. February 2013
 NSW, Carlingford Report February 2013 Version Control Version Number Date Detail 1.0 February 2013 Initial Release. 2.0 May 2013 Updated formatting for table 2. 3.0 January 2014 Figure 5 and L90 values
The forecasts evaluated in this appendix are prepared for based aircraft, general aviation, military and overall activity.
 Chapter 3: Forecast Introduction Forecasting provides an airport with a general idea of the magnitude of growth, as well as fluctuations in activity anticipated, over a 20-year forecast period. Forecasting
West End Safety Trial
 West End Safety Trial W E S T Image: Adelaide City Council Welcome Today s Agenda and Purpose Introductory Survey Welcome and Introduction Housekeeping and Purpose of the session WEST Pilot Overview and
Domestic Tourism in Calgary and Area Tourism Region 2016
 Domestic Tourism in Calgary and Area Tourism A Summary of 2016 Domestic Visitor Numbers, Expenditures and Characteristics July 2018 Tourism.alberta.ca July 2018 Introduction Whether it was to see friends
communication tower means a tower or structure built to support equipment used to transmit communication signals;
 Ontario Ministry of Natural Resources Subject Communication Tower Sites on Crown Land Compiled by - Branch Lands & Waters Section Land Management Policy PL 4.10.02 Replaces Directive Title Communication
Canberra Airport Aircraft Noise Information Report
 Canberra Airport Aircraft Noise Information Report Quarter 4 2015 (October to December) 1 Version Control Version Number Detail Prepared by Date 1 - Environment March 2016 Airservices Australia. All rights
March 4, Mr. H. Dale Hemmerdinger Chairman Metropolitan Transportation Authority 347 Madison Avenue New York, NY Re: Report 2007-F-31
 THOMAS P. DiNAPOLI STATE COMPTROLLER 110 STATE STREET ALBANY, NEW YORK 12236 STATE OF NEW YORK OFFICE OF THE STATE COMPTROLLER March 4, 2008 Mr. H. Dale Hemmerdinger Chairman Metropolitan Transportation
Bugging Around: An Overview of the Kruger Malaise Program
 Bugging Around: An Overview of the Kruger Malaise Program R. D. Rattray1, M. D Souza2, M. van der Bank1 and P. D. N. Hebert2 1 The African Centre for DNA Barcoding, Department of Botany & Plant Biotechnology,
EAST 34 th STREET HELIPORT. Report 2007-N-7
 Thomas P. DiNapoli COMPTROLLER OFFICE OF THE NEW YORK STATE COMPTROLLER DIVISION OF STATE GOVERNMENT ACCOUNTABILITY Audit Objectives... 2 Audit Results - Summary... 2 Background... 3 Audit Findings and
RESEARCH INDUSTRIAL SNAPSHOT
 RESEARCH INDUSTRIAL SNAPSHOT GREATER LONDON AND WESTERN HOME COUNTIES H2 2017 GREATER LONDON & WESTERN HOME COUNTIES LOGISTICS & INDUSTRIAL RESEARCH Introduction As the UK economy continues to grow so
Parkland County Municipal Development Plan Amendment Acheson Industrial Area Structure Plan
 Parkland County Municipal Development Plan Amendment Acheson Industrial Area Structure Plan New Plan Acheson Industrial Area Structure Plan Amendment Parkland County Municipal Development Plan Board Reference
Application Decision. White Rock South Surrey Taxi Ltd th Avenue, Surrey BC V3S 6C4
 Application Decision Application: Applicant: Trade Names: Address: Principals: Special Authorization: Summary: Related Applications: (for cross reference only) AV2639-05 White Rock South Surrey Taxi Ltd.
Spadina Avenue Built Form Study Preliminary Report
 STAFF REPORT ACTION REQUIRED Spadina Avenue Built Form Study Preliminary Report Date: July 9, 2014 To: From: Wards: Reference Number: Toronto and East York Community Council Director, Community Planning,
Decision (Applicant claims urgent public need )
") Decision (Applicant claims urgent public need ) Page 1 Application: Applicant: Address: 93-09 UPN Royal City Taxi Ltd. 436 Rousseau St, New Westminster BC V3L 3R3 Principals: GHUMAN, Parambir DHLLON, Chamkaur
Decision (Applicant claims urgent public need ) Page 1 Application: Applicant: Address: 93-09 UPN Royal City Taxi Ltd. 436 Rousseau St, New Westminster BC V3L 3R3 Principals: GHUMAN, Parambir DHLLON, Chamkaur
T:\John Hempson\Health Check\2007\Health Check 2007.Doc
 T:\John Hempson\Health Check\2007\Health Check 2007.Doc Contents Background 3 Key Findings 4 Performance... 4 Environment... 5 Performance Indicators 6 Outlets... 6 Floorspace... 8 Vacant Outlets... 10
Network of International Business Schools
 Network of International Business Schools WORLDWIDE CASE COMPETITION Sample Case Analysis #1 Qualification Round submission from the 2015 NIBS Worldwide Case Competition, Ottawa, Canada Case: Ethiopian
HOUSEHOLD TRAVEL SURVEY
 HOUSEHOLD TRAVEL SURVEY Household Travel Survey i TABLE OF CONTENTS Page 1.0 INTRODUCTION... 1 2.0 SUMMARY OF TRAVEL... 2 2.1 All-Day Travel Patterns... 2 2.1.1 Automobile Availability... 2 2.1.2 Trip
Current Rules Part 175 Aeronautical Information Service Organisations - Certification Pending Rules
 Subpart B Certification Requirements 175.51 Personnel Requirements (a) Each applicant for the grant of an aeronautical information service certificate shall engage, employ or contract: (1) a senior person
Tourism in Calgary and Area Tourism Region A Summary of 2014 Visitor Numbers, Expenditures and Characteristics July 2016
 Tourism in Calgary and Area Tourism Region 2014 A Summary of 2014 Visitor Numbers, Expenditures and Characteristics July 2016 Tourism.alberta.ca July 2016 Introduction Whether to see their friends and
Oak Ridges Moraine: Southern Ontario's Sponge
 Oak Ridges Moraine: Southern Ontario's Sponge Lesson Overview Students will examine the location and the importance of the Oak Ridges Moraine and investigate ongoing conflicts concerning its development.