Northwest Timberlands
|
|
|
- Regina Ford
- 5 years ago
- Views:
Transcription
1 Seral Stage and Patch Size Distribution Analyses for the North Coast Timber Supply Area March 3, 2008 Funded by: Investment Account (through Timber Ltd.) Project # Investment Schedule COTSA2669 Contract Admin #: Patch/Seral Prepared by: Rick Brouwer, RPF Ltd. Limited 03 Kenney Street Terrace, BC Canada V8G 3E6 Tel: Fax: Web:
2 Acknowledgements Thanks to Shannon Pearce at Timber for her patience with this project. Wendy Rolston and Jim Knox of Magellan Digital Mapping were very adaptable as the dataset was developed, and were extremely easy to work with. Thanks also to representatives of local licencees for their interest in this project, for their co-operative and collaborative approach, and for providing block data, thereby making this project applicable and useable. ii
3 Executive Summary An analysis of the forest cover information was conducted to determine the seral and patch distributions for Landscape s within the North Coast Timber Supply Area. This analysis was carried out at two points in time: at the end of 2006, and then at the end of 20, after aging the forest cover and including projected harvesting. There are instances where seral stage imbalances exist on a proportional basis for licensees who have s that do not fully overlap with Landscape s. These cases should be reviewed to address the imbalances and ensure that they do not affect other licensees. Information is provided on mid-seral and old seral constraints for Site Series Surrogates as defined in the Central and North Coast Order. In addition, analyses to support the implementation of objectives for important fisheries watersheds and for upland streams are also provided, identifying areas that should be reviewed in more depth. One of 30 important fisheries watersheds is identified for further analysis. Eight of 700 upland watershed areas are identified as requiring further examination. Patch size distribution results for the North Coast TSA are provided. This information should limit conflicts between licencees when proceeding with block development, and will inform both licencee and Ministry of s and Range staff when considering the potential for cumulative impacts on the forest landbase. Information is also provided for the seral stage and patch size distribution results for licencee s within Landscape s, and tables are provided for licencees to review their specific situations. iii
4 (this page intentionally left blank) iv
5 Table of Contents Executive Summary... iii Introduction Methodology Results and Discussion Seral Stage Consolidated seral stage information (All Landscape s, all licensees) Seral Stage information for Licencee s that overlap with Landscape s Ecosystem-Based Management (Central and North Coast Order) Important Fisheries Watersheds Upland Streams Critical Grizzly Bear Habitat Patch Size Overall patch size distribution results (all Landscape s, all licensees) Consolidated patch size distribution information (all Landscape s, all licensees) Patch Size Distribution information for Licencee s that overlap with Landscape s Conclusions...86 Sources of Information:...87 Appendix A: Process algorithm for Seral stage and Patch size distribution analysis (North Coast District)...A Appendix B: Patch Size and Seral Stage Procedure...A9 Appendix C: Seral Stage Tables by Licencee...A3 Appendix E: Patch Size Distribution Tables by Licencee...A43 Appendix F: A guide for using the Seral Stage and Patch Size Distribution Analysie for the North Coast Timber Supply Area (March 2008)...A53 v
6 (this page intentionally left blank) vi
7 Introduction This project is a roll-up and update of information that was prepared in support of implementation of the Central and North Coast Order (CNCO), and for measurement of cumulative forest impacts within the North Coast District. The project involves updating the age, attribute, activity, and opening fields in a forest cover data set to make it current to December 3, 2006, and then carrying out patch and seral stage distribution analysis by landscape unit and forest development unit. This data is then trended forward for a five year period, and projected harvesting is added in. This analysis will allow licensees to evaluate their situation in achieving the targets for Landscape s (LU) in accordance with the CNCO. No licensee is obligated to roll this information up across the District this would be something that the Ministry of s and Range (MoFR) or the Integrated Land Management Bureau (ILMB) of the Ministry of Agriculture and Lands might do. The benefit of rolling the information up across the District is that all parties in the District end up with a similar data set and a reproducible process for ongoing monitoring and evaluation of the LU targets. This will also be of benefit to MoFR and ILMB for monitoring purposes. Seral stage data is separated into four age ranges: early, mid-seral, mature, and old. These seral stages have slightly different age parameters, depending on the biogeoclimatic variant and Natural Disturbance Type (NDT) that an area falls within. The target distribution amounts for the mid and old seral stages within each LU are based on the CNCO. Patch size distribution is evaluated against three patch size ranges: small (less than 40 ha), mid-sized (40 to 80 ha), and large (80-0 ha). Patches are groupings of similarly aged openings that are adjacent to another. Adjacent is defined as contiguous, or separated by less than 200 m of forest of a different seral stage, or by natural non-forested features less than 75 m wide. The targets for patch size distribution are the same for NDTs and 2 in the North Coast District. There is no NCT 3 or NDT 4 within the North Coast District. NDT 5 is alpine forest and will not be impacted by forest operations, so it is not included in this report. The data is also used to measure consistency with Objectives identified in the CNCO for Important Fisheries Watersheds and for Upland s. 7
8 2 Methodology In general, the steps required to carry out this project are Review and clean base data set Update data with information from licensees, ILMB, and MoFR to a common time frame Perform Seral stage analysis Perform Patch Size Distribution analysis Summarize results in tabular format The base data set used for this project is a combination of data for the North Coast District, starting with the Vegetation Resource Inventory data downloaded from the Land and Resource Data Warehouse, and augmented and updated with information from the timber supply review dataset prepared by the Defined Area Management group for the North Coast, as well as a further refinement of the same TSR dataset provided by the BC Ministry of s and Range. Review, cleaning, and updating of the data set was performed by Magellan Digital Mapping, and involved the acquisition of information from affected licensees and BC Timber Sales. This information included data on logging history, proposed harvest units for the period for all licensees, and (FDU) boundaries where they were available. FDU boundaries were provided by licensees: BC Timber Sales, Coast Tsimshian Resources Limited Partnership, Metlakatla Corporation, Sonora Logging Ltd, and Timber Ltd. Seral analyses included overlapping licensee FDU boundaries with Landscape s (LU), and determining the areas of mid and old seral stages in both BEC variants and Natural Disturbance Types that fall within the FDUs in a Landscape. The seral data was also used to compare watershed-level information with targets set out in the CNCO for Important Fisheries Watersheds and for Upland areas within :,000 forest atlas watersheds. Patch analyses included calculating the area of patches that fall within similar groupings, by both FDU and LU. Tables are produced to summarise the areas by both Landscape and by FDU for both the Seral and the Patch analyses. A detailed algorithm process is provided in Appendices A and B. 8
9 3 Results and Discussion The primary products from this project are tables that summarise the distribution of seral stages and patch sizes for Landscape s, and for watersheds identified in the Central and North Coast Order (CNCO). In addition, patch and seral information is provided regarding the portions of FDUs that fall with the LUs. This will allow licensees and the MoFR to monitor and evaluate whether CNCO targets are being achieved, or whether progress is being made towards achieving the targets. 3. Seral Stage The following tables provide information on the distribution of seral stages across landscape units. Landscape s are red-flagged as not achieving the seral stage targets. 3.. Consolidated seral stage information (All Landscape s, all licensees) The following tables provide data for three seral stage groupings (early, mature plus old, and old) by biogeoclimatic (BGC) variant within a Landscape. A variance is calculated between the targeted seral stage limit, and the actual seral stage distribution.a red flag is identified where the variance is within 00 ha of the target or the BGC variant and NDT type within a Landscape. When the target threshold has been exceeded (early) or is in deficit (mature + old, old), negative numbers are denoted (in red with parentheses). A blank cell means that there is no red flag for this BEC variant.this data is presented at two stages (end of 2006, and end of 20). To determine if the trend is in the right direction, specific red flag variants can be compared between 2006 and 20. When comparing the 2006 with the 20 data, there will be a few instances when a BEC variant is in one table and not the other. This is due to there being no area in that variant at that time. For example, if there were no early forests in an area in 2006, but there was logging projected for the period , then the variant will show up in the 20 table. 9
10 Table : All LUs, -Seral situation as of Dec 3, 2006 Table : All LUs, -Seral situation as of Dec 3, 2006 Landscape - - (AU) Actual Target (<%) Anyox - CWH wm - AU (44.2) (.3) Anyox - CWH wm Anyox - CWH wm - 0 (5) (9.4) Anyox - CWH wm (2.6) (53.7) Anyox - CWH wm Anyox - MH mm Anyox - MH mm (.2) (479.7) Aristazabal Aristazabal Banks - - AU (.7) (3.0) Belle Bay - CWH wm - AU Belle Bay - CWH wm Belle Bay - CWH wm Belle Bay - MH mm Belle Bay - MH wh CWH vm CWH vm CWH vm AU (5.6) (7.4) MH mm MH mm AU3 0 (5) (.9) (5.8) (2.6) (3.5) (5.4) - CWH vm - AU CWH vm - AU3.7 (9.7) (2.7) - CWH vm - AU4.5 (9.5) (9.3) - CWH vm CWH vm CWH vm CWH vm CWH vm AU MH mm MH mm MH mm AU3 0 (5) (2.) - CWH vm - AU CWH vm - AU3 0 (5) (.4) - CWH vm CWH vm CWH vm CWH vm MH mm MH mm MH wh MH wh AU3 90. (40.) (2.3) MH wh MH wh
11 Table : All LUs, -Seral situation as of Dec 3, 2006 Landscape - - (AU) Actual Target (<%) - CWH vm MH mm Chapple - - AU (49.3) (.3) Chapple Chapple (20.7) (3.9) Chapple Chapple - MH wh Chapple - MH wh Dundas - - AU Dundas (5) (.6) Gil - - AU3 96. (46.) (43.9) Gil Gil Gil - MH wh - AU (49.9) () Gil - MH wh AU AU (4.6) (3.4) MH wh (.4) (0.) - MH wh MH wh - 0 (0) (3.9) - MH wh MH wh AU AU (5.) (8.) MH wh MH wh (36.4) (6.) - MH wh MH wh MH wh Helmcken - - AU (4.3) (.7) Helmcken Helmcken Helmcken - MH wh AU MH wh MH wh Johnston - CWH vm - AU Johnston - CWH vm - AU Johnston - CWH vm - AU3.4 (0.4) (.4) Johnston - CWH vm Johnston - CWH vm Johnston - CWH vm Johnston - - AU Johnston
12 Table : All LUs, -Seral situation as of Dec 3, 2006 Landscape - - (AU) Actual Target (<%) Johnston Johnston - MH mm AU AU (.4) (35.3) MH wh - AU (49.9) () - MH wh CWH vm - AU CWH vm - AU (34.7) (49.2) - CWH vm CWH vm (5) (.3) - MH mm Khutzeymateen Park - CWH vm - AU Khutzeymateen Park - CWH vm - AU (3.2) (.4) Khutzeymateen Park - CWH vm Khutzeymateen Park - CWH vm Khutzeymateen Park Khutzeymateen Park - CWH wm - AU Khutzeymateen Park - CWH wm Khutzeymateen Park - CWH wm Khutzeymateen Park - MH mm - AU 0 (0) (2.9) Khutzeymateen Park - MH mm Khutzeymateen Park - MH mm CWH vm - AU3.9 (0.9) (.9) - CWH vm CWH vm CWH vm CWH vm AU3 0 (5) (3.2) MH mm Kitkiata - CWH vm Kitkiata - MH mm CWH wm -.0 (8.0) (0.6) - CWH ws - AU CWH ws CWH ws CWH ws CWH ws 2 - AU3 0 (5) (0.7) - CWH ws CWH ws MH mm MH mm Klekane - CWH vm - AU3 0 (5) (.) Klekane - CWH vm Klekane - CWH vm Klekane Klekane Klekane - MH mm -.5 (9.5) (9.) Kshwan - CWH wm - AU Kshwan - CWH wm Kshwan - MH mm AU AU
13 Table : All LUs, -Seral situation as of Dec 3, 2006 Landscape - - (AU) Actual Target (<%) MH mm MH wh CWH vm - AU CWH vm MH mm Laredo - - AU3 57. (7.) (.4) Laredo Laredo Laredo Laredo Laredo - MH wh Laredo - MH wh Laredo - MH wh Marmot - CWH wm - AU (3.7) (2.7) Marmot - CWH wm Marmot - CWH wm Marmot - MH mm Marmot - MH mm McCauley - - AU3 0 (5) (2.2) Monckton - - AU3.9 (8.9) (8.4) Monckton Monckton - MH wh Observatory East - CWH wm Observatory East - MH mm Observatory West - - AU Observatory West Observatory West - CWH wm - AU2 0 (5) (3.6) Observatory West - CWH wm - AU Observatory West - CWH wm Observatory West - CWH wm Observatory West - CWH wm Observatory West - MH mm (48.8) (5.4) Observatory West - MH mm Observatory West - MH wh Olh - CWH wm - AU Olh - CWH wm Olh - CWH wm Olh - CWH wm Olh - CWH wm Olh - MH mm - AU2 0 (5) (5.) Olh - MH mm Olh - MH mm (0.5) (200.6) - - AU MH wh MH wh Pearse - - AU3.8 (8.8) (2.) Pearse AU MH wh MH wh MH wh AU3 90. (40.) (33.9) 3
14 Table : All LUs, -Seral situation as of Dec 3, 2006 Landscape - - (AU) Actual Target (<%) CWH vm - AU CWH vm - AU CWH vm - AU CWH vm CWH vm CWH vm AU (5.8) (0.4) MH mm MH mm MH mm MH wh AU (27.4) (26.3) MH wh MH wh CWH vm - AU CWH vm CWH vm CWH vm AU3 0 (5) (0.4) MH mm MH mm Skeena Islands - CWH vm - AU Skeena Islands - CWH vm - AU.4 (0.4) (0.4) Skeena Islands - CWH vm - AU Skeena Islands - CWH vm Skeena Islands - MH mm CWH vm - AU CWH vm - AU CWH vm - AU (37.7) (39.9) - CWH vm (2.0) (27.7) - CWH vm CWH vm AU AU (.) (9.4) MH mm - AU (06.9) () - MH mm - AU 0 (0) (2.0) - MH mm - AU MH mm MH mm - 0 (5) (0.4) - MH mm MH mm MH wh (22.3) (7.0) - MH wh Sparkling - CWH vm - AU Sparkling - CWH vm - AU (7.6) (32.9) 4
15 Table : All LUs, -Seral situation as of Dec 3, 2006 Landscape - - (AU) Actual Target (<%) Sparkling - CWH vm Sparkling - CWH vm Sparkling - CWH vm Sparkling - MH mm Sparkling - MH mm Stagoo - CWH wm - AU Stagoo - CWH wm Stagoo - CWH wm Stagoo - CWH ws - AU3 0 (5) () Stagoo - MH mm - AU Stagoo - MH mm Stagoo - MH mm Stagoo - MH mm AU (24.0) (4.3) - - AU (46.2) (72.7) CWH vm - AU3 0 (5) (9.8) - CWH vm CWH vm CWH vm CWH vm MH mm MH mm -.7 (8.7) (.8) - MH mm MH wh - AU3 0 (5) (.9) - MH wh MH wh MH wh Tolmie - - AU4 0 (5) (2.4) - CWH vm - AU3 55. (5.) (3.5) - CWH vm - AU4 0 (5) (6.2) - CWH vm CWH vm CWH vm CWH vm CWH vm AU MH mm - 0 (5) (.0) - MH mm MH mm (49.6) () - MH mm (6.6) (6.0) - MH mm AU AU MH wh - AU (49.9) () - MH wh MH wh
16 Table : All LUs, -Seral situation as of Dec 3, 2006 Landscape - - (AU) Actual Target (<%) - - AU CWH vm - AU CWH vm AU AU (5) () MH mm - 0 (5) (3.5) - MH mm MH wh - AU2 6.8 (.8) (.) - MH wh MH wh AU (36.6) (37.2) (5) (4.0) CWH vm - AU (8.3) (8.0) - CWH vm - AU (42.9) (86.6) - CWH vm - AU4 0 (5) (5.3) - CWH vm CWH vm CWH vm CWH vm AU3 0 (5) (23.9) MH mm - AU3 0 (5) (4.6) - MH mm MH mm MH wh MH wh
17 Table 2: All LUs, -Seral situation as of Dec 3, 20 Table 2: All LUs, -Seral situation as of Dec 3, 20 Landscape - - (AU) Actual Target (<%) Anyox - CWH wm - AU (44.2) (.3) Anyox - CWH wm Anyox - CWH wm (5.0) (6.) Anyox - CWH wm Anyox - MH mm Anyox - MH mm (.2) (479.7) Aristazabal Aristazabal Banks - - AU (.4) (3.0) Belle Bay - CWH wm - AU3 0 (5) (0.7) Belle Bay - CWH wm Belle Bay - CWH wm Belle Bay - MH mm Belle Bay - MH wh CWH vm - AU (4.7) (0.) - CWH vm - AU (35.4) (4.8) - CWH vm CWH vm CWH vm CWH vm AU (5.6) (7.4) MH mm MH mm AU3 0 (5) (.9) (5.8) (2.6) (3.5) (5.4) - CWH vm - AU CWH vm - AU3.5 (9.5) (2.6) - CWH vm - AU CWH vm CWH vm CWH vm CWH vm CWH vm MH mm MH mm MH mm AU3 0 (5) (2.) CWH vm - AU CWH vm - AU3 0 (5) (.4) - CWH vm CWH vm CWH vm CWH vm MH mm MH mm MH wh MH wh AU (39.6) (2.2)
18 Table 2: All LUs, -Seral situation as of Dec 3, 20 Landscape - - (AU) Actual Target (<%) - MH wh MH wh CWH vm MH mm Chapple - - AU Chapple (20.7) (3.9) Chapple Chapple - MH wh Chapple - MH wh Dundas - - AU Dundas (5) (.6) Gil - - AU (32.6) (3.0) Gil Gil Gil - MH wh - AU (49.9) () Gil - MH wh AU AU (4.6) (3.4) MH wh (.4) (0.) - MH wh MH wh - 0 (0) (3.9) - MH wh MH wh AU AU (5.) (8.) MH wh MH wh (36.9) (6.2) - MH wh MH wh MH wh MH wh Helmcken - - AU (4.3) (.7) Helmcken Helmcken Helmcken - MH wh AU MH wh MH wh Johnston - CWH vm - AU Johnston - CWH vm - AU Johnston - CWH vm - AU Johnston - CWH vm Johnston - CWH vm Johnston - CWH vm
19 Table 2: All LUs, -Seral situation as of Dec 3, 20 Landscape - - (AU) Actual Target (<%) Johnston - - AU Johnston Johnston Johnston - MH mm AU AU (32.2) (7.8) MH wh - AU (49.9) () - MH wh CWH vm - AU CWH vm - AU (37.6) (6.9) - CWH vm CWH vm (5) (.3) - MH mm Khutzeymateen Park - CWH vm - AU Khutzeymateen Park - CWH vm - AU (38.0) (32.7) Khutzeymateen Park - CWH vm Khutzeymateen Park - CWH vm Khutzeymateen Park Khutzeymateen Park - CWH wm - AU Khutzeymateen Park - CWH wm - AU (7.3) (23.7) Khutzeymateen Park - CWH wm Khutzeymateen Park - CWH wm Khutzeymateen Park - MH mm - AU 0 (0) (2.9) Khutzeymateen Park - MH mm Khutzeymateen Park - MH mm CWH vm - AU (0.4) (22.8) - CWH vm CWH vm CWH vm CWH vm AU3 0 (5) (3.2) MH mm - 0 (5) (2.3) - MH mm Kitkiata - CWH vm Kitkiata - MH mm CWH wm -.0 (8.0) (0.6) - CWH ws - AU CWH ws CWH ws CWH ws CWH ws 2 - AU3 0 (5) (0.7) - CWH ws CWH ws MH mm 2 - AU MH mm MH mm Klekane - CWH vm Klekane - CWH vm Klekane Klekane Klekane - MH mm -.5 (9.5) (9.) Kshwan - CWH wm - AU Kshwan - CWH wm Kshwan - MH mm
20 Table 2: All LUs, -Seral situation as of Dec 3, 20 Landscape - - (AU) Actual Target (<%) - - AU AU MH mm MH wh CWH vm - AU CWH vm MH mm Laredo - - AU (4.6) (2.9) Laredo Laredo Laredo Laredo Laredo - MH wh Laredo - MH wh Laredo - MH wh Marmot - CWH wm - AU (3.7) (2.7) Marmot - CWH wm Marmot - CWH wm Marmot - MH mm Marmot - MH mm McCauley - - AU3 0 (5) (2.2) McCauley Monckton - - AU (.4) (.2) Monckton Monckton - MH wh Observatory East - CWH wm Observatory East - MH mm Observatory West - - AU Observatory West Observatory West - CWH wm - AU2 0 (5) (3.6) Observatory West - CWH wm - AU Observatory West - CWH wm Observatory West - CWH wm Observatory West - CWH wm Observatory West - MH mm (48.8) (5.4) Observatory West - MH mm Observatory West - MH wh Olh - CWH wm - AU Olh - CWH wm Olh - CWH wm Olh - CWH wm Olh - CWH wm Olh - MH mm - AU2 0 (5) (5.) Olh - MH mm Olh - MH mm (0.5) (200.6) - - AU MH wh MH wh Pearse - - AU3.8 (8.8) (2.) Pearse AU
21 Table 2: All LUs, -Seral situation as of Dec 3, 20 Landscape - - (AU) Actual Target (<%) MH wh MH wh MH wh AU3 90. (40.) (33.9) CWH vm - AU 55.5 (5.5) (7.7) - CWH vm - AU CWH vm - AU CWH vm CWH vm CWH vm AU (5.8) (0.4) - - AU4 0 (5) (.0) MH mm - AU4 0 (5) (7.4) - MH mm MH mm MH mm MH wh AU (27.4) (26.3) MH wh MH wh CWH vm - AU CWH vm CWH vm CWH vm AU3 0 (5) (0.4) MH mm MH mm Skeena Islands - CWH vm - AU Skeena Islands - CWH vm - AU.4 (0.4) (0.4) Skeena Islands - CWH vm - AU Skeena Islands - CWH vm Skeena Islands - MH mm CWH vm - AU CWH vm - AU CWH vm - AU (37.7) (39.9) - CWH vm (2.0) (27.7) - CWH vm CWH vm AU AU (.) (9.4) MH mm - AU (06.9) () - MH mm - AU 0 (0) (2.0) - MH mm - AU
22 Table 2: All LUs, -Seral situation as of Dec 3, 20 Landscape - - (AU) Actual Target (<%) - MH mm MH mm - 0 (5) (0.4) - MH mm MH mm MH wh (22.3) (7.0) - MH wh Sparkling - CWH vm - AU Sparkling - CWH vm - AU (48.2) (89.8) Sparkling - CWH vm Sparkling - CWH vm Sparkling - CWH vm Sparkling - MH mm Sparkling - MH mm Stagoo - CWH wm - AU Stagoo - CWH wm Stagoo - CWH wm Stagoo - CWH ws - AU3 0 (5) () Stagoo - MH mm - AU Stagoo - MH mm Stagoo - MH mm Stagoo - MH mm AU CWH vm - AU3 8 (3) (5.9) - CWH vm CWH vm CWH vm CWH vm MH mm MH mm -.7 (8.7) (.8) - MH mm MH wh - AU3 0 (5) (.9) - MH wh MH wh MH wh Tolmie - - AU4 0 (5) (2.4) - CWH vm - AU3 55. (5.) (3.5) - CWH vm - AU4 0 (5) (6.2) - CWH vm CWH vm CWH vm CWH vm CWH vm AU MH mm - 0 (5) (.0) - MH mm MH mm (49.6) () - MH mm (7.4) (6.7) - MH mm AU
23 Table 2: All LUs, -Seral situation as of Dec 3, 20 Landscape - - (AU) Actual Target (<%) - - AU MH wh - AU (49.9) () - MH wh MH wh AU AU CWH vm - AU3 7.7 (2.7) (6.5) - CWH vm AU AU (5) () MH mm - 0 (5) (3.5) - MH mm MH wh - AU2 6.8 (.8) (.) - MH wh MH wh AU3 5.6 (.6) (.7) (5) (4.0) CWH vm - AU (8.3) (8.0) - CWH vm - AU3 7 (2) (40.4) - CWH vm - AU4 0 (5) (5.3) - CWH vm CWH vm CWH vm CWH vm AU (49.5) (23.7) MH mm - AU3 0 (5) (4.6) - MH mm MH mm MH wh MH wh
24 Table 3: All LUs, Seral situation as of Dec 3, 2006 Table 3: All LUs, Seral situation as of Dec 3, 2006 Landscape - - (AU) Actual Target (<%) Anyox - CWH wm - AU3 0 Anyox - CWH wm - (.0) (304.5) Anyox - MH mm - (.0) () Anyox - CWH wm (22.) () Anyox - MH mm (6.4) (08.6) Anyox - MH mm Anyox - CWH wm - (.0) (.) Anyox - CWH wm (52.5) (272.2) Anyox - CWH wm - AU2 (.0) (.5) Aristazabal - - AU2.8 (27.2) (42.5) Aristazabal (5.0) (793.0) Aristazabal Aristazabal Aristazabal Aristazabal - - AU0 (.0) (2.9) Banks - - AU3 0 Banks - - (.0) (3.6) Banks - - AU Banks Banks Banks Banks Banks - MH wh Banks - MH wh Banks - MH wh - AU2 0. Belle Bay - CWH wm - AU3 0 Belle Bay - MH mm Belle Bay - CWH wm Belle Bay - CWH wm Belle Bay - MH mm Belle Bay Belle Bay Belle Bay - MH wh Belle Bay Belle Bay - MH wh Belle Bay Belle Bay - - AU Belle Bay - CWH wm (4.6) (.8) Belle Bay - CWH wm - AU Belle Bay - CWH wm - AU Belle Bay - CWH wm (5.4) (5.6) Belle Bay - CWH wm Belle Bay - CWH wm - AU Belle Bay - MH wh CWH vm - AU AU3 0 - CWH vm - AU4 (.0) (3.4) - CWH vm - AU0.4 (23.6) (79.6) (20.5) (7.7) - CWH vm (2.5) (83.6) - CWH vm - AU 7.5 (7.5) (20.8) - CWH vm CWH vm MH mm MH mm AU2 2.3 (5.7) (9.6) 24
25 Table 3: All LUs, Seral situation as of Dec 3, 2006 Landscape - - (AU) Actual Target (<%) (.8) (0.8) - CWH vm - AU CWH vm CWH vm MH mm AU4 (.0) (.6) - - AU (6.7) (3.3) - - AU MH mm - AU (3.7) () - - AU3 0 - CWH vm - AU3 0 - CWH vm - AU4 (.0) (24.5) - - (.0) (4.) - - (.0) (0.6) - CWH vm -.6 (23.4) (.7) - CWH vm - AU 8.0 (7.0) (24.) - CWH vm - AU (.5) (.9) - MH mm CWH vm CWH vm MH mm CWH vm - AU2 2.8 (5.2) (.0) MH mm CWH vm CWH vm AU AU2 (.0) (5.3) MH wh MH wh AU (.0) (42.) - - AU (.0) (3.) - - AU4 (.0) (0.6) - MH wh AU3 0 - CWH vm - AU3 0 - CWH vm - AU4 (.0) (0.6) - CWH vm - (.0) (2.) - - (.0) (.) - CWH vm CWH vm CWH vm - AU MH mm CWH vm - AU MH mm CWH vm CWH vm - AU CWH vm AU
26 Table 3: All LUs, Seral situation as of Dec 3, 2006 Landscape - - (AU) Actual Target (<%) - MH mm MH wh - (.0) (22.7) (2.8) (2.5) - MH wh MH wh AU AU (.0) (3.6) - - AU AU MH mm - AU (0.5) () - MH wh Butedale - - (.0) () Butedale - MH mm - (.0) () Butedale - - (.0) (0.) Butedale - MH mm - (.0) (0.6) Butedale - CWH vm (.2) () Butedale - - (.0) () Butedale - MH wh - (.0) (0.5) Campania - MH wh - (.0) (0.8) Campania - MH wh - (.0) (3.2) Campania - - AU2 0.6 (.4) (3000.5) Campania (3.3) (53.5) Campania Campania Campania - MH wh - AU2 (.0) (43.6) - - AU3 0 - MH wh (0.4) (2.) MH wh AU AU MH wh MH wh MH mm - AU AU3 0 - CWH vm - AU (.0) () - - (.0) (2.5) - CWH vm (4.9) (5.2) - CWH vm - AU CWH vm CWH vm - AU MH mm CWH vm MH mm AU MH mm CWH vm CWH vm - AU CWH vm MH wh (8.5) (52.0) 26
27 Table 3: All LUs, Seral situation as of Dec 3, 2006 Landscape - - (AU) Actual Target (<%) - - AU MH wh AU AU AU AU Chapple - - AU3 0 Chapple - - (.0) (4.7) Chapple - - (.0) (0.9) Chapple - - AU2.4 (27.6) (538.9) Chapple - MH wh - 9. (9.9) (00.9) Chapple - MH wh (8.3) (76.0) Chapple Chapple Chapple Chapple Chapple - - AU0 (.0) (36.2) Chapple - - AU 4.5 (44.5) (3.7) Chapple - - AU4 63 (63.0) (43.9) Chapple - MH wh - AU2 (.0) (6.8) Chapple - MH wh - (.0) (0.8) Chapple - MH wh Dundas - - (.0) (.0) Dundas - - AU Dundas Dundas Dundas Dundas - - AU (.0) (5.4) Gil - MH wh - AU3 0 Gil - - AU Gil - - AU2 3.3 (.7) (88.) Gil - MH wh (.6) (2.0) Gil - MH wh Gil Gil Gil Gil Gil - - AU Gil - MH wh - AU2 (.0) (53.6) Gil - MH wh AU (.0) (89.6) - MH wh AU MH wh AU0 5.3 (7.7) (2.8) - - AU MH wh (.4) (5.3) - MH wh (36.7) (24.7) - MH wh - AU MH wh - n/a - - AU3 0 27
28 Table 3: All LUs, Seral situation as of Dec 3, 2006 Landscape - - (AU) Actual Target (<%) (5.3) (2.9) MH mm MH mm AU MH wh MH wh AU0 5. (7.9) (2.7) - - AU MH wh - 3. (54.9) (9.2) - MH wh MH wh - AU (.0) (8.2) MH wh AU MH wh AU AU MH wh (6.2) (5.6) - MH wh - AU Helmcken - - AU3 0 Helmcken Helmcken - - AU2 9.6 (9.4) (5.2) Helmcken (0.9) (355.8) Helmcken - MH wh (0.6) (98.0) Helmcken - MH wh Helmcken Helmcken Helmcken Helmcken - - AU Helmcken - - AU Helmcken - MH wh AU (.0) (6.2) - - AU2 4. (24.9) (380.) MH wh MH wh AU AU4 63 (63.0) (7.8) - MH wh - AU2 (.0) (7.5) - MH wh MH wh Iknouk - CWH wm - 0 Iknouk - MH mm Johnston - CWH vm - AU3 0 Johnston - - AU3 0 Johnston - CWH vm - (.0) (22.3)
29 Table 3: All LUs, Seral situation as of Dec 3, 2006 Landscape - - (AU) Actual Target (<%) Johnston - - (.0) (0.6) Johnston - CWH vm - AU Johnston - MH mm Johnston - CWH vm Johnston Johnston - CWH vm Johnston Johnston - CWH vm - AU Johnston - MH mm Johnston - CWH vm (5.0) (5.) Johnston - CWH vm Johnston Johnston - MH mm Johnston - CWH vm - AU Johnston - - AU Johnston - - AU Johnston - MH mm - AU AU3 0 - MH wh - AU (.0) (66.2) - CWH vm - (.0) (.2) - - (.0) () - CWH vm MH mm CWH vm AU MH wh MH wh AU0 (.0) (47.9) - - AU 33.8 (.2) (42.5) - - AU4 63 (63.0) (4.2) - MH wh - AU (32.3) (5.6) - MH wh CWH vm - AU AU (.0) (0.6) - CWH vm - AU0 5.8 (9.2) (2.0) - CWH vm (5.6) (7.6) - CWH vm - AU MH mm CWH vm CWH vm MH mm MH mm CWH vm - AU CWH vm AU AU AU MH mm - AU (4.0) (5.4) - MH mm - AU n/a Khutzeymateen Park - CWH vm - AU3 0
30 Table 3: All LUs, Seral situation as of Dec 3, 2006 Landscape - - (AU) Actual Target (<%) Khutzeymateen Park - CWH wm - AU3 0 Khutzeymateen Park - MH mm - AU Khutzeymateen Park - CWH vm - AU Khutzeymateen Park - MH mm Khutzeymateen Park - MH mm Khutzeymateen Park - CWH vm Khutzeymateen Park Khutzeymateen Park - CWH wm Khutzeymateen Park - CWH vm Khutzeymateen Park Khutzeymateen Park - CWH wm Khutzeymateen Park - CWH vm - AU Khutzeymateen Park - CWH vm Khutzeymateen Park - - AU2 (.0) (.3) Khutzeymateen Park - CWH vm - AU Khutzeymateen Park - MH mm Khutzeymateen Park - CWH vm Khutzeymateen Park Khutzeymateen Park - CWH wm - AU Khutzeymateen Park - CWH wm - AU Khutzeymateen Park - CWH wm Khutzeymateen Park - MH mm - AU Khutzeymateen Park - CWH wm Khutzeymateen Park - CWH wm Khutzeymateen Park - CWH wm - AU (9.4) (4.) Khutzeymateen Park - MH mm - AU n/a - CWH vm - AU AU3 0 - CWH vm - (.0) (30.) - - (.0) (3.5) - MH mm CWH vm - AU CWH vm - AU CWH vm CWH vm MH mm CWH vm - AU (0.8) (2.5) - MH mm CWH vm AU CWH vm MH wh (5.3) (0.) (6.6) () MH mm - (.0) (2.7) - - AU MH mm - AU Kiltuish - CWH vm Kiltuish - CWH vm Kiltuish Kiltuish Kiltuish - MH mm Kiltuish - CWH vm Kiltuish Kiltuish - MH mm Kiltuish - - AU
31 Table 3: All LUs, Seral situation as of Dec 3, 2006 Landscape - - (AU) Actual Target (<%) Kiltuish - CWH vm - AU2 0.4 Kitkiata - - AU3 0 Kitkiata - CWH vm - AU3 0 Kitkiata - - (.0) (2.7) Kitkiata - - (.0) (.8) Kitkiata - CWH vm (2.5) (65.3) Kitkiata - CWH vm - AU Kitkiata - CWH vm Kitkiata - MH mm Kitkiata Kitkiata Kitkiata - CWH vm Kitkiata - MH mm - 0 Kitkiata - CWH vm - (.0) (.6) Kitkiata Kitkiata - CWH vm Kitkiata - MH mm Kitkiata - CWH vm - AU Kitkiata - CWH vm Kitkiata - - AU Kitkiata Kitkiata - - AU Kitkiata Kitkiata Kitkiata - MH wh Kitkiata - MH wh Kitkiata - MH wh ESSFwv MH mm CWH ws - AU3 0 - CWH ws 2 - AU3 0 - CWH wm - (.0) (4.7) - CWH wm (5.4) (.0) - MH mm MH mm MH mm CWH ws CWH ws CWH ws 2 - AU2 (.0) (2.3) - CWH ws CWH ws - AU (.0) (3.9) - CWH wm - (.0) (0.8) - CWH ws - AU0 3.7 (27.3) (2.5) - CWH ws (9.9) (320.5) - CWH ws CWH ws 2 - AU 60 (6) (6.7) - CWH ws (.4) (73.3) - CWH ws CWH ws 2 - AU MH mm 2 - AU2 65 (65.0) (0.) - CWH ws - AU MH mm Klekane - CWH vm - AU3 0 Klekane - CWH vm - AU (.0) (0.4) Klekane - MH mm - (.0) (24.0) Klekane (24.6) (3) Klekane - CWH vm (5.) (7.7) Klekane Klekane - CWH vm Klekane - MH mm
32 Table 3: All LUs, Seral situation as of Dec 3, 2006 Landscape - - (AU) Actual Target (<%) Klekane - CWH vm - AU2 (.0) (2.4) Klekane - - AU2 (.0) (0.5) Klekane - MH mm - (27.8) (.4) Klekane (9.0) (83.4) Klekane - CWH vm Klekane - CWH vm Klekane Kshwan - CWH wm - AU3 0 Kshwan - CWH wm Kshwan - MH mm Kshwan - CWH wm Kshwan - MH mm Kshwan - MH mm Kshwan - CWH wm - AU (.0) (75.) Kshwan - CWH wm - AU Kshwan - CWH wm Kshwan - CWH wm Kshwan - CWH wm - AU2 6.5 (6.5) (69.3) - - AU (24.5) (86.5) - CWH vm MH mm CWH vm AU MH mm AU MH wh MH wh AU0 5.7 (53.3) (47.6) - - AU 2 (39.0) (20.4) - - AU4 63 (63.0) (58.7) - MH mm - AU MH wh - (.0) (3.7) - MH wh MH wh MH wh - AU MH wh - n/a - CWH vm - AU AU3 0 - CWH vm MH mm CWH vm - AU CWH vm CWH vm - AU CWH vm MH mm AU MH mm CWH vm - AU
33 Table 3: All LUs, Seral situation as of Dec 3, 2006 Landscape - - (AU) Actual Target (<%) - CWH vm CWH vm AU0 54. (4.9) (0.8) - - AU MH mm - AU Laredo - - AU3 0 Laredo - MH mm (6.5) (8.8) Laredo Laredo - CWH vm Laredo Laredo - CWH vm Laredo - MH mm - (.0) (.8) Laredo - CWH vm - (.0) (.) Laredo - - (.0) (0.7) Laredo - CWH vm - 0. Laredo - MH wh (8.6) (56.8) Laredo (4.9) (678.5) Laredo - - AU Laredo - MH wh Laredo Laredo Laredo Laredo - - AU Laredo - - AU Laredo - MH wh Marmot - CWH wm - AU3 0 Marmot - CWH wm Marmot - MH mm Marmot - CWH wm Marmot - MH mm Marmot - MH mm Marmot - CWH wm - AU (.0) (8.2) Marmot - CWH wm Marmot - CWH wm - AU Marmot - MH mm Marmot - CWH wm Marmot - MH mm - AU Marmot - CWH wm Marmot - CWH wm - AU (4.8) (5.6) McCauley - - AU3 0 McCauley - - AU2 3.6 (.4) (4.3) McCauley (2.) (57.4) McCauley McCauley McCauley Monckton - - AU3 0 Monckton - - AU2 3.3 (.7) (362.2) Monckton - MH wh (24.3) (2.7) Monckton (8.8) (854.4) Monckton - MH wh (2.7) (7.9) Monckton Monckton Monckton Monckton - - AU Monckton - MH wh - 0 Monckton - MH wh Observatory East - CWH wm - AU3 0 Observatory East - CWH wm Observatory East - CWH wm
34 Table 3: All LUs, Seral situation as of Dec 3, 2006 Landscape - - (AU) Actual Target (<%) Observatory East - MH mm Observatory East - MH mm Observatory East - CWH wm - (.0) (8.9) Observatory East - CWH wm - AU Observatory East - CWH wm (20.7) (6.9) Observatory East - CWH wm - AU (23.3) (4.0) Observatory West - - AU3 0 Observatory West - CWH wm - AU3 0 Observatory West - MH mm - (.0) (2.7) Observatory West - CWH wm (0.4) (5.0) Observatory West - CWH wm Observatory West - MH mm Observatory West - MH mm Observatory West - - AU2 (.0) (6.9) Observatory West Observatory West Observatory West Observatory West - MH wh Observatory West - CWH wm - AU (.0) (0.6) Observatory West - CWH wm Observatory West - CWH wm - AU2 (.0) (4.9) Olh - CWH wm - AU3 0 Olh - CWH wm (6.7) (384.9) Olh - MH mm - 2. (3.9) (74.) Olh - CWH wm Olh - MH mm Olh - MH mm Olh - CWH ws Olh - MH mm Olh - CWH wm - AU (.0) (4.2) Olh - CWH wm - (.0) (42.2) Olh - MH mm - AU2 65 (65.0) (6.6) Olh - CWH wm (48.0) (6.) Olh - CWH wm - AU2 (.0) (4.8) - - AU (23.6) (30.6) - MH wh AU MH wh AU MH wh Pearse - - AU Pearse - - AU Pearse - MH wh Pearse Pearse - MH wh Pearse Pearse Pearse Pearse - - AU Pearse - - AU Pearse - MH wh AU (.0) (35.5) MH wh
35 Table 3: All LUs, Seral situation as of Dec 3, 2006 Landscape - - (AU) Actual Target (<%) AU MH wh AU0 (.0) (3.2) - MH wh - AU (.0) (0.) - - AU 5.3 (53.7) (22.2) - MH wh - AU (.7) (2.3) - MH wh MH mm - AU AU3 0 - CWH vm - AU AU (.0) (26.0) - CWH vm - (.0) (2) - CWH vm - AU CWH vm CWH vm - AU MH mm CWH vm MH mm AU CWH vm - AU MH mm CWH vm CWH vm MH wh AU MH wh MH wh - AU (.0) (9.8) - - AU4 (.0) (.2) - MH mm - AU4 (.0) (8.7) - - AU (24.) (2.9) - - AU AU AU MH mm MH mm - AU (6.6) (2.) - MH mm MH wh - AU2 3. (36.9) (2.4) - MH wh MH wh AU (8.3) (23.9) - - AU2 2. (7.9) (5.8) MH wh MH wh
36 Table 3: All LUs, Seral situation as of Dec 3, 2006 Landscape - - (AU) Actual Target (<%) - - AU MH wh CWH vm - AU AU3 0 - CWH vm - AU4 (.0) () - - (.0) (.6) - CWH vm - (.0) (.5) - - (.0) (22.2) - CWH vm - AU0.9 (3.) (33.3) - MH mm CWH vm - AU CWH vm CWH vm MH mm CWH vm - AU AU MH mm CWH vm CWH vm MH wh MH wh AU MH mm - AU MH wh MH wh Skeena Islands - CWH vm - AU3 0 Skeena Islands - - AU3 0 Skeena Islands - CWH vm - (.0) (9.2) Skeena Islands - - (.0) () Skeena Islands - MH mm - (.0) (0.7) Skeena Islands - CWH vm - AU 2. (2.9) (.8) Skeena Islands - CWH vm - AU0 3.6 (.4) (6.5) Skeena Islands - MH mm Skeena Islands - CWH vm Skeena Islands Skeena Islands Skeena Islands - CWH vm Skeena Islands - CWH vm (9.3) (6.9) Skeena Islands - CWH vm Skeena Islands - CWH vm - AU Skeena Islands Skeena Islands - MH mm CWH vm - AU AU (.0) (8.) - CWH vm (22.5) (36.7) - CWH vm - AU CWH vm - AU CWH vm MH mm CWH vm
37 Table 3: All LUs, Seral situation as of Dec 3, 2006 Landscape - - (AU) Actual Target (<%) - MH mm CWH vm - AU AU CWH vm CWH vm - AU MH mm CWH vm MH wh (.3) (0.4) MH wh AU MH mm - (.0) (0.5) - - AU AU MH mm - AU (33.2) (.) - MH wh MH mm - AU0 n/a - MH mm - AU n/a Sparkling - CWH vm - AU3 0 Sparkling - CWH vm - AU0 (.0) (.2) Sparkling - MH mm Sparkling Sparkling - CWH vm Sparkling - CWH vm Sparkling - CWH vm Sparkling Sparkling - MH mm Sparkling - CWH vm - AU Sparkling Sparkling - CWH vm Sparkling - MH mm Sparkling - - AU Sparkling Sparkling - CWH vm Sparkling - CWH vm - AU Sparkling - MH wh Sparkling - - AU Sparkling - - AU Sparkling - MH mm - AU Stagoo - CWH ws - AU3 0 Stagoo - CWH wm - AU Stagoo - MH mm Stagoo - MH mm Stagoo - CWH wm Stagoo - CWH wm Stagoo - MH mm Stagoo - CWH ws Stagoo - MH mm Stagoo - CWH wm - AU (.0) (5.0) Stagoo - CWH ws - (.0) (8.8) Stagoo - MH mm - (.0) (.) Stagoo - CWH ws (47.0) (4.3) Stagoo - CWH wm - AU (5.3) (24.) Stagoo - CWH wm Stagoo - CWH ws (32.2) (30.4) Stagoo - MH mm - AU (35.5) (8.) 37
38 Table 3: All LUs, Seral situation as of Dec 3, 2006 Landscape - - (AU) Actual Target (<%) Stagoo - CWH wm Stagoo - CWH wm Stagoo - CWH wm - AU (33.4) (82.7) Stagoo - CWH ws - AU2 65 (65.0) (9.) Stephens - - (.0) (.6) Stephens - - AU2 0.5 (8.5) (464.8) Stephens Stephens AU3 0 - CWH vm - AU3 0 - MH wh - AU3 0 - CWH vm - AU4 (.0) (0.6) - MH mm (2) (8.2) - MH mm (3.5) () CWH vm CWH vm CWH vm - AU2 (.0) (7.2) - MH mm (9.0) (3) (0.9) (.3) - CWH vm CWH vm AU2 8.9 (20.) (9.7) - MH wh (4.8) (84.7) - MH wh (9.) (0.9) AU0 (.0) (0.6) - - AU 38.7 (2) (8.5) - MH mm MH wh (22.3) (5.4) - MH wh Tolmie - - AU2 (.0) (4.4) Tolmie - MH wh (.5) (7.2) Tolmie (4.9) (5.9) Tolmie Tolmie - MH wh Tolmie Tolmie Tolmie - - AU4 63 (63.0) (3.0) - CWH vm - AU AU3 0 - CWH vm - AU4 (.0) (3.) - CWH vm - (.0) (66.0) - - (.0) (9.0) - MH mm (4.2) (3.8) CWH vm CWH vm MH mm CWH vm - AU CWH vm - AU CWH vm - AU2 5.3 (22.7) (5.) (7.9) (35.4) - - AU2 6.3 (.7) () 38
39 Table 3: All LUs, Seral situation as of Dec 3, 2006 Landscape - - (AU) Actual Target (<%) - CWH vm MH mm CWH vm AU0 (.0) (3.8) - - AU4 (.0) (0.9) - MH mm - (.0) () - - AU MH mm - 65 (65.0) (.3) Trutch - - AU2.8 (7.2) (23.2) Trutch (6.7) (749.5) Trutch Trutch AU3 0 - MH wh - AU (.0) (3.2) - - AU MH wh MH wh AU0 (.0) (.0) - - AU 54.4 (4.6) (7.7) - MH wh - AU MH wh MH wh AU3 0 - CWH vm - AU AU (.0) (3.5) - - (.0) (0.) - CWH vm - AU MH mm CWH vm CWH vm CWH vm - AU MH mm AU CWH vm - AU MH mm CWH vm CWH vm MH wh MH wh AU MH mm - (.0) (4.) - - AU 9.9 (39.) (26.3) - - AU 48.4 (0.6) (4.0) - - AU MH wh - AU
40 Table 3: All LUs, Seral situation as of Dec 3, 2006 Landscape - - (AU) Actual Target (<%) - MH mm - AU MH wh - AU (.8) (2.7) - MH wh AU AU3 0 - MH mm - AU3 0 - CWH vm - AU CWH vm - AU4 (.0) (7.7) - - (.0) (2.0) - CWH vm - (.0) (57.0) - - (.0) (0.) - MH mm (5.3) (80.8) (4.3) (08.5) - CWH vm - AU0 24. (0.9) (0.9) - CWH vm CWH vm MH mm CWH vm - AU AU2 2.8 (.2) (0.4) - MH mm (.2) (344.7) (2.5) (353.7) - CWH vm CWH vm CWH vm - AU MH wh (23.4) (57.8) - MH wh (5.2) (55.2) - - AU2 9.4 (9.6) (3.9) AU0 (.0) (3.) - - AU 32.9 (26.) (.3) - - AU 36.6 (22.4) (2.7) - MH wh MH wh - AU MH wh
41 Table 4: All LUs, Seral situation as of Dec 3, 20 Table 4: All LUs, Seral situation as of Dec 3, 20 Landscape - - (AU) Actual Target (<%) Anyox - CWH wm - AU2 (.0) (.5) Anyox - CWH wm - AU3 0 Anyox - CWH wm (52.5) (272.2) Anyox - CWH wm - (.0) (.) Anyox - CWH wm - (.0) (304.5) Anyox - CWH wm (22.) () Anyox - MH mm Anyox - MH mm - (.0) () Anyox - MH mm (6.4) (08.6) Aristazabal - - AU0 (.0) (2.9) Aristazabal - - AU2.8 (27.2) (42.5) Aristazabal Aristazabal (4.7) (702.3) Aristazabal Aristazabal Banks - - AU Banks - - AU3 0 Banks Banks Banks - - (.0) (3.6) Banks Banks Banks - MH wh - AU2 0. Banks - MH wh Banks - MH wh Belle Bay - - AU Belle Bay Belle Bay Belle Bay Belle Bay Belle Bay - CWH wm - AU Belle Bay - CWH wm - AU Belle Bay - CWH wm - AU Belle Bay - CWH wm - AU3 0 Belle Bay - CWH wm (5.4) (5.6) Belle Bay - CWH wm Belle Bay - CWH wm (4.6) (.8) Belle Bay - CWH wm Belle Bay - CWH wm Belle Bay - MH mm Belle Bay - MH mm Belle Bay - MH wh Belle Bay - MH wh Belle Bay - MH wh CWH vm - AU0.4 (23.6) (79.6) - CWH vm - AU 7.5 (7.5) (20.8) - CWH vm - AU CWH vm - AU3 0 - CWH vm - AU4 (.0) (3.4) - CWH vm CWH vm CWH vm (2.5) (83.6) - CWH vm CWH vm AU (6.7) (3.3) - - AU
42 Table 4: All LUs, Seral situation as of Dec 3, 20 Landscape - - (AU) Actual Target (<%) - - AU2 2.3 (5.7) (9.6) - - AU AU4 (.0) (.6) (.8) (0.8) (20.5) (7.7) MH mm - AU (3.7) () - MH mm MH mm MH mm AU (.0) (42.) - - AU2 (.0) (5.3) - - AU (.0) (4.) CWH vm - AU (.8) (2.4) - CWH vm - AU 8.0 (7.0) (24.) - CWH vm - AU2 2.8 (5.2) (.0) - CWH vm - AU3 0 - CWH vm - AU4 (.0) (24.5) - CWH vm CWH vm CWH vm -.6 (23.4) (.7) - CWH vm CWH vm AU (.0) (3.) - - AU AU4 (.0) (0.6) (.0) (0.6) MH mm MH mm MH mm MH wh MH wh -.7 (39.3) (.4) - MH wh AU (.0) (3.6) - - AU AU (2.8) (2.5) CWH vm - AU CWH vm - AU CWH vm - AU CWH vm - AU3 0 - CWH vm - AU4 (.0) (0.6) - CWH vm CWH vm CWH vm - (.0) (2.) - CWH vm CWH vm
43 Table 4: All LUs, Seral situation as of Dec 3, 20 Landscape - - (AU) Actual Target (<%) - - AU AU AU (.0) (.) MH mm - AU (0.5) () - MH mm MH mm MH mm MH wh MH wh MH wh Butedale - - (.0) () Butedale - CWH vm (.2) () Butedale - - (.0) (0.) Butedale - - (.0) () Butedale - MH mm - (.0) (0.6) Butedale - MH mm - (.0) () Butedale - MH wh - (.0) (0.5) Campania - - AU2 0.6 (.4) (3000.5) Campania (3.3) (53.5) Campania Campania Campania - MH wh - AU2 (.0) (43.6) Campania - MH wh - (.0) (0.8) Campania - MH wh - (.0) (3.2) - - AU AU AU MH wh MH wh (0.4) (2.) - MH wh MH wh AU AU AU AU (.0) () CWH vm - AU CWH vm - AU CWH vm - AU CWH vm - AU3 0 - CWH vm CWH vm CWH vm (4.9) (5.2) - CWH vm CWH vm AU0 9.4 (39.6) (0.) - - AU
44 Table 4: All LUs, Seral situation as of Dec 3, 20 Landscape - - (AU) Actual Target (<%) - - AU (.0) (2.5) MH mm - AU 0 - MH mm MH mm MH mm MH wh (8.5) (52.0) - MH wh Chapple - - AU0 (.0) (36.2) Chapple - - AU 4.5 (44.5) (3.7) Chapple - - AU2.4 (27.6) (538.9) Chapple - - AU3 0 Chapple - - AU4 63 (63.0) (43.9) Chapple Chapple Chapple - - (.0) (4.7) Chapple Chapple Chapple - MH wh - AU2 (.0) (6.8) Chapple - MH wh - (.0) (0.8) Chapple - MH wh - 9. (9.9) (00.9) Chapple - MH wh Chapple - MH wh (8.3) (76.0) Dundas - - AU (.0) (5.4) Dundas - - AU Dundas - - (.0) (.0) Dundas Dundas Dundas Gil - - AU Gil - - AU2 3.3 (.7) (88.) Gil - - AU Gil Gil Gil Gil Gil - MH wh - AU2 (.0) (53.6) Gil - MH wh - AU3 0 Gil - MH wh (.6) (2.0) Gil - MH wh Gil - MH wh AU0 5.3 (7.7) (2.8) - - AU 54.6 (4.4) (2.3) - - AU AU (.0) (89.6) MH wh - AU MH wh (.4) (5.3) - MH wh MH wh - n/a - MH wh (36.7) (24.7) - MH wh AU0 5. (7.9) (2.7) 44
45 Table 4: All LUs, Seral situation as of Dec 3, 20 Landscape - - (AU) Actual Target (<%) - - AU AU AU (5.3) (2.9) MH mm MH mm MH wh - AU MH wh MH wh MH wh - 3. (54.9) (9.2) - MH wh AU AU AU (.0) (8.2) MH wh - AU MH wh MH wh (6.2) (5.6) - MH wh Helmcken - - AU Helmcken - - AU Helmcken - - AU2 9.6 (9.4) (5.2) Helmcken - - AU3 0 Helmcken Helmcken (0.9) (3.7) Helmcken Helmcken Helmcken Helmcken - MH wh (0.6) (98.0) Helmcken - MH wh - 0. Helmcken - MH wh AU AU2 4. (24.9) (380.) - - AU AU4 63 (63.0) (7.8) (.0) (6.2) MH wh - AU2 (.0) (7.5) - MH wh MH wh MH wh MH wh Iknouk - CWH wm - 0 Iknouk - MH mm Johnston - CWH vm - AU Johnston - CWH vm - AU Johnston - CWH vm - AU
46 Table 4: All LUs, Seral situation as of Dec 3, 20 Landscape - - (AU) Actual Target (<%) Johnston - CWH vm - AU3 0 Johnston - CWH vm (5.0) (5.) Johnston - CWH vm Johnston - CWH vm - (.0) (22.3) Johnston - CWH vm Johnston - CWH vm Johnston - - AU Johnston - - AU Johnston - - AU3 0 Johnston Johnston - - (.0) (0.6) Johnston Johnston Johnston - MH mm - AU Johnston - MH mm Johnston - MH mm Johnston - MH mm AU0 (.0) (47.9) - - AU 2.3 (37.7) (63.4) - - AU AU AU4 63 (63.0) (4.2) (.0) (66.2) CWH vm CWH vm - (.0) (.2) - CWH vm (.0) () - MH mm MH wh - AU (32.3) (5.6) - MH wh - AU3 0 - MH wh MH wh MH wh CWH vm - AU0 5.8 (9.2) (2.0) - CWH vm - AU CWH vm - AU CWH vm - AU3 0 - CWH vm CWH vm (5.6) (7.6) - CWH vm CWH vm AU AU AU AU (.0) (0.6) MH mm - AU n/a - MH mm - AU (4.0) (5.4) - MH mm MH mm MH mm Khutzeymateen Park - CWH vm - AU
47 Table 4: All LUs, Seral situation as of Dec 3, 20 Landscape - - (AU) Actual Target (<%) Khutzeymateen Park - CWH vm - AU Khutzeymateen Park - CWH vm - AU Khutzeymateen Park - CWH vm - AU3 0 Khutzeymateen Park - CWH vm Khutzeymateen Park - CWH vm Khutzeymateen Park - CWH vm Khutzeymateen Park - CWH vm Khutzeymateen Park - - AU2 (.0) (.3) Khutzeymateen Park Khutzeymateen Park Khutzeymateen Park Khutzeymateen Park - CWH wm - AU Khutzeymateen Park - CWH wm - AU Khutzeymateen Park - CWH wm - AU (9.4) (4.) Khutzeymateen Park - CWH wm - AU3 0 Khutzeymateen Park - CWH wm Khutzeymateen Park - CWH wm Khutzeymateen Park - CWH wm Khutzeymateen Park - CWH wm Khutzeymateen Park - CWH wm Khutzeymateen Park - MH mm - AU n/a Khutzeymateen Park - MH mm - AU Khutzeymateen Park - MH mm - AU Khutzeymateen Park - MH mm Khutzeymateen Park - MH mm Khutzeymateen Park - MH mm (6.6) () - CWH vm - AU CWH vm - AU CWH vm - AU (0.8) (2.5) - CWH vm - AU3 0 - CWH vm CWH vm CWH vm - (.0) (30.) - CWH vm CWH vm AU AU AU (.0) (3.5) MH mm - AU MH mm MH mm - (.0) (2.7) - MH mm MH mm MH wh (5.3) (0.) Kiltuish - CWH vm - AU2 0.4 Kiltuish - CWH vm Kiltuish - CWH vm Kiltuish - CWH vm Kiltuish - - AU2 0.0 Kiltuish Kiltuish Kiltuish Kiltuish - MH mm
48 Table 4: All LUs, Seral situation as of Dec 3, 20 Landscape - - (AU) Actual Target (<%) Kiltuish - MH mm Kitkiata - - AU Kitkiata - - AU3 0 Kitkiata Kitkiata - - (.0) (2.7) Kitkiata Kitkiata Kitkiata - CWH vm - AU Kitkiata - CWH vm - AU Kitkiata - CWH vm - AU3 0 Kitkiata - CWH vm Kitkiata - CWH vm Kitkiata - CWH vm (2.5) (65.3) Kitkiata - CWH vm Kitkiata - CWH vm Kitkiata - - AU Kitkiata Kitkiata - - (.0) (.8) Kitkiata Kitkiata Kitkiata - MH mm Kitkiata - MH mm - 0 Kitkiata - MH mm Kitkiata - MH wh Kitkiata - MH wh - 0 Kitkiata - MH wh CWH wm - (.0) (0.8) - CWH wm - (.0) (4.7) - CWH wm (5.4) (.0) - CWH ws - AU0 3.7 (27.3) (2.5) - CWH ws - AU (.0) (3.9) - CWH ws - AU CWH ws - AU3 0 - CWH ws CWH ws (9.6) (3.6) - CWH ws (.4) (73.3) - CWH ws 2 - AU CWH ws 2 - AU 60 (6) (6.7) - CWH ws 2 - AU2 (.0) (2.3) - CWH ws 2 - AU3 0 - CWH ws CWH ws CWH ws CWH ws ESSFwv - 26 (26.0) () - MH mm MH mm 2 - AU2 65 (65.0) (0.) - MH mm MH mm 2 - n/a - MH mm MH mm Klekane - CWH vm - AU (.0) (0.4) Klekane - CWH vm - AU2 (.0) (2.4) Klekane - CWH vm - AU3 0 Klekane - CWH vm Klekane - CWH vm Klekane - CWH vm Klekane - CWH vm (5.) (7.7) Klekane - - AU2 (.0) (0.5) Klekane
49 Table 4: All LUs, Seral situation as of Dec 3, 20 Landscape - - (AU) Actual Target (<%) Klekane (9.0) (83.4) Klekane Klekane (24.6) (3) Klekane - MH mm - (27.8) (.4) Klekane - MH mm Klekane - MH mm - (.0) (24.0) Kshwan - CWH wm - AU Kshwan - CWH wm - AU (.0) (75.) Kshwan - CWH wm - AU2 6.5 (6.5) (69.3) Kshwan - CWH wm - AU3 0 Kshwan - CWH wm Kshwan - CWH wm Kshwan - CWH wm Kshwan - CWH wm Kshwan - MH mm Kshwan - MH mm Kshwan - MH mm AU0 5.7 (53.3) (47.6) - - AU 2 (39.0) (20.4) - - AU AU AU4 63 (63.0) (58.7) (4.6) (5.6) CWH vm CWH vm AU MH mm - AU MH mm MH mm MH wh - AU MH wh MH wh MH wh - n/a - MH wh MH wh CWH vm - AU CWH vm - AU CWH vm - AU CWH vm - AU3 0 - CWH vm CWH vm CWH vm CWH vm CWH vm AU0 54. (4.9) (0.8) - - AU AU AU
50 Table 4: All LUs, Seral situation as of Dec 3, 20 Landscape - - (AU) Actual Target (<%) - MH mm - AU MH mm MH mm MH mm Laredo - - AU Laredo - - AU Laredo - - AU Laredo - - AU3 0 Laredo Laredo (4.9) (678.5) Laredo Laredo Laredo Laredo - CWH vm - 0. Laredo - CWH vm - (.0) (.) Laredo - CWH vm Laredo - CWH vm Laredo - - (.0) (0.7) Laredo Laredo - MH mm - (.0) (.8) Laredo - MH mm (6.5) (8.8) Laredo - MH wh (8.6) (56.8) Laredo - MH wh Laredo - MH wh Marmot - CWH wm - AU Marmot - CWH wm - AU (.0) (8.2) Marmot - CWH wm - AU (4.8) (5.6) Marmot - CWH wm - AU3 0 Marmot - CWH wm Marmot - CWH wm Marmot - CWH wm Marmot - CWH wm Marmot - CWH wm Marmot - MH mm - AU Marmot - MH mm Marmot - MH mm Marmot - MH mm Marmot - MH mm McCauley - - AU2 3.6 (.4) (4.3) McCauley - - AU3 0 McCauley McCauley (2.) (57.4) McCauley McCauley Monckton - - AU Monckton - - AU2 3.3 (.7) (362.2) Monckton - - AU3 0 Monckton Monckton (8.8) (854.4) Monckton Monckton Monckton - MH wh - 0 Monckton - MH wh (24.3) (2.7) Monckton - MH wh Monckton - MH wh (2.7) (7.9) Observatory East - CWH wm - AU Observatory East - CWH wm - AU (23.3) (4.0) Observatory East - CWH wm - AU3 0 Observatory East - CWH wm (20.7) (6.9) Observatory East - CWH wm - (.0) (8.9)
51 Table 4: All LUs, Seral situation as of Dec 3, 20 Landscape - - (AU) Actual Target (<%) Observatory East - CWH wm Observatory East - CWH wm Observatory East - MH mm Observatory East - MH mm Observatory West - - AU2 (.0) (6.9) Observatory West - - AU3 0 Observatory West Observatory West Observatory West Observatory West - CWH wm - AU (.0) (0.6) Observatory West - CWH wm - AU2 (.0) (4.9) Observatory West - CWH wm - AU3 0 Observatory West - CWH wm Observatory West - CWH wm (0.4) (5.0) Observatory West - CWH wm Observatory West - MH mm Observatory West - MH mm - (.0) (2.7) Observatory West - MH mm Observatory West - MH wh Olh - CWH wm - AU (.0) (4.2) Olh - CWH wm - AU2 (.0) (4.8) Olh - CWH wm - AU3 0 Olh - CWH wm (48.0) (6.) Olh - CWH wm - (.0) (42.2) Olh - CWH wm Olh - CWH wm (3.3) (89.8) Olh - CWH ws Olh - MH mm - AU2 65 (65.0) (6.6) Olh - MH mm Olh - MH mm Olh - MH mm (2.3) (44.5) Olh - MH mm AU AU AU (23.6) (30.6) MH wh MH wh MH wh Pearse - - AU Pearse - - AU Pearse - - AU Pearse - - AU Pearse Pearse Pearse Pearse Pearse - MH wh Pearse - MH wh - 0 Pearse - MH wh AU0 (.0) (3.2) - - AU 5.3 (53.7) (22.2) - - AU AU (.0) (35.5) 5
52 Table 4: All LUs, Seral situation as of Dec 3, 20 Landscape - - (AU) Actual Target (<%) (0.6) (6.5) MH wh - AU (.0) (0.) - MH wh - AU (.7) (2.3) - MH wh MH wh MH wh AU (24.) (2.9) - - AU AU AU (.0) (26.0) CWH vm - AU CWH vm - AU CWH vm - AU CWH vm - AU3 0 - CWH vm CWH vm CWH vm - (.0) (2) - CWH vm CWH vm AU AU AU AU AU4 (.0) (.2) MH mm - AU 0 - MH mm - AU (6.6) (2.) - MH mm - AU4 (.0) (8.7) - MH mm MH mm MH mm MH mm MH mm MH wh - AU (.0) (9.8) - MH wh - AU2 3. (36.9) (2.4) - MH wh MH wh MH wh MH wh AU AU2 2 (8.8) (57.5) - - AU (8.3) (23.9) MH wh MH wh MH wh
53 Table 4: All LUs, Seral situation as of Dec 3, 20 Landscape - - (AU) Actual Target (<%) (.0) (.6) CWH vm - AU0.9 (3.) (33.3) - CWH vm - AU CWH vm - AU CWH vm - AU3 0 - CWH vm - AU4 (.0) () - CWH vm CWH vm CWH vm - (.0) (.5) - CWH vm CWH vm AU AU AU (.0) (22.2) MH mm - AU MH mm MH mm MH mm MH wh MH wh MH wh MH wh Skeena Islands - CWH vm - (.0) (0.9) Skeena Islands - CWH vm - AU0 3.6 (.4) (6.5) Skeena Islands - CWH vm - AU 2. (2.9) (.8) Skeena Islands - CWH vm - AU Skeena Islands - CWH vm - AU3 0 Skeena Islands - CWH vm (9.3) (6.9) Skeena Islands - CWH vm Skeena Islands - CWH vm - (.0) (9.2) Skeena Islands - CWH vm Skeena Islands - CWH vm Skeena Islands - - AU3 0 Skeena Islands Skeena Islands - - (.0) () Skeena Islands Skeena Islands Skeena Islands - MH mm Skeena Islands - MH mm - (.0) (0.7) Skeena Islands - MH mm AU CWH vm - AU CWH vm - AU CWH vm - AU CWH vm - AU3 0 - CWH vm - AU CWH vm CWH vm
54 Table 4: All LUs, Seral situation as of Dec 3, 20 Landscape - - (AU) Actual Target (<%) - CWH vm (22.5) (36.7) - CWH vm CWH vm AU AU AU AU (.0) (8.) MH mm - AU0 n/a - MH mm - AU n/a - MH mm - AU (33.2) (.) - MH mm MH mm - (.0) (0.5) - MH mm MH mm MH wh (.3) (0.4) - MH wh MH wh Sparkling - CWH vm - AU0 (.0) (.2) Sparkling - CWH vm - AU Sparkling - CWH vm - AU Sparkling - CWH vm - AU3 0 Sparkling - CWH vm Sparkling - CWH vm Sparkling - CWH vm Sparkling - CWH vm Sparkling - CWH vm Sparkling - - AU Sparkling - - AU Sparkling - - AU Sparkling Sparkling Sparkling Sparkling Sparkling - MH mm - AU Sparkling - MH mm Sparkling - MH mm Sparkling - MH mm Sparkling - MH wh Stagoo - CWH wm - AU (5.3) (24.) Stagoo - CWH wm - AU (.0) (5.0) Stagoo - CWH wm - AU (33.4) (82.7) Stagoo - CWH wm - AU Stagoo - CWH wm Stagoo - CWH wm Stagoo - CWH wm Stagoo - CWH wm Stagoo - CWH wm Stagoo - CWH ws - AU2 65 (65.0) (9.) Stagoo - CWH ws - AU3 0 Stagoo - CWH ws - (.0) (8.8) Stagoo - CWH ws (47.0) (4.3) Stagoo - CWH ws (32.2) (30.4) Stagoo - CWH ws Stagoo - MH mm - AU (35.5) (8.) Stagoo - MH mm Stagoo - MH mm - (.0) (.) 54
55 Table 4: All LUs, Seral situation as of Dec 3, 20 Landscape - - (AU) Actual Target (<%) Stagoo - MH mm Stagoo - MH mm Stagoo - MH mm Stephens - - AU (4.4) () Stephens - - (.0) (.6) Stephens Stephens AU0 (.0) (0.6) - - AU 38.7 (2) (8.5) - - AU2 8.9 (20.) (9.7) - - AU CWH vm - AU2 (.0) (7.2) - CWH vm - AU3 0 - CWH vm - AU4 (.0) (0.6) - CWH vm CWH vm CWH vm CWH vm (0.9) (.3) MH mm MH mm (9.0) (3) - MH mm (3.5) () - MH mm (2) (8.2) - MH wh - AU3 0 - MH wh MH wh (4.8) (84.7) - MH wh (22.3) (5.4) - MH wh (9.) (0.9) Tolmie - - AU2 (.0) (4.4) Tolmie - - AU4 63 (63.0) (3.0) Tolmie Tolmie (4.9) (5.9) Tolmie Tolmie Tolmie - MH wh (.5) (7.2) Tolmie - MH wh CWH vm - AU CWH vm - AU CWH vm - AU2 5.3 (22.7) (5.) - CWH vm - AU3 0 - CWH vm - AU4 (.0) (3.) - CWH vm CWH vm CWH vm - (.0) (66.0) - CWH vm CWH vm AU0 (.0) (3.8) - - AU AU2 6.3 (.7) () - - AU AU4 (.0) (0.9) (7.9) (35.4)
56 Table 4: All LUs, Seral situation as of Dec 3, 20 Landscape - - (AU) Actual Target (<%) - - (.0) (9.0) MH mm - 65 (65.0) (.3) - MH mm MH mm - (.0) () - MH mm (4.2) (3.8) - MH mm Trutch - - AU2.8 (7.2) (23.2) Trutch (6.7) (749.5) Trutch Trutch AU0 (.0) (.0) - - AU 54.4 (4.6) (7.7) - - AU AU (.0) (3.2) MH wh - AU MH wh - AU3 0 - MH wh MH wh MH wh MH wh AU 9.9 (39.) (26.3) - - AU AU (.0) (3.5) CWH vm - AU CWH vm - AU CWH vm - AU CWH vm - AU3 0 - CWH vm CWH vm CWH vm CWH vm AU AU 48.4 (0.6) (4.0) - - AU AU (.0) (0.) MH mm - AU MH mm MH mm - (.0) (4.) - MH mm MH mm MH wh - AU MH wh - AU (.8) (2.7) - MH wh
57 Table 4: All LUs, Seral situation as of Dec 3, 20 Landscape - - (AU) Actual Target (<%) - MH wh MH wh AU0 (.0) (3.) - - AU 36.6 (22.4) (2.7) - - AU2 9.4 (9.6) (3.9) - - AU (.0) (2.0) CWH vm - AU0 23. (.9) (.8) - CWH vm - AU CWH vm - AU CWH vm - AU CWH vm - AU4 (.0) (7.7) - CWH vm CWH vm CWH vm - (.0) (57.0) - CWH vm CWH vm AU 32.9 (26.) (.3) - - AU2 2.8 (.2) (0.4) - - AU (2.5) (353.9) - - (.0) (0.) (4.8) (9.6) - MH mm - AU3 0 - MH mm (.2) (344.7) - MH mm MH mm (5.3) (8.0) - MH wh - AU MH wh MH wh (23.4) (57.8) - MH wh MH wh (5.2) (55.2) 3..2 Seral Stage information for Licencee s that overlap with Landscape s Tables specific to each licencee are supplied in Appendix C. These tables will allow licencees to evaluate their achievement of proportional targets. The table formats are similar to those above in section
58 3.2 Ecosystem-Based Management (Central and North Coast Order) The Central and North Coast Order sets objectives for the implementation of ecosystembased management on the North Coast. This project provides data that can be used in measuring consistency with some of these objectives: important fisheries watersheds, upland streams, landscape level biodiversity, and critical grizzly bear habitat. Landscape level biodiversity is addressed in the seral stage analysis describe in Section 3. above, and the following sections discuss important fisheries watersheds, upland streams, and critical grizzly bear habitat Important Fisheries Watersheds The CNCO describes an objective that limits theamount of equivalent clearcut area (ECA) that may exist in areas identified as important fisheries watersheds. The data set that has been prepared for this project can also be used to determine consistency with this target. Calculation of equivalent clearcut area is based on a defined process, in which ECA is determined by evaluating the amount of hydrologically effective green-up (HEG). This project does not attempt to carry out the full ECA calculation; instead, a coarse filter approach is used to determine if a fisheries sensitive watershed is approaching the threshold where a full and detailed ECA calculation would be necessary. As a coarse filter we use a conservative surrogate definition for when hydrologically effective green-up is achieved: forests that are in the old, mature, mid-seral, and young age classes (i.e. forests that are > years old). See Appendix A for information related to how surogate hydrologicaly effective green-up (SHEG) is calculated. Within important fisheries watersheds, if the area of forest that meets the SHEG definition is greater than 80% of the total forested area in that fisheries watershed, then it can be stated that the watershed is consistent with the target in the CNCO. Areas that are below 80% are red-flagged as needing further evaluation to determine their true ECA. Table 5 shows that of the 3 Important Fisheries Watersheds within the North Coast TSA, there is only one identified as requiring further analysis about the state of hydrologically effective green-up. Watershed Assessment Guidebook,
59 Table 5: Important Fisheries Watershedoutcomes for coarse-filter hydrological green-up outcomes Target: Greater than 80% of forested area is hydrologically greened-up. Important Fisheries Watershed** Total ed Area 2006 SHEG* area 2006 % at SHEG* 2006 Redflag 20 SHEG* area 20 % at SHEG* 20 Redflag % % % % % % 5 00% 00% % % % % % % % % % % % % % % % % % % % % % % % % % % % % % % % % % % % % % % % % % % % % % % % % % % % % % % * SHEG = Surrogate Hydrologically Effective Greenup ** See Key Map (next page) for names and locations of watersheds

60 60
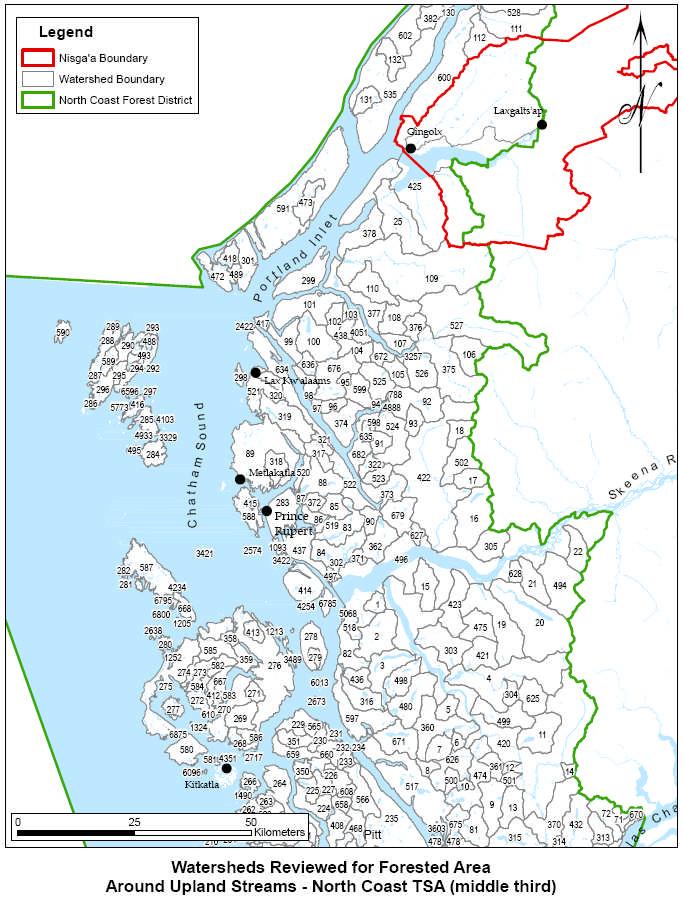
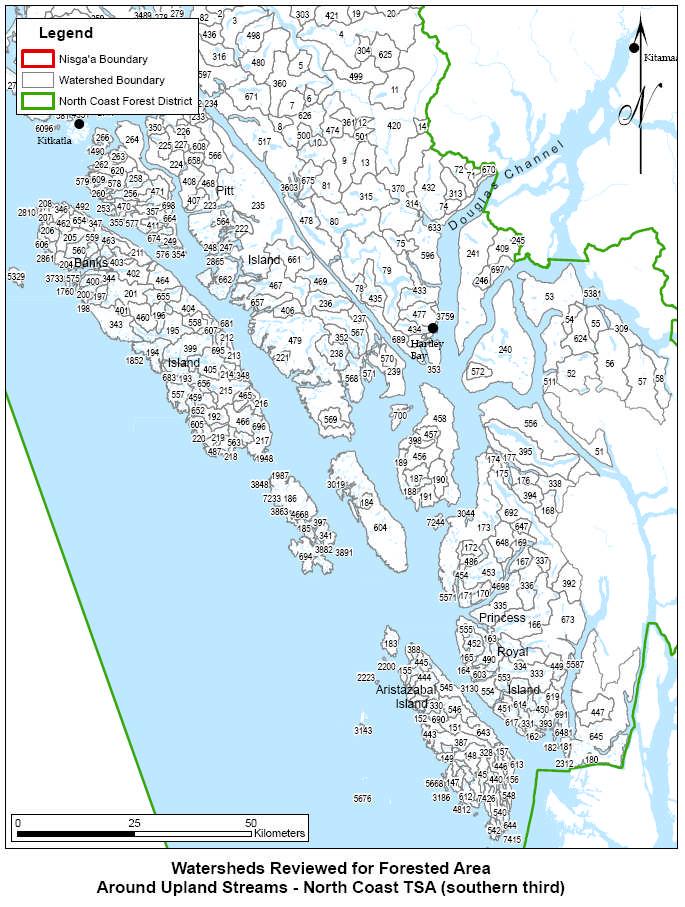
61 3.2.2 Upland Streams The CNCO describes in the objective for upland streams a target for functioning upland forest within a watershed. The data set that has been prepared for this project can also be used to determine consistency with this target. Functioning upland forest includes forest that is on slopes >5% that is in a state of hydrological green-up. For the purposes of this report, we use a conservative, coarse filter approach for the definition of hydrological green-up, and assume it is achieved for forests that are in the old, mature, and mid-seral age classes (i.e. forests that are > 40 years old). Watersheds are delineated using the :,000 watershed atlas 2. The Atlas database includes over 870 residual watersheds with areas of les than ha: these are likely a result of poor polygon unioning, and therefore are not report on in this report. Tables 6a 6m show the results for upland streams for watersheds within specific watershed groups. Of the 700 watersheds reported on in these tables, only 8 pass are indicated as requiring further analysis regarding hydrologically effective green-up of the upland forest area. Table 6a: Amount of Functioning Riparian KEEC watershed group Target: At least 70% of Upland is hydrologically greened-up Key Total Upland 2006 SHEG* 2006 % Map ID ed (UF) area in UF of UF at 2006 UF # Area Area SHEG* Redflag 20 UF SHEG* area 20 % of UF at SHEG* Watershed** KEEC Group KEECWSD % % KEECWSD % % KEECWSD % % KEECWSD % % KEECWSD % % KEECWSD % % KEECWSD % 33 00% KEECWSD % % KEECWSD % % KEECWSD % % KEECWSD % % KEECWSD % % KEECWSD % % KEECWSD % % KEECWSD % % KEECWSD % % KEECWSD % % KEECWSD % % KEECWSD % % KEECWSD % % KEECWSD %.8 00% KEECWSD % % KEECWSD % % KEECWSD % % KEECWSD % % KEECWSD % % KEECWSD % % KEECWSD % % 20 UF Redflag 2 Choice of :,000 watershed atlas for watershed definition is based on direction provided at a February, 2008 videoconference with Regional and District MoFR staff 6
62 Key Map ID # Total ed Area Upland (UF) Area 2006 SHEG* area in UF 2006 % of UF at SHEG* 2006 UF Redflag 20 UF SHEG* area 20 % of UF at SHEG* Watershed** KEEC Group KEECWSD % % KEECWSD % % KEECWSD % % KEECWSD % % KEECWSD % % KEECWSD % % KEECWSD % % KEECWSD % % KEECWSD % 42 00% KEECWSD % % KEECWSD % 00% KEECWSD % % KEECWSD % % KEECWSD % % KEECWSD % % KEECWSD % % KEECWSD % % KEECWSD % % KEECWSD % % KEECWSD % % KEECWSD % % KEECWSD % % KEECWSD % % KEECWSD % % KEECWSD % % KEECWSD % % KEECWSD % % KEECWSD % % KEECWSD % % KEECWSD % % KEECWSD % 6. 00% KEECWSD % % KEECWSD % % * SHEG = Surrogate Hydrologically Effective Greenup ** From :,000 Watershed Atlas 20 UF Redflag 62
63 Table 6b: Amount of Functioning Riparian KHTZ watershed group Target: At least 70% of Upland is hydrologically greened-up Key Total Upland 2006 SHEG* 2006 % Map ID ed (UF) area in UF of UF at 2006 UF # Area Area SHEG* Redflag 20 UF SHEG* area 20 % of UF at SHEG* 20 UF Redflag Watershed** KHTZ Group KHTZWSD % % KHTZWSD % % KHTZWSD % % KHTZWSD % % KHTZWSD % % KHTZWSD % % KHTZWSD % % KHTZWSD % 49.2 % KHTZWSD % % KHTZWSD % % KHTZWSD %.0 9% KHTZWSD % 79 75% KHTZWSD % % KHTZWSD % % KHTZWSD % % KHTZWSD % % KHTZWSD % % KHTZWSD %.6 99% KHTZWSD % % * SHEG = Surrogate Hydrologically Effective Greenup ** From :,000 Watershed Atlas Table 6c: Amount of Functioning Riparian KITR watershed group Target: At least 70% of Upland is hydrologically greened-up Key Total Upland 2006 SHEG* 2006 % Map ID ed (UF) area in UF of UF at 2006 UF # Area Area SHEG* Redflag 20 UF SHEG* area 20 % of UF at SHEG* 20 UF Redflag Watershed** KITR Group KITRWSD % % KITRWSD % % KITRWSD % % KITRWSD % % KITRWSD % % KITRWSD % % KITRWSD % % KITRWSD % 24 96% KITRWSD % % KITRWSD % % KITRWSD % % KITRWSD % % * SHEG = Surrogate Hydrologically Effective Greenup ** From :,000 Watershed Atlas 63
64 Table 6d: Amount of Functioning Riparian KSHR watershed group Target: At least 70% of Upland is hydrologically greened-up Key Total Upland 2006 SHEG* 2006 % Map ID ed (UF) area in UF of UF at 2006 UF # Area Area SHEG* Redflag 20 UF SHEG* area 20 % of UF at SHEG* Watershed** KSHR Group KSHRWSD % % KSHRWSD % % KSHRWSD % % KSHRWSD % % KSHRWSD % % KSHRWSD % % KSHRWSD % % KSHRWSD % % KSHRWSD % % KSHRWSD % % KSHRWSD % % KSHRWSD % % KSHRWSD % % KSHRWSD % % KSHRWSD % % KSHRWSD % % KSHRWSD % % KSHRWSD %.2 99% KSHRWSD % 54 00% KSHRWSD % % KSHRWSD % % KSHRWSD % % KSHRWSD % % KSHRWSD % % KSHRWSD % % KSHRWSD % % KSHRWSD % % KSHRWSD % % KSHRWSD % % KSHRWSD % % KSHRWSD % % KSHRWSD %.0 96% KSHRWSD % % KSHRWSD % % KSHRWSD % % KSHRWSD %.0 00% KSHRWSD % % KSHRWSD % % KSHRWSD % % KSHRWSD % % KSHRWSD % 00% KSHRWSD % % KSHRWSD % % KSHRWSD % % KSHRWSD % % KSHRWSD % % KSHRWSD % % KSHRWSD % % KSHRWSD % % KSHRWSD % % KSHRWSD % % KSHRWSD % % KSHRWSD % % KSHRWSD %.6 00% KSHRWSD % % KSHRWSD % 3. 98% KSHRWSD % % 20 UF Redflag 64
65 Key Map ID # Total ed Area Upland (UF) Area 2006 SHEG* area in UF 2006 % of UF at SHEG* 2006 UF Redflag 20 UF SHEG* area 20 % of UF at SHEG* Watershed** KSHR Group KSHRWSD % % KSHRWSD % % KSHRWSD % % KSHRWSD % % KSHRWSD % % KSHRWSD % % KSHRWSD % % KSHRWSD % % KSHRWSD % % KSHRWSD % % KSHRWSD % % KSHRWSD % % KSHRWSD % % KSHRWSD % % KSHRWSD % % KSHRWSD % % * SHEG = Surrogate Hydrologically Effective Greenup ** From :,000 Watershed Atlas 20 UF Redflag Table 6e: Amount of Functioning Riparian KTSU watershed group Target: At least 70% of Upland is hydrologically greened-up Key Total Upland 2006 SHEG* 2006 % Map ID ed (UF) area in UF of UF at 2006 UF # Area Area SHEG* Redflag 20 UF SHEG* area 20 % of UF at SHEG* Watershed** KTSU Group KTSUWSD % % KTSUWSD % % KTSUWSD % % KTSUWSD % % KTSUWSD % % KTSUWSD % % KTSUWSD % % KTSUWSD % % KTSUWSD % % KTSUWSD %.5 00% KTSUWSD % % KTSUWSD % % KTSUWSD % % KTSUWSD % % KTSUWSD % % KTSUWSD % 00% KTSUWSD % % KTSUWSD % % KTSUWSD % % KTSUWSD % % KTSUWSD % % KTSUWSD % % KTSUWSD % % KTSUWSD % % KTSUWSD % % KTSUWSD % % KTSUWSD % % KTSUWSD % % KTSUWSD % % KTSUWSD % % 20 UF Redflag 65
66 Key Map ID # Total ed Area Upland (UF) Area 2006 SHEG* area in UF 2006 % of UF at SHEG* 2006 UF Redflag 20 UF SHEG* area 20 % of UF at SHEG* Watershed** KTSU Group KTSUWSD % % KTSUWSD % % KTSUWSD % % KTSUWSD % % KTSUWSD % % KTSUWSD % % KTSUWSD % % KTSUWSD % % KTSUWSD % % KTSUWSD % % KTSUWSD % % KTSUWSD % % KTSUWSD % % KTSUWSD % % KTSUWSD % % KTSUWSD % % KTSUWSD % % KTSUWSD % % KTSUWSD % % KTSUWSD % % KTSUWSD % % KTSUWSD % % KTSUWSD % % KTSUWSD % % KTSUWSD % % KTSUWSD % % KTSUWSD % % KTSUWSD % % KTSUWSD % % KTSUWSD % % KTSUWSD % % KTSUWSD %.3 00% KTSUWSD %.5 00% KTSUWSD % % KTSUWSD % % KTSUWSD % % KTSUWSD % % KTSUWSD % % KTSUWSD % % KTSUWSD % % KTSUWSD %.3 00% * SHEG = Surrogate Hydrologically Effective Greenup ** From :,000 Watershed Atlas 20 UF Redflag 66
67 Table 6f: Amount of Functioning Riparian KUMR watershed group Target: At least 70% of Upland is hydrologically greened-up Key Total Upland 2006 SHEG* 2006 % Map ID ed (UF) area in UF of UF at 2006 UF # Area Area SHEG* Redflag 20 UF SHEG* area 20 % of UF at SHEG* Watershed** KUMR Group KUMRWSD % % KUMRWSD % 6 00% KUMRWSD % % KUMRWSD % % KUMRWSD % % KUMRWSD % % KUMRWSD % % KUMRWSD % % KUMRWSD % % KUMRWSD % % KUMRWSD % % KUMRWSD % % KUMRWSD %.0 00% KUMRWSD % % KUMRWSD % % KUMRWSD % % KUMRWSD %.7 00% KUMRWSD % % KUMRWSD % % KUMRWSD % % KUMRWSD % % KUMRWSD % % KUMRWSD % % KUMRWSD % % KUMRWSD % % KUMRWSD % % KUMRWSD % % KUMRWSD % % KUMRWSD % % KUMRWSD % % KUMRWSD % % KUMRWSD % % KUMRWSD %.3 99% KUMRWSD % % KUMRWSD % % KUMRWSD % % KUMRWSD % % KUMRWSD % % KUMRWSD % % KUMRWSD % % KUMRWSD % % KUMRWSD % % KUMRWSD % % KUMRWSD % % KUMRWSD % % KUMRWSD % % KUMRWSD % % KUMRWSD % % KUMRWSD %.7 00% KUMRWSD % % KUMRWSD % % KUMRWSD % % KUMRWSD % % KUMRWSD % % KUMRWSD % % KUMRWSD % % KUMRWSD % % 20 UF Redflag 67
68 Key Map ID # Total ed Area Upland (UF) Area 2006 SHEG* area in UF 2006 % of UF at SHEG* 2006 UF Redflag 20 UF SHEG* area 20 % of UF at SHEG* Watershed** KUMR Group KUMRWSD % % KUMRWSD % % KUMRWSD % % KUMRWSD % % KUMRWSD % % KUMRWSD % % KUMRWSD % % KUMRWSD % % KUMRWSD % 4 00% KUMRWSD % 7. 00% KUMRWSD % 0 00% KUMRWSD % % KUMRWSD % % KUMRWSD % % KUMRWSD % % KUMRWSD % % KUMRWSD % 5 00% KUMRWSD % % KUMRWSD % % KUMRWSD % % KUMRWSD % % KUMRWSD % % KUMRWSD % % KUMRWSD %.3 00% KUMRWSD % % KUMRWSD % % KUMRWSD % % KUMRWSD % % KUMRWSD % % KUMRWSD % % KUMRWSD % % KUMRWSD % % KUMRWSD % % KUMRWSD % % KUMRWSD % % KUMRWSD % % KUMRWSD % % KUMRWSD % % KUMRWSD % % KUMRWSD % % KUMRWSD % % KUMRWSD % % KUMRWSD % % KUMRWSD % % KUMRWSD % % KUMRWSD % % KUMRWSD % % KUMRWSD % % KUMRWSD % % KUMRWSD % % KUMRWSD % % KUMRWSD % % KUMRWSD % % KUMRWSD % % KUMRWSD % 2. 00% KUMRWSD % % KUMRWSD % % KUMRWSD % % KUMRWSD % % KUMRWSD % % KUMRWSD % % 20 UF Redflag
69 Key Map ID # Total ed Area Upland (UF) Area 2006 SHEG* area in UF 2006 % of UF at SHEG* 2006 UF Redflag 20 UF SHEG* area 20 % of UF at SHEG* Watershed** KUMR Group KUMRWSD % % KUMRWSD % % KUMRWSD % % KUMRWSD % % * SHEG = Surrogate Hydrologically Effective Greenup ** From :,000 Watershed Atlas 20 UF Redflag Table 6g: Amount of Functioning Riparian LNAR watershed group Target: At least 70% of Upland is hydrologically greened-up Key Total Upland 2006 SHEG* 2006 % Map ID ed (UF) area in UF of UF at 2006 UF # Area Area SHEG* Redflag 20 UF SHEG* area 20 % of UF at SHEG* Watershed** LNAR Group LNARWSD % % LNARWSD % % LNARWSD % % * SHEG = Surrogate Hydrologically Effective Greenup ** From :,000 Watershed Atlas 20 UF Redflag Table 6h: Amount of Functioning Riparian LRDO watershed group Target: At least 70% of Upland is hydrologically greened-up Total Upland 2006 SHEG* 2006 % Key Map ed (UF) area in UF of UF at 2006 UF ID # Area Area SHEG* Redflag 20 UF SHEG* area 20 % of UF at SHEG* Watershed** LRDO Group LRDOWSD % % LRDOWSD % % LRDOWSD % 83 97% LRDOWSD % % LRDOWSD % % LRDOWSD % % LRDOWSD % % LRDOWSD % % LRDOWSD % % LRDOWSD % % LRDOWSD % % LRDOWSD % % LRDOWSD % % LRDOWSD % % LRDOWSD %. 90% LRDOWSD % % LRDOWSD % % LRDOWSD % % LRDOWSD % % LRDOWSD % % LRDOWSD % % LRDOWSD % 8 00% LRDOWSD % % 20 UF Redflag 69
70 Key Map ID # Total ed Area Upland (UF) Area 2006 SHEG* area in UF 2006 % of UF at SHEG* 2006 UF Redflag 20 UF SHEG* area 20 % of UF at SHEG* Watershed** LRDO Group LRDOWSD % % LRDOWSD % % LRDOWSD % % LRDOWSD % % LRDOWSD % % LRDOWSD % % LRDOWSD %.7 00% LRDOWSD % % LRDOWSD % % LRDOWSD % % LRDOWSD % % LRDOWSD % 3 00% LRDOWSD % % LRDOWSD % % LRDOWSD % % LRDOWSD % % LRDOWSD % % LRDOWSD % % LRDOWSD % % LRDOWSD % % LRDOWSD % % LRDOWSD % % LRDOWSD % % LRDOWSD % % LRDOWSD % % LRDOWSD % % LRDOWSD % 00% LRDOWSD % % LRDOWSD % % LRDOWSD % % LRDOWSD % % LRDOWSD % % LRDOWSD % % LRDOWSD % % LRDOWSD % % LRDOWSD % % LRDOWSD % % LRDOWSD % % LRDOWSD % % LRDOWSD % % LRDOWSD % % * SHEG = Surrogate Hydrologically Effective Greenup ** From :,000 Watershed Atlas 20 UF Redflag 70
71 Table 6i: Amount of Functioning Riparian LSKE watershed group Target: At least 70% of Upland is hydrologically greened-up Total Upland 2006 SHEG* 2006 % Key Map ed (UF) area in UF of UF at 2006 UF ID # Area Area SHEG* Redflag 20 UF SHEG* area 20 % of UF at SHEG* 20 UF Redflag Watershed** LSKE Group LSKEWSD % % LSKEWSD % % LSKEWSD % % LSKEWSD % % LSKEWSD % % LSKEWSD % % LSKEWSD % % LSKEWSD % % LSKEWSD % % LSKEWSD % % LSKEWSD % % LSKEWSD % % LSKEWSD % % LSKEWSD % % LSKEWSD % % LSKEWSD % % LSKEWSD % % LSKEWSD % % LSKEWSD % 8 99% LSKEWSD % % LSKEWSD % % LSKEWSD % % LSKEWSD % % LSKEWSD % % LSKEWSD % % LSKEWSD % % LSKEWSD % % LSKEWSD % % LSKEWSD % % LSKEWSD % % LSKEWSD % % LSKEWSD % % LSKEWSD % % LSKEWSD % % LSKEWSD % % LSKEWSD % % LSKEWSD % % LSKEWSD % % LSKEWSD % % LSKEWSD % % LSKEWSD % % LSKEWSD %.9 00% LSKEWSD % % LSKEWSD % % LSKEWSD % % LSKEWSD % 23 00% LSKEWSD % % LSKEWSD % % * SHEG = Surrogate Hydrologically Effective Greenup ** From :,000 Watershed Atlas 7
72 Table 6j: Amount of Functioning Riparian MBNK watershed group Target: At least 70% of Upland is hydrologically greened-up Total Upland % Key Map ed (UF) SHEG* area of UF at 2006 UF ID # Area Area in UF SHEG* Redflag 20 UF SHEG* area 20 % of UF at SHEG* Watershed** MBNK Group MBNKWSD % % MBNKWSD % % MBNKWSD % % MBNKWSD % % MBNKWSD % % MBNKWSD % 2 00% MBNKWSD % % MBNKWSD % % MBNKWSD % % MBNKWSD % % MBNKWSD % % MBNKWSD % % MBNKWSD % % MBNKWSD % % MBNKWSD % % MBNKWSD % % MBNKWSD % % MBNKWSD % % MBNKWSD % % MBNKWSD % 23 00% MBNKWSD % % MBNKWSD % % MBNKWSD % % MBNKWSD % % MBNKWSD % % MBNKWSD % % MBNKWSD % % MBNKWSD % % MBNKWSD % % MBNKWSD % % * SHEG = Surrogate Hydrologically Effective Greenup ** From :,000 Watershed Atlas 20 UF Redflag 72
73 Table 6k: Amount of Functioning Riparian NBNK watershed group Target: At least 70% of Upland is hydrologically greened-up Total Upland % Key Map ed (UF) SHEG* area of UF at 2006 UF ID # Area Area in UF SHEG* Redflag 20 UF SHEG* area 20 % of UF at SHEG* Watershed** NBNK Group NBNKWSD % % NBNKWSD % % NBNKWSD % % NBNKWSD % % NBNKWSD % % NBNKWSD % % NBNKWSD % % NBNKWSD % % NBNKWSD % % NBNKWSD % % NBNKWSD % % NBNKWSD % % NBNKWSD % % NBNKWSD % % NBNKWSD % % NBNKWSD % % NBNKWSD % % NBNKWSD % % NBNKWSD % % NBNKWSD % 47 00% NBNKWSD % % NBNKWSD % % NBNKWSD % % NBNKWSD % % NBNKWSD % % NBNKWSD % % NBNKWSD % % NBNKWSD % 8. 00% NBNKWSD % % * SHEG = Surrogate Hydrologically Effective Greenup ** From :,000 Watershed Atlas 20 UF Redflag 73
74 Table 6l: Amount of Functioning Riparian PORI watershed group Target: At least 70% of Upland is hydrologically greened-up Key Map ID # Total ed Area Upland (UF) Area 2006 SHEG* area in UF 2006 % of UF at SHEG* 2006 UF Redflag 20 UF SHEG* area 20 % of UF at SHEG* Watershed** PORI Group PORIWSD % % PORIWSD % % PORIWSD % % PORIWSD % % PORIWSD %.5 00% PORIWSD % % PORIWSD % % PORIWSD % % PORIWSD % % PORIWSD % % PORIWSD % % PORIWSD % % PORIWSD % % PORIWSD % % PORIWSD % % PORIWSD % % PORIWSD % % PORIWSD % % PORIWSD % % PORIWSD % % PORIWSD % % PORIWSD % % PORIWSD % % PORIWSD % % PORIWSD % % PORIWSD % % PORIWSD % % PORIWSD % % PORIWSD % % PORIWSD % % PORIWSD % % PORIWSD % % PORIWSD % % PORIWSD % % PORIWSD % % PORIWSD % % PORIWSD % % PORIWSD % % PORIWSD % % PORIWSD % % PORIWSD % 2. 00% PORIWSD % % PORIWSD % % PORIWSD % % PORIWSD % % PORIWSD % % PORIWSD % % PORIWSD % % PORIWSD % % PORIWSD % % PORIWSD % % PORIWSD %.0 00% * SHEG = Surrogate Hydrologically Effective Greenup ** From :,000 Watershed Atlas 20 UF Redflag 74
75 Table 6m: Amount of Functioning Riparian WORC watershed group Target: At least 70% of Upland is hydrologically greened-up Key Total Upland % Map ID ed (UF) SHEG* area of UF at 2006 UF # Area Area in UF SHEG* Redflag 20 UF SHEG* area 20 % of UF at SHEG* UF Redflag Watershed** WORC Group WORCWSD % % WORCWSD % % WORCWSD % % WORCWSD % % WORCWSD % % WORCWSD % % WORCWSD % % WORCWSD % % WORCWSD % % WORCWSD % % WORCWSD % % WORCWSD % % WORCWSD % % WORCWSD % % WORCWSD % % WORCWSD % % WORCWSD % % WORCWSD % % WORCWSD % % WORCWSD % % WORCWSD % % WORCWSD % % WORCWSD % % WORCWSD % % WORCWSD % % WORCWSD % % WORCWSD % % WORCWSD % % WORCWSD % % WORCWSD % % WORCWSD % % WORCWSD % % WORCWSD % % WORCWSD % % WORCWSD % % WORCWSD %.3 67% WORCWSD % % WORCWSD % % WORCWSD % % WORCWSD % % WORCWSD % % WORCWSD % % WORCWSD % % WORCWSD % % WORCWSD % % WORCWSD % % WORCWSD % % WORCWSD %.2 99% WORCWSD % % WORCWSD % % WORCWSD % % WORCWSD % % WORCWSD % % WORCWSD % % WORCWSD % % WORCWSD % 88% WORCWSD % %
76 Key Map ID # Total ed Area Upland (UF) Area 2006 SHEG* area in UF 2006 % of UF at SHEG* 2006 UF Redflag 20 UF SHEG* area 20 % of UF at SHEG* UF Redflag Watershed** WORC Group WORCWSD % % WORCWSD % % WORCWSD % % WORCWSD %.4 85% WORCWSD % % WORCWSD % % WORCWSD % % WORCWSD % % WORCWSD % % WORCWSD % % WORCWSD % % WORCWSD % % WORCWSD % % WORCWSD % % WORCWSD % % WORCWSD % % WORCWSD % % WORCWSD % 2. 00% WORCWSD % % WORCWSD % % WORCWSD % % WORCWSD % % WORCWSD % % WORCWSD % % WORCWSD % % WORCWSD % % WORCWSD % % WORCWSD % % WORCWSD % % WORCWSD % % WORCWSD % 4. 83% WORCWSD % 6. 00% WORCWSD % % WORCWSD % % WORCWSD % % WORCWSD % % WORCWSD % % WORCWSD % % WORCWSD % % WORCWSD % % WORCWSD % % WORCWSD % % WORCWSD % % WORCWSD % % WORCWSD % % WORCWSD % % WORCWSD % % WORCWSD %.9 98% WORCWSD % % WORCWSD % % WORCWSD % % WORCWSD % % WORCWSD % % WORCWSD % % WORCWSD % % WORCWSD %.3 00% WORCWSD % % WORCWSD % % WORCWSD % % * SHEG = Surrogate Hydrologically Effective Greenup ** From :,000 Watershed Atlas

77 77
78 78
79 79
Northwest Timberlands
 Seral Stage and Patch Size Distribution Analyses for the North Coast Timber Supply Area March 25, 2008 Funded by: Forest Investment Account through Triumph Timber Ltd. Project # 6609001 Contract Admin
Northwest Timberlands
 Update to the Seral Stage and Patch Size Distribution Analyses for the North Coast Timber Supply Area to reflect the March 27, 2009 Amendment to the Central and North Coast Order November 30, 2009 Funded
Kingcome Timber Supply Area Economic Operability Assessment
 Kingcome Timber Supply Area Economic Operability Assessment Prepared for: Kingcome TSA Licensees Prepared by: Timberline Forest Inventory Consultants Vancouver, B.C. Contact: Jerry Miehm, Senior Resource
Robson Valley Avalanche Tract Mapping Project
 Robson Valley Avalanche Tract Mapping Project Prepared for: Chris Ritchie Ministry of Water Land and Air Protection 325 1011 4th Avenue Prince George, BC. V2L3H9 and Dale Seip Ministry of Forests 1011
FINGER-TATUK PROVINCIAL PARK
 FINGER-TATUK PROVINCIAL PARK PURPOSE STATEMENT AND ZONING PLAN March 2003 FINGER-TATUK PROVINCIAL PARK Purpose Statement and Zoning Plan Finger-Tatuk Provincial Park is 17,151 ha in size. It includes the
White Mountain National Forest Saco Ranger District
 United States Department of Agriculture Forest Service White Mountain National Forest 33 Kancamagus Highway Conway, NH 03818 Comm: (603) 447-5448 TTY: (603) 447-3121 File Code: 1950 Date: February 26,
Labrador - Island Transmission Link Target Rare Plant Survey Locations
 27-28- Figure: 36 of 55 29-28- Figure: 37 of 55 29- Figure: 38 of 55 #* Figure: 39 of 55 30- - east side Figure: 40 of 55 31- Figure: 41 of 55 31- Figure: 42 of 55 32- - secondary Figure: 43 of 55 32-
Classifications, Inventory and Level of Service
 Classifications, Inventory and Level of Service Section 3 Kenmore Park, Recreation and Open Space Plan 1 P a g e Classifications and Inventory Park Classifications Kenmore classifies its parks based upon
AURORA WILDLIFE RESEARCH
 AURORA WILDLIFE RESEARCH Kim Poole 2305 Annable Rd. Nelson, BC, V1L 6K4 Canada Tel: (250) 825-4063; Fax: (250) 825-4073 e-mail: klpoole@shaw.ca 27 April 2005 Mike Gall Conservation Specialist and Glenn
Analysing data on protected areas
 Analysing data on protected areas International goals The OECD is developing an improved method to generate more detailed indicators on protected areas, both terrestrial and marine, for countries across
Rainfall Appendix. Summary Statistics of Rainfall Data for Sites in the West-Central Florida. A Simple Conceptualized Rainfall/Discharge Relationship
 Rainfall Appendix Summary Statistics of Rainfall Data for Sites in the West-Central Florida A Simple Conceptualized Rainfall/Discharge Relationship Stream or river flows are, of course, integrally associated
State of Nature 2016
 State Nature 2016 State Nature 2016 Results look up tables This document presents tables the results referred to in the report in an easy to access format. All data presented here feature in the report
Okanagan Shuswap LRMP
 Okanagan Shuswap LRMP Draft Terms of Reference for the OGMA Advisory Committees July 5, 2001 (Draft #3) Introduction As part of the Cabinet approved objectives and strategies contained in the Okanagan
Bayview Escarpment. Interim Management Statement
 Bayview Escarpment Interim Management Statement Bayview Escarpment Provincial Nature Reserve Interim Management Statement January 15, 1995 REGIONAL DIRECTOR'S APPROVAL STATEMENT This Interim Management
ATM Network Performance Report
 ATM Network Performance Report 2019 Page 1 of 20 Table of contents Summary... 3 Network Wide Performance... 4 Airborne delay... 4 Sydney... 7 Airborne delay... 7 Notable events... 7 CTOT (Calculated take
(Also known as the Den-Ice Agreements Program) Evaluation & Advisory Services. Transport Canada
 Evaluation & Advisory Services. Transport Canada") Evaluation of Transport Canada s Program of Payments to Other Government or International Agencies for the Operation and Maintenance of Airports, Air Navigation, and Airways Facilities (Also known as the
Evaluation of Transport Canada s Program of Payments to Other Government or International Agencies for the Operation and Maintenance of Airports, Air Navigation, and Airways Facilities (Also known as the
BLANKET CREEK PROVINCIAL PARK
 BLANKET CREEK PROVINCIAL PARK PURPOSE STATEMENT AND ZONING PLAN February 2003 BLANKET CREEK PROVINCIAL PARK Purpose Statement and Zoning Plan Primary Role The primary role of Blanket Creek Park is to maintain
MANAGEMENT DIRECTION STATEMENT March 2003
 Skeena Region MAAGEMET DIRECTIO STATEMET March 2003 for Meziadin Lake Provincial Park Ministry of Water, Land and Air Protection Environmental Stewardsh Division This page left blank on purpose ii Table
A GIS Analysis of Probable High Recreation Use Areas in Three Sisters Wilderness Deschutes and Willamette National Forests
 Lindsey Kiesz Geo 565 Term Project 3/15/2010 A GIS Analysis of Probable High Recreation Use Areas in Three Sisters Wilderness Deschutes and Willamette National Forests Introduction The Three Sisters Wilderness
Lake Trout Population Assessment Wellesley Lake 1997, 2002, 2007
 Lake Trout Population Assessment Wellesley Lake Prepared by: Lars Jessup Fish and Wildlife Branch November 2009 Lake Trout Population Assessment Wellesley Lake Yukon Fish and Wildlife Branch TR-09-01 Acknowledgements
CHAPTER 1 EXECUTIVE SUMMARY
 CHAPTER 1 EXECUTIVE SUMMARY 1 1 EXECUTIVE SUMMARY INTRODUCTION William R. Fairchild International Airport (CLM) is located approximately three miles west of the city of Port Angeles, Washington. The airport
PPCR/SC.4/5 October 9, Meeting of the PPCR Sub-Committee Washington, D.C. October 28, REVIEW OF ON-GOING WORK OF THE MDBs IN DJIBOUTI
 PPCR/SC.4/5 October 9, 2009 Meeting of the PPCR Sub-Committee Washington, D.C. October 28, 2009 REVIEW OF ON-GOING WORK OF THE MDBs IN DJIBOUTI Proposed Sub-Committee Decision The Sub-Committee reviewed
Tolko Industries Ltd. Southern Interior Forest Stewardship Plan
 Tolko Industries Ltd. Southern Interior Forest Stewardship Plan Thompson/Okanagan Forest Region Thompson Rivers Forest District Kamloops TSA Cascades Forest District Merritt TSA Okanagan-Shuswap Forest
PRIORITY HABITAT SURVEY 2017 SWALEDALE. Summary. July 2018
 PRIORITY HABITAT SURVEY 2017 SWALEDALE Summary July 2018 Conservation & Monitoring Report No: Lead Author(s): Tony Serjeant & Sue Thurley Incorporating comments from: Gary Smith & Gordon Haycock (16/07/18)
OCTOPUS ISLANDS PROVINCIAL PARK
 OCTOPUS ISLANDS PROVINCIAL PARK PURPOSE STATEMENT AND ZONING PLAN February 2003 OCTOPUS ISLANDS PROVINCIAL PARK Purpose Statement and Zoning Plan Primary Role The primary role of Octopus Islands Park is
APPENDIX 18-D 2010 AND 2011 MOUNTAIN GOAT AERIAL SURVEYS, BRUCEJACK PROJECT
 APPENDIX 18-D 2010 AND 2011 MOUNTAIN GOAT AERIAL SURVEYS, BRUCEJACK PROJECT TM 1. Introduction Mountain goat (Oreamnos americanus) surveys were conducted for the Brucejack Project in 2010 and 2011. The
RESEARCH AND PLANNING FORT STEELE HERITAGE TOWN VISITOR STUDY 2007 RESULTS. May 2008
 RESEARCH AND PLANNING FORT STEELE HERITAGE TOWN VISITOR STUDY 2007 RESULTS May 2008 Research and Planning Tourism British Columbia 300-1803 Douglas St. Box 9830 Stn. Prov. Gov t. Victoria, BC V8W 9W5 Web:
Draft Protocol for Monitoring the Effectiveness of Mountain Goat Winter Ranges
 Draft Protocol for Monitoring the Effectiveness of Mountain Goat Winter Ranges DRAFT Version 1.0 March 2009 DRAFT Protocol for Monitoring the Effectiveness of Mountain Goat Winter Ranges 1 Citation: Province
D IRECTION S TATEMENT
 Vancouver Island Region M AAGEMET D IRECTIO S TATEMET September 2003 for Woss Lake Provincial Park Ministry of Water, Land an Air Protection Environmental Stewardship Division Woss Lake Provincial Park
METROPOLITAN COUNCIL 390 North Robert Street, St. Paul, MN Phone (651) TDD (651)
 TDD (651)") DATE: March 27, 2012 METROPOLITAN COUNCIL 390 North Robert Street, St. Paul, MN 55101 Phone (651) 602-1000 TDD (651) 291-0904 TO: Metropolitan Parks and Open Space Commission FROM: Arne Stefferud, Planning
DATE: March 27, 2012 METROPOLITAN COUNCIL 390 North Robert Street, St. Paul, MN 55101 Phone (651) 602-1000 TDD (651) 291-0904 TO: Metropolitan Parks and Open Space Commission FROM: Arne Stefferud, Planning
ANAGEMENT P LAN. February, for Elk Lakes and Height of the Rockies Provincial Parks. Ministry of Environment, Lands and Parks BC Parks Division
 M ANAGEMENT P LAN February, 1999 for Elk Lakes and Height of the Rockies Provincial Parks Ministry of Environment, Lands and Parks BC Parks Division Elk Lakes & Height of the Rockies Provincial Parks M
Chapter 9: National Parks and Protected Areas
 Part 9.1 Torngat Mountains National Park Reserve 9.1.1 The area set out in the Map Atlas (shown for illustrative purposes only in schedule 9-A) and described in appendix D-2 shall become a National Park
Nakina Moraine Provincial Park. Interim Management Statement. Ontario. Ministry of Natural Resources
 Nakina Moraine Provincial Park Interim Management Statement Ontario Ministry of Natural Resources 1999, Queen's Printer for Ontario Printed in Ontario, Canada Additional copies of this publication can
2004 SOUTH DAKOTA MOTEL AND CAMPGROUND OCCUPANCY REPORT and INTERNATIONAL VISITOR SURVEY
 2004 SOUTH DAKOTA MOTEL AND CAMPGROUND OCCUPANCY REPORT and INTERNATIONAL VISITOR SURVEY Prepared By: Center for Tourism Research Black Hills State University Spearfish, South Dakota Commissioned by: South
Water Quality Trends for Patchogue Bay
 Water Quality Trends for Patchogue Bay 2018 This report summarizes water quality data for fecal coliform and total coliform in Patchogue Bay for the years 2003-2017. Prepared by: Brian M. McCaffrey Stormwater
D IRECTION S TATEMENT
 Vancouver Island Region M ANAGEMENT D IRECTION S TATEMENT September 2003 for Lower Nimpkish Provincial Park Ministry of Water, Land and Air Protection Environmental Stewardship Lower Nimpkish Provincial
Bridge River Delta Park. Management Plan. Final Public Review Draft
 Bridge River Delta Park Management Plan Final Public Review Draft March 2016 Bridge River Delta Park Management Plan Approved by: Jeff Leahy Regional Director Thompson Cariboo Region BC Parks Date Brian
White Mountain National Forest Saco Ranger District
 United States Department of Agriculture Forest Service White Mountain National Forest Saco Ranger District 33 Kancamagus Highway Conway, NH 03818 Comm: (603) 447-5448 TTY: (603) 447-3121 File Code: 1950
Project No Brent Cross, Cricklewood London, UK Phase 1A North RMA
 Project No. 431679 Brent Cross, Cricklewood London, UK Phase 1A North RMA River Overshadowing Impact Study For Waterman Energy, Environment & Design 18 th November 2014 431679 Report 2 Rel.3 1 of 23 431679rep2v3.docx
Guidance for Usage of Issue Papers
 Circular No. 1-304 Guidance for Usage of Issue Papers September 30, 2005 June 30, 2011 First issued Amended Airworthiness Division, Aviation Safety and Security Department Japan Civil Aviation Bureau Ministry
FORT LAUDERDALE-HOLLYWOOD INTERNATIONAL AIRPORT ENVIRONMENTAL IMPACT STATEMENT DRAFT
 D.3 RUNWAY LENGTH ANALYSIS Appendix D Purpose and Need THIS PAGE INTENTIONALLY LEFT BLANK Appendix D Purpose and Need APPENDIX D.3 AIRFIELD GEOMETRIC REQUIREMENTS This information provided in this appendix
Hermosa Area Preservation The Colorado Trail Foundation 4/11/2008
 Hermosa Area Preservation The Colorado Trail Foundation 4/11/2008 Legend d o Tr ail NPA - National Protection Area ra NCA - National Conservation Area o e C Th The Colorado Trail lo FS inventoried Roadless
Accommodation Survey: November 2009
 Embargoed until 10:45am 19 January 2010 Accommodation Survey: November 2009 Highlights Compared with November 2008: International guest nights were up 2 percent, while domestic guest nights were down 1
APPENDIX 3-I-B. Alternative Route Assessment Around Provincial Parks and Conservation Reserves
 EAST-WEST TIE TRANSMISSION PROJECT ENVIRONMENTAL ASSESSMENT REPORT APPENDIX 3-I-B Alternative Route Assessment Around Provincial Parks and Conservation Reserves Report No. 1536607/2000/2018 TABLE OF CONTENTS
Appendix B Ultimate Airport Capacity and Delay Simulation Modeling Analysis
 Appendix B ULTIMATE AIRPORT CAPACITY & DELAY SIMULATION MODELING ANALYSIS B TABLE OF CONTENTS EXHIBITS TABLES B.1 Introduction... 1 B.2 Simulation Modeling Assumption and Methodology... 4 B.2.1 Runway
Bill S-5: An Act to amend the Canada National Parks Act (Nááts ihch oh National Park Reserve of Canada)
") Bill S-5: An Act to amend the Canada National Parks Act (Nááts ihch oh National Park Reserve of Canada) Publication No. 41-2-S5-E 16 May 2014 Revised 22 October 2014 Penny Becklumb Tim Williams Economics,
Bill S-5: An Act to amend the Canada National Parks Act (Nááts ihch oh National Park Reserve of Canada) Publication No. 41-2-S5-E 16 May 2014 Revised 22 October 2014 Penny Becklumb Tim Williams Economics,
MARBLE RIVER PROVINCIAL PARK
 MARBLE RIVER PROVINCIAL PARK PURPOSE STATEMENT AND ZONING PLAN March 2003 MARBLE RIVER PROVINCIAL PARK Purpose Statement and Zoning Plan Primary Role The primary role of Marble River Park is to protect
Official Journal of the European Union L 7/3
 12.1.2010 Official Journal of the European Union L 7/3 COMMISSION REGULATION (EU) No 18/2010 of 8 January 2010 amending Regulation (EC) No 300/2008 of the European Parliament and of the Council as far
Open Report on behalf of Richard Wills Executive Director for Communities. Planning and Regulation Committee. County Matter Application - S38/0590/13
 Agenda Item 5.10 Report Reference: 5.10 Regulatory and Other Committee Open Report on behalf of Richard Wills Executive Director for Communities Report to: Planning and Regulation Committee Date: 10 June
SPECTACLE LAKE PROVINCIAL PARK PURPOSE STATEMENT AND ZONING PLAN
 SPECTACLE LAKE PROVINCIAL PARK PURPOSE STATEMENT AND ZONING PLAN August 2003 1 SPECTACLE LAKE PROVINCIAL PARK Purpose Statement and Zoning Plan Primary Role The primary role of Spectacle Lake Park is to
Peace Region. MANAGEMENT Plan. January for Toad River Hot Springs Provincial Park. Ministry of Environment. Environmental Stewardship Division
 Peace Region MANAGEMENT Plan January 2009 for Toad River Hot Springs Provincial Park Ministry of Environment Environmental Stewardship Division Toad River Hot Springs Park Approvals Page Forward This management
Longmont to Boulder Regional Trail Jay Road Connection DRAFT FINAL REPORT
 Longmont to Boulder Regional Trail Jay Road Connection DRAFT FINAL REPORT December 2018 Project Summary Boulder County, Colorado, in partnership with the City of Boulder, is evaluating options for multi-use
Bradley Brook Relocation Project. Scoping Notice. Saco Ranger District. United States Department of Agriculture Forest Service
 Bradley Brook Relocation Project United States Department of Agriculture Forest Service Scoping Notice White Mountain National Forest February 2011 For Information Contact: Jenny Burnett White Mountain
SUGARBOWL-GRIZZLY DEN PROVINCIAL PARK AND SUGARBOWL-GRIZZLY DEN PROTECTED AREA Purpose Statement and Zoning Plan
 SUGARBOWL-GRIZZLY DEN PROVINCIAL PARK AND SUGARBOWL-GRIZZLY DEN PROTECTED AREA Purpose Statement and Zoning Plan Located one hour east of Prince George on Highway 16, Sugarbowl-Grizzly Den Provincial Park
LEAFLET FEBRUARY. WWF-Greater Mekong DAWNA TENASSERIM LANDSCAPE. Wayuphong Jitvijak / WWF-Thailand
 LEAFLET FEBRUARY 2014 WWF-Greater Mekong Wayuphong Jitvijak / WWF-Thailand DAWNA TENASSERIM LANDSCAPE The landscape includes 30,539km2 of protected areas and nearly 50,000km2 of wilderness area, providing
Decision Memo for Desolation Trail: Mill D to Desolation Lake Trail Relocation
 for Salt Lake County, Utah Uinta-Wasatch-Cache National Forest Salt Lake Ranger District 1. Background The present location of the Desolation Trail (#1159) between Mill D and Desolation Lake follows old
GUERNSEY ADVISORY CIRCULARS. (GACs) EXTENDED DIVERSION TIME OPERATIONS GAC 121/135-3
 EXTENDED DIVERSION TIME OPERATIONS GAC 121/135-3") GUERNSEY ADVISORY CIRCULARS (GACs) GAC 121/135-3 EXTENDED DIVERSION TIME OPERATIONS Published by the Director of Civil Aviation, Guernsey First Issue August 2018 Guernsey Advisory Circulars (GACs) are
GUERNSEY ADVISORY CIRCULARS (GACs) GAC 121/135-3 EXTENDED DIVERSION TIME OPERATIONS Published by the Director of Civil Aviation, Guernsey First Issue August 2018 Guernsey Advisory Circulars (GACs) are
MONTEREY REGIONAL AIRPORT MASTER PLAN TOPICAL QUESTIONS FROM THE PLANNING ADVISORY COMMITTEE AND TOPICAL RESPONSES
 MONTEREY REGIONAL AIRPORT MASTER PLAN TOPICAL QUESTIONS FROM THE PLANNING ADVISORY COMMITTEE AND TOPICAL RESPONSES Recurring topics emerged in some of the comments and questions raised by members of the
Jumbo Glacier Resort Master Plan. Appendix 3-K
 Jumbo Glacier Resort Master Plan Appendix 3-K Letter re: Review of M. Austin s Analysis Report: Potential Impacts of the Proposed JGR on the Central Purcell Grizzly Bear Population Prepared by ENKON Environmental
Keeping Wilderness Wild: Increasing Effectiveness With Limited Resources
 Keeping Wilderness Wild: Increasing Effectiveness With Limited Resources Linda Merigliano Bryan Smith Abstract Wilderness managers are forced to make increasingly difficult decisions about where to focus
CITY OF LYNDEN STORMWATER MANAGEMENT PROGRAM REPORT MARCH 1, 2016
 CITY OF LYNDEN STORMWATER MANAGEMENT PROGRAM 2015 WATER QUALITY MONITORING REPORT CITY OF LYNDEN 300 4 TH STREET LYNDEN, WASHINGTON 98264 PHONE (360) 354-3446 MARCH 1, 2016 This document serves as an attachment
Defining housing markets using postcode sectors
 Defining housing markets using postcode sectors 8.1 Introduction...1 8.2 The results for Jan to Mar 2006...1 Cambridge City...1 East Cambridgeshire...1 Fenland...2 Forest Heath...2 Huntingdonshire...3
Visitor Use Computer Simulation Modeling to Address Transportation Planning and User Capacity Management in Yosemite Valley, Yosemite National Park
 Visitor Use Computer Simulation Modeling to Address Transportation Planning and User Capacity Management in Yosemite Valley, Yosemite National Park Final Report Steve Lawson Brett Kiser Karen Hockett Nathan
TONGASS NATIONAL FOREST
 TONGASS NATIONAL FOREST UNITED STATES DEPARTMENT OF AGRICULTURE-FOREST SERVICE Contact: Dennis Neill Phone: 907-228-6201 Release Date: May 17, 2002 SEIS Questions and Answers Q. Why did you prepare this
Role of the Protected Area
 Role of the Protected Area Provincial and Regional Context Height of the Rockies and Elk Lakes provincial parks lie in southeastern British Columbia in the Rocky Mountains, about 85 km southwest of Calgary,
SLIM CREEK PROVINCIAL PARK
 SLIM CREEK PROVINCIAL PARK PURPOSE STATEMENT AND ZONING PLAN March 2003 1 Slim Creek Provincial Park Purpose Statement and Zoning Plan Slim Creek Provincial Park is located along Highway 16, approximately
Zambia. January About this Report and the World Database on Protected Areas (WDPA)
") WDPA Data Status Report About this Report and the World Database on Protected Areas (WDPA) Map showing protected areas in the WDPA Zambia January 2015 The WDPA is the most comprehensive global dataset
WDPA Data Status Report About this Report and the World Database on Protected Areas (WDPA) Map showing protected areas in the WDPA Zambia January 2015 The WDPA is the most comprehensive global dataset
5.0 OUTDOOR RECREATION OPPORTUNITIES AND MANAGEMENT
 5.0 OUTDOOR RECREATION OPPORTUNITIES AND MANAGEMENT 5.1 Introduction This section describes the range of recreational activities that currently take place in Marble Range and Edge Hills Parks, as well
GOLDEN BACKCOUNTRY RECREATION ADVISORY COMMITTEE (GBRAC)
") GOLDEN BACKCOUNTRY RECREATION ADVISORY COMMITTEE (GBRAC) MINUTES from November 1, 2006 Meeting Attending: Sector / Stakeholder GBRAC Commercial Aerial Motorized Sector GBRAC Habitat Protection; Sport Fishing
GOLDEN BACKCOUNTRY RECREATION ADVISORY COMMITTEE (GBRAC) MINUTES from November 1, 2006 Meeting Attending: Sector / Stakeholder GBRAC Commercial Aerial Motorized Sector GBRAC Habitat Protection; Sport Fishing
Decision Memo Ice Age Trail Improvement (CRAC 37)
") Decision Memo Ice Age Trail Improvement (CRAC 37) U.S. Forest Service Chequamegon-Nicolet National Forest, Medford-Park Falls Ranger District Taylor County, Wisconsin T32N, R2W, Town of Grover, Section
Decision Memo Ice Age Trail Improvement (CRAC 37) U.S. Forest Service Chequamegon-Nicolet National Forest, Medford-Park Falls Ranger District Taylor County, Wisconsin T32N, R2W, Town of Grover, Section
Section II. Planning & Public Process Planning for the Baker/Carver Regional Trail began in 2010 as a City of Minnetrista initiative.
 Section II Planning & Public Process Planning for the began in 2010 as a City of initiative. city staff began discussions with the Park District on the possibility of a north/south regional trail connection
Mackinnon Esker Ecological Reserve Draft - Management Plan
 Mackinnon Esker Ecological Reserve Draft - Management Plan May 2011 Photo Credit: This document replaces the direction provided in the Carp Lake Provincial Park and Protected Area and Mackinnon Esker Ecological
UC Berkeley Working Papers
 UC Berkeley Working Papers Title The Value Of Runway Time Slots For Airlines Permalink https://escholarship.org/uc/item/69t9v6qb Authors Cao, Jia-ming Kanafani, Adib Publication Date 1997-05-01 escholarship.org
The Nunavik Inuit Land Claims Agreement Impact Assessment Process. Presented at the Kuujjuaq Mining Forum, April 2017.
 The Nunavik Inuit Land Claims Agreement Impact Assessment Process Presented at the Kuujjuaq Mining Forum, April 2017. The Nunavik Inuit Land Claims Agreement The Nunavik Inuit Land Claims Agreement (NILCA)
Tourism and Recreation Strategy for Protection Areas in Gitga at Territory Draft 2 for Discussion. Table of Contents
 TOURISM AND RECREATION STRATEGY FOR PROTECTION AREAS IN GITGA AT TERRITORY Draft 3 February 2004 Table of Contents TABLE OF CONTENTS...II LIST OF TABLES...III LIST OF FIGURES...III 1 INTRODUCTION...1 1.1
CONTACT: Investor Relations Corporate Communications
 NEWS RELEASE CONTACT: Investor Relations Corporate Communications 435.634.3200 435.634.3553 Investor.relations@skywest.com corporate.communications@skywest.com SkyWest, Inc. Announces Fourth Quarter 2017
Final. Hydroacoustic and Airborne Monitoring at the Naval Station. Mayport Interim Report June 2015
 Final Hydroacoustic and Airborne Monitoring at the Naval Station Submitted to: Naval Facilities Engineering Command Atlantic under HDR Environmental, Operations and Construction, Inc. Contract No. N62470-10-D-3011,
Appendix N MAINTENANCE DREDGING STATEMENT OF NEED & PERMIT COMPLIANCE. North Thousand Islands Management Plan Appendices
 Appendix N MAINTENANCE DREDGING STATEMENT OF NEED & PERMIT COMPLIANCE North Thousand Islands Management Plan Appendices Maintenance Dredging Statement of Need & Permit Compliance The waterways, which consist
Open Report on behalf of Richard Wills, Executive Director for Environment and Economy
 Agenda Item 7 Executive Open Report on behalf of Richard Wills, Executive Director for Environment and Economy Report to: Executive Date: 02 September 2014 Subject: Lincoln East West Link Road Phase 1
Decision Memo Broken Wheel Ranch Equestrian Outfitter Special-Use Permit Proposed Action
 Decision Memo Broken Wheel Ranch Equestrian Outfitter Special-Use Permit USDA Forest Service Mississippi Bluffs Ranger District, Shawnee National Forest Jackson and Union Counties, Illinois Proposed Action
Licence Application Decision ICB Simplified Process
 Licence Application Decision ICB Simplified Process Application # 2361-18 Applicant Silver City Stagelines Ltd. Principals Address Fritz Keller 1283 Columbia Ave, Trail, BC, V1R 1J3 Current Licence Passenger
Michipicoten Island Regional Plan
 Michipicoten Island Regional Plan This is one of twenty Regional Plans that support implementation of the Lake Superior Biodiversity Conservation Strategy (Strategy). The Strategy, prepared and overseen
Kwadacha Wilderness Provincial Park and Kwadacha Addition (Kwadacha Recreation Area) Purpose Statement and Zoning Plan
 Purpose Statement and Zoning Plan") Kwadacha Wilderness Provincial Park and Kwadacha Addition (Kwadacha Recreation Area) Purpose Statement and Zoning Plan Located in a remote area of the northern interior of BC, this large park straddles
Kwadacha Wilderness Provincial Park and Kwadacha Addition (Kwadacha Recreation Area) Purpose Statement and Zoning Plan Located in a remote area of the northern interior of BC, this large park straddles
Draft Concept Alternatives Analysis for the Inaugural Airport Program September 2005
 Draft Concept Alternatives Analysis for the Inaugural Airport Program September 2005 Section 1 - Introduction This report describes the development and analysis of concept alternatives that would accommodate
Longlac North Conservation Reserve (C2207) Statement of Conservation Interest
 Statement of Conservation Interest") Longlac North Conservation Reserve (C2207) Statement of Conservation Interest April 2003 Prepared for the Ontario Ministry of Natural Resources, Northwest Region by Rebecca Zeran and Natalie Kolody OLL
Longlac North Conservation Reserve (C2207) Statement of Conservation Interest April 2003 Prepared for the Ontario Ministry of Natural Resources, Northwest Region by Rebecca Zeran and Natalie Kolody OLL
Southwest Island Public Advisory Group (SIPAG) Meeting Minutes
 Meeting Minutes") Call to order Southwest Island Public Advisory Group (SIPAG) Meeting Minutes Kirstin Campbell, Environmental Programs Advisor, welcomed members of the Southwest Island Public Advisory Group at the Shaker
Call to order Southwest Island Public Advisory Group (SIPAG) Meeting Minutes Kirstin Campbell, Environmental Programs Advisor, welcomed members of the Southwest Island Public Advisory Group at the Shaker
The following criteria were used to identify Benchmark Areas:
 7.0 BENCHMARK AREAS The Churn Creek Protected Area offers a significant opportunity to learn more about how grassland ecosystems function. One of the key tools that will be used to monitor larger grassland
MANAGEMENT DIRECTION STATEMENT March 2003
 Skeena Region MAAGEMET DIRECTIO STATEMET March 2003 for Lowe Inlet Marine Provincial Park Ministry of Water, Land and Air Protection Environmental Stewardshi Division This page left blank on purpose
DECISION MEMO. Rawhide Trail #7073 Maintenance and Reconstruction
 Page 1 of 6 Background DECISION MEMO USDA Forest Service Jefferson Ranger District Jefferson County, Montana Rawhide Trail #7073 is located in the Elkhorn Mountain Range approximately 10 miles east of
2012 In-Market Research Report. Kootenay Rockies
 2012 In-Market Research Report Kootenay Rockies Executive Summary This report summarizes key highlights for the Kootenay Rockies (KR) region taken from the British Columbia In-Market study conducted in
Analysis of en-route vertical flight efficiency
 Analysis of en-route vertical flight efficiency Technical report on the analysis of en-route vertical flight efficiency Edition Number: 00-04 Edition Date: 19/01/2017 Status: Submitted for consultation
Boyne Valley Provincial Park. Interim Management Statement
 Boyne Valley Provincial Park Interim Management Statement January 20, 1995 REGIONAL DIRECTOR'S APPROVAL STATEMENT This Interim Management Statement will provide interim direction for the management of
ONE ISLAND LAKE PROVINCIAL PARK Purpose Statement and Zoning Plan
 ONE ISLAND LAKE PROVINCIAL PARK Purpose Statement and Zoning Plan Primary Role The primary role of One Island Lake Provincial Park is to provide recreational opportunities to regional and residential area
Partnership for Quieter Skies Report
 Ft. Lauderdale-Hollywood International Airport Prepared by: March 2008 Partnership for Quieter Skies Report The Partnership for Quieter Skies Report provides an overview of progress of efforts to reduce
MANAGEMENT DIRECTION STATEMENT June, 1999
 Garibaldi/Sunshine Coast District MAAGEMET DIRECTIO STATEMET June, 1999 for Homathko Estuary Provincial Park Ministry of Environment Lands and Parks BC Parks Division TABLE OF COTETS Introduction...1
Recreational Carrying Capacity
 9 th Annual Caribbean Sustainable Tourism Conference Recreational Carrying Capacity Graham C Barrow What is Recreational Carrying Capacity? It s not about fixing absolute numbers of visitors/tourists that
Gold Coast: Modelled Future PIA Queensland Awards for Planning Excellence 2014 Nomination under Cutting Edge Research category
 Gold Coast: Modelled Future PIA Queensland Awards for Planning Excellence 2014 Nomination under Cutting Edge Research category Jointly nominated by SGS Economics and Planning and City of Gold Coast August
Fred Antoine Park. Management Plan. Final Public Review Draft
 Fred Antoine Park Management Plan Final Public Review Draft March 2016 Fred Antoine Park Management Plan Approved by: Jeff Leahy Regional Director Thompson Cariboo Region BC Parks Date Brian Bawtinheimer
MANAGEMENT DIRECTION STATEMENT June, 1999
 Thompson River District MANAGEMENT DIRECTION STATEMENT June, 1999 for Roche Lake Provincial Park Ministry of Environment Lands and Parks BC Parks Division Table of Contents I. Introduction A. Setting
Cathay Pacific Airways Limited (293) - Financial and Strategic SWOT Analysis Review
 - Financial and Strategic SWOT Analysis Review") Cathay Pacific Airways Limited (293) - Financial and Strategic SWOT Analysis Review Cathay Pacific Airways Limited (293) - Financial and Strategic SWOT Analysis Review Sector Publishing Intelligence Limited
Cathay Pacific Airways Limited (293) - Financial and Strategic SWOT Analysis Review Cathay Pacific Airways Limited (293) - Financial and Strategic SWOT Analysis Review Sector Publishing Intelligence Limited