APPENDIX G. Noise Measurement Program. G.1.1 Noise Measurement Locations
|
|
|
- Bruce Theodore Hunt
- 6 years ago
- Views:
Transcription
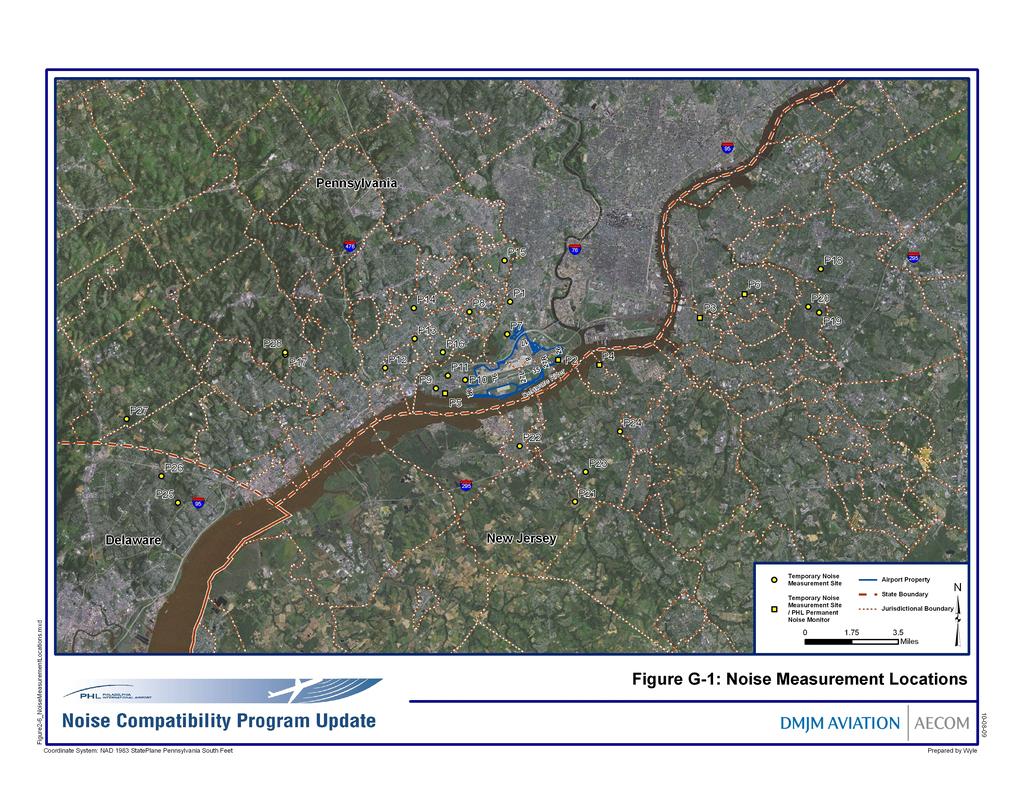
1 APPENDIX G Noise Measurement Program This appendix provides detailed information on the community sound levels measured as part of the Philadelphia International Airport (PHL) Part 150 Noise Compatibility Program Update s temporary noise measurement program. The program was designed to accomplish the following objectives: Sample and document overall outdoor sound levels in the communities surrounding the airport, and Sample and document the sound levels of aircraft, and determine the contribution of aircraft noise to the overall sound levels. Twenty-eight portable noise monitors were placed in locations surrounding PHL between November 7 th and November 16 th, The noise measurement program was designed to identify characteristics of noise exposure as a result of aircraft overflights in the context of a Part 150 study. It is important to mention that the noise monitoring values are for supplemental purposes and are the result of the environmental factors of a 10- day sample; whereas modeled noise levels represent average daily conditions for an entire calendar year (365 days) using the FAA s Integrated Noise Model (INM). The measurement period is a representative slicein-time that allows the characterization of the daily fluctuations in airport traffic throughout a typical week. Since the 10-day measurement period occurred under a variety of weather conditions, specifically shifting wind patterns, the program also demonstrates changes in the noise environment as the operational flow at the airport varies. G.1.1 Noise Measurement Locations The locations for the noise measurement program were selected based on evaluation of previous noise monitoring locations from the original 2003 Part 150 Study, the 17/35 Extension Environmental Impact Statement (EIS), and the PHL/NY/NJ Airspace Redesign EIS. In addition, the locations of callers to the airport's noise hotline were also considered in site selection. The noise monitoring sites were located in areas that are subject to repeated aircraft overflights at a range of altitudes, and included departing and arriving operations at PHL. Five of the noise measurement sites were co-located with PHL s permanent noise monitoring system. Table G-1 provides the location and distance of each of the noise measurement locations from the Airport Reference Point (ARP) at PHL, and Figure G-1 depicts the noise measurement locations. G-1
2 Location Table G-1. Noise Measurement Locations Address Distance from ARP (miles) P Buist Ave., Philadelphia, PA 2.6 P2 NMS #2 - Ft. Mifflin, Philadelphia, PA 1.6 P3 NMS #4 Gloucester City, NJ 7.1 P4 NMS #5 - West Deptford, NJ 3.1 P5 NMS #6 - Tinicum Township, PA 1.1 P6 NMS #8 - Collingswood, NJ 9.0 P Luther Place, Philadelphia, PA 1.4 P Woodland Ave., Sharon Hill, PA 2.8 P9 220 Printz Ave., Essington, PA 3.2 P Iroquois St., Lester, PA 2.0 P11 91 Seneca St., Essington, PA 2.6 P Shaw Rd., Ridley Park, PA 5.0 P Carlisle Ave., Prospect Park, PA 4.1 P Hickory Rd., Secane, PA 4.6 P Laurel Rd., Landsdown, PA 4.1 P Devon Rd., Norwood, PA 2.9 P17 6 Moore Circle, Media, PA 8.8 P Warren Ave., Cherry Hill, NJ 12.0 P Prospect Rd., Haddonfield, NJ 11.5 P Hopkins Ave., Haddonfield, NJ 11.2 P Windward Drive, Mt. Royal, NJ 5.4 P22 35 W. Broad St., Paulsboro, NJ 2.9 P Parliament Way, Thorofare, NJ 4.6 P Queen St., Woodbury, NJ 4.5 P Upsan Downs, Ardencroft, DE 13.7 P Inwood Rd., Wilmington, DE 14.0 P27 2 Rigby Court, Garnet Valley, PA 14.8 P28 5 Moore Circle, Media, PA 8.8 Source: Wyle, 2008 Notes: NMS #1 was inaccessible during measurement program. NMS #3 and #7 are located in the vicinity of Northeast Philadelphia Airport. G-2
3
4 G.1.2 Noise Measurement Program Details Sound level data was collected using fourteen Larson Davis Laboratories Model LD-820 sound level meters, five Larson Davis LD-824 sound level meters, and eight Larson Davis LD-831 sound level meters. Each sound level meter was equipped with a half-inch microphone and a windscreen, and secured at each location with a tripod or other device. Each of the sound level meters used in the program meet American National Standards Institute (ANSI) S standards for a I precision sound level meters, and meet or exceed accuracy requirements defined in Part 150 paragraph A Prior to the noise measurement program, each sound level meter was programmed to capture and store twosecond average A-weighted sound level time histories on a continuous (24 hours per day) basis. Calibration traceable to the National Institutes of Standards and Technologies (NIST) was accomplished using a Bruel & Kjaer Model 4231 Sound Level Calibrator, both prior to the initiation of the program and during site visits. Sound level meters (i.e. noise monitors) were installed at each site between Monday, November 5 th and Wednesday, November 7 th. Field engineers set up each monitor to operate from 12:00 a.m., Wednesday, November 7 th, 2007 until 11:59 p.m., Friday, November 16 th, Throughout the duration of the measurement program, field engineers visited each site to service, calibrate, and download each sound level meter. Where feasible and with time permitting, short periods of observations were completed at many of the sites in order to document aircraft operations, ambient sound levels, and additional noise events such as automotive traffic and other sources of noise. Sound level data was transferred from each monitor to a laptop computer for storage and analysis. To ensure the monitors were operating properly, calibration was performed during each service visit. A tolerance of +/- 1.0 db is generally considered to be an acceptable level of precision for environmental noise measurements. The internal clocks of the monitors were synchronized to the National Institute of Standards and Technology F1 Cesium Fountain Atomic Clock, and the location of each sound level meter was recorded utilizing a handheld Garmin GPS unit. 1 During the course of the program, one sound level meter malfunctioned and was replaced with a sound level meter that meets II standards. G-4
5 G.1.3 Weather Conditions Weather conditions can have both direct and indirect effects on the levels of noise reported at each site. Temperature, humidity, wind direction and speed, and precipitation can all impact the transmission of sound. Wind can play a significant role in the propagation of sound, resulting in increased sound levels downwind or reduced sound levels upwind of a noise source. The effects of wind on sound propagation are complex, but the scientific community generally considers wind speeds in excess of 10 knots to have a significant effect on environmental noise. Rain can also change the overall environmental noise environs by increasing ambient sound levels or increasing the sound levels of some sources (e.g., automobiles produce higher sound levels on rain-soaked streets). In addition, temperature and humidity generally affect an aircraft's performance, most notably the climb rate on departures. These factors vary seasonally, and can affect noise levels heard at the ground level. Weather data used by pilots and collected at airport weather stations, including the weather station at PHL, is called METAR data. METAR data reports are an hourly set of weather data that pilots and Air Traffic controllers use for navigation purposes, and include wind direction, wind speed, temperature and dew point, sky conditions (cloud cover), precipitation, visibility, and barometric pressure. These hourly reports are utilized to determine periods of weather variability. The National Oceanic and Atmospheric Administration (NOAA) reported weather events as shown in Table G- 2. High winds can significantly affect the propagation of sound. While there is no specific speed above which wind significantly affects sound propagation, a wind speed of 10 knots or more is often considered to be a high wind for noise monitoring purposes. Table G-2. High Wind and Precipitation Events Time Precipitation Wind 7-Nov-07 00:00-17: knots 10-Nov-07 02:30-09:00 Rain 3-10 knots 10-Nov-07 10:00-15: knots 12-Nov-07 23:00-24:00 Rain 6-7 knots 13-Nov-07 08:00-11:00 Rain 0-5 knots 15-Nov-07 03:00-15: knots 15-Nov-07 07:00-17:00 Rain 9-24 knots 16-Nov-07 00:00-24: knots Source: NOAA, 2008 A summary of the average, minimum, and maximum temperature, humidity, wind direction (the direction from which the wind is blowing), and wind speed as reported by NOAA is presented in Table G-3. Wind direction and speed generally affect an airport's flight patterns. Wind direction affects the direction of airport traffic flow at the airport (i.e. which runways are in use). Air traffic controllers generally direct aircraft to depart and arrive so that they are flying into the wind. Wind direction can change throughout a given day, and thus the operational flow of an airport can accordingly change. G-5
6 Table G-3. Daily Weather Summary Temp (Deg. F) Humidity Wind Direction Average Wind Speed (knots) Average Nov Minimum NW to W 6 Maximum Average Nov Minimum S to SW 0 Maximum Average Nov Minimum NE to E 0 Maximum Average Nov Minimum N to NE 3 Maximum Average Nov Minimum N to NE 0 Maximum Average Nov Minimum S to SW 4 Maximum Average Nov Minimum S to SW 0 Maximum Average Nov Minimum S to SW 0 Maximum Average Nov Minimum N to NW 6 Maximum Average Nov Minimum NW to W 10 Source: NOAA, 2008 Maximum G.1.4 Measurement Period al Data Airport operational data was collected from the airport s Total Airport Management Information System (TAMIS) noise monitoring and flight tracking system, which tracks flights arriving and departing from PHL. From this data, operational characteristics were derived, including the number of operations, runway utilization, and information on individual flights. PHL typically operates in one of two configurations, based on the predominant direction of winds. The primary operating flow is a west flow with arrivals approaching the airport from a eastern direction, and departures from the airport on westbound headings. West flow consists of aircraft departures from s 27L, 27R, and 35 and aircraft arrivals to s 27L, 27R, 26, and 35. East flow consists of aircraft departures from s 9L, 9R, 8, and 17, and arrivals to s 9L, 9R, 8, and 17. Figure G-2 depicts the total number of arrivals and departures on each runway that occurred during the measurement period. On average, there were 691 arrivals and 685 departures per day during the G-6
7 measurement period, with the busiest days occurring on Wednesday, November 7 th and Thursday, November 8 th and the fewest operations occurring on Saturday, November 10 th Arrivals Departures /7/ /8/ /9/ /10/ /11/ /12/ /13/ /14/ /15/ /16/2008 Figure G-2. Airport s - November 7 th November 16 th, 2007 Over the course of the measurement period, the airport operated in a west flow configuration the majority of the time, accounting for over 95% of arrivals and departures. On November 10 th, the airport operated with approximately 30% of operations arriving and departing in east flow, and on November 14 th, an east flow configuration was in effect for over 90% of operations. Table G-4 depicts the percentage of time aircraft operated in either configuration. Table G-4. Daily Operating Configuration West Flow East Flow 7-Nov 99.9% 0.1% 8-Nov 98.0% 2.0% 9-Nov 97.9% 2.1% 10-Nov 69.3% 30.7% 11-Nov 99.9% 0.1% 12-Nov 99.7% 0.3% 13-Nov 98.5% 1.5% 14-Nov 9.3% 90.7% 15-Nov 99.6% 0.4% 16-Nov 99.9% 0.1% Source: Wyle, TAMIS, 2008 Note: East Flow: Arrivals to s 9L, 9R, 17; Departures from s 9L, 9R, 8, 17 West Flow: Arrivals to s 27L, 27R, 35, 26; Departures from s 27L, 27R, 35. Throughout the measurement period, s 9L/27R and 9R/27L were the most heavily utilized, accounting for over 76% of total operations, as shown in Table G-5. During west flow, 27L is the most heavily utilized departure runway, serving 70% or more of total operations, followed by 27R and is not used for departures. West flow arrivals primarily utilize G-7
8 27R, followed by 35 and 26. During times the airport is in east flow, 9L is the primary departure runway, and 9R is the primary arrival runway. The frequency of operations, runway utilization, and individual aircraft identification collected from the TAMIS system will be used to evaluate individual aircraft overflights in forthcoming sections. 7-Nov 8-Nov 9-Nov Flow West West West Table G-5. Percentage of s by L 27R 9R 27L UNK Total Arrivals 16% 24% 57% 0% 2% 100% Departures 4% 0% 14% 74% 7% 100% Arrivals 16% 23% 0% 58% 2% 100% Departures 1% 0% 4% 3% 13% 72% 7% 100% Arrivals 12% 24% 0% 62% 0% 1% 100% Departures 1% 4% 3% 18% 68% 7% 100% 1 Arrivals 5% 6% 19% 47% 22% 1% 100% 10-Nov Mixed Departures 5% 0% 4% 25% 7% 1% 51% 7% 100% 11-Nov 12-Nov 13-Nov West West West Arrivals 14% 26% 56% 0% 4% 100% Departures 5% 0% 12% 74% 9% 100% Arrivals 13% 24% 62% 1% 1% 100% Departures 0% 4% 0% 7% 84% 5% 100% Arrivals 16% 14% 67% 1% 1% 1% 100% Departures 0% 4% 1% 9% 81% 5% 100% 2 Arrivals 2% 13% 1% 7% 75% 0% 2% 100% 14-Nov Mixed Departures 11% 0% 71% 0% 5% 9% 4% 100% 15-Nov West Arrivals 12% 19% 67% 2% 0% 100% Departures 0% 0% 5% 1% 8% 0% 80% 6% 100% Arrivals 12% 24% 61% 0% 1% 100% 16-Nov West Departures 3% 0% 7% 83% 7% 100% 1-70% West Flow, 30% East Flow 2-90% East Flow, 10% West Flow Source: TAMIS, Wyle, 2008 G-8
9 G.2 Measured Noise Levels The following sections provide an overview of the metrics used to evaluate the noise environment at each site. These metrics include both cumulative noise exposure metrics such as L eq, percentile-exceeded sound level (L x ), and DNL, and single event metrics such as the maximum sound level ( ), sound exposure level (), and the number-of-events above (NA) a specified threshold. Sections G.2.1 and G.2.2 provide an analysis of the noise measurement results prior to the identification and matching of aircraft overflights. These sections present the total measured noise levels at each site. The metrics presented in Sections G.2.3 through G.2.5 are used to match aircraft overflights with measured noise data, and present the noise levels of individual aircraft overflight events. In Section G.2.6, DNL noise levels are presented for both the total measured noise levels and specific levels of aircraft noise events. G.2.1 Equivalent Sound Level (L eq ) The equivalent sound level (L eq ) represents the average sound level of all noise occurring over any specified period of time. The hourly L eq value includes both aircraft and community noise sources that occurred throughout the time period, and does not distinguish aircraft and community events. L eq values were calculated and presented on an hourly basis at each site. An hourly L eq value of 60 db represents the average sound level of a site over the period of 60 minutes, and would be equivalent to hearing a constant sound measuring 60 db for 60 continuous minutes with no variations. In the field, an hourly L eq is an average of sound levels that could range from the threshold of hearing to levels that exceed the threshold of hearing. Table G-6 presents the minimum and maximum hourly L eq values measured at each site for the 10-day measurement period. L eq values were also calculated for a 24-hour period. The range of measured L eq values shows the diversity of sound levels in the communities around the airport. Lower values typically occurred during nighttime hours, while higher values occurred during daytime hours when both the airport and communities were more active. The minimum values ranged from 29 to 53 db, while maximum L eq values ranged from 56 to 89 db. G-9
10 Location Table G-6. Minimum and Maximum Hourly Measured Equivalent Sound Levels Street Address Hourly L eq Minimum Maximum P Buist Ave., Philadelphia, PA P2 NMS #2 - Ft. Mifflin, Philadelphia, PA P3 NMS #4 Gloucester City, NJ P4 NMS #5 - West Deptford, NJ P5 NMS #6 - Tinicum Township, PA P6 NMS #8 - Collingswood, NJ P Luther Place, Philadelphia, PA P Woodland Ave., Sharon Hill, PA P9 220 Printz Ave., Essington, PA P Iroquois St., Lester, PA P11 91 Seneca St., Essington, PA P Shaw Rd., Ridley Park, PA P Carlisle Ave., Prospect Park, PA P Hickory Rd., Secane, PA P Laurel Rd., Landsdown, PA P Devon Rd., Norwood, PA P17 6 Moore Circle, Media, PA P Warren Ave., Cherry Hill, NJ P Prospect Rd., Haddonfield, NJ P Hopkins Ave., Haddonfield, NJ P Windward Drive, Mt. Royal, NJ P22 35 W. Broad St., Paulsboro, NJ P Parliament Way, Thorofare, NJ P Queen St., Woodbury, NJ P Upsan Downs, Ardencroft, DE P Inwood Rd., Wilmington, DE P27 2 Rigby Court, Garnet Valley, PA P28 5 Moore Circle, Media, PA Source: Wyle 2008 G.2.2 Percentile-Exceeded Sound Level (L x ) While L eq indicates the average sound level over a given period of time, percentile-exceeded sound levels (indicated as L x, where x is the percent of the time period in which a sound level exceeded) can provide details about the levels of sound exceeded over a given percentage of time. During the measurement period, sound levels were measured for A-weighted hourly sound levels exceeded 1, 10, 50, 90, and 99 percent of the time. The most commonly used of these metrics is L 90, which represents the sound level exceeded 90 percent of the time (54 minutes out of one hour) and is used to represent background sound levels. The background sound level is comprised of constant noises such as a distant freeway, and frequent noises such as voices or passing automobiles. L 1 is the sound level exceeded only 1 percent of the time and includes only infrequent loud noise events. For a one-hour interval the L 1 is the sound level exceeded for only 36 seconds. The L 10 is the sound level exceeded 10 percent of the time (6 minutes in an hour). It represents the A- weighted sound level of typical noisy events, some of which may be aircraft. The L 50 is the median sound level. During an hour, the measured sound levels are greater than the L 50 half of the time, and less than the L 50 half of the time. The L 99 is the sound level exceeded 99 percent of the time, which includes almost all measured noise. G-10
11 The average daily measured L x values (i.e. the 24-hour L x values for each day averaged over the 10-day monitoring program), including both community and aircraft events, are presented in Table G-7. Table G-7. Measured Average Daily Percentile-Exceeded Sound Levels Location Street Address L 1 L 10 L 50 L 90 L 99 P Buist Ave., Philadelphia, PA P2 NMS #2 - Ft. Mifflin, Philadelphia, PA P3 NMS #4 Gloucester City, NJ P4 NMS #5 - West Deptford, NJ P5 NMS #6 - Tinicum Township, PA P6 NMS #8 - Collingswood, NJ P Luther Place, Philadelphia, PA P Woodland Ave., Sharon Hill, PA P9 220 Printz Ave., Essington, PA P Iroquois St., Lester, PA P11 91 Seneca St., Essington, PA P Shaw Rd., Ridley Park, PA P Carlisle Ave., Prospect Park, PA P Hickory Rd., Secane, PA P Laurel Rd., Landsdown, PA P Devon Rd., Norwood, PA P17 6 Moore Circle, Media, PA P Warren Ave., Cherry Hill, NJ P Prospect Rd., Haddonfield, NJ P Hopkins Ave., Haddonfield, NJ P Windward Drive, Mt. Royal, NJ P22 35 W. Broad St., Paulsboro, NJ P Parliament Way, Thorofare, NJ P Queen St., Woodbury, NJ P Upsan Downs, Ardencroft, DE P Inwood Rd., Wilmington, DE P27 2 Rigby Court, Garnet Valley, PA P28 5 Moore Circle, Media, PA Source: Wyle, 2008 In most cases, the loudest L 1 levels occur at the sites co-located with the permanent noise monitors. Site P2, located at Fort Mifflin, directly underneath the west flow arrival path to 27L, has the highest L 1 level of 86 db. The L 90 level, which is indicative of the background noise level, was between 40 and 59 db for all sites during the measurement period. G.2.3 Single Event Analysis Following the completion of the noise measurement program, TAMIS radar tracking data from the airport was obtained for use in the noise measurement program analysis. The TAMIS data includes the following specific information about each flight operation: date, time, altitude, X and Y ground location coordinates, callsign (when available), beacon code, runway utilization, and operation type (arrival, departure, or overflight). G-11
12 Measured noise events were selected from the time histories of sound levels. These noise events had to meet two criteria: (1) s between specific minimum and maximum values; and (2) Sound levels above a specific threshold. These parameters (duration and threshold) were defined separately for each site based on field observations of the sound levels of aircraft and other noise sources such as automobiles and railroads. The parameters were intended to filter out most of the noise due to sources other than aircraft. A computer program was used to match each radar track to a corresponding measured noise event. This was accomplished using software that determines the point of closest approach of each operation to each of the noise monitoring sites closest to that flight track. The date and time of the point of closest approach is determined, and a noise event is searched which matches that date and time (within a small margin of error, which accounts for the speed of sound propagation and the actual position of the plane where the noise is at a maximum). If a matching noise event is found, the date, time,,, and duration are associated with the flight operation. This process is repeated for every noise monitoring site within a set distance from the site (typically a one-mile radius). In some cases, no noise event was measured during a given flight operation, due to excessive local noise near the noise monitor, lack of measured data (when the monitor was being serviced, or was malfunctioning), or the event was too quiet to be detected compared to the ambient noise level. These flights were not included in the analysis. In other cases, a noise event existed that did not correlate with any flight operations; such noise events were eliminated from the analysis. Eliminating these uncorrelated noise events greatly increased the accuracy of the analysis, since only noise events due to aircraft were used in the analysis. A database was compiled for each site, including all flight track and noise event data for every successful match. This database was checked by selecting matched flights and finding the corresponding noise data in the original time histories. The acoustic descriptors used to quantify single events are the Maximum Sound Level ( ) and the Sound Exposure Level (), both of which are expressed in decibels. The metric is described as the highest A-weighted integrated sound level that is measured during a single event in which the sound level values vary with time (e.g., an aircraft over-flight). In the simplest terms, is the highest sound level measured during a single noise event and describes the maximum level of a noise event, but does not take into account its duration. During an aircraft over-flight, the noise level starts at the ambient or background noise level, rises to the maximum level as the aircraft flies closest to the observer, and returns to the background level as the aircraft recedes into the distance. indicates the maximum sound level occurring for a fraction of a second. The Sound Exposure Level () is a composite metric that represents both the duration and magnitude (or amplitude) of a time-varying noise event, and is a logarithmic measure of the total acoustic energy that occurs during the noise event. Mathematically, it is defined as the total acoustic energy of an event from background to background (typically computed from 10 to 20 db from the event peak), but normalized to a one-second time period. The sound levels of individual time-varying events have several main characteristics the time when the sound level exceeds the lower threshold level, rising to a maximum noise level ( ) during the aircraft flyover, then the time during which the sound level decreases to the lower threshold level. In effect, the metric squeezes the energy of the entire noise event into one second. The single value represents the level of a constant sound that, in one second, would generate the same acoustic energy as the actual timevarying noise event. The principal benefit of is that it can be used to compare noise events that have different durations., therefore, represents the best metric to compare noise levels from different G-12

13 overflights. does not directly represent the sound level heard at any given time, but rather provides a measure of the net sound energy of the entire acoustic event. Note that describes only one dimension of an event; it provides no information on the cumulative noise exposure generated by a sound source. In fact, two events with identical may produce very different total exposures. One may be of very short duration, while the other may be much longer. However, provides some measure of the intrusiveness of the event and is one of the few noise metrics which people can actually hear or experience. Since aircraft overflights usually last longer than one second, and the value is normalized to one second, the of an overflight is higher than the of the same overflight. A general rule of thumb is that the of an aircraft event is approximately 10 db higher than the of the event (although can range anywhere from 7 to 12 db higher than ). Figure G-3 is a graphical representation of the comparison between the and metrics. The example shows the time history of an aircraft overflight, beginning at the background sound level (70 db), rising to the maximum sound level (93.5 db) as the aircraft approaches and flies overhead, and slowly fading into the background as the aircraft leaves the area. The area under the time history curve represents the total (A-weighted) acoustic energy of the event. Normalizing the event s total acoustic energy to one second to compute its yields db, as shown by the tall narrow bar (one second in width) in Figure G-3. Figure G-3. Graphical Representation of a Typical Flyover G.2.4 Number-of-events Above Threshold (NA) The matched aircraft noise events were analyzed to determine the average number of events that exceeded a set of defined thresholds. This analysis was completed for each site for each day of available data, and the results were averaged over the number of days the monitor was functional throughout the noise monitoring period. The number of events above or method has a distinct advantage in communicating certain aspects of noise exposure that are not available through the use of other metrics or tools. It is has been employed as supplemental metric in several studies in order to combine single-event noise levels with the G-13
14 number of aircraft operations. In essence, it answers the question of how many aircraft exceed a certain threshold noise level when flying over a specific location. Table G-8 presents the average daily number of aircraft noise events that exceeded the following levels: 60, 70, 80, and 90 db. The number of noise events are cumulative. For example, a noise event with an greater than 90 db is also included in the numbers of events with an greater than 60 db, 70 db and 80 db. Location Table G-8. Average Daily Noise Events ( ) Street Address Number-of-Events Above ( ) 90 db 80 db 70 db 60 db P Buist Ave., Philadelphia, PA P2 NMS #2 - Ft. Mifflin, Philadelphia, PA P3 NMS #4 Gloucester City, NJ P4 NMS #5 - West Deptford, NJ P5 NMS #6 - Tinicum Township, PA P6 NMS #8 - Collingswood, NJ P Luther Place, Philadelphia, PA P Woodland Ave., Sharon Hill, PA P9 220 Printz Ave., Essington, PA P Iroquois St., Lester, PA P11 91 Seneca St., Essington, PA P Shaw Rd., Ridley Park, PA P Carlisle Ave., Prospect Park, PA P Hickory Rd., Secane, PA P Laurel Rd., Landsdown, PA P Devon Rd., Norwood, PA P17 6 Moore Circle, Media, PA P Warren Ave., Cherry Hill, NJ P Prospect Rd., Haddonfield, NJ P Hopkins Ave., Haddonfield, NJ P Windward Drive, Mt. Royal, NJ P22 35 W. Broad St., Paulsboro, NJ P Parliament Way, Thorofare, NJ P Queen St., Woodbury, NJ P Upsan Downs, Ardencroft, DE P Inwood Rd., Wilmington, DE P27 2 Rigby Court, Garnet Valley, PA P28 5 Moore Circle, Media, PA Source: Wyle, 2008 Table G-9 presents the average daily number of aircraft noise events that exceeded the following levels: 60, 70, 80, and 90 db. As with, the numbers of noise events are also cumulative. G-14
15 Table G-9. Average Daily Noise Events () Number-of-Events Above () Location Street Address 90 db 80 db 70 db 60 db P Buist Ave., Philadelphia, PA P2 NMS #2 - Ft. Mifflin, Philadelphia, PA P3 NMS #4 Gloucester City, NJ P4 NMS #5 - West Deptford, NJ P5 NMS #6 - Tinicum Township, PA P6 NMS #8 - Collingswood, NJ P Luther Place, Philadelphia, PA P Woodland Ave., Sharon Hill, PA P9 220 Printz Ave., Essington, PA P Iroquois St., Lester, PA P11 91 Seneca St., Essington, PA P Shaw Rd., Ridley Park, PA P Carlisle Ave., Prospect Park, PA P Hickory Rd., Secane, PA P Laurel Rd., Landsdown, PA P Devon Rd., Norwood, PA P17 6 Moore Circle, Media, PA P Warren Ave., Cherry Hill, NJ P Prospect Rd., Haddonfield, NJ P Hopkins Ave., Haddonfield, NJ P Windward Drive, Mt. Royal, NJ P22 35 W. Broad St., Paulsboro, NJ P Parliament Way, Thorofare, NJ P Queen St., Woodbury, NJ P Upsan Downs, Ardencroft, DE P Inwood Rd., Wilmington, DE P27 2 Rigby Court, Garnet Valley, PA P28 5 Moore Circle, Media, PA Source: Wyle, 2008 G.2.5 Noise Contributors Tables G-10 through G-37 present the measured aircraft noise events with the highest sound levels (ranked by ) for each of the noise monitoring sites. Noise events are listed by date, operation type (arrival or departure), runway, aircraft type, and duration. Both and metrics are reported. Note that these results were taken from the available noise measurement data, and that additional events may have occurred while other noise near a given site interfered (for example, running a leaf-blower near the monitor), or while monitors were not functioning (for example, during site service or malfunctions). G-15
16 Table G-10. Site P1 Noise Contributors 12-Nov-07 Departure Dehavilland Dash Nov-07 Arrival Dehavilland Dash Nov-07 Arrival Dehavilland Dash Nov-07 Departure Dehavilland Dash Nov-07 Departure UNK 106 Falcon Nov-07 Arrival Dehavilland Dash Nov-07 Arrival Dehavilland Dash Nov-07 Arrival Dehavilland Dash Nov-07 Arrival Dehavilland Dash Nov-07 Arrival Dehavilland Dash Table G-11. Site P2 Noise Contributors 16-Nov-07 Arrival 27R 38 Boeing Nov-07 Arrival 27R 34 Boeing Nov-07 Departure 27R 54 Dehavilland Dash Nov-07 Arrival 27R 56 Boeing Nov-07 Arrival 27R 60 Boeing Nov-07 Departure 9L 52 McDonnell Douglas MD Nov-07 Arrival 27R 38 Embraer Nov-07 Arrival 27R 20 Embraer Nov-07 Arrival 27R 46 Canadair RJ Table G-12. Site P3 Noise Contributors 7-Nov-07 Arrival 27R 68 McDonnell Douglas MD Nov-07 Arrival 27R 60 Antonov Nov-07 Departure 9L 56 McDonnell Douglas MD Nov-07 Departure 9L 34 Boeing Nov-07 Arrival 27R 32 Antonov Nov-07 Arrival 27R 46 Antonov Nov-07 Arrival 27R 38 Antonov Nov-07 Departure 9L 48 Boeing Nov-07 Departure 9L 34 McDonnell Douglas MD Nov-07 Arrival 27R 50 McDonnell Douglas MD G-16
17 Table G-13. Site P4 Noise Contributors 14-Nov-07 Departure 8 48 Airbus A Nov-07 Arrival 27R 12 Embraer Nov-07 Departure 8 50 Unknown Nov-07 Departure 9L 34 Boeing Nov-07 Departure 9L 62 McDonnell Douglas MD Nov-07 Departure 9L 46 Boeing Nov-07 Departure 9L 62 McDonnell Douglas DC Nov-07 Arrival 27R 64 Boeing Nov-07 Departure 9L 48 Boeing Table G-14. Site P5 Noise Contributors 13-Nov-07 Arrival 27R 44 Boeing Nov-07 Arrival 27R 56 Boeing Nov-07 Arrival 27R 48 Boeing Nov-07 Arrival Canadair RJ Nov-07 Departure 27L 56 Canadair RJ Nov-07 Arrival Canadair RJ Table G-15. Site P6 Noise Contributors 14-Nov-07 Departure 9L 136 Boeing Nov-07 Departure 9L 40 Boeing Nov-07 Departure 9L 118 McDonnell Douglas MD Nov-07 Arrival 27R 66 Airbus A Nov-07 Arrival 27R 62 Antonov Nov-07 Arrival 27R 56 Boeing Nov-07 Arrival 27R 58 Antonov Nov-07 Arrival 27R 32 Boeing Nov-07 Arrival 27R 148 Airbus A Nov-07 Arrival 27R 74 Antonov G-17
18 Table G-16. Site P7 Noise Contributors 8-Nov-07 Departure Beech Baron Nov-07 Departure Beech Baron Nov-07 Departure 27L 78 Cessna Nov-07 Arrival Beechjet Nov-07 Departure Falcon Nov-07 Departure Dehavilland Dash Nov-07 Departure Dehavilland Dash Nov-07 Departure Dehavilland Dash Nov-07 Departure Beech Bonanza Nov-07 Departure Mitsubishi MU Table G-17. Site P8 Noise Contributors 8-Nov-07 Departure Dehavilland Dash Nov-07 Departure Piper Navaho Nov-07 Departure Gulfstream Nov-07 Departure Piper Navaho Nov-07 Departure Dehavilland Dash Nov-07 Departure Learjet Nov-07 Departure Dehavilland Dash Nov-07 Departure Dehavilland Dash Nov-07 Departure Beech Bonanza Nov-07 Departure Dehavilland Dash Table G-18. Site P9 Noise Contributors 7-Nov-07 Departure 27L 94 Canadair RJ Nov-07 Departure 27L 42 Antonov Nov-07 Departure 27R 68 Antonov Nov-07 Departure 27L 68 McDonnell Douglas MD Nov-07 Departure 27R 90 Antonov Nov-07 Departure 27R 48 McDonnell Douglas MD Nov-07 Departure 27L 48 Boeing Nov-07 Departure 27L 58 Antonov Nov-07 Departure 27L 46 McDonnell Douglas MD Nov-07 Departure 27R 102 McDonnell Douglas MD G-18
19 Table G-19. Site P10 Noise Contributors 15-Nov-07 Departure 27L 70 Boeing Nov-07 Departure 27L 28 Canadair RJ Nov-07 Departure 27R 50 Boeing Nov-07 Departure 27L 46 Canadair RJ Nov-07 Departure 27L 52 Boeing Nov-07 Departure 27L 124 McDonnell Douglas DC Nov-07 Departure 27L 68 McDonnell Douglas DC Nov-07 Departure 27L 60 Boeing Nov-07 Departure 27L 124 McDonnell Douglas MD Nov-07 Departure 27L 112 McDonnell Douglas DC Table G-20. Site P11 Noise Contributors 9-Nov-07 Departure 27R 116 McDonnell Douglas MD Nov-07 Departure 27L 128 McDonnell Douglas DC Nov-07 Departure 27L 124 McDonnell Douglas MD Nov-07 Departure 27L 36 McDonnell Douglas MD Nov-07 Departure 27L 40 Boeing Nov-07 Departure 27R 60 McDonnell Douglas DC Nov-07 Departure 27L 112 McDonnell Douglas MD Nov-07 Departure 27L 120 Boeing Nov-07 Departure 27L 108 McDonnell Douglas MD Nov-07 Departure 27L 48 McDonnell Douglas MD Table G-21. Site P12 Noise Contributors 15-Nov-07 Departure 27L 54 Boeing Nov-07 Departure 27R 58 McDonnell Douglas DC Nov-07 Departure 27L 84 McDonnell Douglas MD Nov-07 Departure 27L 64 Airbus A Nov-07 Departure 27R 128 Beech Baron Nov-07 Departure 27L 40 Airbus A Nov-07 Departure 27L 52 McDonnell Douglas DC Nov-07 Arrival UNK 52 Unknown Nov-07 Departure 27L 46 Boeing Nov-07 Departure 27L 62 Boeing G-19
20 Table G-22. Site P13 Noise Contributors 11-Nov-07 Departure 27R 72 Cessna Nov-07 Departure UNK 134 Dehavilland Dash Nov-07 Arrival 9R 28 Embraer Nov-07 Departure 27L 64 Boeing Nov-07 Departure 27R 106 Cessna Nov-07 Departure 27R 26 Beech King Air Nov-07 Departure 27R 64 Cessna 208 Caravan Nov-07 Departure 27R 132 Beech Baron Nov-07 Departure 27R 64 Boeing Nov-07 Departure 27R 56 Dehavilland Dash Table G-23. Site P14 Noise Contributors 16-Nov-07 Departure Dehavilland Dash Nov-07 Departure Dehavilland Dash Nov-07 Departure Beech Super King Air Nov-07 Departure Dehavilland Dash Nov-07 Departure Mitsubishi MU Nov-07 Departure Dehavilland Dash Nov-07 Departure 27L 42 Mitsubishi MU Nov-07 Departure Sikorski S-76 Helicopter Nov-07 Departure Dehavilland Dash Nov-07 Departure Beech Super King Air Table G-24. Site P15 Noise Contributors 16-Nov-07 Departure Beech Baron Nov-07 Departure Beech Baron Nov-07 Departure 9L 70 McDonnell Douglas DC Nov-07 Departure Cessna Citation Nov-07 Departure Dehavilland Dash Nov-07 Departure Dehavilland Dash Nov-07 Departure 9L 90 Airbus A Nov-07 Departure 9R 54 Airbus A Nov-07 Departure Dehavilland Dash Nov-07 Departure Dehavilland Dash G-20
21 Table G-25. Site P16 Noise Contributors 16-Nov-07 Departure 27L 76 Dehavilland Dash Nov-07 Departure 27R 72 Cessna Nov-07 Departure 27R 90 Learjet Nov-07 Departure 27L 98 Beech Baron Nov-07 Departure 27R 106 Beech Baron Nov-07 Departure UNK 66 Dehavilland Dash Nov-07 Departure 27R 52 Cessna Nov-07 Departure 27R 70 Cessna 208 Caravan Nov-07 Departure 27R 64 Embraer Nov-07 Arrival UNK 40 Unknown Table G-26. Site P17 Noise Contributors 7-Nov-07 Departure UNK 78 McDonnell Douglas MD Nov-07 Departure 27L 86 McDonnell Douglas MD Nov-07 Departure 27R 94 McDonnell Douglas MD Nov-07 Departure 27L 76 McDonnell Douglas MD Nov-07 Departure 27L 110 McDonnell Douglas MD Nov-07 Departure 27R 60 McDonnell Douglas MD Nov-07 Departure 27L 82 Airbus A Nov-07 Departure 27L 64 McDonnell Douglas MD Nov-07 Departure 27L 76 McDonnell Douglas MD Nov-07 Departure 27L 58 Airbus A Table G-27. Site P18 Noise Contributors 7-Nov-07 Arrival 27R 62 Airbus A Nov-07 Arrival 27R 104 Antonov Nov-07 Arrival 27R 64 Airbus A Nov-07 Arrival 27R 52 Gulfstream Nov-07 Arrival 27R 88 McDonnell Douglas MD Nov-07 Arrival 27R 86 Antonov Nov-07 Arrival 27R 74 Embraer Nov-07 Arrival Bell 430 Helicopter Nov-07 Departure 9L 38 Boeing Nov-07 Arrival 27R 80 Antonov G-21
22 Table G-28. Site P19 Noise Contributors 13-Nov-07 Arrival 27R 66 Canadair RJ Nov-07 Departure 9L 58 Helicopter Nov-07 Arrival 27R 92 Airbus A Nov-07 Departure 9L 104 Unknown Nov-07 Arrival 27R 66 Airbus A Nov-07 Arrival 27R 150 Embraer Nov-07 Arrival 27R 50 Boeing Nov-07 Arrival 27R 58 Boeing Nov-07 Arrival 27R 64 Airbus A Nov-07 Arrival 27R 72 Airbus A Table G-29. Site P20 Noise Contributors 9-Nov-07 Arrival 27R 42 Canadair RJ Nov-07 Arrival 27R 66 Embraer Nov-07 Arrival 27R 50 Airbus A Nov-07 Departure 9L 56 Helicopter Nov-07 Arrival 27R 146 Boeing Nov-07 Arrival 27R 66 Boeing Nov-07 Arrival 27R 56 Boeing Nov-07 Arrival 27R 64 Boeing Nov-07 Arrival 27R 60 Boeing Nov-07 Departure 9L 96 Unknown Table G-30. Site P21 Noise Contributors 11-Nov-07 Departure 27L 72 Antonov Nov-07 Arrival Canadair RJ Nov-07 Arrival Beech Baron Nov-07 Arrival Dehavilland Dash Nov-07 Arrival Dehavilland Dash Nov-07 Departure 27R 78 McDonnell Douglas MD Nov-07 Arrival Dehavilland Dash Nov-07 Arrival Dehavilland Dash Nov-07 Arrival Dehavilland Dash G-22
23 Table G-31. Site P22 Noise Contributors 7-Nov-07 Departure UNK 34 Cirrus SR-20/ Nov-07 Departure UNK 96 Cirrus SR-20/ Nov-07 Departure UNK 66 Dehavilland Dash Nov-07 Arrival Dehavilland Dash Nov-07 Departure Beech Baron Nov-07 Arrival Beechjet Nov-07 Arrival Canadair RJ Nov-07 Arrival Mitsubishi MU Nov-07 Arrival Canadair RJ Nov-07 Arrival Dehavilland Dash Table G-32. Site P23 Noise Contributors 13-Nov-07 Arrival Dehavilland Dash Nov-07 Arrival Boeing Nov-07 Arrival Boeing Nov-07 Arrival Dehavilland Dash Nov-07 Arrival Dehavilland Dash Nov-07 Arrival Dehavilland Dash Nov-07 Arrival Dehavilland Dash Nov-07 Arrival Canadair RJ Nov-07 Arrival Canadair RJ Nov-07 Arrival Dehavilland Dash Table G-33. Site P24 Noise Contributors 9-Nov-07 Arrival Dehavilland Dash Nov-07 Arrival Dehavilland Dash Nov-07 Arrival Dehavilland Dash Nov-07 Arrival Canadair RJ Nov-07 Arrival Canadair RJ Nov-07 Arrival Canadair RJ Nov-07 Arrival Dehavilland Dash Nov-07 Arrival 27R 32 Canadair RJ Nov-07 Arrival Dehavilland Dash Nov-07 Arrival Beech Baron G-23
24 Table G-34. Site P25 Noise Contributors 14-Nov-07 Arrival 9R 44 McDonnell Douglas MD Nov-07 Departure 27L 112 Boeing Nov-07 Departure 27L 76 Boeing Nov-07 Departure 27L 82 McDonnell Douglas DC Nov-07 Departure UNK 90 McDonnell Douglas MD Nov-07 Departure 27L 150 McDonnell Douglas MD Nov-07 Departure 27L 56 Boeing Nov-07 Arrival 9R 44 Boeing Nov-07 Departure 27L 86 Gulfstream Nov-07 Departure 27L 68 McDonnell Douglas DC Table G-35. Site P26 Noise Contributors 14-Nov-07 Arrival 9R 52 Boeing Nov-07 Departure 27L 64 Boeing Nov-07 Arrival 9R 74 Antonov Nov-07 Arrival 9R 136 McDonnell Douglas MD Nov-07 Departure 27L 118 Boeing Nov-07 Arrival 9R 80 McDonnell Douglas DC Nov-07 Arrival 9R 48 Airbus A Nov-07 Departure 27R 92 McDonnell Douglas MD Nov-07 Departure 27R 84 Boeing Nov-07 Arrival 9R 72 McDonnell Douglas DC Table G-36. Site P27 Noise Contributors 15-Nov-07 Departure 27L 114 McDonnell Douglas DC Nov-07 Arrival 9R 80 Canadair RJ Nov-07 Departure 27L 98 Boeing Nov-07 Departure 27L 54 Boeing Nov-07 Departure 27L 68 Boeing Nov-07 Departure 27L 80 Boeing Nov-07 Departure 27L 100 McDonnell Douglas MD Nov-07 Departure 27L 76 McDonnell Douglas DC Nov-07 Departure 27R 112 McDonnell Douglas MD Nov-07 Departure 27L 100 Airbus A G-24
25 Table G-37. Site P28 Noise Contributors 13-Nov-07 Departure 27L 98 McDonnell Douglas MD Nov-07 Departure 27L 50 Airbus A Nov-07 Departure 27L 48 Boeing Nov-07 Departure 27L 64 Boeing Nov-07 Departure 27L 40 Airbus A Nov-07 Departure UNK 46 Boeing Nov-07 Departure 27L 58 Embraer Nov-07 Departure Mitsubishi MU Nov-07 Departure 27L 70 Canadair RJ Nov-07 Departure 27L 84 Canadair RJ G.2.6 Day-Night Average Sound Level (DNL) The Day-Night Average Sound Level (DNL) is used for the evaluation of both community and aircraft noise, and is the metric adopted by the FAA for the evaluation of aircraft noise impact. The DNL is the energyaverage of the sound levels at a location over a 24-hour period, with a 10-decibel penalty added to nighttime sound levels between 10:00 p.m. and 7:00 a.m. The penalty accounts for the added intrusiveness of sounds that occur during normal sleeping hours, both because of the increased sensitivity to noise during these hours and because ambient sound levels during nighttime are typically about 10 db lower than during daytime. The DNL represents total average sound exposure during one day, and does not represent the sound level heard at any particular time. For example, a DNL of 65 db could result from a few very noisy events or from a large number of quieter events. In this study three different types of DNL were computed: (1) Total DNL, (2) DNL, and (3) Community DNL. The total DNL is comprised of all noise sources present at a noise monitoring location, and is computed from measured hourly average sound levels (L eq ).. In cases where the monitor was undergoing service or was malfunctioning, the DNL values were calculated using the available data for each day. The DNL was calculated using only the noise events caused by aircraft, resulting from the correlation process described previously. The of each aircraft noise event (including the 10 db penalty for nighttime flights) which correlated with a radar track were summed and used to compute the aircraft DNL. The community DNL for each monitoring location is comprised of all other noise not correlated with an aircraft event. The community DNL includes noise from railroad and automotive traffic, lawnmowers, dogs, and other local non-aircraft noise sources at each site. It is calculated by logarithmically subtracting the aircraft DNL from the total DNL. For each site, the DNL values were logarithmically averaged over the ten-day period, and are presented for the total, aircraft, and community DNL in Table G-38. G-25
26 Location P1 P2 P3 P4 P5 P6 P7 P8 P9 P10 P11 P12 P13 P14 Street Address 7535 Buist Ave., Philadelphia, PA NMS #2 - Ft. Mifflin, Philadelphia, PA NMS #4 - Gloucester City, NJ NMS #5 - West Deptford, NJ NMS #6 - Tinicum Township, PA NMS #8 - Collingswood, NJ 8542 Luther Place, Philadelphia, PA 1308 Woodland Ave., Sharon Hill, PA 220 Printz Ave., Essington, PA 439 Iroquois St., Lester, PA 91 Seneca St., Essington, PA 382 Shaw Rd., Ridley Park, PA 1508 Carlisle Ave., Prospect Park, PA 730 Hickory Rd., Secane, PA Table G-38. Daily and Average DNL DNL 10-Day 7-Nov 8-Nov 9-Nov 10-Nov 11-Nov 12-Nov 13-Nov 14-Nov 15-Nov 16-Nov Average Total Community Total a Community Total Community Total Community Total Community Total Community Total Community Total Community Total Community Total a Community Total Community Total Community Total Community Total Community a - Monitor malfunction b - Monitor was placed at P17, but moved to P28 on 13 Nov c - Noise levels at site exceeded normal operating paramters Shaded boxes indicate partial days - values were not included in the calculation of total DNL Source: Wyle, 2008 G-26
Technical Report. Aircraft Overflight and Noise Analysis. Brisbane, California. December Prepared by:
 Aircraft Noise Abatement Office Technical Report Aircraft Overflight and Noise Analysis Brisbane, California Prepared by: P.O. Box 8097 San Francisco, California 94128 (650) 821-5100 Introduction In response
APPENDIX H 2022 BASELINE NOISE EXPOSURE CONTOUR
 APPENDIX H 2022 BASELINE NOISE EXPOSURE CONTOUR This appendix sets forth the detailed input data that was used to prepare noise exposure contours for 2022 Baseline conditions. H.1 DATA SOURCES AND ASSUMPTIONS
Portable Noise Monitor Report
 Portable Noise Monitor Report Chicago O Hare International Airport Site 2114 5516 N. Neenah Avenue, Chicago July 12, 217 through August 9, 217 USH5-ILH19-ILS1-CHI45 Visit the O Hare Noise webpage on the
Portable Noise Monitor Report
 Portable Noise Monitor Report Chicago O Hare International Airport Site 299 93 Wilshire Avenue, Elk Grove Village June 27, 217 through July 1, 217 USH8-ILH55-ILS28 Visit the O Hare Noise webpage on the
Airport Noise Management 2017 Annual Report
 Airport Noise Management 2017 Annual Report The Airport Noise Management Report provides a yearly summary of St. Louis Lambert International Airport s operations and noise complaints. The NAS (National
Portable Noise Monitor Report
 Portable Noise Monitor Report Chicago O Hare International Airport Site 241 61 Grange Road, Elk Grove Village October 3, 215 through October 19, 215 USH8-ILH55-ILS28 Visit the O Hare Noise webpage on the
Airport Noise Management Annual Report 2016
 Airport Noise Management Annual Report 2016 The Airport Noise Management Annual Report is a publication of the Airport Noise Management Office. This report provides an annual summary of Lambert- Louis
Portable Noise Monitor Report
 Portable Noise Monitor Report Chicago O Hare International Airport Site 213 475 W. Hutchinson Street, Chicago April 8, 217 through May 3, 217 USH5-ILH19-ILS1-CHI45 Visit the O Hare Noise webpage on the
APA NOISE REPORT. January 2018
 January 2018 [Grab your reader s attention with a great quote from the document or use this space to emphasize a key point. To place this text box anywhere on the page, just drag it.] APA NOISE REPORT
Portable Noise Monitor Report
 Portable Noise Monitor Report Chicago O Hare International Airport Site 2117 5843 N. Christiana Avenue, Chicago July 14, 217 through August 2, 217 USH5-ILH15-ILS8-CHI39 Visit the O Hare Noise webpage on
PRELIMINARY WEB DOCUMENT
 APA NOISE REPORT May 2018 [Grab your reader s attention with a great quote from the document or use this space to emphasize a key point. To place this text box anywhere on the page, just drag it.] 1 TABLE
APA NOISE REPORT. August 2018
 August 2018 [Grab your reader s attention with a great quote from the document or use this space to emphasize a key point. To place this text box anywhere on the page, just drag it.] APA NOISE REPORT 1
APA NOISE REPORT. August 2017
 August 2017 [Grab your reader s attention with a great quote from the document or use this space to emphasize a key point. To place this text box anywhere on the page, just drag it.] APA NOISE REPORT 1
Airport Noise Management Report 2nd Quarter 2016
 Airport Noise Management Report 2nd Quarter 2016 The Airport Noise Management Report is a publication of the Airport Noise Management Office. This report provides a 2nd quarter summary of St. Louis Lambert
Number of Complaints by Community 2015
 Airport Noise Management Annual Report 2015 The Airport Noise Management Report is a publication of the Airport Noise Management Office. This report provides an annual summary of Lambert St. Louis International
Short Term Monitoring Program NSW, Carlingford Report. February 2013
 NSW, Carlingford Report February 2013 Version Control Version Number Date Detail 1.0 February 2013 Initial Release. 2.0 May 2013 Updated formatting for table 2. 3.0 January 2014 Figure 5 and L90 values
Airport Noise Management Report
 Airport Noise Management Report The Airport Noise Management Report is a publication of the Airport Noise Management Office. ANNU AL R EPORT Y E AR 201 4 N O I S E C O M P L A I N T S There were 51 noise
Portable Noise Monitor Report
 Portable Noise Monitor Report Chicago O Hare International Airport Site 2198 5N67 Rochefort Lane, Wayne May 9, 218 through June 3, 218 USH6-ILH49-ILS25 Visit the O Hare Noise webpage on the Internet at
Noise Exposure
 4-1 4. FAR Part 150 guidelines require the evaluation of a five-year future forecast condition in the analysis of noise exposure at an airport. This section documents the expected future operating conditions
1.0 OUTLINE OF NOISE ANALYSIS...3
 Table of Contents 1.0 OUTLINE OF NOISE ANALYSIS...3 2.0 METHODOLOGY...3 2.1 BACKGROUND...3 2.2 COMPUTER MODELING...3 3.0 EXISTING NOISE ENVIRONMENT...4 3.1 EXISTING SANTA MONICA MUNICIPAL AIRPORT NOISE...4
Pacifica. Short Term Aircraft Noise Monitoring
 Short Term Aircraft Noise Monitoring March March, Pacifica Prepared for the Oddstad Boulevard Park Pacifica Avenue Neighborhoods by San Francisco International Airport Noise Abatement Office P.O. Box 8097
Airport Noise Management Report 1st Quarter 2017
 Airport Noise Management Report The Airport Noise Management Report is a publication of the Airport Noise Management Office. This report provides a 1st quarter summary of St. Louis Lambert International
Portable Noise Monitor Report
 Portable Noise Monitor Report Chicago O Hare International Airport Site 221 5716 N. Virginia Avenue, Chicago July 23, 214 through August 11, 214 Visit the O Hare Noise Management Webpage on the Internet
Woodside Aircraft Noise Monitoring
 Woodside Aircraft Noise Monitoring Prepared by San Francisco International Airport Aircraft Noise Abatement Office Technical Report #042017-969 1st Quarter 2017 April 2017 Woodside Aircraft Noise Monitoring
Heathrow Community Noise and Track-keeping Report: Burhill
 Heathrow Community Noise and Track-keeping Report: Burhill This document reports on an 1-day period of continuous noise monitoring from 14 June 211 to 21 September 211 using a Larson Davies LD 87 sound
Short Term Monitoring Program Tarragindi Report, QLD
 Short Term Monitoring Program Change Summary Version 1: 30 Aug 2013 Section/ Clause Summary NRFC Table of Contents 1. Deployment Details...3 1.1 Deployment Purpose...3 1.2 Deployment Monitoring Period...3
LAX Community Noise Roundtable. Aircraft Noise 101. November 12, 2014
 LAX Community Noise Roundtable Aircraft Noise 101 November 12, 2014 Overview Roles and Responsibilities for Aircraft Noise Relevant Federal Regulations Relevant California Regulations Aircraft Noise Metrics
Airport Noise Management Report 3rd Quarter 2017
 Airport Noise Management Report 3rd Quarter 2017 The Airport Noise Management Report provides the 3rd quarter 2017 summary of St. Louis Lambert International Airport s operations and noise complaints.
Short Term Monitoring Program NSW, Caringbah Report. February 2013
 NSW, Caringbah Report February 2013 Version Control Version Number Date Detail 1.0 February 2013 Initial Release. 2.0 May 2013 Updated formatting for table 2. 3.0 January 2014 Figure 5 and L90 values updated
Helicopter Noise Analysis
 Clark County Department of Aviation Appendix D. Helicopter Noise Analysis D.1 General Characteristics of Helicopter Noise Helicopter noise originates from three components of the helicopter: the rotors,
APPENDIX C NOISE ANALYSIS
 APPENDIX C NOISE ANALYSIS KBE Final - 10/11/16 Existing Noise The extent of existing noise resulting from aircraft operations at Central Colorado Regional Airport (AEJ) was determined using the FAA-approved
Technical Report. Aircraft Noise Analysis. Portola Valley and Woodside, California. July Prepared by: Aircraft Noise Abatement Office
 Technical Report Aircraft Noise Analysis Portola Valley and Woodside, California Prepared by: San Francisco International Airport P.O. Box 8097 San Francisco, California 94128 (650) 821-5100 Introduction
Final. Hydroacoustic and Airborne Monitoring at the Naval Station. Mayport Interim Report June 2015
 Final Hydroacoustic and Airborne Monitoring at the Naval Station Submitted to: Naval Facilities Engineering Command Atlantic under HDR Environmental, Operations and Construction, Inc. Contract No. N62470-10-D-3011,
NOISE AND FLIGHT PATH MONITORING SYSTEM BRISBANE QUARTERLY REPORT JULY - SEPTEMBER 2011
 NOISE AND FLIGHT PATH MONITORING SYSTEM BRISBANE QUARTERLY REPORT JULY - SEPTEMBER 211 Date Version Comments Page 2 Foreword Airservices Australia has established a Noise and Flight Path Monitoring System
Portable Noise Monitor Report
 Portable Noise Monitor Report Chicago O Hare and Midway International Airports Site 217 1149 Candlewood Drive, Downers Grove May 17, 214 through May 31, 214 Visit the O Hare and Midway Noise Management
NOISE AND FLIGHT PATH MONITORING SYSTEM BRISBANE QUARTERLY REPORT OCTOBER - DECEMBER 2013
 NOISE AND FLIGHT PATH MONITORING SYSTEM BRISBANE QUARTERLY REPORT OCTOBER - DECEMBER 213 Date Version Comments Page 2 Foreword Airservices Australia has established a Noise and Flight Path Monitoring System
Northeast Stoney Trail In Calgary, Alberta
 aci Acoustical Consultants Inc. 5031 210 Street Edmonton, Alberta, Canada T6M 0A8 Phone: (780) 414-6373, Fax: (780) 414-6376 www.aciacoustical.com Environmental Noise Computer Modelling For Northeast Stoney
AIRSERVICES AUSTRALI A
 AIRSERVICES AUSTRALI A NOISE AND FLIGHT PATH MONITORING SYSTEM BRISBANE QUARTERLY REPORT JANUARY - MARCH 211 Page 2 Foreword Airservices Australia has established a Noise and Flight Path Monitoring System
Airport Noise Management System Chicago Midway International Airport
 3 rd Quarter 2018 Quarterly Report Airport Noise Management System Visit the Midway Noise webpage on the Internet at www.flychicago.com/midwaynoise Airport Noise Management System Quarterly Report Report
AIRSERVICES AUSTRALI A
 AIRSERVICES AUSTRALI A NOISE AND FLIGHT PATH MONITORING SYSTEM BRISBANE QUARTERLY REPORT APRIL - JUNE 211 Date Version Comments Page 2 Foreword Airservices Australia has established a Noise and Flight
Airport Noise Management System Chicago Midway International Airport
 2 nd Quarter 2018 Quarterly Report Airport Noise Management System Visit the Midway Noise webpage on the Internet at www.flychicago.com/midwaynoise Airport Noise Management System Quarterly Report Report
6.C.1 AIRPORT NOISE. Noise Analysis and Land Use Impact Assessment FORT LAUDERDALE-HOLLYWOOD INTERNATIONAL AIRPORT ENVIRONMENTAL IMPACT STATEMENT
 6.C.1 AIRPORT NOISE The existing land uses are described in Chapter Five, Affected Environment. The methodologies used to develop the Geographic Information System (GIS) land use database, the estimated
Appendix B Ultimate Airport Capacity and Delay Simulation Modeling Analysis
 Appendix B ULTIMATE AIRPORT CAPACITY & DELAY SIMULATION MODELING ANALYSIS B TABLE OF CONTENTS EXHIBITS TABLES B.1 Introduction... 1 B.2 Simulation Modeling Assumption and Methodology... 4 B.2.1 Runway
Airport Noise Management System Chicago Midway International Airport
 1 st Quarter 2018 Quarterly Report Airport Noise Management System Midway International Airport Visit the Midway Noise webpage on the Internet at www.flychicago.com/midwaynoise Airport Noise Management
Appendix A. Meeting Coordination. Appendix A
 Appendix A Meeting Coordination Appendix A Philadelphia International Airport Noise Compatibility Program Update FAR Part 150 Noise Compatibility Program Update Report Prepared by: DMJM Aviation AECOM
Airport Noise Management Report 1st Quarter 2018
 AIRPORT NOISE MANAGEMENT REPORT 1 ST QUARTER 2018 The Airport Noise Management Report provides the summary of St. Louis Lambert International Airport s operations and noise complaints. The data in this
Community Noise Monitoring Wareside John Campbell Campbell Associates Ltd
 Community Noise Monitoring Wareside John Campbell Campbell Associates Ltd Contents Page Number 1.0 Overview 2 2.0 Defining Aircraft Noise 4 3.0 Flights Arrivals and Departures 6 4.0 Number of Noise Events
Airport Noise Management System
 4 th Quarter 2009 Quarterly Report Airport Noise Management System City of Chicago Department of Aviation Visit the Community Noise Resource Center on the Internet at www.flychicago.com Airport Noise Management
Airport Noise Management System Chicago O Hare International Airport
 October 215 Monthly Report Airport Noise Management System Chicago O Hare International Airport Visit the O Hare Noise webpage on the Internet at www.flychicago.com/ordnoise Airport Noise Management System
Executive Summary. MASTER PLAN UPDATE Fort Collins-Loveland Municipal Airport
 Executive Summary MASTER PLAN UPDATE Fort Collins-Loveland Municipal Airport As a general aviation and commercial service airport, Fort Collins- Loveland Municipal Airport serves as an important niche
POST-IMPLEMENTATION COMMUNITY IMPACT REVIEW
 POST-IMPLEMENTATION COMMUNITY IMPACT REVIEW RNAV STAR updates and RNP AR approaches at Winnipeg James Armstrong Richardson International Airport NAV CANADA 77 Metcalfe Street Ottawa, Ontario K1P 5L6 November
NOISE AND FLIGHT PATH MONITORING SYSTEM MELBOURNE QUARTERLY REPORT JULY - SEPTEMBER 2011
 NOISE AND FLIGHT PATH MONITORING SYSTEM MELBOURNE QUARTERLY REPORT JULY - SEPTEMBER 211 Date Version Comments Page 2 Foreword Airservices Australia has established a Noise and Flight Path Monitoring System
NOISE AND FLIGHT PATH MONITORING SYSTEM MELBOURNE QUARTERLY REPORT OCTOBER - DECEMBER 2012
 NOISE AND FLIGHT PATH MONITORING SYSTEM MELBOURNE QUARTERLY REPORT OCTOBER - DECEMBER 212 Date Version Comments Page 2 Foreword Airservices Australia has established a Noise and Flight Path Monitoring
NOISE AND FLIGHT PATH MONITORING SYSTEM MELBOURNE QUARTERLY REPORT JULY - SEPTEMBER 2013
 NOISE AND FLIGHT PATH MONITORING SYSTEM MELBOURNE QUARTERLY REPORT JULY - SEPTEMBER 213 Date Version Comments Page 2 Foreword Airservices Australia has established a Noise and Flight Path Monitoring System
Airport Noise Management System Chicago O Hare International Airport
 November 218 Monthly Report Airport Noise Management System Chicago O Hare International Airport Visit the O Hare Noise webpage on the Internet at www.flychicago.com/ordnoise Airport Noise Management System
Airport Noise Management System Chicago O Hare International Airport
 December 218 Monthly Report Airport Noise Management System Chicago O Hare International Airport Visit the O Hare Noise webpage on the Internet at www.flychicago.com/ordnoise Airport Noise Management System
Key Purpose & Need Issues
 Key Purpose & Need Issues Efficiently meet demand through the 2025 planning horizon 864,000+ annual operations 180-200 operations during peak daytime hours Balance peak hour arrival/departure capability
Cairns Airport Aircraft Noise Information Report. Quarter (July to September)
") Cairns Airport Aircraft Noise Information Report Quarter 3 2012 (July to September) 1 Version Control Version Number Detail Prepared by Date 1 - Environment 19 December 2012 Airservices Australia. All
Cairns Airport Aircraft Noise Information Report Quarter 3 2012 (July to September) 1 Version Control Version Number Detail Prepared by Date 1 - Environment 19 December 2012 Airservices Australia. All
Washington Dulles International Airport (IAD) Aircraft Noise Contour Map Update. Ultimate Operations 5th Working Group Briefing 9/25/18
 Aircraft Noise Contour Map Update. Ultimate Operations 5th Working Group Briefing 9/25/18") Washington Dulles International Airport (IAD) Aircraft Noise Contour Map Update Ultimate Operations 5th Working Group Briefing 9/25/18 Meeting Purpose Discuss methodology of Ultimate build scenario operations
Washington Dulles International Airport (IAD) Aircraft Noise Contour Map Update Ultimate Operations 5th Working Group Briefing 9/25/18 Meeting Purpose Discuss methodology of Ultimate build scenario operations
Airport Noise Management Report 1st Quarter 2018
 AIRPORT NOISE MANAGEMENT REPORT 2 nd QUARTER 2018 Airport Noise Management Report 1st Quarter 2018 The Airport Noise Management Report provides the 2nd Quarter 2018 summary of St. Louis Lambert International
Airport Noise Management System Chicago Midway International Airport
 4 th Quarter 2018 Quarterly Report Airport Noise Management System Visit the Midway Noise webpage on the Internet at www.flychicago.com/midwaynoise Airport Noise Management System Quarterly Report Report
Airport Noise Management System Chicago Midway International Airport
 4 th Quarter 2017 Quarterly Report Airport Noise Management System Visit the Midway Noise webpage on the Internet at www.flychicago.com/midwaynoise Airport Noise Management System Quarterly Report Report
Airport Noise Management System Chicago O Hare International Airport
 March 218 Monthly Report Airport Noise Management System Chicago O Hare International Airport Visit the O Hare Noise webpage on the Internet at www.flychicago.com/ordnoise Airport Noise Management System
Massport and FAA RNAV Pilot Study Overview Briefing to Massport CAC. December 8, 2016
 Massport and FAA RNAV Pilot Study Overview Briefing to Massport CAC December 8, 2016 Contents FAA/Massport RNAV MOU Context Boston Logan Context FAA RNAV MOU, Overview Q&A 12/8/2016 2 FAA/Massport RNAV
POST-IMPLEMENTATION COMMUNITY IMPACT REVIEW
 POST-IMPLEMENTATION COMMUNITY IMPACT REVIEW RNAV STAR updates and RNP AR approaches at Edmonton International Airport NAV CANADA 77 Metcalfe Street Ottawa, Ontario K1P 5L6 January 2018 The information
Noise Issues. Dr. Antonio A. Trani Professor
 Noise Issues CEE 4674 Analysis of Air Transportation Systems Dr. Antonio A. Trani Professor Virginia Tech - Air Transportation Systems Laboratory What is Noise? Many definitions of noise exist Unwanted
> Aircraft Noise. Bankstown Airport Master Plan 2004/05 > 96
 Bankstown Airport Master Plan 2004/05 > 96 24.1 Why Is Aircraft Noise Modelled? Modelling of the noise impact of aircraft operations has been undertaken as part of this MP. Such modelling is undertaken
Airport Noise Management System Chicago O Hare International Airport
 August 218 Monthly Report Airport Noise Management System Chicago O Hare International Airport Visit the O Hare Noise webpage on the Internet at www.flychicago.com/ordnoise Airport Noise Management System
Airport Noise Management System
 July Monthly Report Airport Noise Management System Chicago O Hare International Airport City of Chicago Department of Aviation Visit the Community Noise Resource Center on the Internet at www.flychicago.com
WELCOME! FORT LAUDERDALE-HOLLYWOOD INTERNATIONAL AIRPORT 14 CFR PART 150 NOISE AND LAND USE COMPATIBILITY STUDY
 WELCOME! FORT LAUDERDALE-HOLLYWOOD INTERNATIONAL AIRPORT 14 CFR PART 150 NOISE AND LAND USE COMPATIBILITY STUDY Public Information Workshop November 2017 1 14 CFR Part 150 Overview Establishes the methodology
Community Noise Monitoring Saffron Walden John Campbell Campbell Associates Ltd
 Community Noise Monitoring Saffron Walden John Campbell Campbell Associates Ltd Contents Page Number 1.0 Overview 2 2.0 Defining Aircraft Noise 4 3.0 Flights Arrivals and Departures 6 4.0 Number of Noise
Cairns Airport Aircraft Noise Information Report
 Cairns Airport Aircraft Noise Information Report Quarter 4 2013 (October to December) 1 Version Control Version Number Detail Prepared by Date 1 - Environment February 2014 Airservices Australia. All rights
Welcome to Public Information Workshop 1. San Francisco International Airport FAR Part 150 Study Update Noise Exposure Map Report
 Welcome to Public Information Workshop 1 Chetcuti Room, City of Milbrae 450 Poplar Avenue Milbrae, California 94030 Wednesday, June 4, 2014 5:45 p.m. to 6:45 p.m. PDT The FAA typically uses the airport
Airport Noise Management System Chicago O Hare International Airport
 June 218 Monthly Report Airport Noise Management System Chicago O Hare International Airport Visit the O Hare Noise webpage on the Internet at www.flychicago.com/ordnoise Airport Noise Management System
Noise Oversight Committee
 Noise Oversight Committee May 8, 2014 Audio/Video recordings are made of this meeting 1 Item 1 Review and Approve Draft Meeting Minutes Minutes from March 19, 2014 2 Item 2 Review of Operations Report
SAN FRANCISCO INTERNATIONAL AIRPORT CITY & COUNTY OF SAN FRANCISCO MEMORANDUM
 SAN FRANCISCO INTERNATIONAL AIRPORT CITY & COUNTY OF SAN FRANCISCO MEMORANDUM TO: MONTARA COMMUNITY FROM: SAN FRANCISCO INTERNATIONAL AIRPORT AIRCRAFT NOISE ABATEMENT OFFICE SUBJECT: MONTARA SHORT-TERM
Airport Noise Management System Chicago O Hare International Airport
 July 217 Monthly Report Airport Noise Management System Chicago O Hare International Airport Visit the O Hare Noise webpage on the Internet at www.flychicago.com/ordnoise Airport Noise Management System
CEE Quick Overview of Aircraft Classifications. January 2018
 CEE 5614 Quick Overview of Aircraft Classifications Dr. Antonio A. Trani Professor Civil and Environmental Engineering January 2018 1 Material Presented The aircraft and its impact operations in the NAS
Airport Noise Management System Chicago O Hare International Airport
 August 217 Monthly Report Airport Noise Management System Chicago O Hare International Airport Visit the O Hare Noise webpage on the Internet at www.flychicago.com/ordnoise Airport Noise Management System
Airport Noise Management System Chicago Midway International Airport
 2 nd Quarter 2017 Quarterly Report Airport Noise Management System Visit the Midway Noise webpage on the Internet at www.flychicago.com/midwaynoise Airport Noise Management System Quarterly Report Report
Small Aircraft Transportation System (SATS) Environmental Noise Impact Study
 Environmental Noise Impact Study") Small Aircraft Transportation System (SATS) Environmental Noise Impact Study Dr. Antonio A. Trani Howard Swingle Dr. Hojong Baik Dr. Dusan Teodorovic Chad Ackley Department of Civil and Environmental Engineering
Small Aircraft Transportation System (SATS) Environmental Noise Impact Study Dr. Antonio A. Trani Howard Swingle Dr. Hojong Baik Dr. Dusan Teodorovic Chad Ackley Department of Civil and Environmental Engineering
Quiet Climb. 26 AERO First-Quarter 2003 January
 Quiet Climb Boeing has developed the Quiet Climb System, an automated avionics feature for quiet procedures that involve thrust cutback after takeoff. By reducing and restoring thrust automatically, the
SUBURBAN O HARE COMMISSION ORD RUNWAY ROTATION PLAN ANALYSIS AND RECOMMENDATIONS
 SUBURBAN O HARE COMMISSION ORD RUNWAY ROTATION PLAN ANALYSIS AND RECOMMENDATIONS Final Report JDA 4720 Montgomery Lane Suite 950 Bethesda, MD 20814 301-941-1460 info@jdasolutions.aero Contents 1. INTRODUCTION...
Airport Noise Management System Chicago Midway International Airport
 4 th Quarter 2014 Quarterly Report Airport Noise Management System Visit the Midway Noise Management webpage on the Internet at www.flychicago.com Airport Noise Management System Quarterly Report Report
1. Introduction History of FAR Part Noise Compatibility Program Planning Process Noise Exposure Maps.
 1-1 1. 1.1. History of FAR Part 150 The Part 150 Noise Compatibility Program originated from the Aviation Safety and Noise Abatement Act of 1979 1. This Act provides the regulatory guidance used to develop
Boston Logan International Airport Operational Overview
 Boston Logan International Airport Operational Overview Presentation to the Massport Community Advisory Committee June 8, 2017 Updated 12/07/17 Content Overview of Logan Runway Designations Runway Configurations
Perth Noise Abatement Procedures - Change to Preferred Runways
 Environmental Analysis Summary Preferred Runways Perth Perth Airport Perth Noise Abatement Procedures - Change to Preferred Runways Environmental Analysis Summary April 2016 1 of 10 Environment Analysis
Noise Compatibility Year End Report. March 7, 2011
 2 Year End Report March 7, 2 Noise Highlights of 2 Airport operations for Year 2 were down 3.2%, compared to Year 29 Operations of aircraft meeting Stage 3 requirements through presence of a hush kit for
FACILITY REQUIREMENTS SUMMARY OF KEY ISSUES OVERVIEW
 FACILITY REQUIREMENTS SUMMARY OF KEY ISSUES OVERVIEW This summary is intended to provide a brief overview of the key issues associated with conformance to FAA standards at Methow Valley State Airport.
Noise Compatibility Year End, 2012
 Year End, 2012 April 5, 2013 Noise Highlights of 2012 Airport operations for Year 2012 were down 3.97%, compared to Year 2011. The FAA issued a Record of Approval (ROA) for the new Program (NCP) Update
Buchanan Field. Airport Planning Program. FAR Part 150 Meeting. September 28, Master Plan FAR Part 150 Noise Study Strategic Business Plan
 Airport Planning Program Master Plan FAR Part 150 ise Study Strategic Business Plan FAR Part 150 Meeting September 28, 2006 Agenda Introduction Part 150 Study Working Paper Two Operational Alternatives
POST-IMPLEMENTATION COMMUNITY IMPACT REVIEW
 POST-IMPLEMENTATION COMMUNITY IMPACT REVIEW RNAV STAR updates and RNP AR approaches at Halifax Stanfield International Airport NAV CANADA 77 Metcalfe Street Ottawa, Ontario K1P 5L6 November 2017 The information
Canberra Airport Aircraft Noise Information Report
 Canberra Airport Aircraft Noise Information Report Quarter 1 2016 (January to March) 1 Version Control Version Number Detail Prepared by Date 1 - Environment June 2016 Airservices Australia. All rights
REPORT No.: 190NOY015. TITLE: Embraer 190 Noise Levels - Technical Substantiation for Bromma Airport Operation ATA 2200 No.
 Page: 1 of 33 ISSUED BY: EMBRAER VEC//GIR/0002 REPORT No.: 190NOY015 PROGRAM: E-Jets TITLE: Embraer 190 Noise Levels - Technical Substantiation for Bromma Airport Operation ATA 2200 No.: Not applicable
Revised National Business Aviation Association (NBAA) Noise Abatement Departure Procedures (NADPs) Noise Compatibility Committee
 Noise Abatement Departure Procedures (NADPs) Noise Compatibility Committee") Revised National Business Aviation Association (NBAA) Noise Abatement Departure Procedures (NADPs) Presentation to: Noise Compatibility Committee October 29, 2015 Ted Baldwin What are NADPs? Departure
Revised National Business Aviation Association (NBAA) Noise Abatement Departure Procedures (NADPs) Presentation to: Noise Compatibility Committee October 29, 2015 Ted Baldwin What are NADPs? Departure
CESSNA SECTION 5 PERFORMANCE
 CESSNA SECTION 5 TABLE OF CONTENTS Page Introduction............................................5-3 Use of Performance Charts................................5-3 Sample Problem........................................5-4
FRENCH VALLEY AIRPORT (F70) Sky Canyon Dr. Murrieta, CA. Phone: Riverside FAA FSDO Complaint Line: (951)
 Sky Canyon Dr. Murrieta, CA. Phone: Riverside FAA FSDO Complaint Line: (951)") FRENCH VALLEY AIRPORT (F70) 37600 Sky Canyon Dr. Murrieta, CA Phone: 951-600-7297 Riverside FAA FSDO Complaint Line: (951) 276-6701 Visit the F70 website for additional information regarding the airport
FRENCH VALLEY AIRPORT (F70) 37600 Sky Canyon Dr. Murrieta, CA Phone: 951-600-7297 Riverside FAA FSDO Complaint Line: (951) 276-6701 Visit the F70 website for additional information regarding the airport
Perth Airport. Runway 21 Night-Time Departure Trial Proposal. Environmental Analysis Summary. August Airservices Australia 1 of 17
 Perth Airport Runway 21 Night-Time Departure Trial Proposal Environmental Analysis Summary August 2015 Airservices Australia 1 of 17 Change Summary Version Date Change Description Amended by 1 6 August
Airport Noise Management System Quarterly Report. Chicago Midway International Airport
 Airport Noise Management System Quarterly Report City of Chicago Department of Aviation 3rd Quarter 2008 July, August and September Visit the Community Resource Center on the Internet at www.flychicago.com
Ted Stevens Anchorage International Airport FAR Part 150 Study Update Glossary of Common Acoustic and Air Traffic Control Terms
 Ted Stevens Anchorage International Airport FAR Part 150 Study Update Glossary of Common Acoustic and Air Traffic Control Terms ADOT&PF (Alaska Department of Transportation and Public Facilities): The