ColumbusJACK/Regent. The Strength of Experience
|
|
|
- Phoebe Glenn
- 6 years ago
- Views:
Transcription


1 ColumbusJACK/Regent The Strength of Experience
2 ColumbusJACK/Regent ColumbusJACK and Regent Manufacturing have combined to become the World Leader in Ground Support Equipment Over 50 Years Service to the International Military Community Over 70 Years Service to the International Aviation and Aerospace Community Over 1800 National Stock Numbered (NSN) parts in the military system World Wide Sales, Support and Service A Veteran Management and Engineering Team with a solid reputation and over 150 years combined industry experience

3 Over 40,000 Square Feet of Office and Manufacturing Area Complete Weld and Machine Shop Facilities On-Site Sandblast and Paint Operations Inspection with NDI Capabilities 175 Ton Dynamic Test Stand Located in Columbus, Ohio

4 ColumbusJACK/Regent ISO 9001:2008 Registered
5 ColumbusJACK/Regent Our Quality Policy ColumbusJACK /Regent designs, manufactures, services and repairs products related to aircraft ground support equipment. Our management and employees are committed to meeting and exceeding the needs and expectations of our customers. Customer satisfaction is our ultimate goal. We will accomplish this by complying with all customer, statutory, and regulatory requirements and continuous product and service improvement.


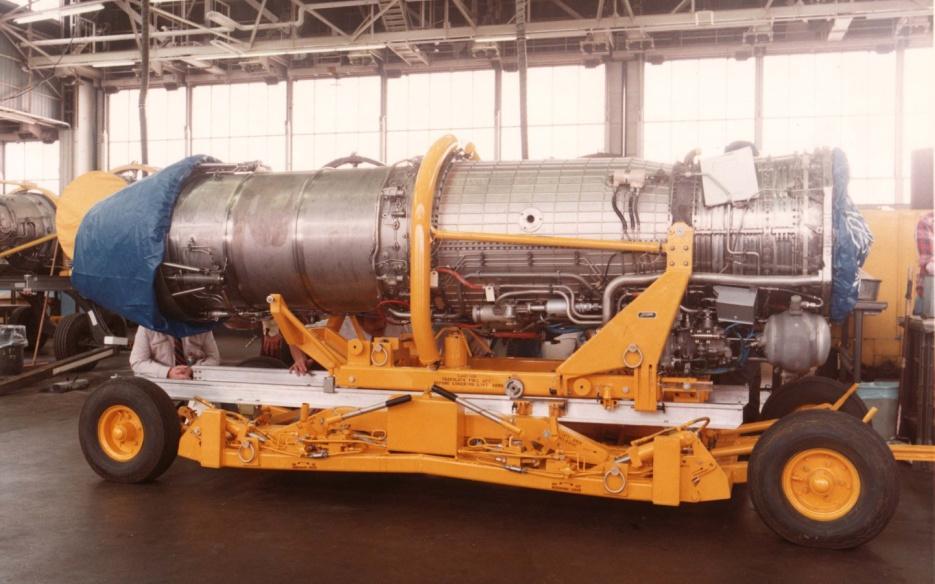
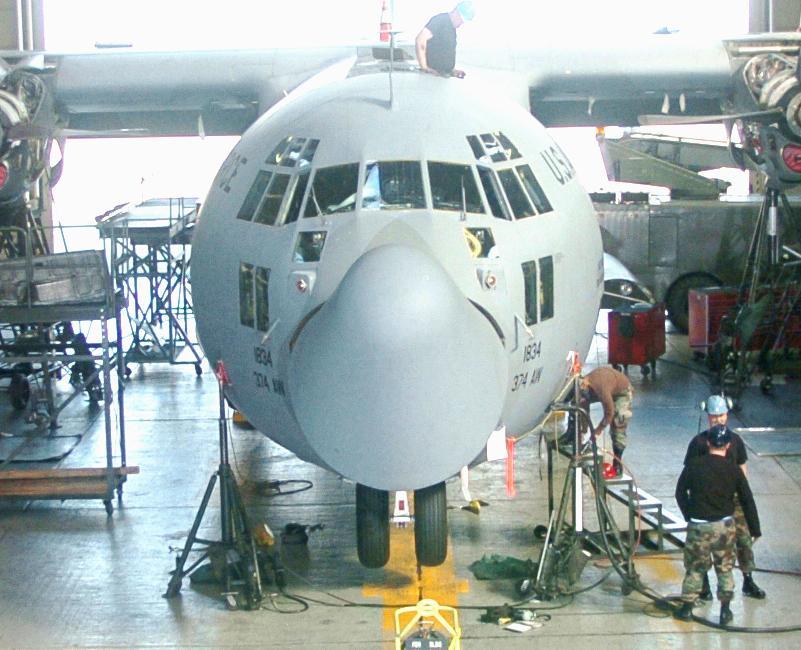
6 Aircraft Jacks Cranes & Hoists Utility Trailers Bead Breakers Aircraft Weighing Systems Positioning Trailers Recovery Systems Training & Repair Facility


7 Aircraft Jacks Alligator TM Jacks Tons Hand Carry Jacks 3 50 Tons


8 Aircraft Jacks Rhino TM Jacks Tons Air Operated Rapid Extension and Retraction Portable Systems 35 Ton C-130 System


9 Aircraft Jacks Fixed Height Tripod Jacks Tons Variable Height Tripod Jacks 5 30 Tons


10 Cranes & Hoists lb Capacity


11 Recovery Systems Ton Capacity Jacking Systems Single Operator Control Console Independent Leg Control allows Jack to follow arc during lift Automatic Locknuts for Safety


12 Aircraft Weighing Systems Under Axle Jacking System Compatible with Major Load Cell Manufacturers Single Point Console Operation Lockable Covered Storage For All Military Aircraft Load Cells and Digital Read-Outs Not Included
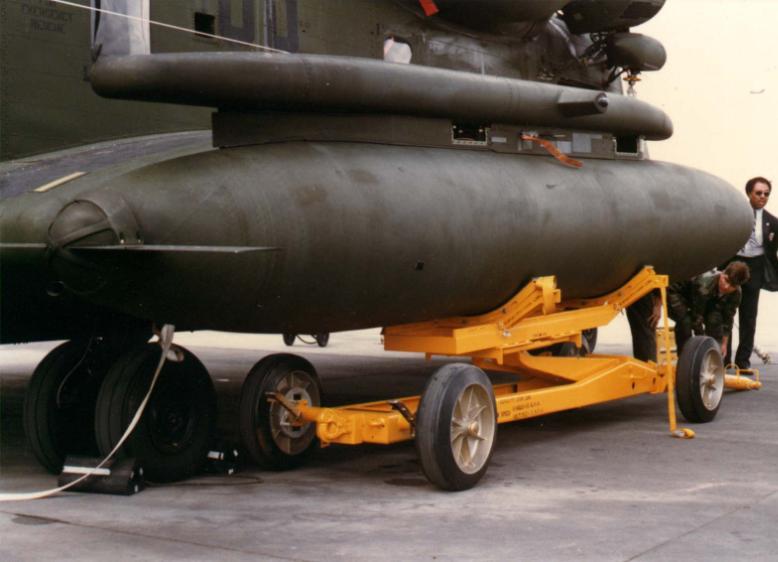


13 Positioning Trailers Up to 10,000 lb Capacity


14 Transportation Trailers Up to 10,000 lb Capacity


15 Utility Trailers Transport GSE Quickly and Safely up to 55 mph 4,000 7,000 lb Capacities Customized to your needs with Lights, Nitrogen Charging Systems and Support Brackets

16 Nitrogen / Oxygen Carts 3 Bottle Capacity Frame Tilts Vertical for easy Bottle Installation and Removal 3000 psi Capability Booster Units available


17 Wheel & Brake Dollies Up to 1,000 lb Capacity For All Military Aircraft


18 Bead Breakers 2,000 60,000 lb Capacity For Helicopter, Fighter and Transport Aircraft Multi-Aircraft Adjustable Spiders


19 Jack Testers Up to 150 Ton Capacity Test jacks from 4 to 240 inches tall Multiple styles allow testing the whole jack or just the cylinder Stationary and portable models available Test all axle and tripod jacks, regardless of manufacturer


20 Special Equipment Special Equipment designed for your application Qualification Testing Capabilities


21 Overhaul & Refurbishment ColumbusJack / Regent has the capability to overhaul all makes and models of axle and tripod jacks. Overhaul includes complete disassembly and inspection of all components to determine if the OEM core can be refurbished or must be replaced. From This To This
22 Overhaul & Refurbishment Worn components are replaced with OEM parts. New OEM seal kits are installed. Repainting jack with skydrol resistant paint available. Load testing is provided and includes adjustments to manufactures factory settings. Complete test certifications provided with each jack.
23 Training Courses are conducted for Operation, Maintenance and Repair of all ColumbusJACK and Regent Equipment at Columbus, Ohio Facility. Courses provide the right mix of hands-on and classroom learning. Customized courses can be designed to meet specific customer requirements. Courses are conducted at regular intervals or can be scheduled upon request. Training and commissioning of equipment on-site is available.


24 Training Course subjects include: Basic Hydraulics Equipment Operation Preventative Maintenance Repair and Overhaul Troubleshooting Testing Participants learn everything needed to maintain their equipment, minimizing the risk of damage and maximizing the return on investment.
25 Customers (Partial Listing) Aer Lingus Aero Mexico Aeroflot Russian Int'l Airlines Aerolineas Argentinas Aerospatiale AIDC Air 2000 Air Canada Air China Air France Air India Air Jamaica Air New Zealand Airborne Express AirTrans Airways Alaska Airlines Alitalia All Nippon Airways ANA Trading Aloha Airlines Alsalam Aircraft Company AMECO America West Airlines American Airlines American Trans Air Ansett Aircraft Spares & Services Ansett Australia Ansett Industries Ansett New Zealand Aramco Services Argentine Airlines Asiana Airlines Atlantic Aviation Austrian Aviation Avianca Aviation Methods, Inc. Balkan-Bulgarian Airlines Beech Aerospace Beech Aircraft Corporation Bell Helicopter-Textron Boeing Aerospace Boeing Space & Defense Boeing Commercial Airplane Boeing Military Airplane Boeing North American Boeing Vertol Helicopter Bombardier Britannia Airways British Aerospace British Airways Butler Aviation CAAC Canadair-Bombardier Canadian Airlines International Cathay Pacific Airways Cebu Air, Inc Cessna Aircraft Company China Airlines China Eastern Airlines China Northern Airlines China Southern Airlines China Southwest Airlines Commodore Aviation Continental Airlines CSA-Czech Airlines Dalfort Aviation de Havilland-Bombardier Dee Howard Company Delta Air Lines Derco Aeospace DHL Airlines Disneyland Entertainment Douglas Aircraft Company DPD DynAir Commercial Aviation Services E-Systems-Raytheon Egyptair El Al Israel Airlines Emirates Airlines Ethiopian Airlines Euralair EVA Airways Evergreen International Airlines Far Eastern Air Transport Corp Federal Express Finnair Formosa Airlines Frontier Airlines Fuji Industries GAMCO GAMECO Garuda Indonesia Godfrey Aerospace Great China Airlines Greenwich Air Services Gulf Air Gulfstream Aerospace HAECO Hawaiian Air Hughes Aircraft Iberia Indian Airlines IPTN Iran Air Israel Aircraft Industries, Int'l JAL Trading Japan Airlines Japan Defense Agency KLM Royal Dutch Airlines Korean Air Kuwait Airways LAN Chile Lauda Air Learjet Lloyd Aero Boliviano Lockheed-Martin-Denver Lockheed-Martin-Ft Worth Lockheed-Martin-Marietta Lockheed-Lockheed-Palmdale Lockheed- Martin Aircraft Services Lockheed-Martin Space Operations-KSC Lockheed Aeromod Centers LOT-Polish Airlines LTU Lufthansa LTV Makung Airlines Malaysia Airlines Marshall Aerospace Matrix Aeronautica McDonnell Douglas Aircraft McDonnell Douglas Helicopter Mexicana NASA Space Division-KSC Northrop-Grumman B2 Div Northrop-Grumman Northwest Airlines NWAC-Lakehurst Olympic Airways Page Avjet Corporation Pakistan Int'l Airlines Pemco World Air Services Philippine Airlines Professional Modification Services Qantas Raytheon Aerospace Services Raytheon Aircraft Company Rocketdyne Rockwell Int'l Corp Royal Air Maroc Royal Jordanian Sabena Saudi Arabian Airlines Scandinavian Airlines Systems Shanghai Airlines Sikorsky Aircraft Singapore Airlines South African Airways Southern Air Transport Southwest Airlines Swissair TACA Int'l Airlines TAESA TAP-Air Portugal Teledyne Ryan Thai Airways Int'l Timco Tower Air Tramco Trans World Airlines Transaero TransAsia Airways Transbrasil TRW Turkish Airlines United Space Alliance U-Land Airlines UNI Airways U.S. Air Force U.S. Air National Guard U.S. Army U.S. Coast Guard U.S. Marines U.S. Navy USAir Varig Vasp Vietnam Airlines Zantop Int l


26 ColumbusJACK / Regent Your Military GSE Supplier
Prediction of Skytrax airline rankings, short formula (2e)
") Site: Wiki of Science at http://wikiofscience.wikidot.com Source page: 20120725 - Prediction of Skytrax airline rankings, short formula (2e) - 2010 at http://wikiofscience.wikidot.com/print:20120725-skytrax-al-short-perezgonzalez2010
Site: Wiki of Science at http://wikiofscience.wikidot.com Source page: 20120725 - Prediction of Skytrax airline rankings, short formula (2e) - 2010 at http://wikiofscience.wikidot.com/print:20120725-skytrax-al-short-perezgonzalez2010
The contents of this report may not be reproduced without the written consent of COHOR.
 Nice Côte d Azur Airport NCE/LFMN Summer 2018 - Start Of Season Report Report data extraction date: 27 March 2018 Table of contents Evolution of allocated slots at the Start Of Season (SOS)... 2 Total
PORT OF SEATTLE - STIA PFC Quarterly Status Report - Revenue and Expenditures Activity thru 03/31/2016
 PORT OF SEATTLE - STIA PFC Quarterly Status Report - Revenue and Activity thru 03/31/2016 Total Collection Authority $2,167,378,460 Approved for Collection Approved for Use Approved Applications "Impose"
Heathrow Airport (LHR)
") Heathrow Airport (LHR) Summer 2018 (S18) Start of Season Report Report Date: Wed 21Mar2018 Headlines S18 Start vs. S17 Start vs. S17 End Total Air Transport Movements (Passenger & Freight) 294775 0.2%
Heathrow Airport (LHR) Summer 2018 (S18) Start of Season Report Report Date: Wed 21Mar2018 Headlines S18 Start vs. S17 Start vs. S17 End Total Air Transport Movements (Passenger & Freight) 294775 0.2%
Remedy awarded (complaints decided in qtr)
") Quarterly complaints data for Q2 2018 from the CAA Approved ADR entities and the CAA s Passenger Advice and Team ADR entity No remedy per million pax Total Average award consumers Air Canada/Canada Rouge
Quarterly complaints data for Q2 2018 from the CAA Approved ADR entities and the CAA s Passenger Advice and Team ADR entity No remedy per million pax Total Average award consumers Air Canada/Canada Rouge
PORT OF SEATTLE - STIA PFC Quarterly Status Report - Revenue and Expenditures Activity thru 06/30/2016
 PORT OF SEATTLE - STIA PFC Quarterly Status Report - Revenue and Activity thru 06/30/2016 Total Collection Authority $2,167,378,460 Approved for Collection Approved for Use Approved Applications "Impose"
Number of complaints decided where a financial remedy awarded. Number of complaints received others
 Quarterly data for Q4 2017 from the CAA Approved entities and the CAA s Passenger Advice and Complaints Team Airline / Airport name of Aegean Airlines PACT 2 0 0 1 3 17 - - 25% Aer Lingus PACT 12 0 7 17
The contents of this report may not be reproduced without the written consent of COHOR.
 Nice Côte d Azur Airport NCE/LFMN Winter 2018 - Start Of Season Report Report data extraction date: 31 October 2018 Table of contents Evolution of allocated slots at the Start Of Season (SOS)... 2 Total
83410 MCCARRAN INTERNATIONAL AIRPORT Terminal 1 - Charter ALLEGIANT 186,800 OMNI AIR 25,784, ,116, ,300,
 83410 MCCARRAN INTERNATIONAL AIRPORT 1 ------------ ------------------ Terminal 1 - Scheduled AMERICA WEST 3,948,072,900 3,962,418,000 3,628,627,580 3,801,712,248 4,122,859,072 3,952,263,284 AMERICAN 796,685,000
83410 MCCARRAN INTERNATIONAL AIRPORT Terminal 1 - Charter ALLEGIANT 2 OMNI AIR SUNRISE AIRLINES 236 LEGEN
 83410 MCCARRAN INTERNATIONAL AIRPORT 1 ------------ ------------------ Terminal 1 - Scheduled AMERICA WEST 30,229 30,117 27,530 27,612 29,632 28,097 AMERICAN 6,560 5,794 5,567 8,176 10,950 8,132 CONTINENTAL
PORT OF SEATTLE - STIA PFC Quarterly Status Report - Revenue and Expenditures Activity thru 12/31/2016
 PORT OF SEATTLE - STIA PFC Quarterly Status Report - Revenue and Activity thru 12/31/2016 Total Collection Authority $2,167,378,460 Approved for Collection Approved for Use Approved Applications "Impose"
PORT OF SEATTLE - STIA PFC Quarterly Status Report - Revenue and Expenditures Activity thru 03/31/2017 No change since 2016 Q4
 PORT OF SEATTLE - STIA PFC Quarterly Status Report - Revenue and Activity thru 03/31/2017 No change since 2016 Q4 Total Collection Authority $2,167,378,460 Approved for Collection Approved for Use Approved
Los Angeles World Airports (LAWA) Traffic Comparison (TCOM) Los Angeles International Airport
 Traffic Comparison (TCOM) Los Angeles International Airport") Los Angeles World Airports (LAWA) Traffic Comparison (TCOM) Los Angeles Airport Passenger Traffic s 1 3,43,69 1,6,73 September 1 3,85,664 1,5,195 4.47% Calendar YTD September 9 % Change 1 9 3,4,561 31,6,815
Los Angeles World Airports (LAWA) Traffic Comparison (TCOM) Los Angeles Airport Passenger Traffic s 1 3,43,69 1,6,73 September 1 3,85,664 1,5,195 4.47% Calendar YTD September 9 % Change 1 9 3,4,561 31,6,815
Los Angeles World Airports (LAWA) Traffic Comparison (TCOM) Los Angeles International Airport
 Traffic Comparison (TCOM) Los Angeles International Airport") Los Angeles World Airports (LAWA) Traffic Comparison (TCOM) Los Angeles Airport Passenger Traffic s 1 3,75,6 1,34,133 December 1 3,474,16 1,35,576 7.% Calendar YTD December 9 % Change 1 9 43,134,145 41,419,913
Los Angeles World Airports (LAWA) Traffic Comparison (TCOM) Los Angeles Airport Passenger Traffic s 1 3,75,6 1,34,133 December 1 3,474,16 1,35,576 7.% Calendar YTD December 9 % Change 1 9 43,134,145 41,419,913
Lyon St Exupéry Airport LYS/LFLL
 Lyon St Exupéry Airport LYS/LFLL Winter 2018 - Start Of Season Report Report data extraction date: 30 October 2018 Table of contents Evolution of allocated slots at the Start Of Season (SOS)... 2 Slots
SAN FRANCISCO INTERNATIONAL AIRPORT
 SAN FRANCISCO INTERNATIONAL AIRPORT COMPARATIVE TRAFFIC REPORT February 2005 Fiscal Year-To-Date Feb 2005 Feb 2004 % Change 2005 2004 % Change Flight Operations - Total * Air Carrier Air Taxi Civil Military
Japan Export Air. International Air Freight Fuel Surcharge. All Destinations
 Japan Export Air January 12, 218 International Air Freight Fuel Surcharge Carrier 3K Jet Star Asia Airways 66 1-Jan-15 Taiwan, Philippines 48 1-Jan-15 5C C.A.L. Cargo 13 1-Oct-12 China, Hong Kong, Korea,
Japan Export Air. International Air Freight Fuel Surcharge. All Destinations
 Japan Export Air January 3, 218 International Air Freight Fuel Surcharge Carrier 3K Jet Star Asia Airways All s 66 1-Jan-15 Taiwan, Philippines 48 1-Jan-15 5C C.A.L. Cargo All s 13 1-Oct-12 China, Hong
SAN FRANCISCO INTERNATIONAL AIRPORT
 SAN FRANCISCO INTERNATIONAL AIRPORT COMPARATIVE TRAFFIC REPORT December 2004 Fiscal Year-To-Date Dec 2004 Dec 2003 % Change 2004 2003 % Change Flight Operations - Total * Air Carrier Air Taxi Civil Military
Japan Export Air. International Air Freight Fuel Surcharge. All Destinations
 Japan Export Air March 30, 2019 International Air Freight Fuel Surcharge 3K Jet Star Asia Airways All s 66 1-Jan-15 Taiwan, Philippines 48 1-Jan-15 5C C.A.L. Cargo All s 130 1-Oct-12 China, Hong Kong,
SAN FRANCISCO INTERNATIONAL AIRPORT
 SAN FRANCISCO INTERNATIONAL AIRPORT COMPARATIVE TRAFFIC REPORT March 2005 Fiscal Year-To-Date Mar 2005 Mar 2004 % Change 2005 2004 % Change Flight Operations - Total * Air Carrier Air Taxi Civil Military
Japan Export Air. International Air Freight Fuel Surcharge. All Destinations
 Japan Export Air February 27, 2019 International Air Freight Fuel Surcharge 3K Jet Star Asia Airways All s 66 1-Jan-15 Taiwan, Philippines 48 1-Jan-15 5C C.A.L. Cargo All s 130 1-Oct-12 China, Hong Kong,
Los Angeles World Airports (LAWA) Traffic Comparison (TCOM) Los Angeles International Airport Calendar YTD January to December
 Traffic Comparison (TCOM) Los Angeles International Airport Calendar YTD January to December") Los Angeles World Airports (LAWA) Traffic Comparison (TCOM) Los Angeles Airport Calendar YTD January to December Jan-214 Jan-213 to to Dec-214 Dec-213 % Change Dec-214 Dec-213 % Change Passenger Traffic
Los Angeles World Airports (LAWA) Traffic Comparison (TCOM) Los Angeles Airport Calendar YTD January to December Jan-214 Jan-213 to to Dec-214 Dec-213 % Change Dec-214 Dec-213 % Change Passenger Traffic
PORT OF SEATTLE - STIA PFC Quarterly Status Report - Revenue and Expenditures Activity thru 09/30/2017
 PORT OF SEATTLE - STIA PFC Quarterly Status Report - Revenue and Activity thru 09/30/2017 Total Collection Authority $3,841,864,375 Approved for Collection Approved for Use Approved Applications "Impose"
Aircraft maintenance employment opportunities
 Aircraft maintenance employment opportunities There are at least nine different categories of employment opportunities that FAA A&P mechanic certification will provide for you in aircraft maintenance.
CONSTITUTION HEATHROW AIRPORT USERS COMMITTEE
 HEATHROW AIRPORT USERS COMMITTEE CONSTITUTION HEATHROW AIRPORT USERS COMMITTEE Heathrow AUC Constitution Page 1 of 9 Version 2 VERSION CONTROL Version # Effective Date Issued By: 1 January 2000 Initial
ETOPS, Extended Operations, and En Route Alternate Airports
 FAA / AAAE Basic Airport Safety & Operations Specialists School 22 October 2003 ETOPS, Extended Operations, and En Route Alternate Airports Brad Bachtel, C.M. Airport Technology Boeing Commercial Airplanes
London Heathrow CDA Performance - by Airline and Aircraft. Period From : 01/03/2009 To: 31/03/2009. Wednesday, April 1, 2009 V1.4.1.
 Abs Jets A.S. Learjet (L23/L24/L25/28/L29) Aer Lingus Plc Airbus A320 0 0 1 100 292 96 0 0 Aeroflot-Russian s Jsc Airbus A321 0 0 0 0 310 93 0 0 Airbus A330-300 Airbus A319 0 0 0 0 16 63 0 0 Airbus A320
Mergers, Alliances and Consolidation- A Path to Sustainability?
 DAY 1: WEDNESDAY 18 APRIL 2012 Strategies and Tools for Mergers, Alliances and Consolidation- A Path to Sustainability? Captain Don Wykoff President International Federation of Air Line Pilots Associations
ACI-NA 19th ANNUAL CONFERENCE EXHIBITION
 ACI-NA 19th ANNUAL CONFERENCE EXHIBITION Air Service Reality Check Ed Faberman Air Carrier Association of America September 28, 2010 GOOD TO BE IN PITTSBURGH!!! 2 Airline Industry Challenges Future of
trends bulletin 07/2011 Main airlines traffic 1 s quarter 2011 Main low cost airlines
 www.enac.fr Main airlines traffic 1 s quarter 2011 Airlines RPK* (millions) 2010** 10/09 (%) DELTA AIR LINES 310 900 2,2 1,3 UNITED / CONTINENTAL (1) 226 700-12,2-2,8 AMERICAN AL 201 900 2,5 1,6 AIR FRANCE-KLM
CHAPTER 2 Aviation Activity Forecasts
 CHAPTER 2 Aviation Activity Forecasts 2.1 Introduction 14 CFR Part 150 requires that noise exposure maps (NEMs) be prepared for two scenarios existing conditions and conditions 5 years into the future.
01/2016. Main airlines traffic 2015 (1) RPK* (millions) /14 (% ) 1st quarter 16/15 (% ) Airlines
 RPK* (millions) /14 (% ) 1st quarter 16/15 (% ) Airlines") Main airlines traffic (1) Airlines RPK* (millions) AMERICAN AL GROUP 321 000 3,6 3,1 DELTA AIR LINES 303 100 4,0 3,2 UNITED HOLDING 295 500 2,6 0,5 EMIRATES AL 251 200 8,8 nd AIR FRANCE/KLM 235 700 2,8
Main airlines traffic (1) Airlines RPK* (millions) AMERICAN AL GROUP 321 000 3,6 3,1 DELTA AIR LINES 303 100 4,0 3,2 UNITED HOLDING 295 500 2,6 0,5 EMIRATES AL 251 200 8,8 nd AIR FRANCE/KLM 235 700 2,8
Miami-Dade Aviation Department Aviation Statistics Flight Ops - All Airlines Facility: MIA Units: Flight Operations. Tuesday, December 11, 2018
 50,946 53,422 40,332 37,789 182,489 0.60 American Airlines Inc 181,392 51,073 53,402 39,639 37,278 21,657 24,554 6,780 3,758 56,749 6.75 Envoy Air Inc 53,160 19,786 22,807 6,837 3,730 11,093 13,991 3,698
trends bulletin 07/2014 Actual and planned fleet* (April 2014) * Source : FG-Flightglobal / ENAC Air Transport Data
 * Source : FG-Flightglobal / ENAC Air Transport Data") 0/0 Actual and planned fleet* (April 0) AEROFLOT RUSSIAN AL AIR CANADA AIR CHINA AIR FRANCE Airbus A00 Airbus A000 Airbus A00 Airbus A000 Airbus A000 Airbus A000 Boeing 00 0 Boeing 00 0 Boeing 00 Boeing
0/0 Actual and planned fleet* (April 0) AEROFLOT RUSSIAN AL AIR CANADA AIR CHINA AIR FRANCE Airbus A00 Airbus A000 Airbus A00 Airbus A000 Airbus A000 Airbus A000 Boeing 00 0 Boeing 00 0 Boeing 00 Boeing
EVOLUTION OF ALLOCATED SLOTS AT THE START OF SEASON (SOS)... 2 TOTAL SLOTS BY OPERATOR TOP SLOTS DISTRIBUTION PER ALLIANCE...
... 2 TOTAL SLOTS BY OPERATOR TOP SLOTS DISTRIBUTION PER ALLIANCE...") Paris - Charles de Gaulle Airport CDG/LFPG Winter 2017 - Start Of Season Report Report data extraction date: 30 October 2017 Table of contents EVOLUTION OF ALLOCATED SLOTS AT THE START OF SEASON (SOS)...
Paris - Charles de Gaulle Airport CDG/LFPG Winter 2017 - Start Of Season Report Report data extraction date: 30 October 2017 Table of contents EVOLUTION OF ALLOCATED SLOTS AT THE START OF SEASON (SOS)...
Miami-Dade Aviation Department Aviation Statistics Flight Ops - All Airlines Facility: MIA Units: Flight Operations. Friday, December 28, 2018
 51,124 53,607 40,295 37,729 182,755 0.87 American Airlines Inc 181,179 50,824 53,173 39,776 37,406 21,401 24,296 6,787 3,767 56,251 4.16 Envoy Air Inc 54,002 20,245 23,243 6,798 3,716 10,978 13,972 3,744
Miami-Dade Aviation Department Aviation Statistics Flight Ops - All Airlines Facility: MIA Units: Flight Operations. Wednesday, January 23, 2019
 51,338 53,806 40,322 37,775 183,241 1.61 American Airlines Inc 180,331 50,557 52,914 39,628 37,232 21,274 24,183 6,752 3,735 55,944 1.84 Envoy Air Inc 54,934 20,745 23,694 6,774 3,721 10,931 13,914 3,698
MONTHLY AIRPORT TRAFFIC REPORT November 2013
 MONTHLY AIRPORT TRAFFIC REPORT AIRCRAFT OPERATIONS 2013 2012 Change Domestic Air Carrier 52,937 54,739-3.29% Air Taxi 13,964 13,566 2.93% General Aviation 504 515-2.14% Military 25 28-10.71% Subtotal 67,430
Miami-Dade Aviation Department Aviation Statistics Flight Ops - All Airlines Facility: MIA Units: Flight Operations. Wednesday, February 28,
 17,034 17,868 13,465 12,598 60,965-0.92 American Airlines Inc 61,533 17,495 18,251 13,281 12,506 7,601 8,548 2,275 1,271 19,695 21.51 Envoy Air Inc 16,209 5,735 6,764 2,394 1,316 4,504 5,579 1,440 353
MONTHLY AIRPORT TRAFFIC REPORT September 2016
 MONTHLY AIRPORT TRAFFIC REPORT AIRCRAFT OPERATIONS 2016 2015 Change Domestic Air Carrier 59,030 59,038-0.01% Air Taxi 7,779 7,201 8.03% General Aviation 704 571 23.29% Military 21 12 75.00% Subtotal 67,534
ANA Fact Book All Nippon Airways Co., Ltd. Contents
 All Nippon Airways Co., Ltd. Contents 2 Domestic Passenger Market 4 International Passenger Market 5 Cargo Market 6 Haneda and Narita Airports 7 Global Alliance Statistics 8 Aircraft Specifications 9 Consolidated
Punctuality for june 2018 per airline
 Punctuality for june 2018 per airline Departures scheduled *) Delayed more than 15 minutes. **) s having less than 10 operations. Planned Cancelled Delayed *) Punctuality Avg. delay (min) Adria Airways
trends bulletin
 www.enac.fr Main airlines traffic 1 st quarter 2013 Airlines RPK* (millions) 12/11 (%) UNITED HOLDING 288 680-1,3-1,6 DELTA AIR LINES 271 808 0,7 1,7 AIR FRANCE - KLM 223 887 3,1 0,8 AMERICAN AL 203 299-0,1
MONTHLY AIRPORT TRAFFIC REPORT. April 2014
 MONTHLY AIRPORT TRAFFIC REPORT AIRCRAFT OPERATIONS 2014 2013 Change Domestic Air Carrier 55,529 55,119 0.74% Air Taxi 11,149 15,077-26.05% General Aviation 639 723-11.62% Military 13 14-7.14% Subtotal
Miami-Dade Aviation Department Aviation Statistics Flight Ops - All Airlines Facility: MIA Units: Flight Operations
 38,439 40,280 30,403 28,506 137,628-0.58 American Airlines Inc 138,425 39,112 40,846 30,101 28,366 16,268 18,488 5,123 2,803 42,682 10.30 Envoy Air Inc 38,697 14,122 16,408 5,265 2,902 9,491 11,910 3,096
MONTHLY AIRPORT TRAFFIC REPORT May 2015
 MONTHLY AIRPORT TRAFFIC REPORT AIRCRAFT OPERATIONS 2015 2014 Change Domestic Air Carrier 60,427 57,339 5.39% Air Taxi 7,825 10,967-28.65% General Aviation 547 635-13.86% Military 135 27 400.00% Subtotal
MONTHLY AIRPORT TRAFFIC REPORT July 2016
 MONTHLY AIRPORT TRAFFIC REPORT AIRCRAFT OPERATIONS 2016 2015 Change Domestic Air Carrier 63,680 62,789 1.42% Air Taxi 7,548 8,007-5.73% General Aviation 717 558 28.49% Military 11 146-92.47% Subtotal 71,956
MONTHLY AIRPORT TRAFFIC REPORT June 2017
 MONTHLY AIRPORT TRAFFIC REPORT AIRCRAFT OPERATIONS 2017 2016 Change Domestic Air Carrier 61,445 62,662-1.94% Air Taxi 8,267 7,656 7.98% General Aviation 644 685-5.99% Military 8 18-55.56% Subtotal 70,364
MONTHLY AIRPORT TRAFFIC REPORT July 2017
 MONTHLY AIRPORT TRAFFIC REPORT AIRCRAFT OPERATIONS 2017 2016 Change Domestic Air Carrier 63,535 63,680-0.23% Air Taxi 7,291 7,548-3.40% General Aviation 630 717-12.13% Military 15 11 36.36% Subtotal 71,471
trends bulletin
 www.enac.fr Main airlines traffic 1 st quarter 2012 Airlines RPK* (millions) 11/10 (%) 12/11 (%) DELTA AIR LINES 310 228-0,2 1,0 UNITED HOLDING 292 520-1,7 0,1 AIR FRANCE - KLM 214 956 6,9 7,2 AMERICAN
Results of Airline Survey on Cargo Messaging
 IATA Cargo Messaging Survey 1 INTERNATIONAL AIR TRANSPORT ASSOCIATION 2011 Cargo Business Process Panel INTERNATIONAL AIR TRANSPORT ASSOCIATION 2010 Results of Airline Survey on Cargo Messaging September
MONTHLY AIRPORT TRAFFIC REPORT February 2014
 MONTHLY AIRPORT TRAFFIC REPORT AIRCRAFT OPERATIONS 2014 2013 Change Domestic Air Carrier 44,741 48,627-7.99% Air Taxi 11,144 13,003-14.30% General Aviation 569 543 4.79% Military 17 15 13.33% Subtotal
Punctuality for september 2018 per airline
 for september 2018 per airline Departures scheduled Adria Airways 31 29 2 94% 12 61% 57 Aegean s S.A. Aeroflot Russian s 24 24 0 100% 6 75% 28 60 60 0 100% 2 97% 24 Air Baltic 90 90 0 100% 6 93% 25 Air
MONTHLY AIRPORT TRAFFIC REPORT March 2017
 MONTHLY AIRPORT TRAFFIC REPORT AIRCRAFT OPERATIONS 2017 2016 Change Domestic Air Carrier 60,360 61,951-2.57% Air Taxi 8,591 8,270 3.88% General Aviation 717 615 16.59% Military 14 27-48.15% Subtotal 69,682
MONTHLY AIRPORT TRAFFIC REPORT December 2017
 MONTHLY AIRPORT TRAFFIC REPORT AIRCRAFT OPERATIONS 2017 2016 Change Domestic Air Carrier 55,828 57,943-3.65% Air Taxi 6,810 7,642-10.89% General Aviation 565 569-0.70% Military 25 32-21.88% Subtotal 63,228
EVOLUTION OF ALLOCATED SLOTS AT THE START OF SEASON (SOS)... 2 TOTAL SLOTS BY OPERATOR TOP SLOTS DISTRIBUTION PER ALLIANCE...
... 2 TOTAL SLOTS BY OPERATOR TOP SLOTS DISTRIBUTION PER ALLIANCE...") Paris - Charles de Gaulle Airport CDG/LFPG Summer 2018 - Start Of Season Report Report data extraction date: 26 March 2018 Table of contents EVOLUTION OF ALLOCATED SLOTS AT THE START OF SEASON (SOS)...
Paris - Charles de Gaulle Airport CDG/LFPG Summer 2018 - Start Of Season Report Report data extraction date: 26 March 2018 Table of contents EVOLUTION OF ALLOCATED SLOTS AT THE START OF SEASON (SOS)...
MONTHLY AIRPORT TRAFFIC REPORT April 2017
 MONTHLY AIRPORT TRAFFIC REPORT AIRCRAFT OPERATIONS 2017 2016 Change Domestic Air Carrier 56,570 60,697-6.80% Air Taxi 7,771 7,806-0.45% General Aviation 833 699 19.17% Military 23 14 64.29% Subtotal 65,197
MONTHLY AIRPORT TRAFFIC REPORT February 2018
 MONTHLY AIRPORT TRAFFIC REPORT AIRCRAFT OPERATIONS 2018 2017 Change Domestic Air Carrier 51,809 51,854-0.09% Air Taxi 6,659 6,988-4.71% General Aviation 651 540 20.56% Military 6 9-33.33% Subtotal 59,125
Punctuality for july 2018 per airline
 Punctuality for july 2018 per airline Departures scheduled *) Delayed more than 15 minutes. **) having less than 10 operations. Planned Cancelled Delayed *) Punctuality Avg. delay (min) Adria Airways 31
MONTHLY AIRPORT TRAFFIC REPORT December 2018
 MONTHLY AIRPORT TRAFFIC REPORT AIRCRAFT OPERATIONS 2018 2017 Change Domestic Air Carrier 58,905 55,828 5.51% Air Taxi 6,948 6,810 2.03% General Aviation 499 565-11.68% Military 24 25-4.00% Subtotal 66,376
Punctuality for may 2018 per airline
 for may 2018 per airline Departures scheduled **) having less than 10 operations. Adria Airways 33 28 5 85% 9 73% 49 Aegean S.A. Aeroflot Russian 23 23 0 100% 5 78% 25 66 63 3 95% 10 85% 53 Air Baltic
MONTHLY AIRPORT TRAFFIC REPORT August 2018
 MONTHLY AIRPORT TRAFFIC REPORT AIRCRAFT OPERATIONS 2018 2017 Change Domestic Air Carrier 65,465 63,201 3.58% Air Taxi 7,607 7,533 0.98% General Aviation 594 609-2.46% Military 15 3 400.00% Subtotal 73,681
MONTHLY AIRPORT TRAFFIC REPORT July 2018-(Revised)
") MONTHLY AIRPORT TRAFFIC REPORT AIRCRAFT OPERATIONS 2018 2017 Change Domestic Air Carrier 64,066 63,535 0.84% Air Taxi 7,468 7,291 2.43% General Aviation 550 630-12.70% Military 5 15-66.67% Subtotal 72,089
MONTHLY AIRPORT TRAFFIC REPORT AIRCRAFT OPERATIONS 2018 2017 Change Domestic Air Carrier 64,066 63,535 0.84% Air Taxi 7,468 7,291 2.43% General Aviation 550 630-12.70% Military 5 15-66.67% Subtotal 72,089
MONTHLY AIRPORT TRAFFIC REPORT September 2018
 MONTHLY AIRPORT TRAFFIC REPORT AIRCRAFT OPERATIONS 2018 2017 Change Domestic Air Carrier 58,763 55,902 5.12% Air Taxi 6,537 6,689-2.27% General Aviation 605 658-8.05% Military 14 17-17.65% Subtotal 65,919
MONTHLY AIRPORT TRAFFIC REPORT April 2018
 MONTHLY AIRPORT TRAFFIC REPORT AIRCRAFT OPERATIONS 2018 2017 Change Domestic Air Carrier 60,928 56,570 7.70% Air Taxi 6,995 7,771-9.99% General Aviation 654 833-21.49% Military 9 23-60.87% Subtotal 68,586
Air Cargo Settlement 5 c/o Garden City Group, LLC P.O. Box Dublin, OH USA CLAIM FORM GENERAL INSTRUCTIONS
 Must be Postmarked No Later Than September 9, 2016 Air Cargo Settlement 5 c/o Garden City Group, LLC P.O. Box 10083 Dublin, OH 43017-6683 USA AR5 *P-AR5-POC/1* Claim Number: Control Number: CLAIM FORM
Punctuality for march 2014 per airline
 for march 2014 per airline Departures scheduled **) having less than 10 operations. Aer Lingus 30 30 0 100% 2 93% 68 Aeroflot Russian 63 62 1 98% 1 98% 19 Air Baltic 73 72 1 99% 1 99% 19 Air Berlin 167
welcome TRAVEL GUIDE HRL LABORATORIES 3011 Malibu Canyon Rd Malibu, CA
 welcome IN 2019 1 NEW P lease bring a current government-issued photo id with you when you visit HRL. 3011 Malibu Canyon Rd 310.317.5000 www.hrl.com 5 HRL LABORATORIES TRAVEL GUIDE Acceptable Documentation
MONTHLY AIRPORT TRAFFIC REPORT January 2018
 MONTHLY AIRPORT TRAFFIC REPORT AIRCRAFT OPERATIONS 2018 2017 Change Domestic Air Carrier 55,461 55,980-0.93% Air Taxi 7,166 7,330-2.24% General Aviation 690 625 10.40% Military 6 11-45.45% Subtotal 63,323
Malaysia s s 2020 Vision
 Kuala Lumpur International Airport: The New Southeast Asia Airline Hub? Lev Pinelis, M.S. Transportation December 7 th, 2004 1.231 Airport Systems Planning, Design, and Management Malaysia s s 2020 Vision
Punctuality for june 2014 per airline
 for june 2014 per airline Departures scheduled **) having less than 10 operations. Adria Airways 17 17 0 100% 4 76% 32 Aegean S.A. 12 12 0 100% 9 25% 39 Aer Lingus 30 30 0 100% 10 67% 34 Aeroflot Russian
atmosfair Airline Index 2011
 atmosfair Airline Index 2011 Copyright atmosfair, Berlin 2011 How is the Airline Index used? 1. Avoidance 2. Optimization 3. Compensation - Even efficient flights can quickly exceed a single person s climate
Punctuality for november 2018 per airline
 for november 2018 per airline Departures scheduled Aegean s S.A. Aeroflot Russian s 21 21 0 100% 4 81% 31 60 60 0 100% 5 92% 24 Air Baltic 86 86 0 100% 3 97% 58 Air Canada 14 14 0 100% 8 43% 49 Air China
HEATHROW AIRPORT LHR Summer 2014 (S14) Start of Season
 Start of Season") HEATHROW AIRPORT LHR Summer 214 (S14) Start of Season KEY STATISTICS Summer 214 vs Summer 213 Air Transport Movements Allocated 282,172.6% Passenger Air Transport Movements Allocated 28,726.6% Total Seats
HEATHROW AIRPORT LHR Summer 214 (S14) Start of Season KEY STATISTICS Summer 214 vs Summer 213 Air Transport Movements Allocated 282,172.6% Passenger Air Transport Movements Allocated 28,726.6% Total Seats
Miami-Dade Aviation Department Aviation Statistics Flight Ops - All Airlines Facility: MIA Units: Flight Operations
 38,855 39,530 26,999 26,191 131,575 3.82 American Airlines Inc 126,736 36,766 36,843 26,609 26,518 14,465 14,454 16 9 28,944-3.31 Generic Cash and GA 29,935 14,618 14,792 357 168 Account 6,552 6,742 7,502
Punctuality for april 2018 per airline
 for april 2018 per airline Departures scheduled **) having less than 10 operations. Adria Airways 29 29 0 100% 10 66% 47 Aegean S.A. Aeroflot Russian 16 16 0 100% 0 100% 0 60 60 0 100% 2 97% 24 Air Baltic
Punctuality for may 2014 per airline
 for may 2014 per airline Departures scheduled **) having less than 10 operations. Adria Airways 18 18 0 100% 3 83% 118 Aer Lingus 30 30 0 100% 7 77% 36 Aeroflot Russian 62 62 0 100% 4 94% 58 Air Baltic
I am writing in respect of your recent request of 5 February 2018, for the release of information held by the Civil Aviation Authority (CAA).
.") Communications Department External Information Services 5 March 2018 Reference: F0003589 Dear I am writing in respect of your recent request of 5 February 2018, for the release of information held by the
Communications Department External Information Services 5 March 2018 Reference: F0003589 Dear I am writing in respect of your recent request of 5 February 2018, for the release of information held by the
Punctuality for september 2013 per airline
 for september 2013 per airline Departures scheduled Adria Airways 17 17 0 100% 3 82% 20 Aer Lingus 26 26 0 100% 4 85% 22 Aeroflot Russian s 60 60 0 100% 9 85% 29 Air Baltic 85 84 1 99% 9 89% 32 Air Berlin
TAIPEI, Taiwan EVA Air joins the Star Alliance network, further strengthening the Alliance s presence in Asia-Pacific.
 Wider choice in growing Cross-Straits market TAIPEI, Taiwan EVA Air joins the Star Alliance network, further strengthening the Alliance s presence in Asia-Pacific. At the official joining ceremony held
SALES PRESENTATION. Katherine Thornton. Consolidated Travel Airline Training. Account Manager Etihad Airways
 SALES PRESENTATION Consolidated Travel Airline Training Katherine Thornton Account Manager Etihad Airways QUICK FACTS ABOUT US Established by Government Decree in July 2003 National airline of the United
Punctuality for july 2015 per airline
 for july 2015 per airline Departures scheduled **) having less than 10 operations. Acd/Ad Hoc 10 0 10 0% 0 100% 0 Adria Airways 18 18 0 100% 5 72% 25 Aegean S.A. 27 27 0 100% 12 56% 30 Aer Lingus 34 31
Punctuality for june 2015 per airline
 for june 2015 per airline Departures scheduled Adria Airways 16 16 0 100% 6 63% 28 Aegean s S.A. 23 23 0 100% 3 87% 24 Aer Lingus 30 30 0 100% 13 57% 45 Aeroflot Russian s 60 60 0 100% 10 83% 43 Air Baltic
Punctuality for october 2017 per airline
 for october 2017 per airline Departures scheduled **) having less than 10 operations. Adria Airways 22 22 0 100% 5 77% 33 Aegean S.A. Aeroflot Russian 29 29 0 100% 7 76% 26 62 62 0 100% 9 85% 24 Air Baltic
Global Airline On-time Arrival Performance Report November 2014
 Global Arrival Performance Report November 2014 Copyright @ 2014 VariFlight.com 1 Contents > > Part I Major Arrival Performance Figure 3 Part II Major Arrival Data 6 Copyright @ 2014 VariFlight.com 2 Part
FLY AMERICA ACT WAIVER CHECKLIST
 FLY AMERICA ACT WAIVER CHECKLIST (To assist in determining qualification for a waiver of the restrictions of the Fly America Act under 41 CFR Part 301-10, check the applicable statement(s) below.) Use
2017 Airline Satisfaction Survey
 2017 Airline Survey 2 Table of Contents Part 1: Outline of This Report 3 1. Outline of the Survey 4 2. Profile of the Respondents 5 Gender /Age / Area of Residence /Occupation /Annual income 5 Purpose
Statistical Report Calendar Year 2013
 Statistical Report Year 213 Houston Airports P.O. Box 616 Houston, TX 7725-16 Request for User Input The intent of the monthly and annual statistical reports is to provide data that is both relevant and
Facts & Figures. Non-US Airline Traffic Aircraft Data. Aircraft Values. US Consumer Complaints February US Fuel Cost And Consumption
 Facts & Figures Aircraft Data Aircraft Values Aircraft E-190 CRJ900 RJ100 MTOW 105.4-114.2 80.5-84.5 97.5-101.5 Engine Types CF34-10E5 92; CF34-10E5A1 87; CF34-10E6 99; CF34-10E6A1 28; CF34-10E7 10 CF34-8C5
The 20 year history of global airline alliances Flight Global Graham Dunn 5 may, 2017
 The 20 year history of global airline alliances Flight Global Graham Dunn 5 may, 2017 Since the first global alliance was established 20 years ago, these airline groupings have become a central part of
Turkish Cargo Announces the Opening of its New Cargo Terminal
 2015 Istanbul, February 5 th Turkish Cargo Announces the Opening of its New Cargo Terminal As Turkish Airlines has grown over the past decade, Turkish Cargo has seen similar expansion. Not only has its
Impacts of Global Alliance and New Large Aircraft on Airlines and Competition and Traffic Flow Patterns. Tae Hoon OUM
 Impacts of Global Alliance and New Large Aircraft on Airlines and Competition and Traffic Flow Patterns presented at the ICAO-IATA Joint Conference on Liberalization of Air Transport in Asia/Pacific (25-27
Punctuality for february 2018 per airline
 for february 2018 per airline Departures scheduled **) having less than 10 operations. Adria Airways 20 19 1 95% 0 100% 0 Aegean S.A. Aeroflot Russian 12 12 0 100% 4 67% 21 57 56 1 98% 8 86% 49 Air Baltic
I am writing in respect of your recent request of 10 January 2018, for the release of information held by the Civil Aviation Authority (CAA).
.") Communications Department External Information Services 7 February 2018 Reference: F0003557 Dear I am writing in respect of your recent request of 10 January 2018, for the release of information held by
Communications Department External Information Services 7 February 2018 Reference: F0003557 Dear I am writing in respect of your recent request of 10 January 2018, for the release of information held by
Fly Quiet Adherence Report 3rd Quarter 2008
 Fly Quiet Adherence Report 3rd Quarter 2008 Chicago O Hare International Airport Visit the Community Resource Center on the Internet at http://www.flychicago.com Departures 60% 50% Percentage of Use 40%
The post-doc years: Jan Nov in Nanjing, China (NKG)
") The post-doc years: Jan. 2009 Nov. 2010 in Nanjing, China (NKG) January 2009: DEN-EWR-DCA. An EL Al B744 with Newark s harbor in the background, a Continental B772, and a Continental B767 on approach with
The post-doc years: Jan. 2009 Nov. 2010 in Nanjing, China (NKG) January 2009: DEN-EWR-DCA. An EL Al B744 with Newark s harbor in the background, a Continental B772, and a Continental B767 on approach with
Global Airline Study 2015 On-Time Performance Benchmark & Analysis
 www.aviationexperts.aero Global Airline Study 2015 On-Time Performance Benchmark & Analysis The bad news is time flies. The good news is you re the pilot. Michael Altshuler (Motivational Speaker & Peak
FUEL SURCHARGE EX JAPAN
 FUL SURCHARG X JAPAN Updated: March 28, 2018 --- T --- 1) * : All regions or All regions except those listed 2) The FSC of below carriers is also applied for Minimum charge. AF,AY,K,KM,KL,LY,MK,VN: Minimum
3. Ceskoslovenske Airlines CSA Czechoslovakia 1969 / Scandinavian Airlines System SAS Demark-Norway-Sweden 1969 / 104
 LENTOYHTIÖT / AIR COMPANIES 1. AERO OY Finland 1955 /1 2. FINNAIR Finland 1963 / 210 3. Ceskoslovenske Airlines CSA Czechoslovakia 1969 / 4 4. Polish Airlines LOT Poland 1969 / 4 5. Scandinavian Airlines